SCZ - Brain Nucleus accumbens basal ganglia
sheng Qian
2021-2-6
Last updated: 2022-03-14
Checks: 5 2
Knit directory: cTWAS_analysis/
This reproducible R Markdown analysis was created with workflowr (version 1.7.0). The Checks tab describes the reproducibility checks that were applied when the results were created. The Past versions tab lists the development history.
The R Markdown is untracked by Git. To know which version of the R Markdown file created these results, you’ll want to first commit it to the Git repo. If you’re still working on the analysis, you can ignore this warning. When you’re finished, you can run wflow_publish to commit the R Markdown file and build the HTML.
Great job! The global environment was empty. Objects defined in the global environment can affect the analysis in your R Markdown file in unknown ways. For reproduciblity it’s best to always run the code in an empty environment.
The command set.seed(20211220) was run prior to running the code in the R Markdown file. Setting a seed ensures that any results that rely on randomness, e.g. subsampling or permutations, are reproducible.
Great job! Recording the operating system, R version, and package versions is critical for reproducibility.
Nice! There were no cached chunks for this analysis, so you can be confident that you successfully produced the results during this run.
Using absolute paths to the files within your workflowr project makes it difficult for you and others to run your code on a different machine. Change the absolute path(s) below to the suggested relative path(s) to make your code more reproducible.
| absolute | relative |
|---|---|
| /project2/xinhe/shengqian/cTWAS/cTWAS_analysis/data/ | data |
| /project2/xinhe/shengqian/cTWAS/cTWAS_analysis/code/ctwas_config.R | code/ctwas_config.R |
Great! You are using Git for version control. Tracking code development and connecting the code version to the results is critical for reproducibility.
The results in this page were generated with repository version 4c71b11. See the Past versions tab to see a history of the changes made to the R Markdown and HTML files.
Note that you need to be careful to ensure that all relevant files for the analysis have been committed to Git prior to generating the results (you can use wflow_publish or wflow_git_commit). workflowr only checks the R Markdown file, but you know if there are other scripts or data files that it depends on. Below is the status of the Git repository when the results were generated:
Ignored files:
    Ignored:    .ipynb_checkpoints/
    Ignored:    data/AF/

Untracked files:
    Untracked:  Rplot.png
    Untracked:  analysis/.ipynb_checkpoints/
    Untracked:  analysis/SCZ_2014_EUR_Brain_Amygdala.Rmd
    Untracked:  analysis/SCZ_2014_EUR_Brain_Anterior_cingulate_cortex_BA24.Rmd
    Untracked:  analysis/SCZ_2014_EUR_Brain_Caudate_basal_ganglia.Rmd
    Untracked:  analysis/SCZ_2014_EUR_Brain_Cerebellar_Hemisphere.Rmd
    Untracked:  analysis/SCZ_2014_EUR_Brain_Cerebellum.Rmd
    Untracked:  analysis/SCZ_2014_EUR_Brain_Cortex.Rmd
    Untracked:  analysis/SCZ_2014_EUR_Brain_Frontal_Cortex_BA9.Rmd
    Untracked:  analysis/SCZ_2014_EUR_Brain_Hippocampus.Rmd
    Untracked:  analysis/SCZ_2014_EUR_Brain_Hypothalamus.Rmd
    Untracked:  analysis/SCZ_2014_EUR_Brain_Nucleus_accumbens_basal_ganglia.Rmd
    Untracked:  analysis/SCZ_2014_EUR_Brain_Putamen_basal_ganglia.Rmd
    Untracked:  analysis/SCZ_2014_EUR_Brain_Spinal_cord_cervical_c-1.Rmd
    Untracked:  analysis/SCZ_2014_EUR_Brain_Substantia_nigra.Rmd
    Untracked:  analysis/SCZ_2020_Brain_Cortex.Rmd
    Untracked:  analysis/SCZ_2020_Brain_Frontal_Cortex_BA9.Rmd
    Untracked:  analysis/SCZ_2020_Brain_Hypothalamus.Rmd
    Untracked:  analysis/SCZ_2020_Brain_Putamen_basal_ganglia.Rmd
    Untracked:  analysis/SCZ_Cross_Tissue_Analysis.Rmd
    Untracked:  code/.ipynb_checkpoints/
    Untracked:  code/AF_out/
    Untracked:  code/Autism_out/
    Untracked:  code/BMI_S_out/
    Untracked:  code/BMI_out/
    Untracked:  code/Glucose_out/
    Untracked:  code/LDL_S_out/
    Untracked:  code/SCZ_2014_EUR_out/
    Untracked:  code/SCZ_2020_out/
    Untracked:  code/SCZ_S_out/
    Untracked:  code/SCZ_out/
    Untracked:  code/T2D_out/
    Untracked:  code/ctwas_config.R
    Untracked:  code/mapping.R
    Untracked:  code/out/
    Untracked:  code/run_AF_analysis.sbatch
    Untracked:  code/run_AF_analysis.sh
    Untracked:  code/run_AF_ctwas_rss_LDR.R
    Untracked:  code/run_Autism_analysis.sbatch
    Untracked:  code/run_Autism_analysis.sh
    Untracked:  code/run_Autism_ctwas_rss_LDR.R
    Untracked:  code/run_BMI_analysis.sbatch
    Untracked:  code/run_BMI_analysis.sh
    Untracked:  code/run_BMI_analysis_S.sbatch
    Untracked:  code/run_BMI_analysis_S.sh
    Untracked:  code/run_BMI_ctwas_rss_LDR.R
    Untracked:  code/run_BMI_ctwas_rss_LDR_S.R
    Untracked:  code/run_Glucose_analysis.sbatch
    Untracked:  code/run_Glucose_analysis.sh
    Untracked:  code/run_Glucose_ctwas_rss_LDR.R
    Untracked:  code/run_LDL_analysis_S.sbatch
    Untracked:  code/run_LDL_analysis_S.sh
    Untracked:  code/run_LDL_ctwas_rss_LDR_S.R
    Untracked:  code/run_SCZ_2014_EUR_analysis.sbatch
    Untracked:  code/run_SCZ_2014_EUR_analysis.sh
    Untracked:  code/run_SCZ_2014_EUR_ctwas_rss_LDR.R
    Untracked:  code/run_SCZ_2020_analysis.sbatch
    Untracked:  code/run_SCZ_2020_analysis.sh
    Untracked:  code/run_SCZ_2020_ctwas_rss_LDR.R
    Untracked:  code/run_SCZ_analysis.sbatch
    Untracked:  code/run_SCZ_analysis.sh
    Untracked:  code/run_SCZ_analysis_S.sbatch
    Untracked:  code/run_SCZ_analysis_S.sh
    Untracked:  code/run_SCZ_ctwas_rss_LDR.R
    Untracked:  code/run_SCZ_ctwas_rss_LDR_S.R
    Untracked:  code/run_T2D_analysis.sbatch
    Untracked:  code/run_T2D_analysis.sh
    Untracked:  code/run_T2D_ctwas_rss_LDR.R
    Untracked:  code/wflow_build.R
    Untracked:  code/wflow_build.sbatch
    Untracked:  data/.ipynb_checkpoints/
    Untracked:  data/BMI/
    Untracked:  data/PGC3_SCZ_wave3_public.v2.tsv
    Untracked:  data/SCZ/
    Untracked:  data/SCZ_2014_EUR/
    Untracked:  data/SCZ_2020/
    Untracked:  data/SCZ_S/
    Untracked:  data/T2D/
    Untracked:  data/UKBB/
    Untracked:  data/UKBB_SNPs_Info.text
    Untracked:  data/gene_OMIM.txt
    Untracked:  data/gene_pip_0.8.txt
    Untracked:  data/mashr_Heart_Atrial_Appendage.db
    Untracked:  data/mashr_sqtl/
    Untracked:  data/summary_known_genes_annotations.xlsx
    Untracked:  data/untitled.txt

Unstaged changes:
    Modified:   analysis/SCZ_Brain_Amygdala.Rmd
    Modified:   analysis/SCZ_Brain_Anterior_cingulate_cortex_BA24.Rmd
    Modified:   analysis/SCZ_Brain_Caudate_basal_ganglia.Rmd
    Modified:   analysis/SCZ_Brain_Cerebellar_Hemisphere.Rmd
    Modified:   analysis/SCZ_Brain_Cerebellum.Rmd
    Modified:   analysis/SCZ_Brain_Cortex.Rmd
    Modified:   analysis/SCZ_Brain_Frontal_Cortex_BA9.Rmd
    Modified:   analysis/SCZ_Brain_Hippocampus.Rmd
    Modified:   analysis/SCZ_Brain_Hypothalamus.Rmd
    Modified:   analysis/SCZ_Brain_Nucleus_accumbens_basal_ganglia.Rmd
    Modified:   analysis/SCZ_Brain_Putamen_basal_ganglia.Rmd
    Modified:   analysis/SCZ_Brain_Spinal_cord_cervical_c-1.Rmd
    Modified:   analysis/SCZ_Brain_Substantia_nigra.Rmd
Note that any generated files, e.g. HTML, png, CSS, etc., are not included in this status report because it is ok for generated content to have uncommitted changes.
There are no past versions. Publish this analysis with wflow_publish() to start tracking its development.
Weight QC
#number of imputed weights
nrow(qclist_all)
[1] 11167#number of imputed weights by chromosome
table(qclist_all$chr)
   1    2    3    4    5    6    7    8    9   10   11   12   13   14   15   16
1097  789  659  431  555  642  549  417  406  435  664  627  214  368  359  510
  17   18   19   20   21   22
 657  174  863  343  131  277
#number of imputed weights without missing variants
sum(qclist_all$nmiss==0)[1] 8459#proportion of imputed weights without missing variants
mean(qclist_all$nmiss==0)[1] 0.7575Check convergence of parameters
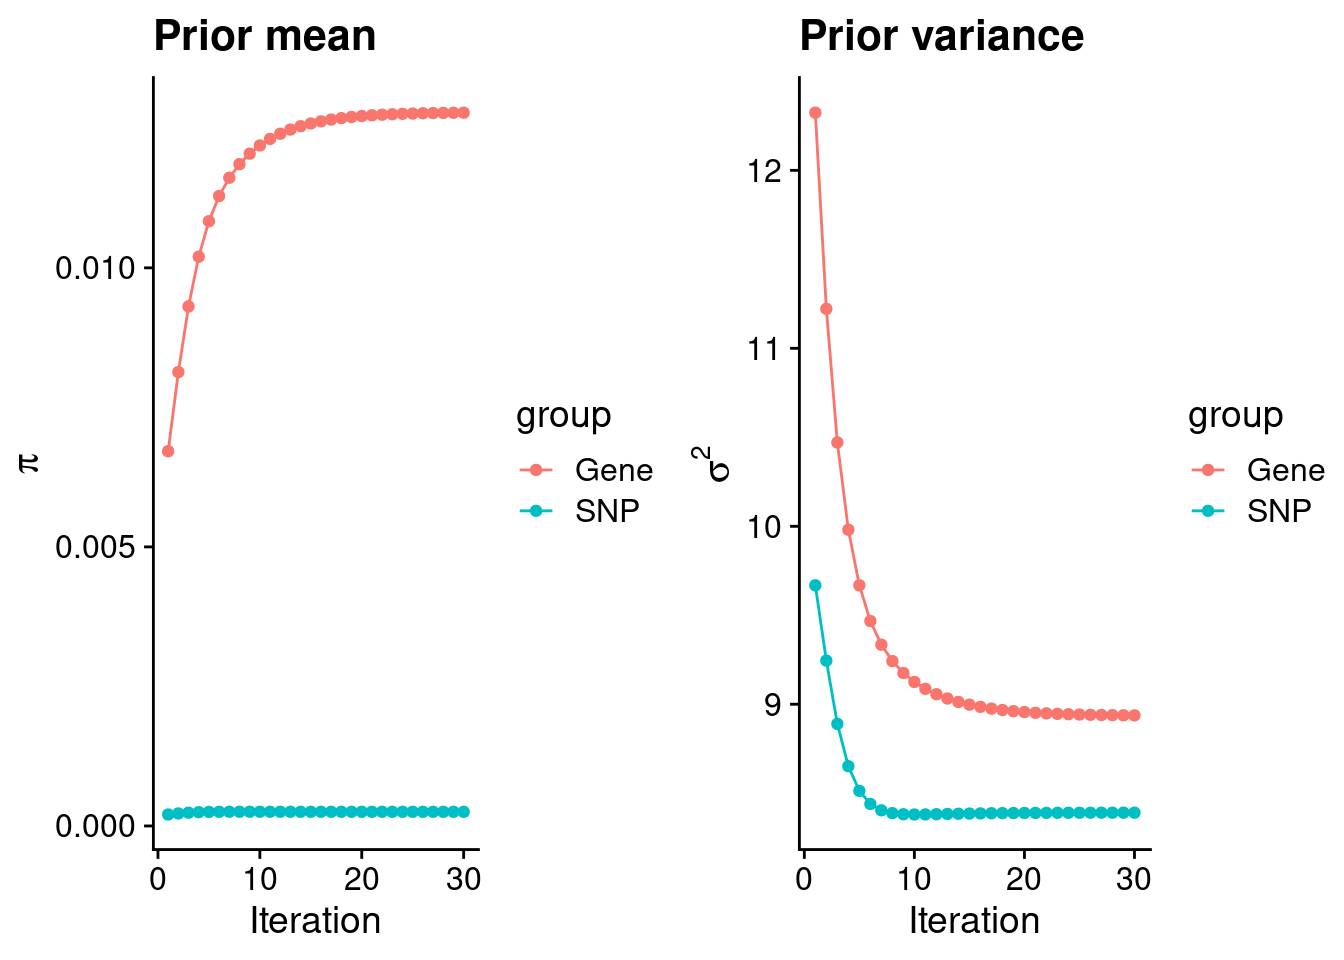
#estimated group prior
estimated_group_prior <- group_prior_rec[,ncol(group_prior_rec)]
names(estimated_group_prior) <- c("gene", "snp")
estimated_group_prior["snp"] <- estimated_group_prior["snp"]*thin #adjust parameter to account for thin argument
print(estimated_group_prior)
gene snp
0.0127798 0.0002541 #estimated group prior variance
estimated_group_prior_var <- group_prior_var_rec[,ncol(group_prior_var_rec)]
names(estimated_group_prior_var) <- c("gene", "snp")
print(estimated_group_prior_var) gene snp
8.937 8.391 #report sample size
print(sample_size)[1] 77096#report group size
group_size <- c(nrow(ctwas_gene_res), n_snps)
print(group_size)[1] 11167 7352670#estimated group PVE
estimated_group_pve <- estimated_group_prior_var*estimated_group_prior*group_size/sample_size #check PVE calculation
names(estimated_group_pve) <- c("gene", "snp")
print(estimated_group_pve) gene snp
0.01654 0.20332 #compare sum(PIP*mu2/sample_size) with above PVE calculation
c(sum(ctwas_gene_res$PVE),sum(ctwas_snp_res$PVE))[1] 0.08504 1.66945Genes with highest PIPs
          genename region_tag susie_pip    mu2       PVE      z num_eqtl
4131        SPECC1      17_16    0.9996 141.30 0.0018319  5.484        2
5491         FURIN      15_42    0.9813  44.70 0.0005689 -7.000        1
11067       ZNF823      19_10    0.9812  29.18 0.0003714  5.505        2
13453 RP11-230C9.4      6_102    0.9400  21.99 0.0002681 -4.569        2
3206        MAP7D1       1_22    0.9116  24.65 0.0002915  5.058        1
3067         SF3B1      2_117    0.8859  43.72 0.0005024  6.784        1
9374         COX8A      11_35    0.8727  25.22 0.0002854 -4.991        1
10921        PCBP2      12_33    0.8548  21.60 0.0002395  4.496        1
6796        VPS37A       8_18    0.8063  28.29 0.0002958 -5.357        1
107          ELAC2      17_11    0.7884  21.77 0.0002226  4.372        1
4719          SOX5      12_17    0.7868  21.05 0.0002148  4.024        1
2658         VPS29      12_67    0.7855  23.91 0.0002436 -4.896        2
6535         TADA1       1_82    0.7694  22.72 0.0002268 -4.177        2
9395        DIRAS1       19_3    0.7557  21.08 0.0002066 -4.359        1
11808        NPTXR      22_15    0.7465  21.06 0.0002039  4.106        2
10150        ACOT1      14_34    0.7355  22.32 0.0002130  4.167        2
13283    LINC01415      18_30    0.7340  26.96 0.0002567 -5.655        1
6304          DRD2      11_67    0.6852  31.74 0.0002821 -6.045        2
11929        HAR1A      20_37    0.6791  19.59 0.0001726  3.767        1
440        FAM120A       9_47    0.6742  22.84 0.0001998 -4.571        1
Genes with largest effect sizes
      genename region_tag susie_pip    mu2       PVE       z num_eqtl
6803     MMP16       8_63 0.000e+00 526.79 0.000e+00  3.6478        1
12325 HLA-DQA2       6_26 0.000e+00 347.26 0.000e+00 -0.4490        2
11434     HCG9       6_24 1.997e-10 216.03 5.595e-13 -3.3869        1
11395     MSH5       6_26 2.092e-13 203.29 5.515e-16  8.0439        2
11404     APOM       6_26 1.787e-09 197.10 4.568e-12  8.9450        1
12513      C4A       6_26 3.601e-11 188.79 8.819e-14  8.4450        1
11648    DDAH2       6_26 0.000e+00 182.44 0.000e+00  7.6610        1
11397   LY6G6C       6_26 0.000e+00 156.40 0.000e+00 -7.1790        3
11386    EHMT2       6_26 0.000e+00 152.77 0.000e+00  5.6967        1
10748 HLA-DRB1       6_26 0.000e+00 148.98 0.000e+00 -2.0086        1
2926      PCCB       3_84 0.000e+00 142.96 0.000e+00 -4.3613        1
11375    FKBPL       6_26 3.997e-15 142.53 7.389e-18 -4.6363        2
4131    SPECC1      17_16 9.996e-01 141.30 1.832e-03  5.4844        2
836    PPP2R3A       3_84 0.000e+00 129.68 0.000e+00  4.1188        1
11400   CSNK2B       6_26 1.110e-16 129.30 1.862e-19 -6.6421        1
11642    ATF6B       6_26 0.000e+00 115.50 0.000e+00  3.6260        1
2203      MPP6       7_21 3.245e-03 110.26 4.641e-06 -3.3024        1
11369   NOTCH4       6_26 0.000e+00  94.28 0.000e+00  5.9033        2
11389  C6orf48       6_26 0.000e+00  79.40 0.000e+00  4.1389        3
11370     PBX2       6_26 0.000e+00  78.44 0.000e+00 -0.7005        2
Genes with highest PVE
          genename region_tag susie_pip    mu2       PVE      z num_eqtl
4131        SPECC1      17_16    0.9996 141.30 0.0018319  5.484        2
5491         FURIN      15_42    0.9813  44.70 0.0005689 -7.000        1
3067         SF3B1      2_117    0.8859  43.72 0.0005024  6.784        1
11067       ZNF823      19_10    0.9812  29.18 0.0003714  5.505        2
2602           MDK      11_28    0.6546  37.36 0.0003173 -6.344        1
6796        VPS37A       8_18    0.8063  28.29 0.0002958 -5.357        1
3206        MAP7D1       1_22    0.9116  24.65 0.0002915  5.058        1
9374         COX8A      11_35    0.8727  25.22 0.0002854 -4.991        1
6304          DRD2      11_67    0.6852  31.74 0.0002821 -6.045        2
13453 RP11-230C9.4      6_102    0.9400  21.99 0.0002681 -4.569        2
13283    LINC01415      18_30    0.7340  26.96 0.0002567 -5.655        1
2658         VPS29      12_67    0.7855  23.91 0.0002436 -4.896        2
10921        PCBP2      12_33    0.8548  21.60 0.0002395  4.496        1
1571       CACNA1I      22_16    0.5280  33.45 0.0002291  5.956        1
6535         TADA1       1_82    0.7694  22.72 0.0002268 -4.177        2
107          ELAC2      17_11    0.7884  21.77 0.0002226  4.372        1
4719          SOX5      12_17    0.7868  21.05 0.0002148  4.024        1
6509        TMEM56       1_58    0.4556  36.13 0.0002135 -4.357        1
10150        ACOT1      14_34    0.7355  22.32 0.0002130  4.167        2
2025         FCGRT      19_34    0.5962  27.52 0.0002128  4.874        2
Genes with largest z scores
       genename region_tag susie_pip    mu2       PVE      z num_eqtl
10415    BTN3A2       6_20 2.464e-02  67.09 2.144e-05  9.168        3
11404      APOM       6_26 1.787e-09 197.10 4.568e-12  8.945        1
10915   ZSCAN26       6_22 1.060e-02  67.68 9.309e-06  8.718        2
12513       C4A       6_26 3.601e-11 188.79 8.819e-14  8.445        1
11395      MSH5       6_26 2.092e-13 203.29 5.515e-16  8.044        2
9788  HIST1H2BC       6_20 2.377e-02  50.70 1.563e-05 -7.978        1
6275      CNNM2      10_66 1.953e-01  39.06 9.893e-05 -7.876        1
12454   HLA-DMB       6_27 1.410e-01  54.44 9.957e-05 -7.686        2
11648     DDAH2       6_26 0.000e+00 182.44 0.000e+00  7.661        1
11397    LY6G6C       6_26 0.000e+00 156.40 0.000e+00 -7.179        3
5491      FURIN      15_42 9.813e-01  44.70 5.689e-04 -7.000        1
11418    CCHCR1       6_25 1.443e-02  35.34 6.613e-06 -6.927        2
3067      SF3B1      2_117 8.859e-01  43.72 5.024e-04  6.784        1
7442       TYW5      2_118 6.639e-02  38.37 3.304e-05 -6.753        2
11400    CSNK2B       6_26 1.110e-16 129.30 1.862e-19 -6.642        1
2602        MDK      11_28 6.546e-01  37.36 3.173e-04 -6.344        1
11136   ZKSCAN8       6_22 6.617e-03  40.01 3.434e-06  6.128        1
9771     HARBI1      11_28 1.660e-01  33.80 7.277e-05  6.084        1
11446    TRIM27       6_22 1.516e-02  70.98 1.396e-05  6.073        2
6304       DRD2      11_67 6.852e-01  31.74 2.821e-04 -6.045        2
Comparing z scores and PIPs
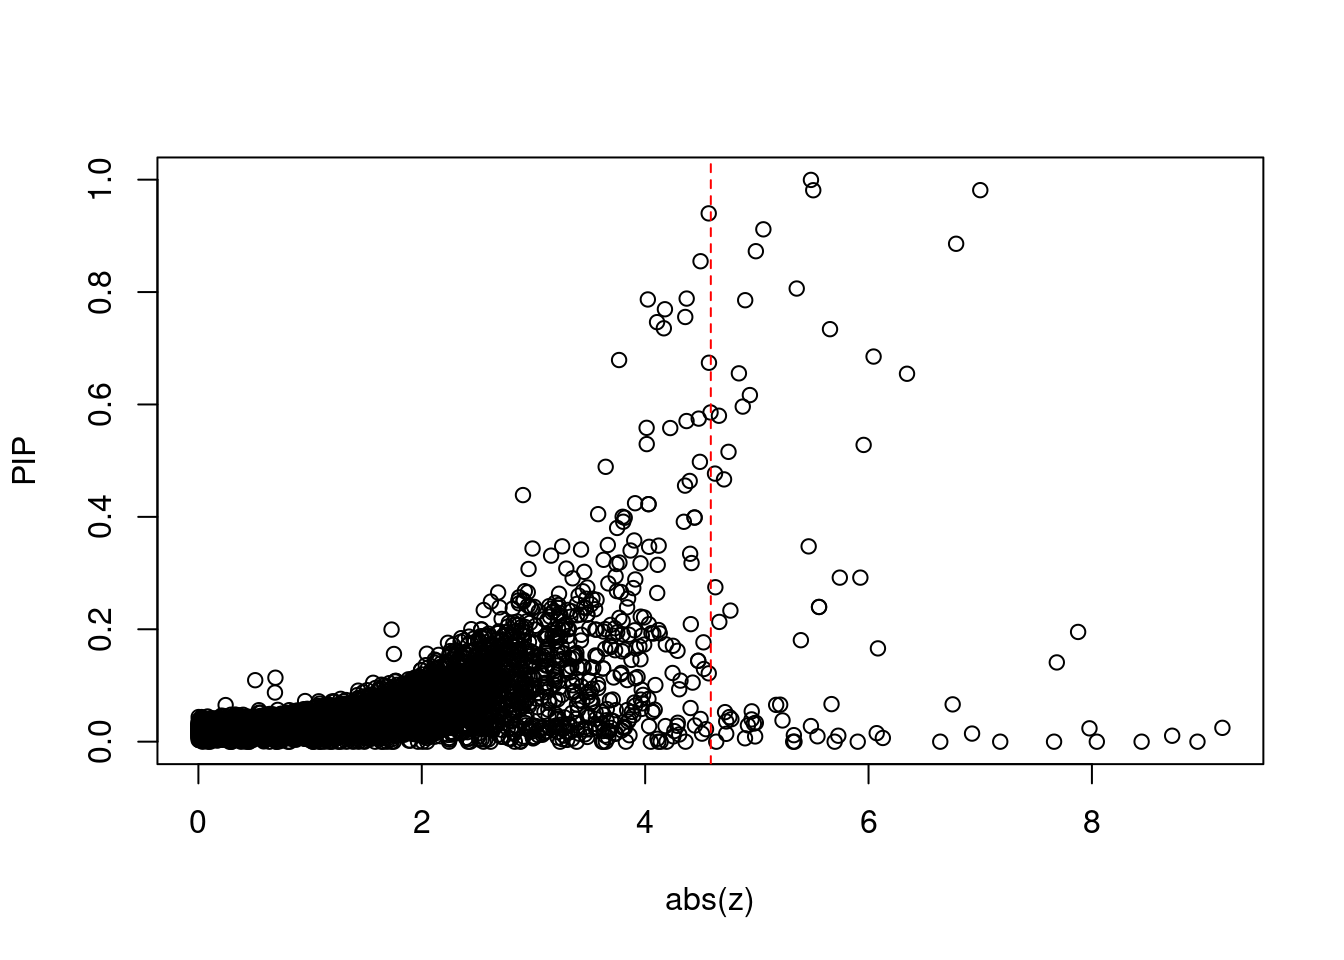
[1] 0.006179GO enrichment analysis for genes with PIP>0.5
#number of genes for gene set enrichment
length(genes)
[1] 33Uploading data to Enrichr... Done.
Querying GO_Biological_Process_2021... Done.
Querying GO_Cellular_Component_2021... Done.
Querying GO_Molecular_Function_2021... Done.
Parsing results... Done.
[1] "GO_Biological_Process_2021"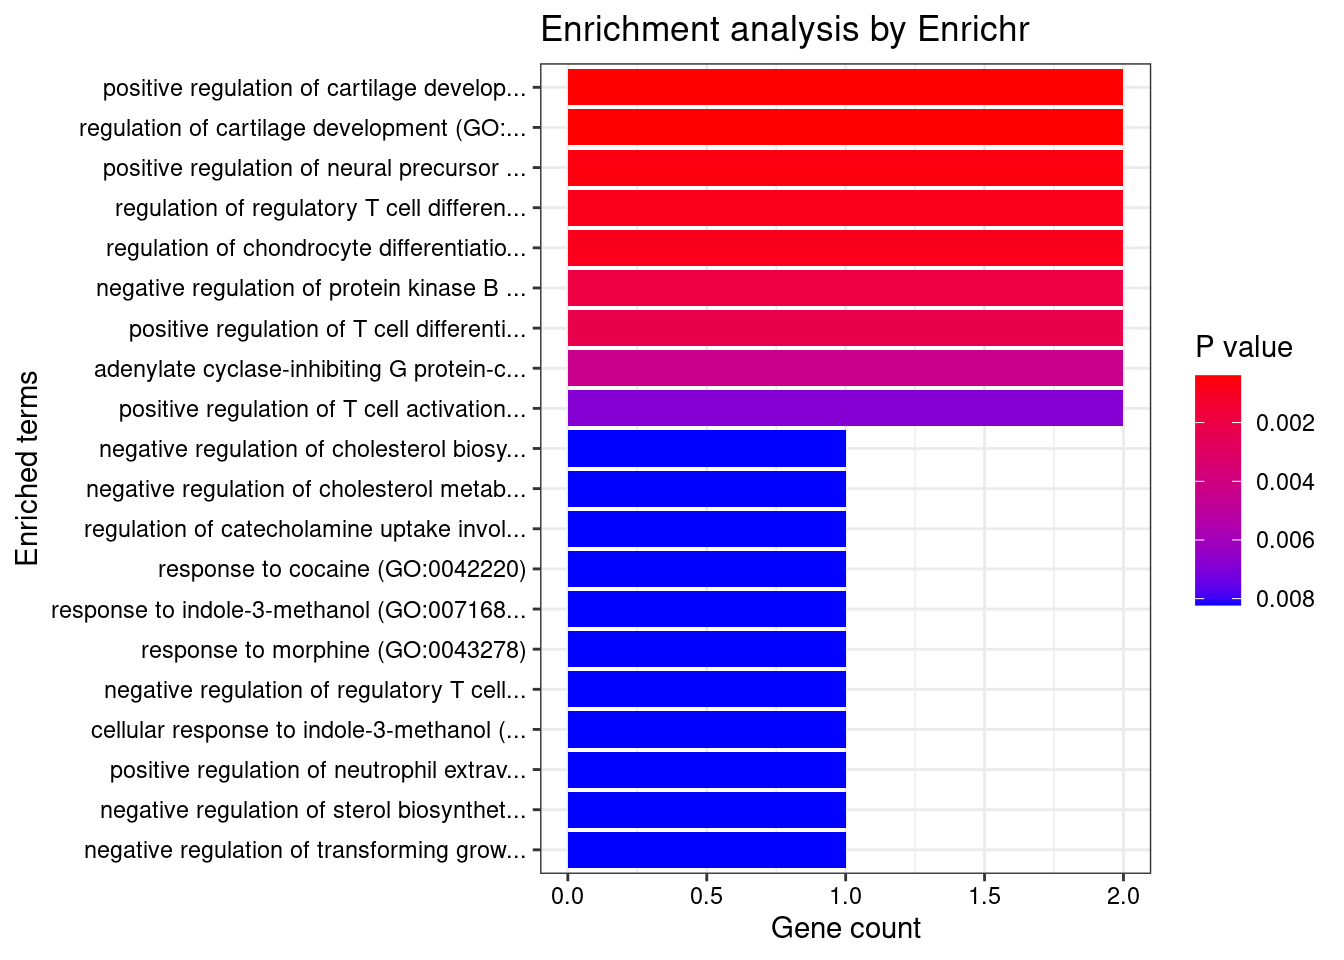
[1] Term             Overlap          Adjusted.P.value Genes
<0 rows> (or 0-length row.names)
[1] "GO_Cellular_Component_2021"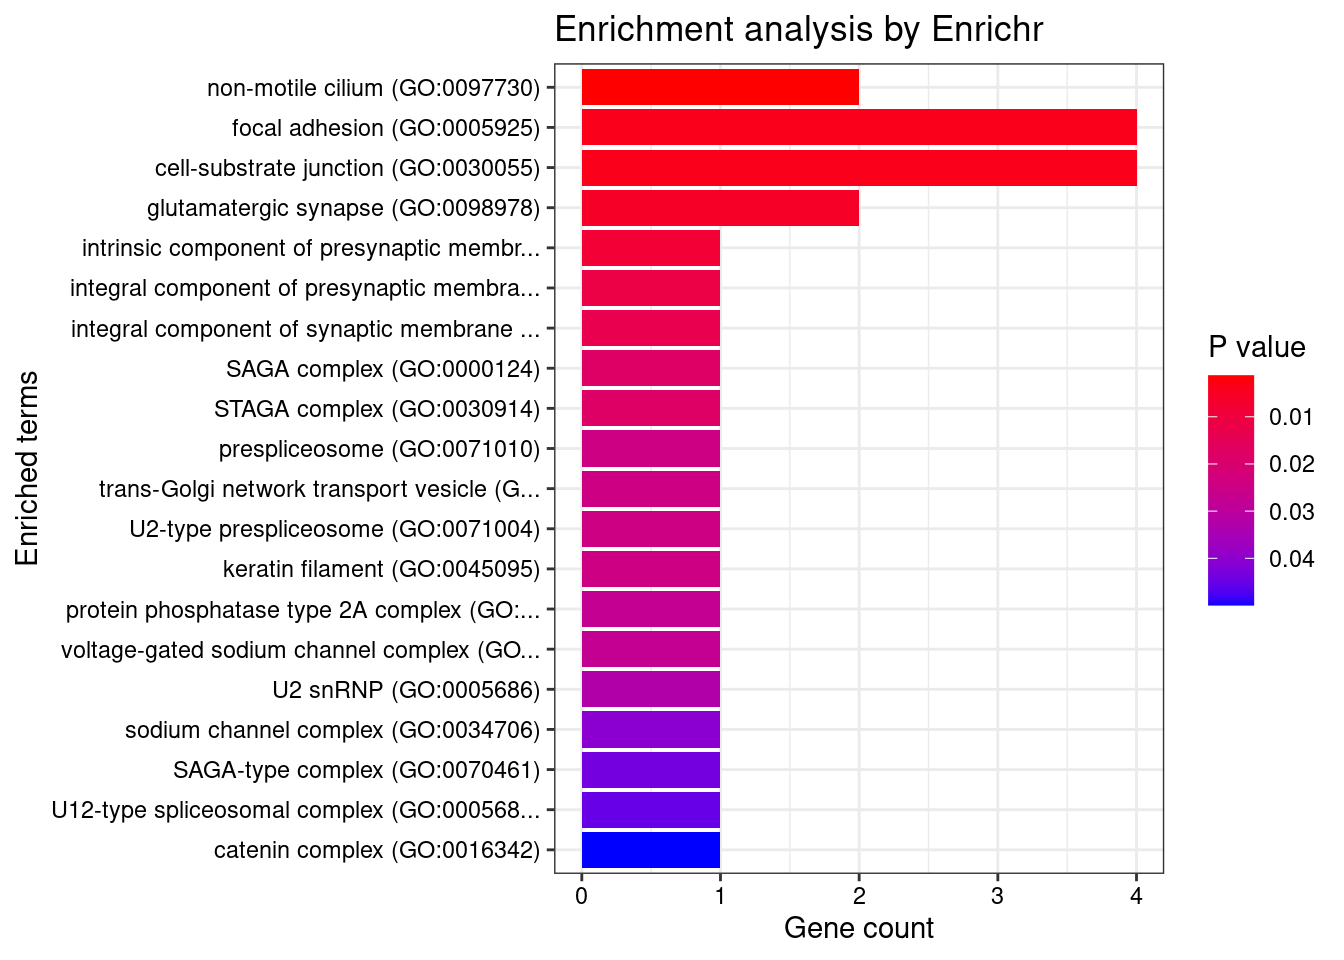
[1] Term             Overlap          Adjusted.P.value Genes
<0 rows> (or 0-length row.names)
[1] "GO_Molecular_Function_2021"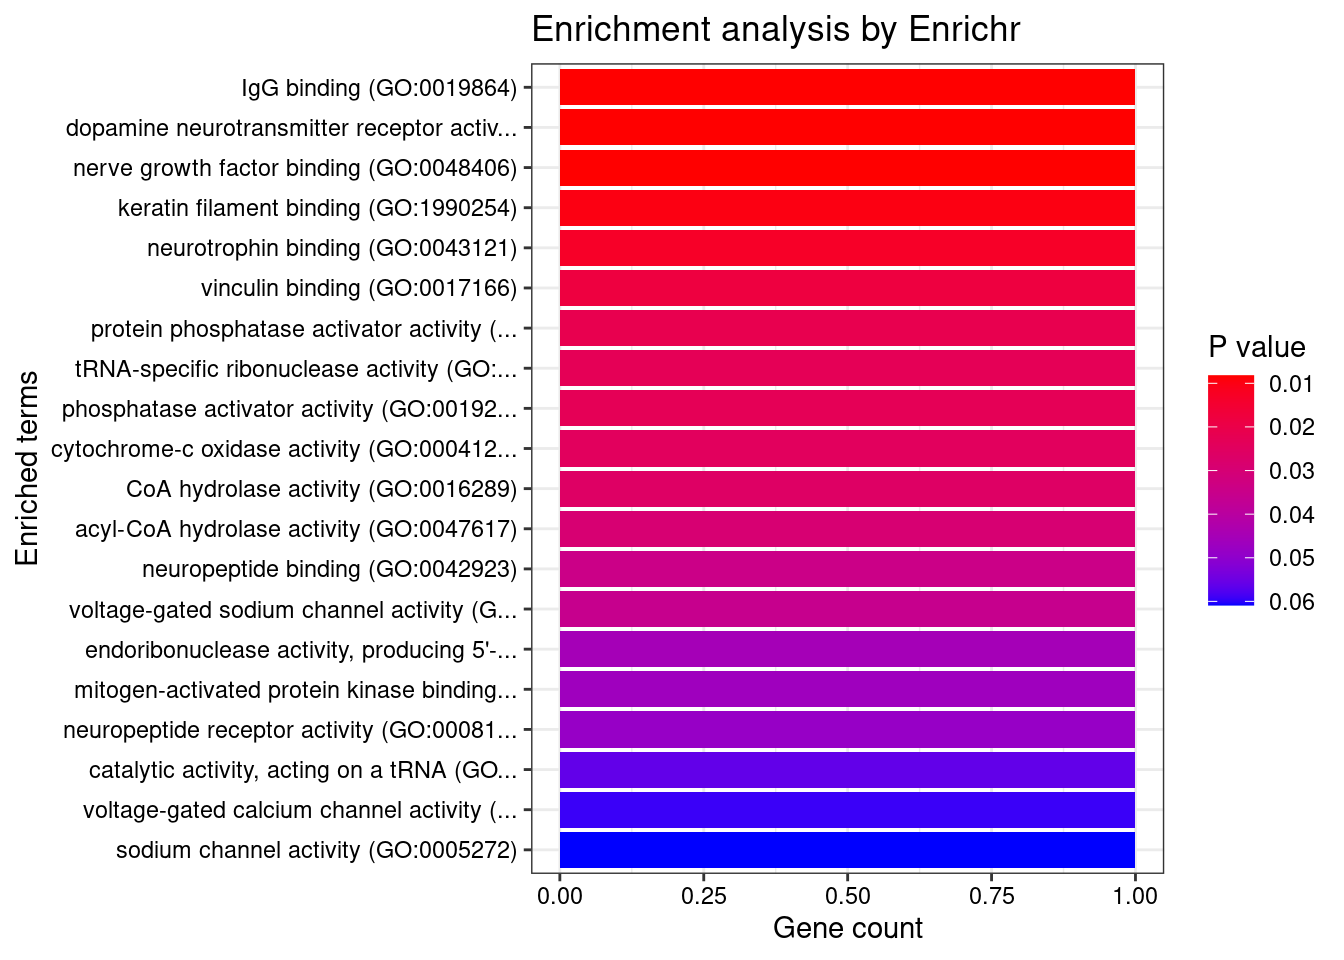
[1] Term             Overlap          Adjusted.P.value Genes
<0 rows> (or 0-length row.names)
DisGeNET enrichment analysis for genes with PIP>0.5
                     Description     FDR Ratio BgRatio
5              Anxiety Disorders 0.02258  2/15 44/9703
50                       Measles 0.02258  1/15  1/9703
51              Memory Disorders 0.02258  2/15 43/9703
93             Memory impairment 0.02258  2/15 44/9703
121     Anxiety States, Neurotic 0.02258  2/15 44/9703
149 Age-Related Memory Disorders 0.02258  2/15 43/9703
150    Memory Disorder, Semantic 0.02258  2/15 43/9703
151     Memory Disorder, Spatial 0.02258  2/15 43/9703
152                  Memory Loss 0.02258  2/15 43/9703
170   Anxiety neurosis (finding) 0.02258  2/15 44/9703
WebGestalt enrichment analysis for genes with PIP>0.5
Loading the functional categories...
Loading the ID list...
Loading the reference list...
Performing the enrichment analysis...
Warning in oraEnrichment(interestGeneList, referenceGeneList, geneSet, minNum =
minNum, : No significant gene set is identified based on FDR 0.05!NULLPIP Manhattan Plot
Warning: 'timedatectl' indicates the non-existent timezone name 'n/a'Warning: Your system is mis-configured: '/etc/localtime' is not a symlinkWarning: It is strongly recommended to set envionment variable TZ to 'America/
Chicago' (or equivalent)Warning: ggrepel: 1 unlabeled data points (too many overlaps). Consider
increasing max.overlaps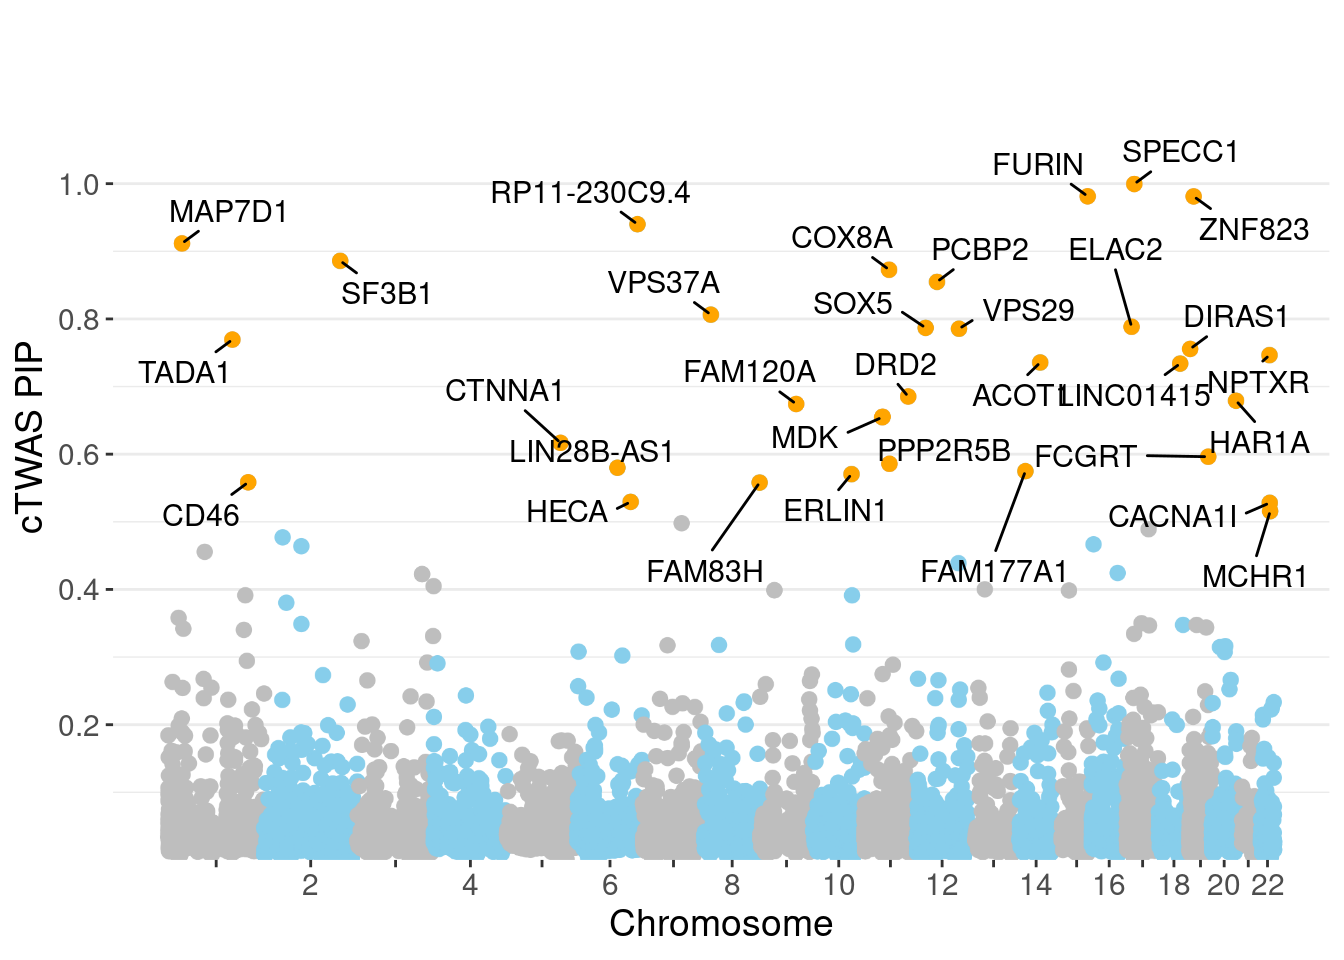
Sensitivity, specificity and precision for silver standard genes
#number of genes in known annotations
print(length(known_annotations))
[1] 130#number of genes in known annotations with imputed expression
print(sum(known_annotations %in% ctwas_gene_res$genename))[1] 58#significance threshold for TWAS
print(sig_thresh)[1] 4.588#number of ctwas genes
length(ctwas_genes)[1] 9#number of TWAS genes
length(twas_genes)[1] 69#show novel genes (ctwas genes with not in TWAS genes)
ctwas_gene_res[ctwas_gene_res$genename %in% novel_genes,report_cols] genename region_tag susie_pip mu2 PVE z num_eqtl
13453 RP11-230C9.4 6_102 0.9400 21.99 0.0002681 -4.569 2
10921 PCBP2 12_33 0.8548 21.60 0.0002395 4.496 1#sensitivity / recall
print(sensitivity) ctwas TWAS
0.02308 0.07692 #specificity
print(specificity) ctwas TWAS
0.9995 0.9947 #precision / PPV
print(precision) ctwas TWAS
0.3333 0.1449 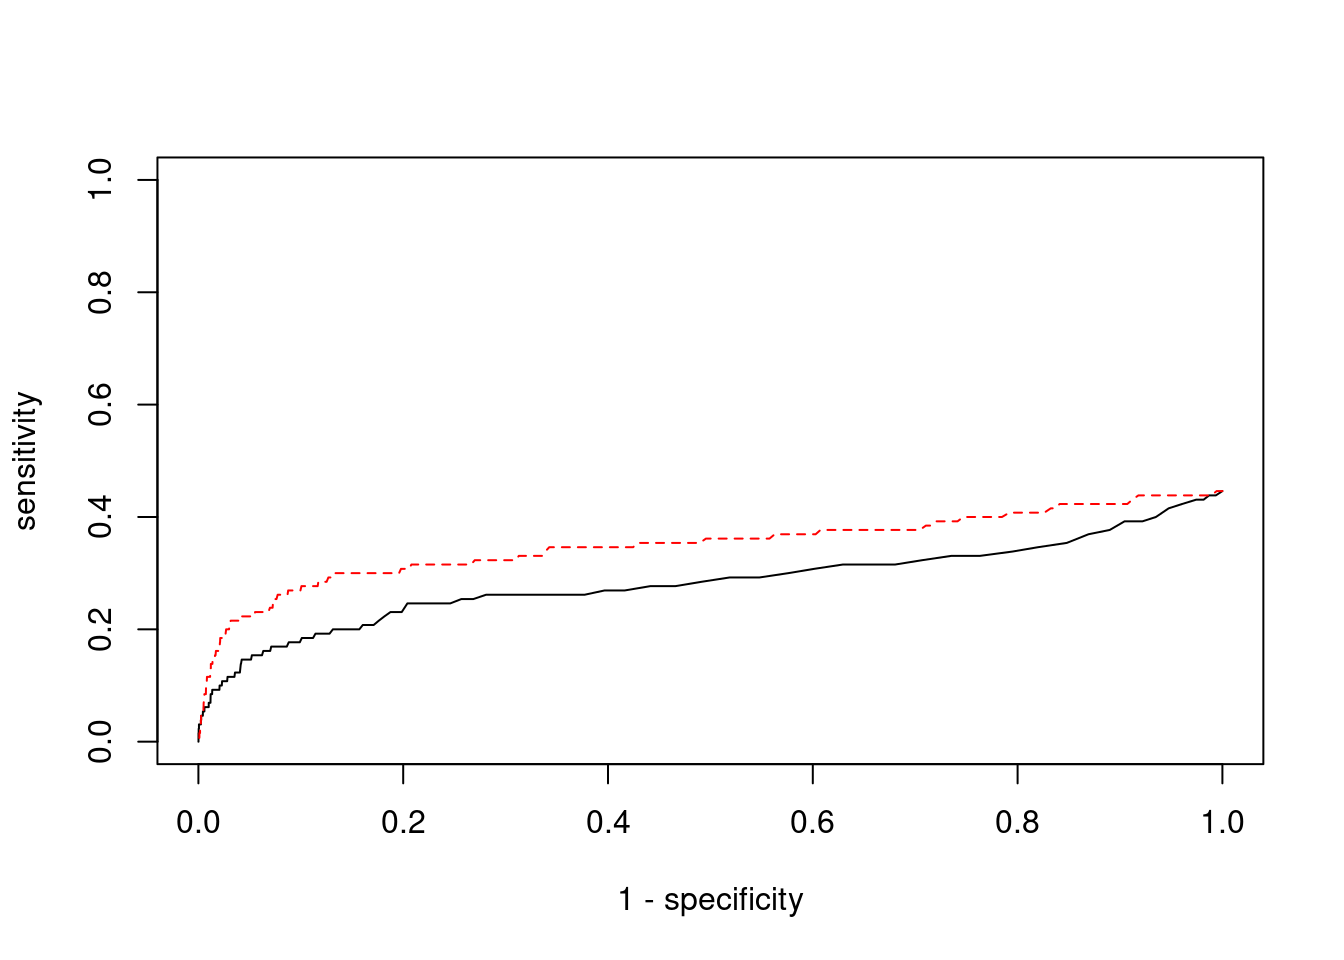
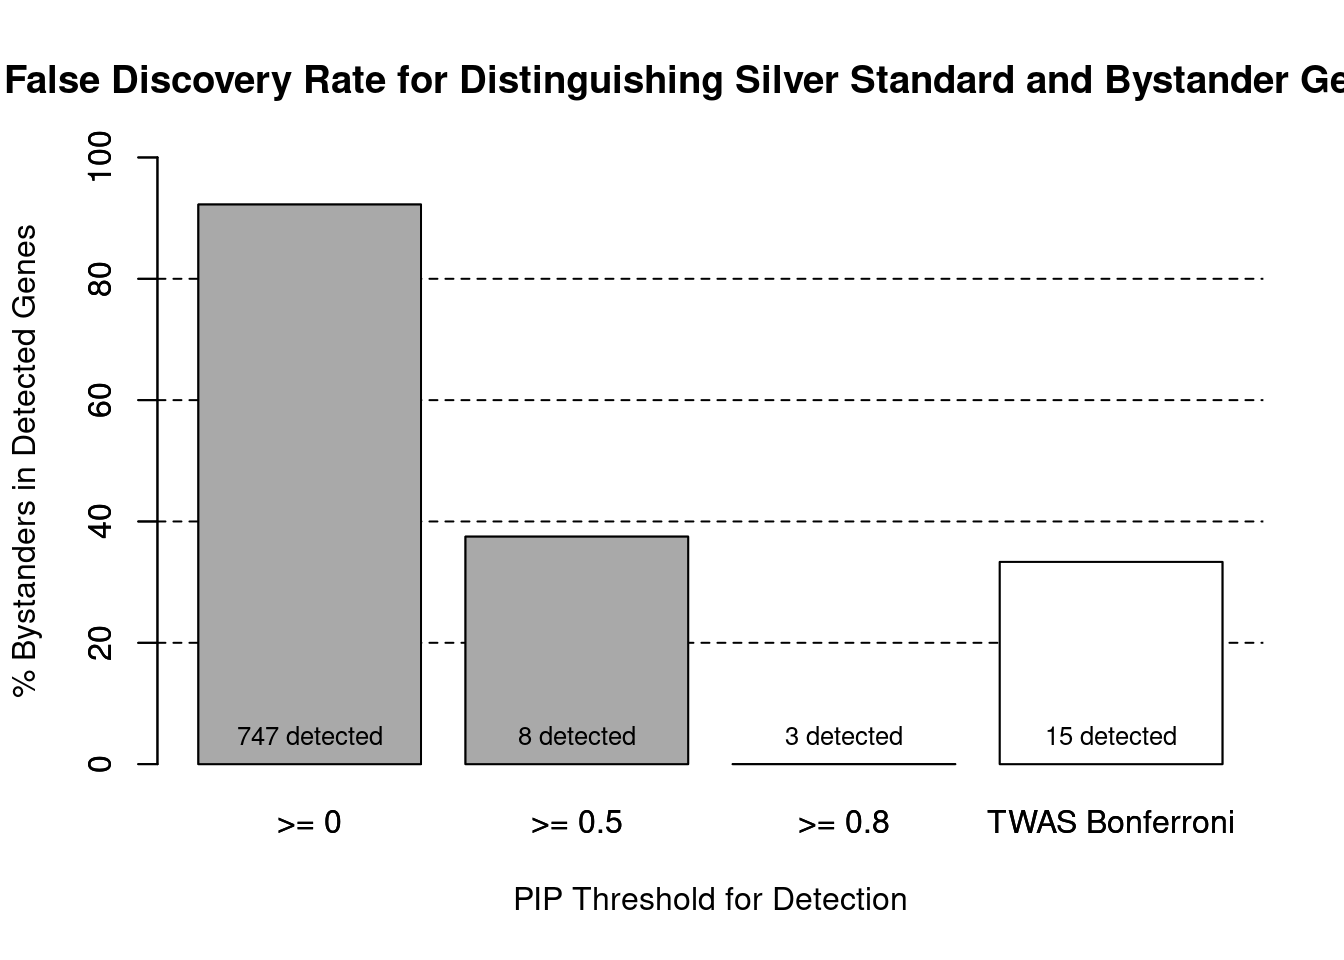
cTWAS is more precise than TWAS in distinguishing silver standard and bystander genes
#number of genes in known annotations (with imputed expression)
print(length(known_annotations))[1] 58#number of bystander genes (with imputed expression)
print(length(unrelated_genes))[1] 689#subset results to genes in known annotations or bystanders
ctwas_gene_res_subset <- ctwas_gene_res[ctwas_gene_res$genename %in% c(known_annotations, unrelated_genes),]
#assign ctwas and TWAS genes
ctwas_genes <- ctwas_gene_res_subset$genename[ctwas_gene_res_subset$susie_pip>0.8]
twas_genes <- ctwas_gene_res_subset$genename[abs(ctwas_gene_res_subset$z)>sig_thresh]
#significance threshold for TWAS
print(sig_thresh)
[1] 4.588#number of ctwas genes (in known annotations or bystanders)
length(ctwas_genes)[1] 3#number of TWAS genes (in known annotations or bystanders)
length(twas_genes)[1] 15#sensitivity / recall
sensitivity ctwas TWAS
0.05172 0.17241 #specificity / (1 - False Positive Rate)
specificity ctwas TWAS
1.0000 0.9927 #precision / PPV / (1 - False Discovery Rate)
precision ctwas TWAS
1.0000 0.6667 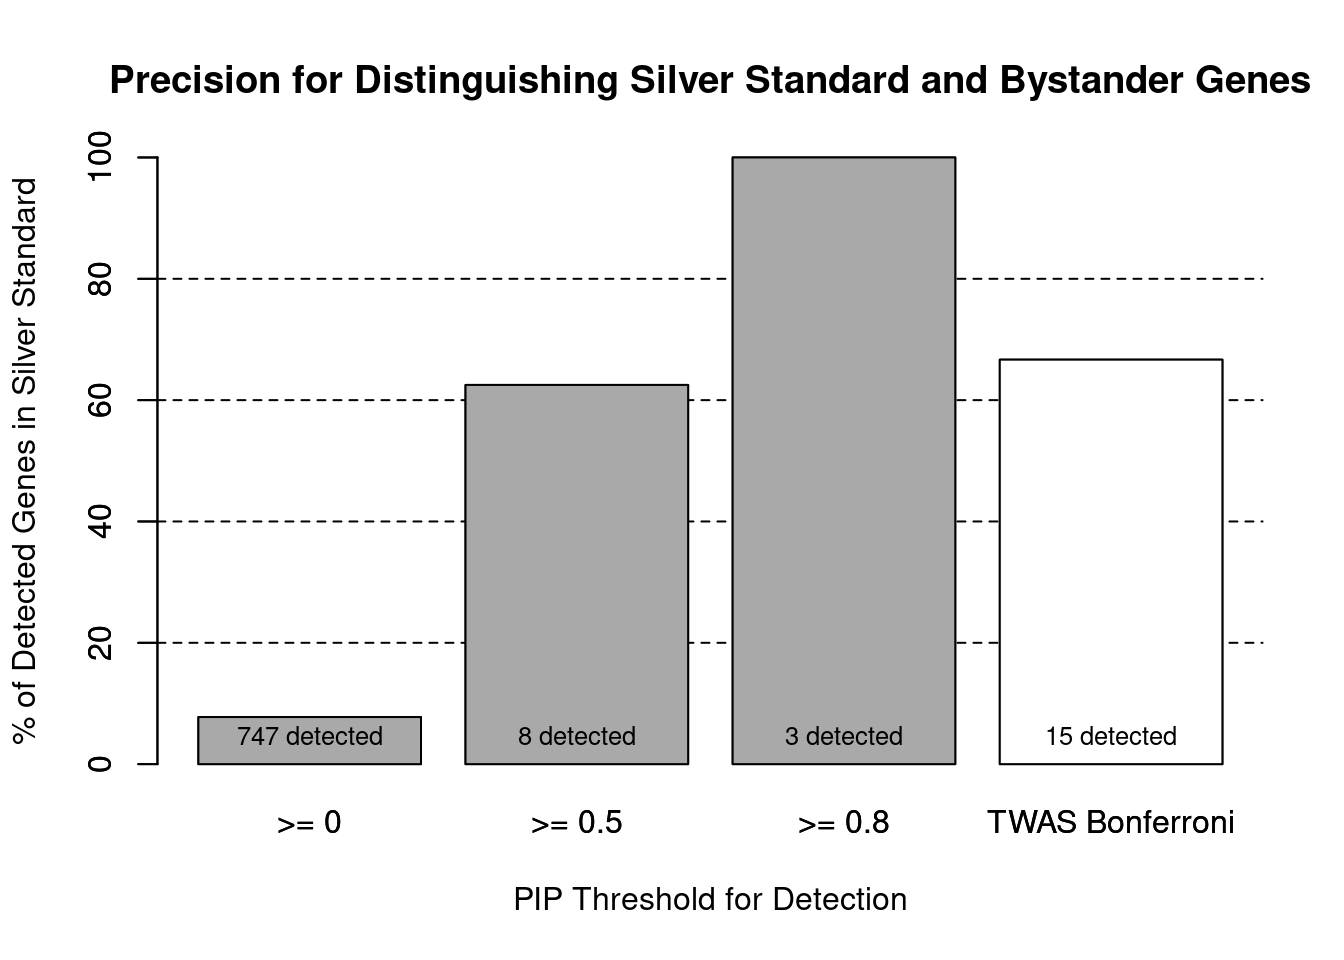
pip_range <- (0:1000)/1000
sensitivity <- rep(NA, length(pip_range))
specificity <- rep(NA, length(pip_range))

for (index in 1:length(pip_range)){
  pip <- pip_range[index]
  ctwas_genes <- ctwas_gene_res_subset$genename[ctwas_gene_res_subset$susie_pip>=pip]
  sensitivity[index] <- sum(ctwas_genes %in% known_annotations)/length(known_annotations)
  specificity[index] <- sum(!(unrelated_genes %in% ctwas_genes))/length(unrelated_genes)
}

plot(1-specificity, sensitivity, type="l", xlim=c(0,1), ylim=c(0,1), main="", xlab="1 - Specificity", ylab="Sensitivity")
title(expression("ROC Curve for cTWAS (black) and TWAS (" * phantom("red") * ")"))
title(expression(phantom("ROC Curve for cTWAS (black) and TWAS (") * "red" * phantom(")")), col.main="red")

sig_thresh_range <- seq(from=0, to=max(abs(ctwas_gene_res_subset$z)), length.out=length(pip_range))

for (index in 1:length(sig_thresh_range)){
  sig_thresh_plot <- sig_thresh_range[index]
  twas_genes <- ctwas_gene_res_subset$genename[abs(ctwas_gene_res_subset$z)>=sig_thresh_plot]
  sensitivity[index] <- sum(twas_genes %in% known_annotations)/length(known_annotations)
  specificity[index] <- sum(!(unrelated_genes %in% twas_genes))/length(unrelated_genes)
}

lines(1-specificity, sensitivity, xlim=c(0,1), ylim=c(0,1), col="red", lty=1)

abline(a=0,b=1,lty=3)

#add previously computed points from the analysis
ctwas_genes <- ctwas_gene_res_subset$genename[ctwas_gene_res_subset$susie_pip>0.8]
twas_genes <- ctwas_gene_res_subset$genename[abs(ctwas_gene_res_subset$z)>sig_thresh]

points(1-specificity_plot["ctwas"], sensitivity_plot["ctwas"], pch=21, bg="black")
points(1-specificity_plot["TWAS"], sensitivity_plot["TWAS"], pch=21, bg="red")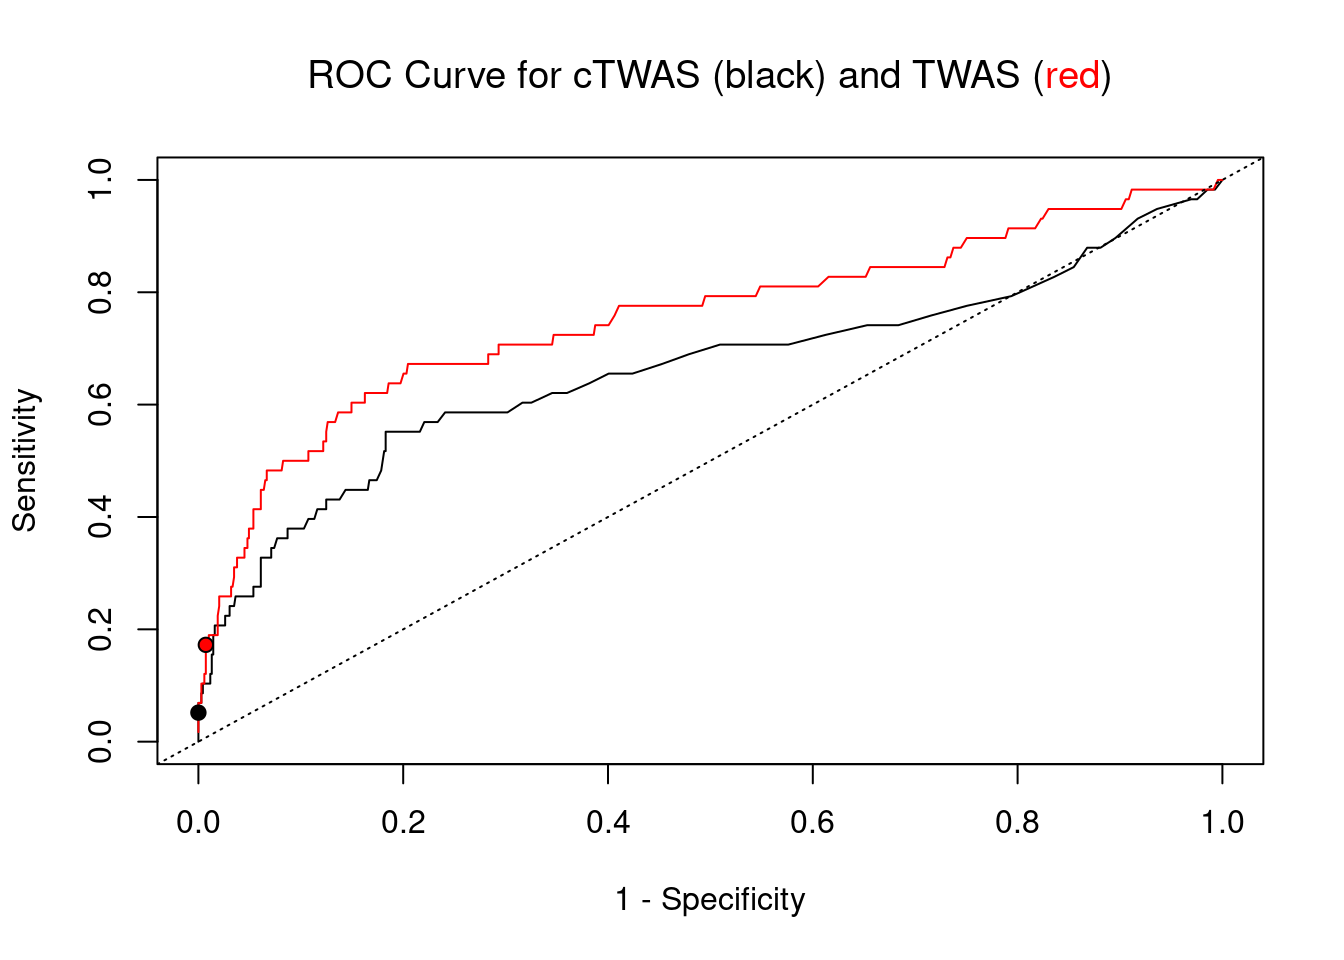
Undetected silver standard genes have low TWAS z-scores or stronger signal from nearby variants
#table of outcomes for silver standard genes
-sort(-table(silver_standard_case))
silver_standard_case
Not Imputed Insignificant z-score Nearby SNP(s)
72 48 7
Detected (PIP > 0.8)
3 #show inconclusive genes
silver_standard_case[silver_standard_case=="Inconclusive"]named character(0)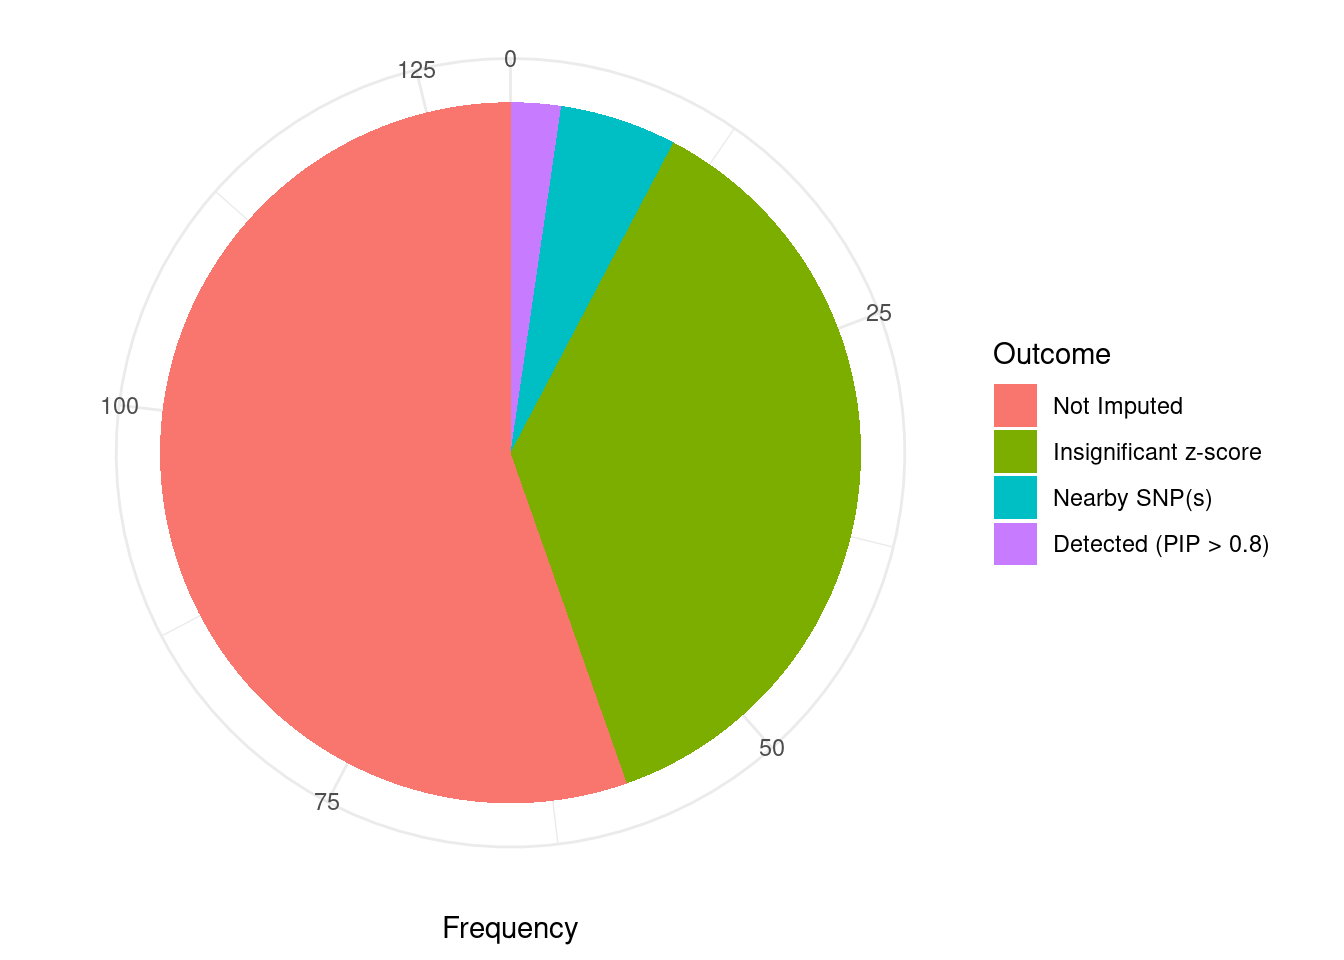
sessionInfo()R version 3.6.1 (2019-07-05)
Platform: x86_64-pc-linux-gnu (64-bit)
Running under: Scientific Linux 7.4 (Nitrogen)
Matrix products: default
BLAS/LAPACK: /software/openblas-0.2.19-el7-x86_64/lib/libopenblas_haswellp-r0.2.19.so
locale:
[1] LC_CTYPE=en_US.UTF-8 LC_NUMERIC=C
[3] LC_TIME=en_US.UTF-8 LC_COLLATE=en_US.UTF-8
[5] LC_MONETARY=en_US.UTF-8 LC_MESSAGES=en_US.UTF-8
[7] LC_PAPER=en_US.UTF-8 LC_NAME=C
[9] LC_ADDRESS=C LC_TELEPHONE=C
[11] LC_MEASUREMENT=en_US.UTF-8 LC_IDENTIFICATION=C
attached base packages:
[1] parallel stats4 stats graphics grDevices utils datasets
[8] methods base
other attached packages:
[1] GenomicRanges_1.36.1 GenomeInfoDb_1.20.0 IRanges_2.18.1
[4] S4Vectors_0.22.1 BiocGenerics_0.30.0 biomaRt_2.40.1
[7] readxl_1.3.1 forcats_0.5.1 stringr_1.4.0
[10] dplyr_1.0.7 purrr_0.3.4 readr_2.1.1
[13] tidyr_1.1.4 tidyverse_1.3.1 tibble_3.1.6
[16] WebGestaltR_0.4.4 disgenet2r_0.99.2 enrichR_3.0
[19] cowplot_1.0.0 ggplot2_3.3.5 workflowr_1.7.0
loaded via a namespace (and not attached):
[1] ggbeeswarm_0.6.0 colorspace_2.0-2 rjson_0.2.20
[4] ellipsis_0.3.2 rprojroot_2.0.2 XVector_0.24.0
[7] fs_1.5.2 rstudioapi_0.13 farver_2.1.0
[10] ggrepel_0.9.1 bit64_4.0.5 AnnotationDbi_1.46.0
[13] fansi_1.0.2 lubridate_1.8.0 xml2_1.3.3
[16] codetools_0.2-16 doParallel_1.0.17 cachem_1.0.6
[19] knitr_1.36 jsonlite_1.7.2 apcluster_1.4.8
[22] Cairo_1.5-12.2 broom_0.7.10 dbplyr_2.1.1
[25] compiler_3.6.1 httr_1.4.2 backports_1.4.1
[28] assertthat_0.2.1 Matrix_1.2-18 fastmap_1.1.0
[31] cli_3.1.0 later_0.8.0 prettyunits_1.1.1
[34] htmltools_0.5.2 tools_3.6.1 igraph_1.2.10
[37] GenomeInfoDbData_1.2.1 gtable_0.3.0 glue_1.6.2
[40] reshape2_1.4.4 doRNG_1.8.2 Rcpp_1.0.8
[43] Biobase_2.44.0 cellranger_1.1.0 jquerylib_0.1.4
[46] vctrs_0.3.8 svglite_1.2.2 iterators_1.0.14
[49] xfun_0.29 ps_1.6.0 rvest_1.0.2
[52] lifecycle_1.0.1 rngtools_1.5.2 XML_3.99-0.3
[55] zlibbioc_1.30.0 getPass_0.2-2 scales_1.1.1
[58] vroom_1.5.7 hms_1.1.1 promises_1.0.1
[61] yaml_2.2.1 curl_4.3.2 memoise_2.0.1
[64] ggrastr_1.0.1 gdtools_0.1.9 stringi_1.7.6
[67] RSQLite_2.2.8 highr_0.9 foreach_1.5.2
[70] rlang_1.0.1 pkgconfig_2.0.3 bitops_1.0-7
[73] evaluate_0.14 lattice_0.20-38 labeling_0.4.2
[76] bit_4.0.4 processx_3.5.2 tidyselect_1.1.1
[79] plyr_1.8.6 magrittr_2.0.2 R6_2.5.1
[82] generics_0.1.1 DBI_1.1.2 pillar_1.6.4
[85] haven_2.4.3 whisker_0.3-2 withr_2.4.3
[88] RCurl_1.98-1.5 modelr_0.1.8 crayon_1.5.0
[91] utf8_1.2.2 tzdb_0.2.0 rmarkdown_2.11
[94] progress_1.2.2 grid_3.6.1 data.table_1.14.2
[97] blob_1.2.2 callr_3.7.0 git2r_0.26.1
[100] reprex_2.0.1 digest_0.6.29 httpuv_1.5.1
[103] munsell_0.5.0 beeswarm_0.2.3 vipor_0.4.5