SCZ - Brain Hypothalamus
sheng Qian
2021-2-6
Last updated: 2022-03-16
Checks: 5 2
Knit directory: cTWAS_analysis/
This reproducible R Markdown analysis was created with workflowr (version 1.7.0). The Checks tab describes the reproducibility checks that were applied when the results were created. The Past versions tab lists the development history.
The R Markdown file has unstaged changes. To know which version of the R Markdown file created these results, you’ll want to first commit it to the Git repo. If you’re still working on the analysis, you can ignore this warning. When you’re finished, you can run wflow_publish to commit the R Markdown file and build the HTML.
Great job! The global environment was empty. Objects defined in the global environment can affect the analysis in your R Markdown file in unknown ways. For reproduciblity it’s best to always run the code in an empty environment.
The command set.seed(20211220) was run prior to running the code in the R Markdown file. Setting a seed ensures that any results that rely on randomness, e.g. subsampling or permutations, are reproducible.
Great job! Recording the operating system, R version, and package versions is critical for reproducibility.
Nice! There were no cached chunks for this analysis, so you can be confident that you successfully produced the results during this run.
Using absolute paths to the files within your workflowr project makes it difficult for you and others to run your code on a different machine. Change the absolute path(s) below to the suggested relative path(s) to make your code more reproducible.
| absolute | relative |
|---|---|
| /project2/xinhe/shengqian/cTWAS/cTWAS_analysis/data/ | data |
| /project2/xinhe/shengqian/cTWAS/cTWAS_analysis/code/ctwas_config.R | code/ctwas_config.R |
Great! You are using Git for version control. Tracking code development and connecting the code version to the results is critical for reproducibility.
The results in this page were generated with repository version d57314b. See the Past versions tab to see a history of the changes made to the R Markdown and HTML files.
Note that you need to be careful to ensure that all relevant files for the analysis have been committed to Git prior to generating the results (you can use wflow_publish or wflow_git_commit). workflowr only checks the R Markdown file, but you know if there are other scripts or data files that it depends on. Below is the status of the Git repository when the results were generated:
Ignored files:
    Ignored:    .ipynb_checkpoints/
    Ignored:    data/AF/

Untracked files:
    Untracked:  Rplot.png
    Untracked:  analysis/.ipynb_checkpoints/
    Untracked:  analysis/SCZ_2020_Brain_Amygdala.Rmd
    Untracked:  analysis/SCZ_2020_Brain_Anterior_cingulate_cortex_BA24.Rmd
    Untracked:  analysis/SCZ_2020_Brain_Caudate_basal_ganglia.Rmd
    Untracked:  analysis/SCZ_2020_Brain_Cerebellar_Hemisphere.Rmd
    Untracked:  analysis/SCZ_2020_Brain_Cerebellum.Rmd
    Untracked:  analysis/SCZ_2020_Brain_Hippocampus.Rmd
    Untracked:  analysis/SCZ_2020_Brain_Nucleus_accumbens_basal_ganglia.Rmd
    Untracked:  analysis/SCZ_2020_Brain_Spinal_cord_cervical_c-1.Rmd
    Untracked:  analysis/SCZ_2020_Brain_Substantia_nigra.Rmd
    Untracked:  code/.ipynb_checkpoints/
    Untracked:  code/AF_out/
    Untracked:  code/Autism_out/
    Untracked:  code/BMI_S_out/
    Untracked:  code/BMI_out/
    Untracked:  code/Glucose_out/
    Untracked:  code/LDL_S_out/
    Untracked:  code/SCZ_2014_EUR_out/
    Untracked:  code/SCZ_2020_out/
    Untracked:  code/SCZ_S_out/
    Untracked:  code/SCZ_out/
    Untracked:  code/T2D_out/
    Untracked:  code/ctwas_config.R
    Untracked:  code/mapping.R
    Untracked:  code/out/
    Untracked:  code/run_AF_analysis.sbatch
    Untracked:  code/run_AF_analysis.sh
    Untracked:  code/run_AF_ctwas_rss_LDR.R
    Untracked:  code/run_Autism_analysis.sbatch
    Untracked:  code/run_Autism_analysis.sh
    Untracked:  code/run_Autism_ctwas_rss_LDR.R
    Untracked:  code/run_BMI_analysis.sbatch
    Untracked:  code/run_BMI_analysis.sh
    Untracked:  code/run_BMI_analysis_S.sbatch
    Untracked:  code/run_BMI_analysis_S.sh
    Untracked:  code/run_BMI_ctwas_rss_LDR.R
    Untracked:  code/run_BMI_ctwas_rss_LDR_S.R
    Untracked:  code/run_Glucose_analysis.sbatch
    Untracked:  code/run_Glucose_analysis.sh
    Untracked:  code/run_Glucose_ctwas_rss_LDR.R
    Untracked:  code/run_LDL_analysis_S.sbatch
    Untracked:  code/run_LDL_analysis_S.sh
    Untracked:  code/run_LDL_ctwas_rss_LDR_S.R
    Untracked:  code/run_SCZ_2014_EUR_analysis.sbatch
    Untracked:  code/run_SCZ_2014_EUR_analysis.sh
    Untracked:  code/run_SCZ_2014_EUR_ctwas_rss_LDR.R
    Untracked:  code/run_SCZ_2020_analysis.sbatch
    Untracked:  code/run_SCZ_2020_analysis.sh
    Untracked:  code/run_SCZ_2020_ctwas_rss_LDR.R
    Untracked:  code/run_SCZ_analysis.sbatch
    Untracked:  code/run_SCZ_analysis.sh
    Untracked:  code/run_SCZ_analysis_S.sbatch
    Untracked:  code/run_SCZ_analysis_S.sh
    Untracked:  code/run_SCZ_ctwas_rss_LDR.R
    Untracked:  code/run_SCZ_ctwas_rss_LDR_S.R
    Untracked:  code/run_T2D_analysis.sbatch
    Untracked:  code/run_T2D_analysis.sh
    Untracked:  code/run_T2D_ctwas_rss_LDR.R
    Untracked:  code/wflow_build.R
    Untracked:  code/wflow_build.sbatch
    Untracked:  data/.ipynb_checkpoints/
    Untracked:  data/BMI/
    Untracked:  data/PGC3_SCZ_wave3_public.v2.tsv
    Untracked:  data/SCZ/
    Untracked:  data/SCZ_2014_EUR/
    Untracked:  data/SCZ_2020/
    Untracked:  data/SCZ_S/
    Untracked:  data/T2D/
    Untracked:  data/UKBB/
    Untracked:  data/UKBB_SNPs_Info.text
    Untracked:  data/gene_OMIM.txt
    Untracked:  data/gene_pip_0.8.txt
    Untracked:  data/mashr_Heart_Atrial_Appendage.db
    Untracked:  data/mashr_sqtl/
    Untracked:  data/summary_known_genes_annotations.xlsx
    Untracked:  data/untitled.txt

Unstaged changes:
    Modified:   analysis/SCZ_2020_Brain_Cortex.Rmd
    Modified:   analysis/SCZ_2020_Brain_Frontal_Cortex_BA9.Rmd
    Modified:   analysis/SCZ_2020_Brain_Hypothalamus.Rmd
    Modified:   analysis/SCZ_2020_Brain_Putamen_basal_ganglia.Rmd
Note that any generated files, e.g. HTML, png, CSS, etc., are not included in this status report because it is ok for generated content to have uncommitted changes.
These are the previous versions of the repository in which changes were made to the R Markdown (analysis/SCZ_2020_Brain_Hypothalamus.Rmd) and HTML (docs/SCZ_2020_Brain_Hypothalamus.html) files. If you’ve configured a remote Git repository (see ?wflow_git_remote), click on the hyperlinks in the table below to view the files as they were in that past version.
| File | Version | Author | Date | Message |
|---|---|---|---|---|
| Rmd | d57314b | sq-96 | 2022-03-15 | update |
Weight QC
#number of imputed weights
nrow(qclist_all)
[1] 11075#number of imputed weights by chromosome
table(qclist_all$chr)
   1    2    3    4    5    6    7    8    9   10   11   12   13   14   15   16
1102  753  663  439  556  620  531  428  412  428  658  631  212  356  369  488
  17   18   19   20   21   22
 679  167  846  327  134  276
#number of imputed weights without missing variants
sum(qclist_all$nmiss==0)[1] 8842#proportion of imputed weights without missing variants
mean(qclist_all$nmiss==0)[1] 0.7984Check convergence of parameters
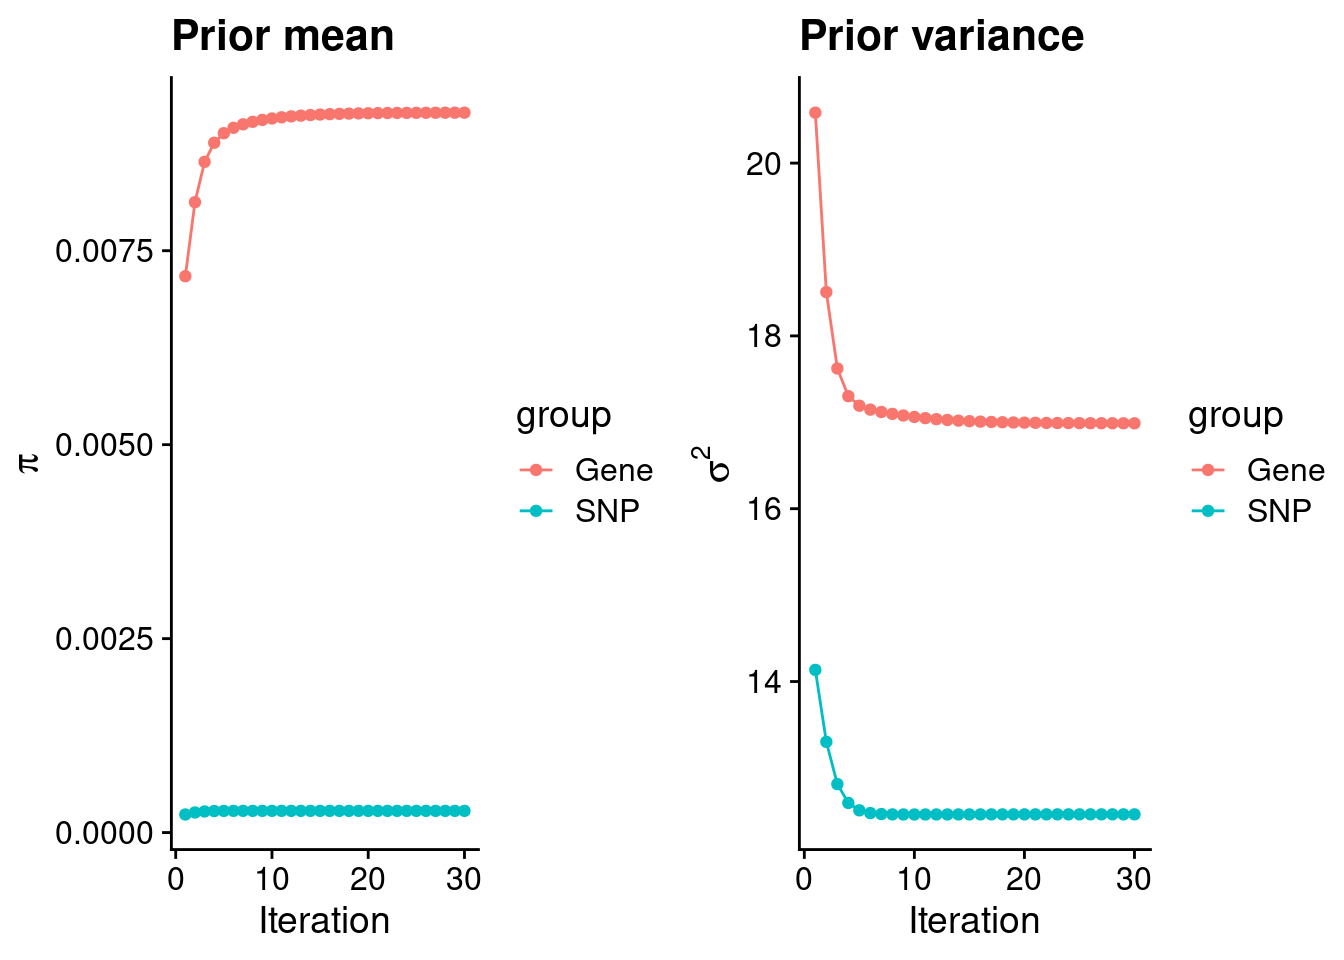
#estimated group prior
estimated_group_prior <- group_prior_rec[,ncol(group_prior_rec)]
names(estimated_group_prior) <- c("gene", "snp")
estimated_group_prior["snp"] <- estimated_group_prior["snp"]*thin #adjust parameter to account for thin argument
print(estimated_group_prior)
gene snp
0.0092792 0.0002797 #estimated group prior variance
estimated_group_prior_var <- group_prior_var_rec[,ncol(group_prior_var_rec)]
names(estimated_group_prior_var) <- c("gene", "snp")
print(estimated_group_prior_var) gene snp
16.99 12.46 #report sample size
print(sample_size)[1] 161405#report group size
group_size <- c(nrow(ctwas_gene_res), n_snps)
print(group_size)[1] 11075 7394310#estimated group PVE
estimated_group_pve <- estimated_group_prior_var*estimated_group_prior*group_size/sample_size #check PVE calculation
names(estimated_group_pve) <- c("gene", "snp")
print(estimated_group_pve) gene snp
0.01082 0.15970 #compare sum(PIP*mu2/sample_size) with above PVE calculation
c(sum(ctwas_gene_res$PVE),sum(ctwas_snp_res$PVE))[1] 0.04506 0.80755Genes with highest PIPs
          genename region_tag susie_pip     mu2       PVE      z num_eqtl
679         RASSF1       3_35    0.9998 1010.97 6.262e-03  4.532        1
5324         FURIN      15_42    0.9865   93.98 5.744e-04 -9.913        1
10843       ZNF823      19_10    0.9768   40.83 2.471e-04  6.310        2
11997   AC012074.2       2_15    0.9739   31.12 1.878e-04  5.469        2
3872          IRF3      19_35    0.9153   56.18 3.186e-04 -7.641        1
2551         TRPV4      12_66    0.8672   24.86 1.336e-04  4.416        1
6907           ACE      17_38    0.8341   35.37 1.828e-04 -5.876        1
4594         DAGLA      11_34    0.8069   22.96 1.148e-04 -4.263        1
11948    HIST1H2BN       6_21    0.7920  180.20 8.842e-04 13.182        1
10850        RPL12       9_66    0.7825   24.72 1.198e-04  4.671        2
10823      HIST4H4      12_12    0.7792   23.09 1.115e-04 -4.038        2
13339 CTA-246H3.12       22_7    0.7627   23.19 1.096e-04  4.019        2
8828          KAT5      11_36    0.7462   32.09 1.483e-04  5.224        1
5639          RIT1       1_76    0.7327   24.28 1.102e-04 -4.023        1
2933          APC2       19_2    0.7277   24.44 1.102e-04  4.108        1
8406        CALML6        1_1    0.7157   23.43 1.039e-04  4.505        2
7356      SERPINI1      3_103    0.7084   23.39 1.027e-04 -4.520        1
3844           MAX      14_30    0.7044   22.80 9.951e-05  4.329        1
783         ACADVL       17_6    0.7037   22.96 1.001e-04 -4.325        1
3951        ZNF835      19_38    0.6839   28.50 1.208e-04  5.136        1
Genes with largest effect sizes
       genename region_tag susie_pip     mu2       PVE        z num_eqtl
679      RASSF1       3_35 9.998e-01 1010.97 6.262e-03   4.5324        1
208      SEMA3B       3_35 0.000e+00  818.63 0.000e+00   1.4290        2
10406   SLC38A3       3_35 5.910e-13  250.62 9.176e-16  -2.7756        1
125    CACNA2D2       3_35 0.000e+00  234.19 0.000e+00  -0.1392        1
38         RBM6       3_35 5.359e-01  213.63 7.093e-04   4.4688        1
11948 HIST1H2BN       6_21 7.920e-01  180.20 8.842e-04  13.1822        1
7487      CAMKV       3_35 1.002e-07  178.89 1.110e-10   1.7107        1
10243     HYAL3       3_35 3.250e-13  176.06 3.545e-16  -2.5066        1
2875      HEMK1       3_35 0.000e+00  169.08 0.000e+00  -0.8999        1
7489      MST1R       3_35 2.336e-05  161.53 2.337e-08  -4.0250        1
12211      NAT6       3_35 3.077e-12  138.78 2.646e-15   1.5617        2
13397 LINC02019       3_35 0.000e+00  123.39 0.000e+00   0.3148        2
2736     PRSS16       6_21 7.452e-02  110.59 5.106e-05 -10.0002        1
7484     RNF123       3_35 2.220e-16  105.34 1.449e-19  -2.3622        1
2876       CISH       3_35 0.000e+00   98.55 0.000e+00  -0.8833        1
5324      FURIN      15_42 9.865e-01   93.98 5.744e-04  -9.9133        1
9592  HIST1H2BC       6_20 9.537e-03   89.18 5.270e-06  -7.9928        1
11166      MSH5       6_26 3.639e-01   88.14 1.987e-04  10.7348        2
11169   ABHD16A       6_26 2.925e-01   87.60 1.588e-04  10.7104        1
11174      APOM       6_26 1.715e-01   86.17 9.154e-05  10.6484        1
Genes with highest PVE
        genename region_tag susie_pip     mu2       PVE      z num_eqtl
679       RASSF1       3_35    0.9998 1010.97 0.0062622  4.532        1
11948  HIST1H2BN       6_21    0.7920  180.20 0.0008842 13.182        1
38          RBM6       3_35    0.5359  213.63 0.0007093  4.469        1
5324       FURIN      15_42    0.9865   93.98 0.0005744 -9.913        1
3872        IRF3      19_35    0.9153   56.18 0.0003186 -7.641        1
11131    HLA-DMA       6_27    0.5425   79.13 0.0002660 -9.408        1
10843     ZNF823      19_10    0.9768   40.83 0.0002471  6.310        2
7453        GNL3       3_36    0.5480   64.08 0.0002176  9.162        2
2970       SF3B1      2_117    0.6501   53.51 0.0002155  7.605        1
2829        PCCB       3_84    0.4515   74.67 0.0002089 -7.445        1
11166       MSH5       6_26    0.3639   88.14 0.0001987 10.735        2
11997 AC012074.2       2_15    0.9739   31.12 0.0001878  5.469        2
10797        NMB      15_39    0.5971   49.81 0.0001843  7.121        1
6907         ACE      17_38    0.8341   35.37 0.0001828 -5.876        1
11169    ABHD16A       6_26    0.2925   87.60 0.0001588 10.710        1
8828        KAT5      11_36    0.7462   32.09 0.0001483  5.224        1
1685    PPP1R16B      20_23    0.4755   50.16 0.0001478  7.550        1
6178       TAOK2      16_24    0.4305   50.75 0.0001353  7.474        1
2551       TRPV4      12_66    0.8672   24.86 0.0001336  4.416        1
8764        FUT9       6_65    0.6000   33.25 0.0001236  5.446        1
Genes with largest z scores
       genename region_tag susie_pip    mu2       PVE       z num_eqtl
11948 HIST1H2BN       6_21 0.7919507 180.20 8.842e-04  13.182        1
11166      MSH5       6_26 0.3639443  88.14 1.987e-04  10.735        2
11169   ABHD16A       6_26 0.2925358  87.60 1.588e-04  10.710        1
11174      APOM       6_26 0.1714513  86.17 9.154e-05  10.648        1
12252       C4A       6_26 0.0284680  82.47 1.455e-05  10.418        1
2736     PRSS16       6_21 0.0745211 110.59 5.106e-05 -10.000        1
5324      FURIN      15_42 0.9864665  93.98 5.744e-04  -9.913        1
11131   HLA-DMA       6_27 0.5424704  79.13 2.660e-04  -9.408        1
11142      RNF5       6_26 0.0069454  60.98 2.624e-06   9.267        1
7453       GNL3       3_36 0.5480209  64.08 2.176e-04   9.162        2
11172    GPANK1       6_26 0.0026378  52.42 8.567e-07   8.879        1
7454      PBRM1       3_36 0.0190804  59.72 7.060e-06  -8.722        1
9715    ARL6IP4      12_75 0.0005083  65.04 2.048e-07   8.615        1
8184      SMIM4       3_36 0.0156714  56.91 5.525e-06  -8.494        1
6103       DGKZ      11_28 0.2250490  61.32 8.550e-05   8.064        1
9577     HARBI1      11_28 0.2470633  60.56 9.269e-05   8.046        1
9085      ATG13      11_28 0.2470633  60.56 9.269e-05  -8.046        1
11139    NOTCH4       6_26 0.0364096  66.48 1.500e-05   8.033        3
9592  HIST1H2BC       6_20 0.0095369  89.18 5.270e-06  -7.993        1
2505        MDK      11_28 0.0864733  57.98 3.107e-05  -7.898        1
Comparing z scores and PIPs
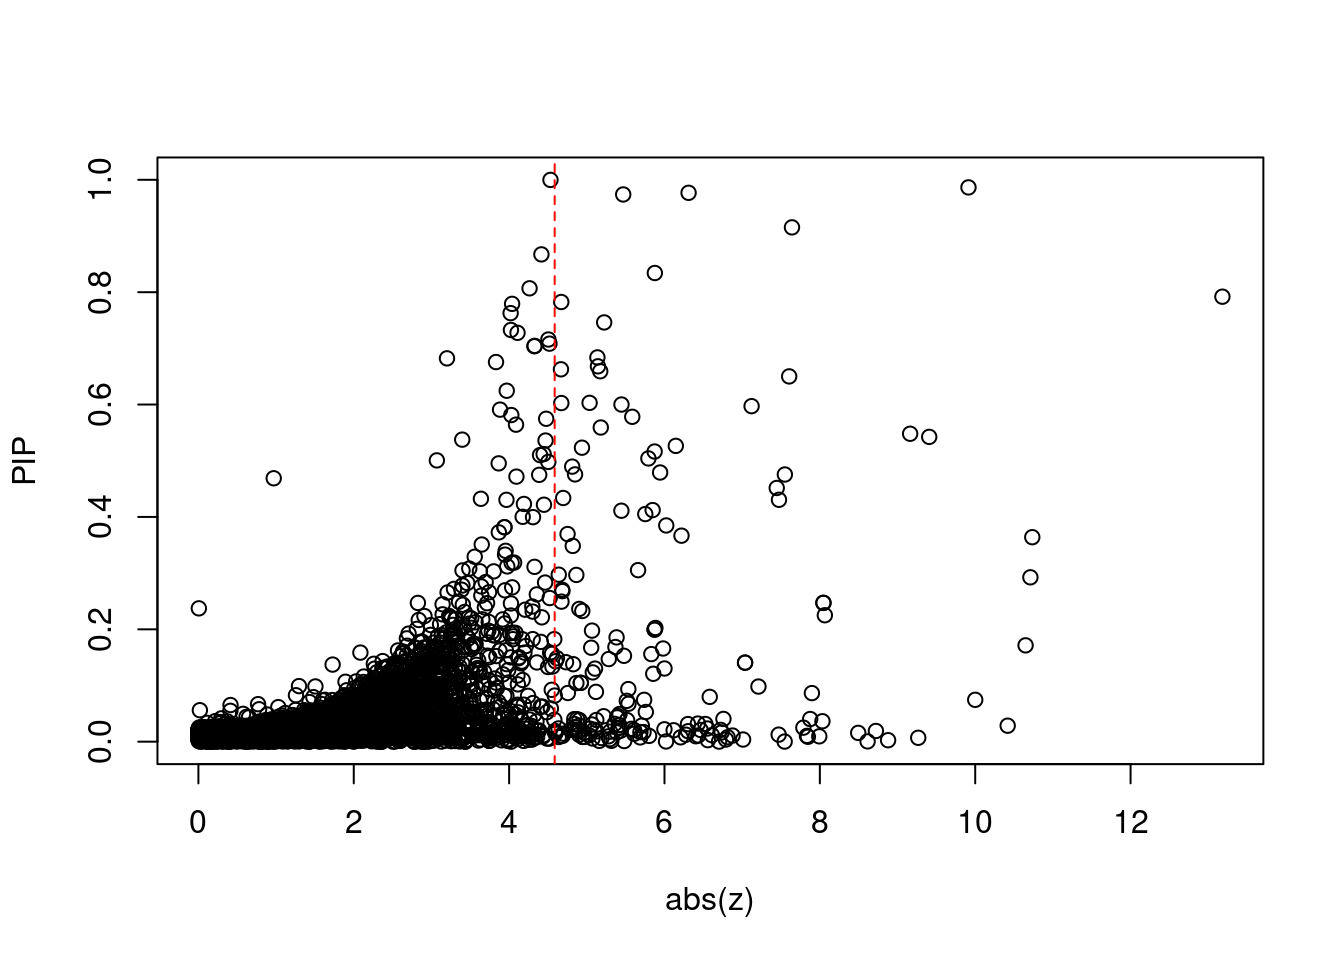
[1] 0.01652GO enrichment analysis for genes with PIP>0.5
#number of genes for gene set enrichment
length(genes)
[1] 48Uploading data to Enrichr... Done.
Querying GO_Biological_Process_2021... Done.
Querying GO_Cellular_Component_2021... Done.
Querying GO_Molecular_Function_2021... Done.
Parsing results... Done.
[1] "GO_Biological_Process_2021"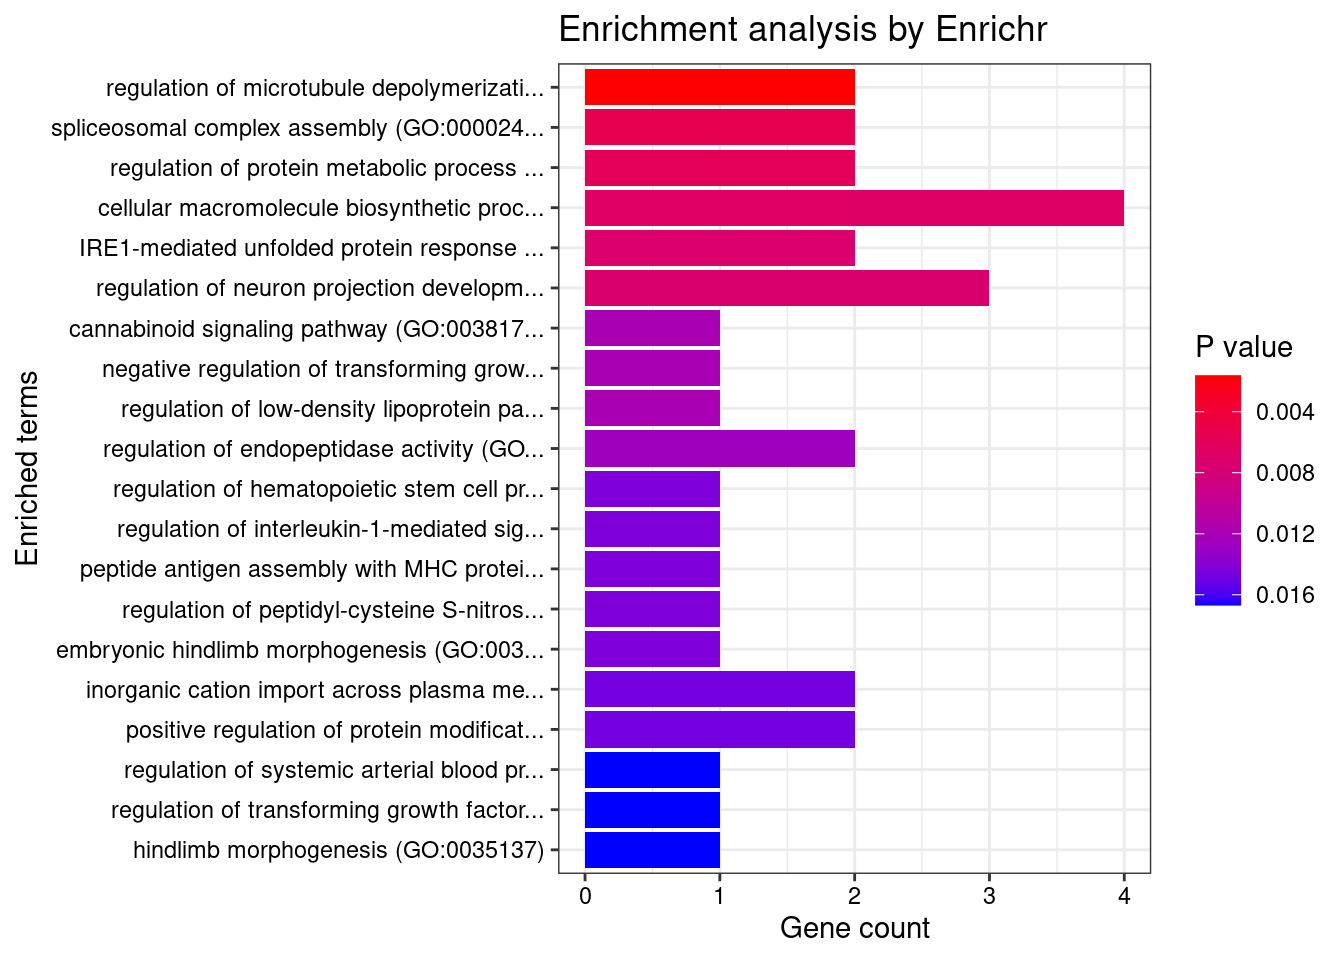
[1] Term             Overlap          Adjusted.P.value Genes
<0 rows> (or 0-length row.names)
[1] "GO_Cellular_Component_2021"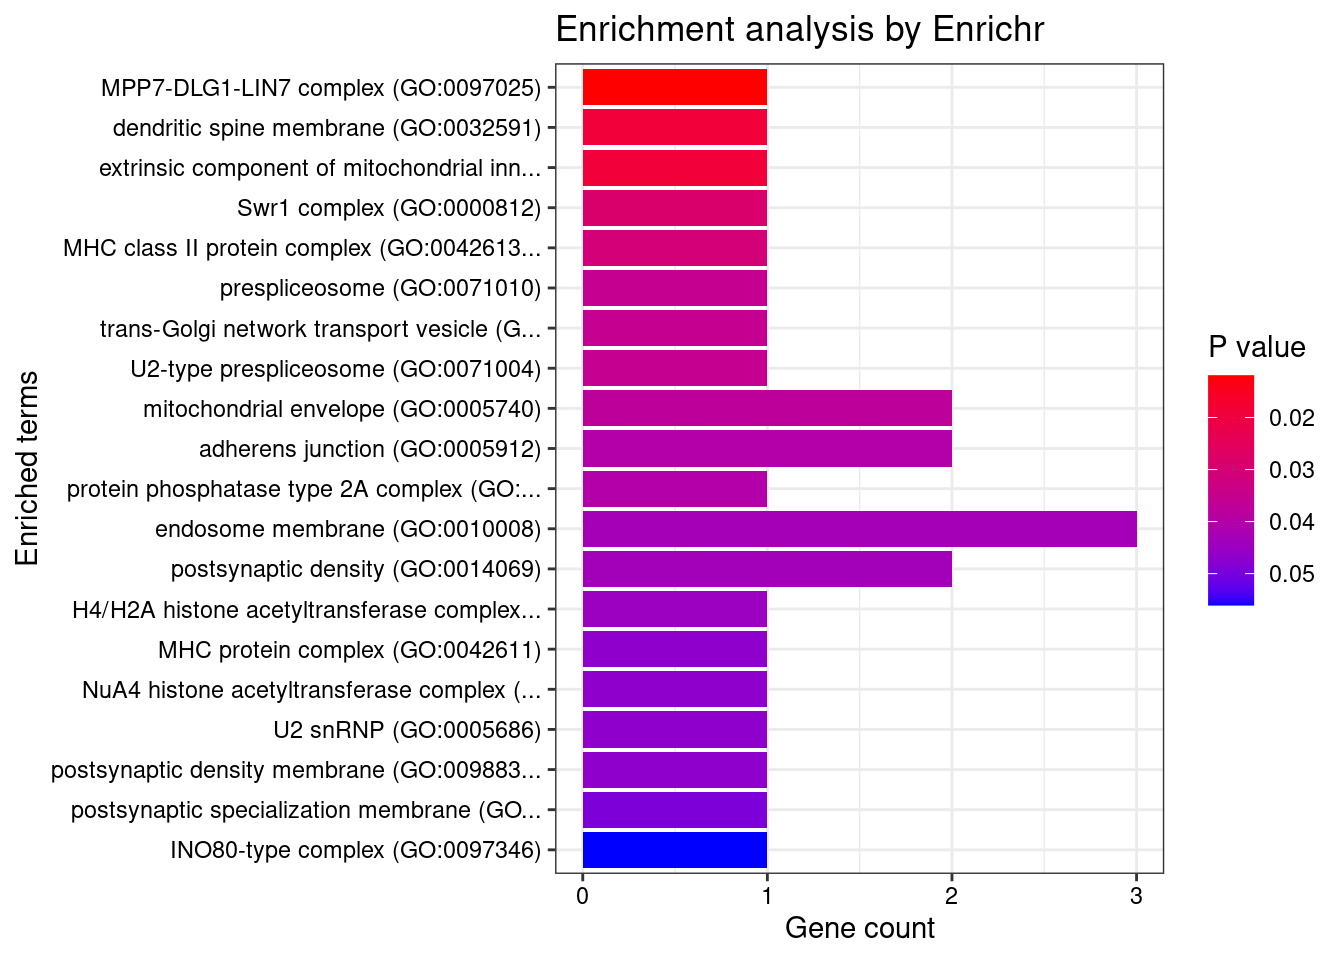
[1] Term             Overlap          Adjusted.P.value Genes
<0 rows> (or 0-length row.names)
[1] "GO_Molecular_Function_2021"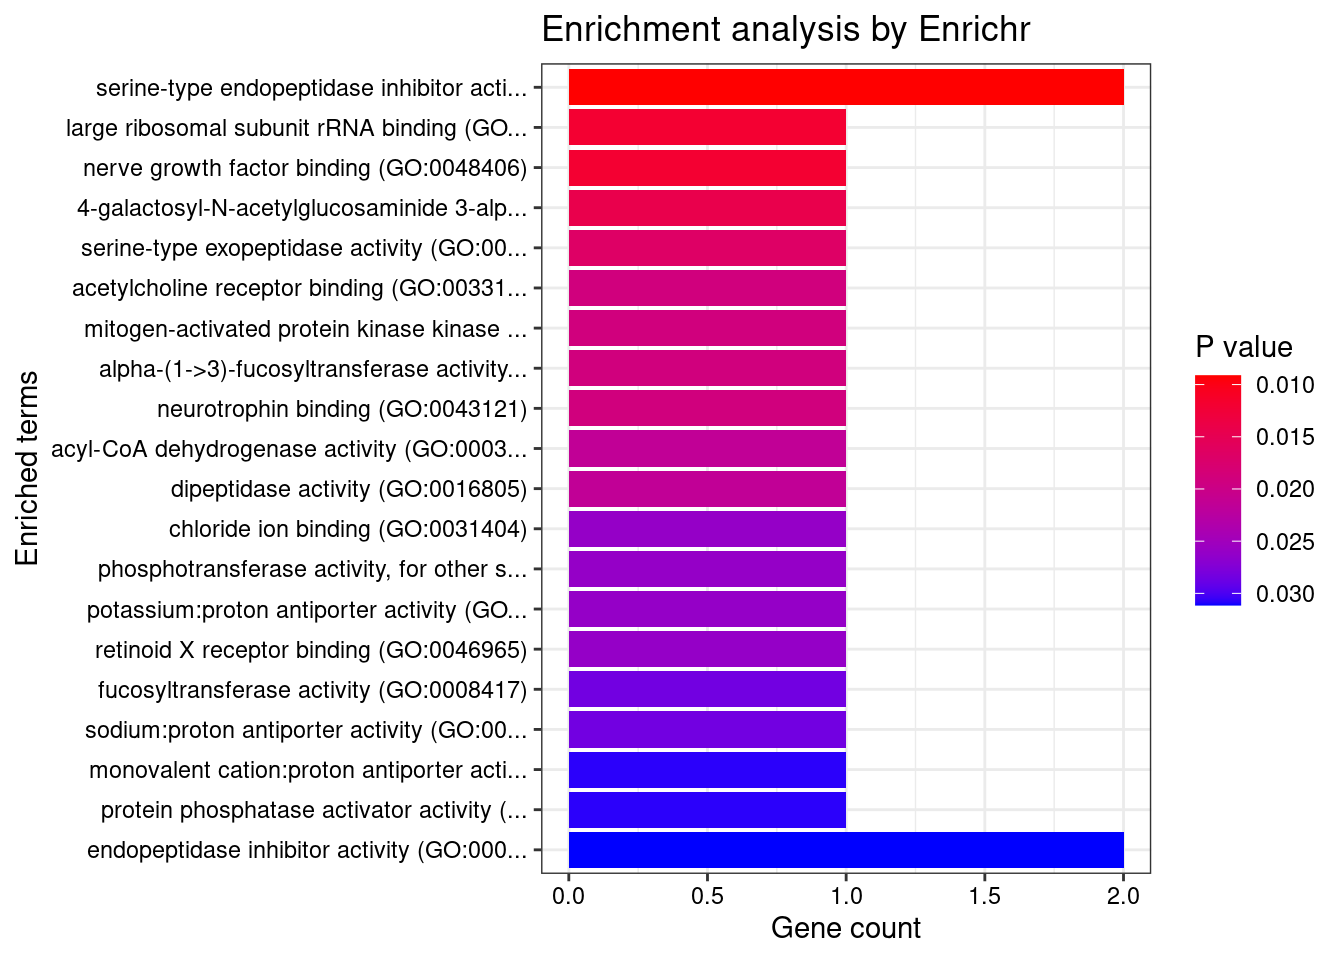
[1] Term             Overlap          Adjusted.P.value Genes
<0 rows> (or 0-length row.names)
DisGeNET enrichment analysis for genes with PIP>0.5
                                      Description     FDR Ratio BgRatio
32                                      Confusion 0.01977  1/21  1/9703
50                           Gingival Hypertrophy 0.01977  1/21  1/9703
63                    Infant, Premature, Diseases 0.01977  1/21  1/9703
75             Chronic Obstructive Airway Disease 0.01977  2/21 33/9703
99                               Pneumonia, Viral 0.01977  1/21  1/9703
145                             Speech impairment 0.01977  1/21  1/9703
146                                 Derealization 0.01977  1/21  1/9703
154 Spondylometaphyseal dysplasia, Kozlowski type 0.01977  1/21  1/9703
155                           Metatropic dwarfism 0.01977  1/21  1/9703
182                            Brachyolmia Type 3 0.01977  1/21  1/9703
WebGestalt enrichment analysis for genes with PIP>0.5
Loading the functional categories...
Loading the ID list...
Loading the reference list...
Performing the enrichment analysis...
Warning in oraEnrichment(interestGeneList, referenceGeneList, geneSet, minNum =
minNum, : No significant gene set is identified based on FDR 0.05!NULLPIP Manhattan Plot
Warning: ggrepel: 3 unlabeled data points (too many overlaps). Consider
increasing max.overlaps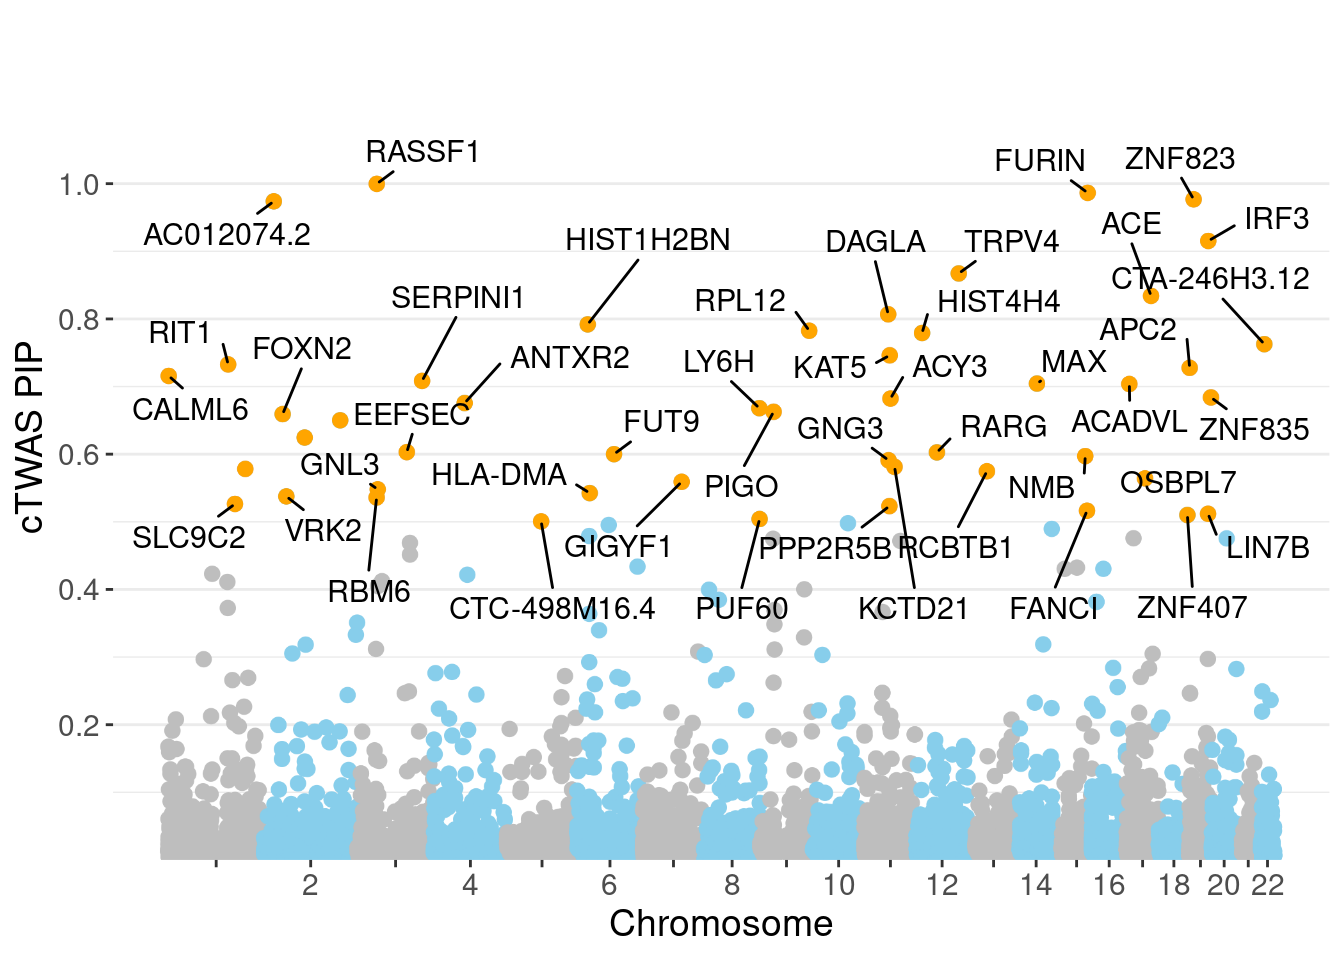
Sensitivity, specificity and precision for silver standard genes
#number of genes in known annotations
print(length(known_annotations))
[1] 130#number of genes in known annotations with imputed expression
print(sum(known_annotations %in% ctwas_gene_res$genename))[1] 58#significance threshold for TWAS
print(sig_thresh)[1] 4.586#number of ctwas genes
length(ctwas_genes)[1] 8#number of TWAS genes
length(twas_genes)[1] 183#show novel genes (ctwas genes with not in TWAS genes)
ctwas_gene_res[ctwas_gene_res$genename %in% novel_genes,report_cols] genename region_tag susie_pip mu2 PVE z num_eqtl
679 RASSF1 3_35 0.9998 1010.97 0.0062622 4.532 1
4594 DAGLA 11_34 0.8069 22.96 0.0001148 -4.263 1
2551 TRPV4 12_66 0.8672 24.86 0.0001336 4.416 1#sensitivity / recall
print(sensitivity) ctwas TWAS
0.03077 0.15385 #specificity
print(specificity) ctwas TWAS
0.9996 0.9852 #precision / PPV
print(precision) ctwas TWAS
0.5000 0.1093 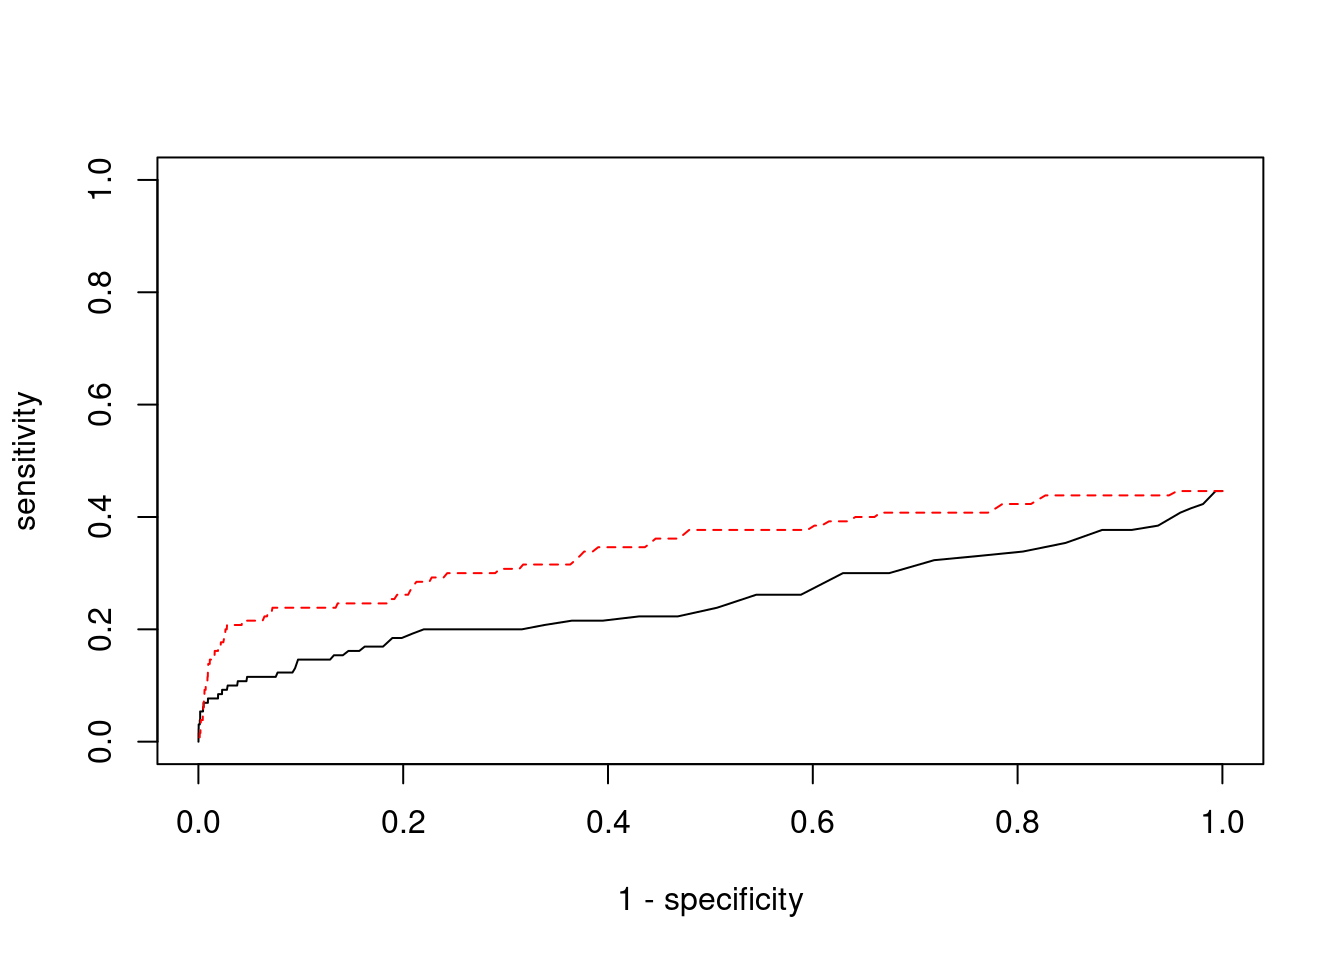
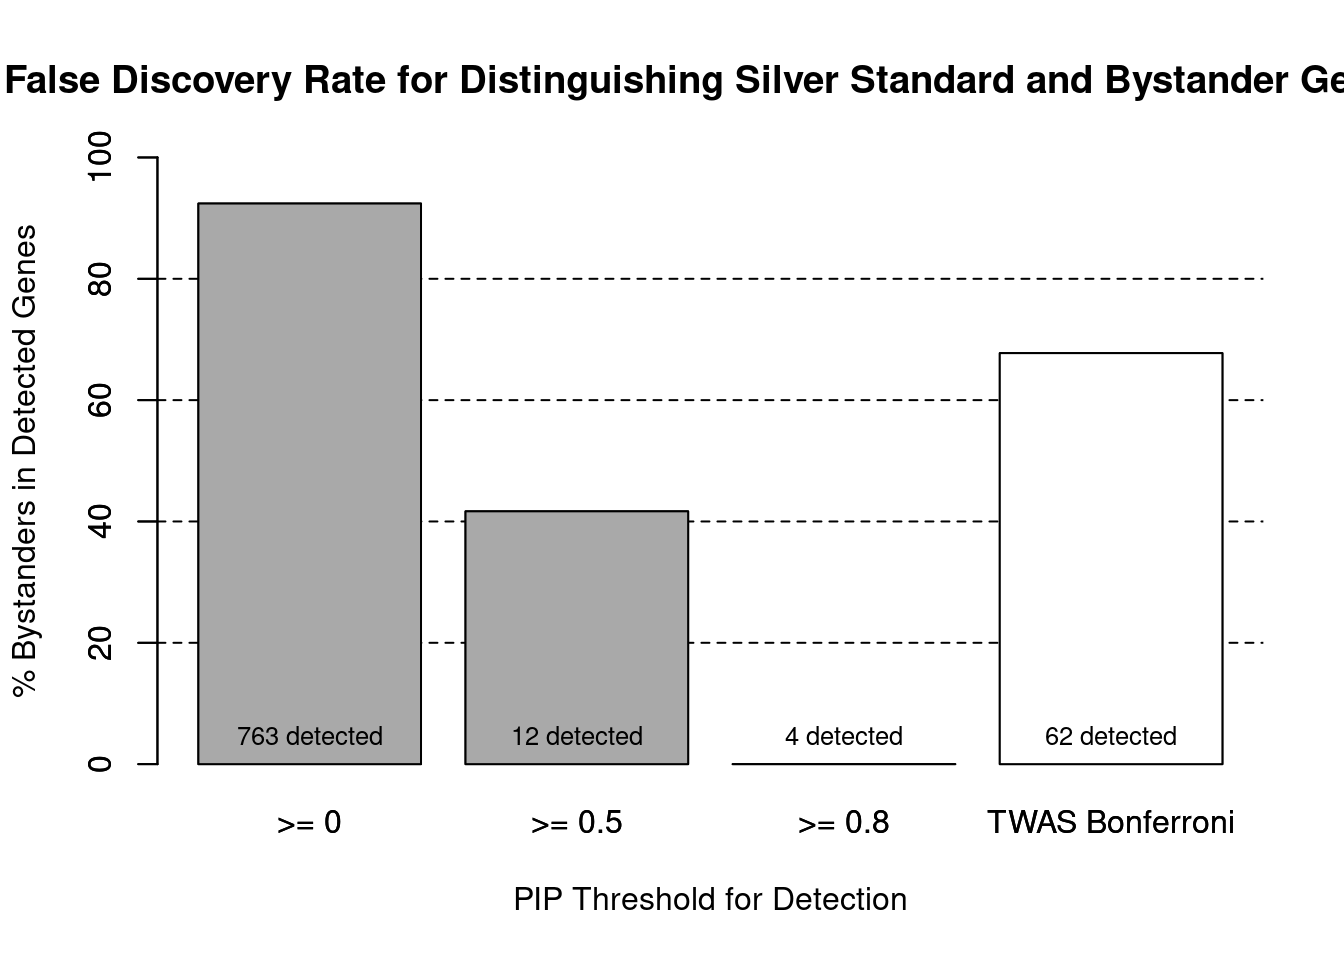
cTWAS is more precise than TWAS in distinguishing silver standard and bystander genes
#number of genes in known annotations (with imputed expression)
print(length(known_annotations))[1] 58#number of bystander genes (with imputed expression)
print(length(unrelated_genes))[1] 704#subset results to genes in known annotations or bystanders
ctwas_gene_res_subset <- ctwas_gene_res[ctwas_gene_res$genename %in% c(known_annotations, unrelated_genes),]
#assign ctwas and TWAS genes
ctwas_genes <- ctwas_gene_res_subset$genename[ctwas_gene_res_subset$susie_pip>0.8]
twas_genes <- ctwas_gene_res_subset$genename[abs(ctwas_gene_res_subset$z)>sig_thresh]
#significance threshold for TWAS
print(sig_thresh)
[1] 4.586#number of ctwas genes (in known annotations or bystanders)
length(ctwas_genes)[1] 4#number of TWAS genes (in known annotations or bystanders)
length(twas_genes)[1] 62#sensitivity / recall
sensitivity ctwas TWAS
0.06897 0.34483 #specificity / (1 - False Positive Rate)
specificity ctwas TWAS
1.0000 0.9403 #precision / PPV / (1 - False Discovery Rate)
precision ctwas TWAS
1.0000 0.3226 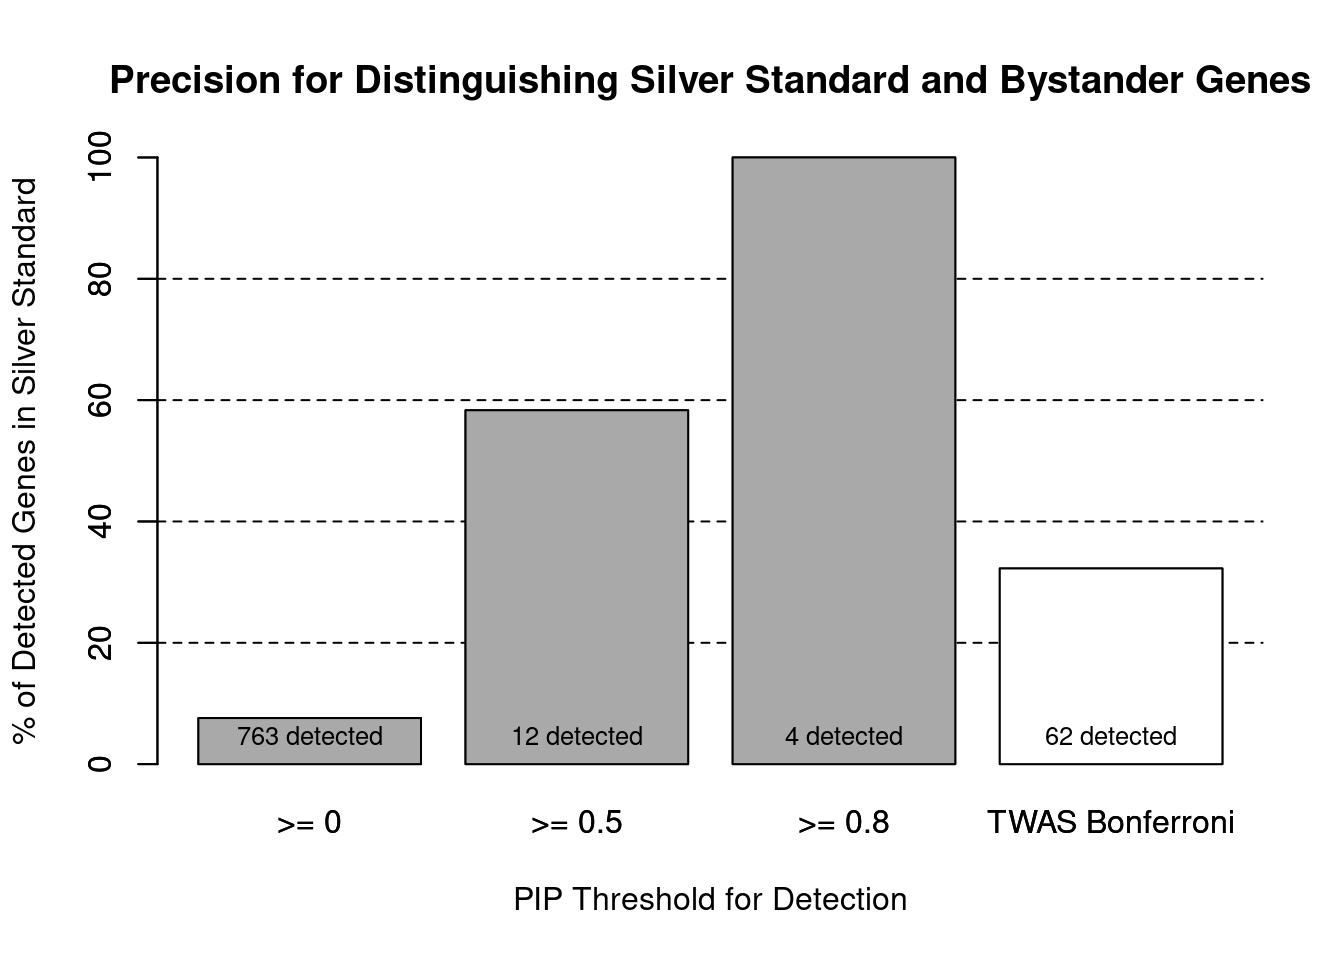
pip_range <- (0:1000)/1000
sensitivity <- rep(NA, length(pip_range))
specificity <- rep(NA, length(pip_range))

for (index in 1:length(pip_range)){
  pip <- pip_range[index]
  ctwas_genes <- ctwas_gene_res_subset$genename[ctwas_gene_res_subset$susie_pip>=pip]
  sensitivity[index] <- sum(ctwas_genes %in% known_annotations)/length(known_annotations)
  specificity[index] <- sum(!(unrelated_genes %in% ctwas_genes))/length(unrelated_genes)
}

plot(1-specificity, sensitivity, type="l", xlim=c(0,1), ylim=c(0,1), main="", xlab="1 - Specificity", ylab="Sensitivity")
title(expression("ROC Curve for cTWAS (black) and TWAS (" * phantom("red") * ")"))
title(expression(phantom("ROC Curve for cTWAS (black) and TWAS (") * "red" * phantom(")")), col.main="red")

sig_thresh_range <- seq(from=0, to=max(abs(ctwas_gene_res_subset$z)), length.out=length(pip_range))

for (index in 1:length(sig_thresh_range)){
  sig_thresh_plot <- sig_thresh_range[index]
  twas_genes <- ctwas_gene_res_subset$genename[abs(ctwas_gene_res_subset$z)>=sig_thresh_plot]
  sensitivity[index] <- sum(twas_genes %in% known_annotations)/length(known_annotations)
  specificity[index] <- sum(!(unrelated_genes %in% twas_genes))/length(unrelated_genes)
}

lines(1-specificity, sensitivity, xlim=c(0,1), ylim=c(0,1), col="red", lty=1)

abline(a=0,b=1,lty=3)

#add previously computed points from the analysis
ctwas_genes <- ctwas_gene_res_subset$genename[ctwas_gene_res_subset$susie_pip>0.8]
twas_genes <- ctwas_gene_res_subset$genename[abs(ctwas_gene_res_subset$z)>sig_thresh]

points(1-specificity_plot["ctwas"], sensitivity_plot["ctwas"], pch=21, bg="black")
points(1-specificity_plot["TWAS"], sensitivity_plot["TWAS"], pch=21, bg="red")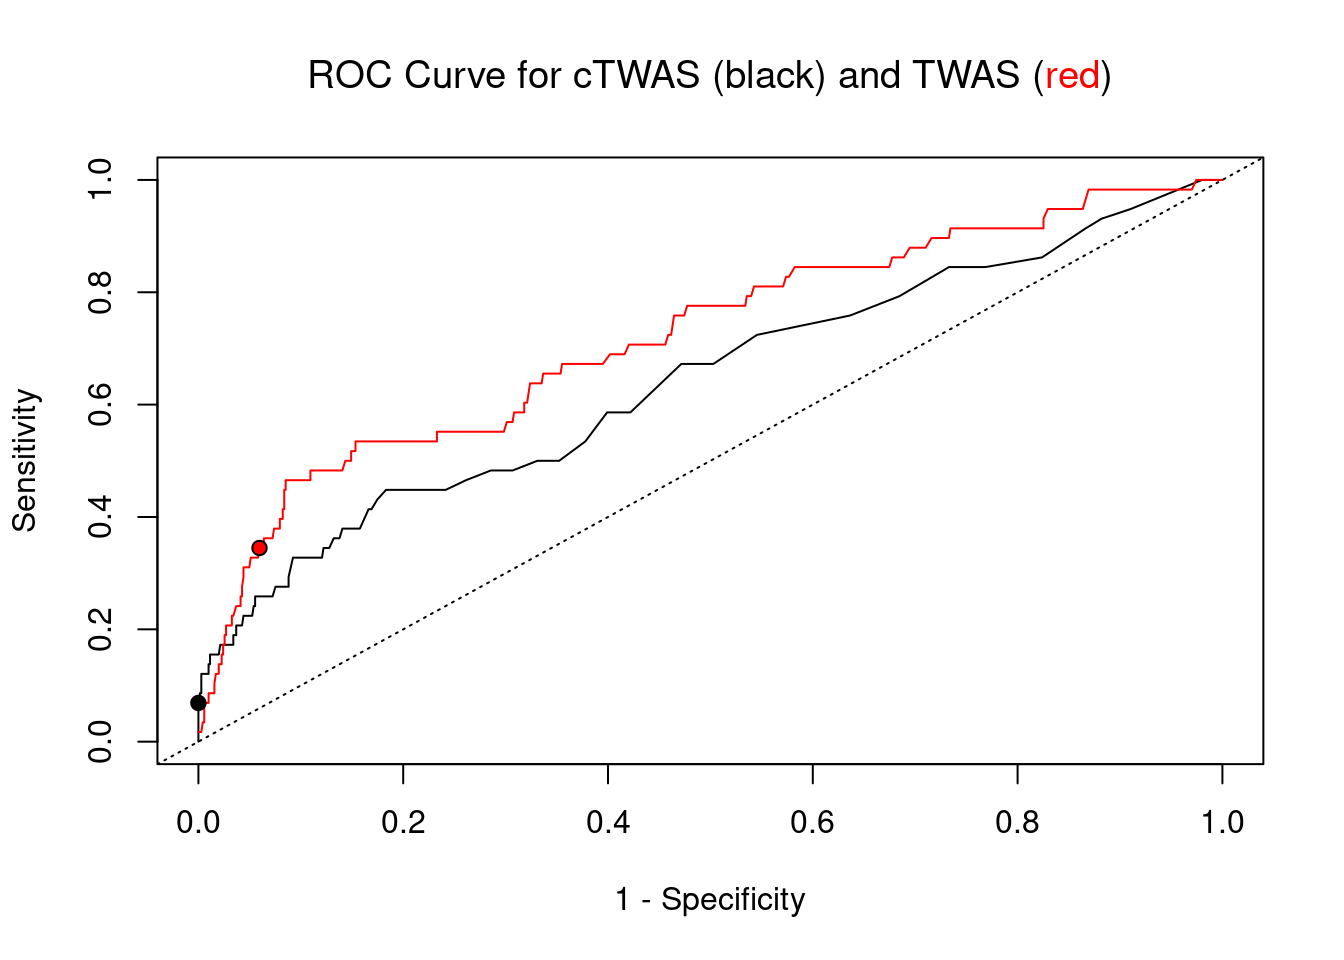
Undetected silver standard genes have low TWAS z-scores or stronger signal from nearby variants
#table of outcomes for silver standard genes
-sort(-table(silver_standard_case))
silver_standard_case
Not Imputed Insignificant z-score Nearby SNP(s)
72 38 16
Detected (PIP > 0.8)
4 #show inconclusive genes
silver_standard_case[silver_standard_case=="Inconclusive"]named character(0)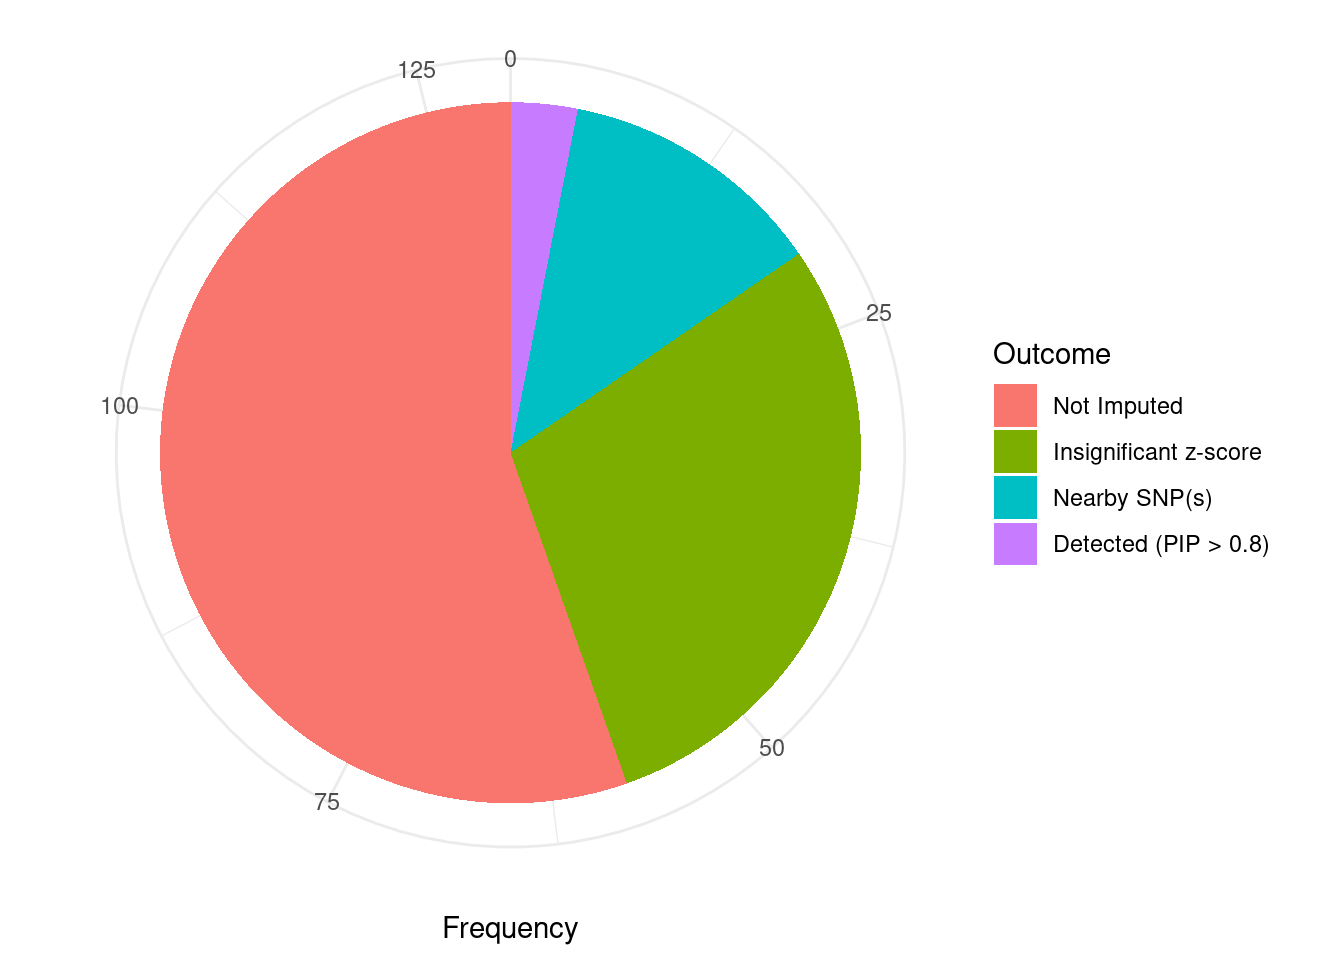
sessionInfo()R version 3.6.1 (2019-07-05)
Platform: x86_64-pc-linux-gnu (64-bit)
Running under: Scientific Linux 7.4 (Nitrogen)
Matrix products: default
BLAS/LAPACK: /software/openblas-0.2.19-el7-x86_64/lib/libopenblas_haswellp-r0.2.19.so
locale:
[1] LC_CTYPE=en_US.UTF-8 LC_NUMERIC=C
[3] LC_TIME=en_US.UTF-8 LC_COLLATE=en_US.UTF-8
[5] LC_MONETARY=en_US.UTF-8 LC_MESSAGES=en_US.UTF-8
[7] LC_PAPER=en_US.UTF-8 LC_NAME=C
[9] LC_ADDRESS=C LC_TELEPHONE=C
[11] LC_MEASUREMENT=en_US.UTF-8 LC_IDENTIFICATION=C
attached base packages:
[1] parallel stats4 stats graphics grDevices utils datasets
[8] methods base
other attached packages:
[1] GenomicRanges_1.36.1 GenomeInfoDb_1.20.0 IRanges_2.18.1
[4] S4Vectors_0.22.1 BiocGenerics_0.30.0 biomaRt_2.40.1
[7] readxl_1.3.1 forcats_0.5.1 stringr_1.4.0
[10] dplyr_1.0.7 purrr_0.3.4 readr_2.1.1
[13] tidyr_1.1.4 tidyverse_1.3.1 tibble_3.1.6
[16] WebGestaltR_0.4.4 disgenet2r_0.99.2 enrichR_3.0
[19] cowplot_1.1.1 ggplot2_3.3.5 workflowr_1.7.0
loaded via a namespace (and not attached):
[1] ggbeeswarm_0.6.0 colorspace_2.0-2 rjson_0.2.20
[4] ellipsis_0.3.2 rprojroot_2.0.2 XVector_0.24.0
[7] fs_1.5.2 rstudioapi_0.13 farver_2.1.0
[10] ggrepel_0.9.1 bit64_4.0.5 AnnotationDbi_1.46.0
[13] fansi_1.0.2 lubridate_1.8.0 xml2_1.3.3
[16] codetools_0.2-16 doParallel_1.0.17 cachem_1.0.6
[19] knitr_1.36 jsonlite_1.7.2 apcluster_1.4.8
[22] Cairo_1.5-12.2 broom_0.7.10 dbplyr_2.1.1
[25] compiler_3.6.1 httr_1.4.2 backports_1.4.1
[28] assertthat_0.2.1 Matrix_1.2-18 fastmap_1.1.0
[31] cli_3.1.0 later_0.8.0 prettyunits_1.1.1
[34] htmltools_0.5.2 tools_3.6.1 igraph_1.2.10
[37] GenomeInfoDbData_1.2.1 gtable_0.3.0 glue_1.6.2
[40] reshape2_1.4.4 doRNG_1.8.2 Rcpp_1.0.8
[43] Biobase_2.44.0 cellranger_1.1.0 jquerylib_0.1.4
[46] vctrs_0.3.8 svglite_1.2.2 iterators_1.0.14
[49] xfun_0.29 ps_1.6.0 rvest_1.0.2
[52] lifecycle_1.0.1 rngtools_1.5.2 XML_3.99-0.3
[55] zlibbioc_1.30.0 getPass_0.2-2 scales_1.1.1
[58] vroom_1.5.7 hms_1.1.1 promises_1.0.1
[61] yaml_2.2.1 curl_4.3.2 memoise_2.0.1
[64] ggrastr_1.0.1 gdtools_0.1.9 stringi_1.7.6
[67] RSQLite_2.2.8 highr_0.9 foreach_1.5.2
[70] rlang_1.0.1 pkgconfig_2.0.3 bitops_1.0-7
[73] evaluate_0.14 lattice_0.20-38 labeling_0.4.2
[76] bit_4.0.4 processx_3.5.2 tidyselect_1.1.1
[79] plyr_1.8.6 magrittr_2.0.2 R6_2.5.1
[82] generics_0.1.1 DBI_1.1.2 pillar_1.6.4
[85] haven_2.4.3 whisker_0.3-2 withr_2.4.3
[88] RCurl_1.98-1.5 modelr_0.1.8 crayon_1.5.0
[91] utf8_1.2.2 tzdb_0.2.0 rmarkdown_2.11
[94] progress_1.2.2 grid_3.6.1 data.table_1.14.2
[97] blob_1.2.2 callr_3.7.0 git2r_0.26.1
[100] reprex_2.0.1 digest_0.6.29 httpuv_1.5.1
[103] munsell_0.5.0 beeswarm_0.2.3 vipor_0.4.5