6 Traits, 5 tissues, eQTL + sQTL + stQTL
XSun
2024-10-15
Last updated: 2024-10-15
Checks: 6 1
Knit directory: multigroup_ctwas_analysis/
This reproducible R Markdown analysis was created with workflowr (version 1.7.0). The Checks tab describes the reproducibility checks that were applied when the results were created. The Past versions tab lists the development history.
The R Markdown is untracked by Git. To know which version of the R
Markdown file created these results, you’ll want to first commit it to
the Git repo. If you’re still working on the analysis, you can ignore
this warning. When you’re finished, you can run
wflow_publish to commit the R Markdown file and build the
HTML.
Great job! The global environment was empty. Objects defined in the global environment can affect the analysis in your R Markdown file in unknown ways. For reproduciblity it’s best to always run the code in an empty environment.
The command set.seed(20231112) was run prior to running
the code in the R Markdown file. Setting a seed ensures that any results
that rely on randomness, e.g. subsampling or permutations, are
reproducible.
Great job! Recording the operating system, R version, and package versions is critical for reproducibility.
Nice! There were no cached chunks for this analysis, so you can be confident that you successfully produced the results during this run.
Great job! Using relative paths to the files within your workflowr project makes it easier to run your code on other machines.
Great! You are using Git for version control. Tracking code development and connecting the code version to the results is critical for reproducibility.
The results in this page were generated with repository version d400755. See the Past versions tab to see a history of the changes made to the R Markdown and HTML files.
Note that you need to be careful to ensure that all relevant files for
the analysis have been committed to Git prior to generating the results
(you can use wflow_publish or
wflow_git_commit). workflowr only checks the R Markdown
file, but you know if there are other scripts or data files that it
depends on. Below is the status of the Git repository when the results
were generated:
Ignored files:
    Ignored:    .Rhistory

Untracked files:
    Untracked:  analysis/multi_group_6traits_15weights_ess.Rmd

Unstaged changes:
    Modified:   analysis/multi_group_compare_decidingweights_4traits_ess.Rmd
Note that any generated files, e.g. HTML, png, CSS, etc., are not included in this status report because it is ok for generated content to have uncommitted changes.
There are no past versions. Publish this analysis with
wflow_publish() to start tracking its development.
Overview
Tissues
The independent tissues are selected by single tissue analysis
Omics
eQTL, sQTL weights are from Predictdb
stQTL was a combination of Munro apa + rs QTL, if a gene has both rs-QTL and APA-QTL, we use rs-QTL.
Settings
stQTL from Munro
- Weight processing:
PredictDB:
all the PredictDB are converted from FUSION weights
- drop_strand_ambig = TRUE,
- scale_by_ld_variance = F (FUSION converted weights)
- load_predictdb_LD = F,
- Parameter estimation and fine-mapping
- niter_prefit = 5,
- niter = 30(default),
- filter_L = TRUE,
- group_prior_var_structure = “shared_type”,
- maxSNP = 20000,
- min_nonSNP_PIP = 0.5,
e + s QTL from predictdb
- Weight processing:
PredictDB (eqtl, sqtl)
- drop_strand_ambig = TRUE,
- scale_by_ld_variance = T
- load_predictdb_LD = F,
- Parameter estimation and fine-mapping
- group_prior_var_structure = “shared_type”,
- filter_L = TRUE,
- filter_nonSNP_PIP = FALSE,
- min_abs_corr = 0.1,
mem: 150g 10cores
library(ctwas)
library(ggplot2)
library(tidyverse)
library(pheatmap)

mapping_predictdb <- readRDS("/project2/xinhe/shared_data/multigroup_ctwas/weights/mapping_files/PredictDB_mapping.RDS")
mapping_munro <- readRDS("/project2/xinhe/shared_data/multigroup_ctwas/weights/mapping_files/Munro_mapping.RDS")
mapping_two <- rbind(mapping_predictdb,mapping_munro)

load("/project2/xinhe/shared_data/multigroup_ctwas/gwas/samplesize.rdata")


colors <- c(  "#1f77b4", "#ff7f0e", "#2ca02c", "#d62728",  "#9467bd", "#8c564b", "#e377c2", "#7f7f7f",  "#bcbd22",  "#17becf",  "#f7b6d2",  "#c5b0d5",  "#9edae5", "#ffbb78",  "#98df8a",  "#ff9896" )

plot_piechart <- function(ctwas_parameters, colors, by) {
  # Create the initial data frame
  data <- data.frame(
    category = names(ctwas_parameters$prop_heritability),
    percentage = ctwas_parameters$prop_heritability
  )

  # Split the category into context and type
  data <- data %>%
    mutate(
      context = sub("\\|.*", "", category),
      type = sub(".*\\|", "", category)
    )

  # Aggregate the data based on the 'by' parameter
  if (by == "type") {
    data <- data %>%
      group_by(type) %>%
      summarize(percentage = sum(percentage)) %>%
      mutate(category = type)  # Use type as the new category
  } else if (by == "context") {
    data <- data %>%
      group_by(context) %>%
      summarize(percentage = sum(percentage)) %>%
      mutate(category = context)  # Use context as the new category
  } else {
    stop("Invalid 'by' parameter. Use 'type' or 'context'.")
  }

  # Calculate percentage labels for the chart
  data$percentage_label <- paste0(round(data$percentage * 100, 1), "%")

  # Create the pie chart
  pie <- ggplot(data, aes(x = "", y = percentage, fill = category)) +
    geom_bar(stat = "identity", width = 1) +
    coord_polar("y", start = 0) +
    theme_void() +  # Remove background and axes
    geom_text(aes(label = percentage_label),
              position = position_stack(vjust = 0.5), size = 3) +  # Adjust size as needed
    scale_fill_manual(values = colors) +  # Custom colors
    labs(fill = "Category") +  # Legend title
    ggtitle("Percent of Heritability")  # Title

  return(pie)
}

draw_gene_piechart_type <- function(data, colors) {
  # Filter data based on combined_pip
  data <- data[data$combined_pip > 0.8, ]

  # Count occurrences by eQTL, sQTL, and stQTL
  byeQTL <- nrow(data[data$eQTL_pip / data$combined_pip > 0.8, ])
  bysQTL <- nrow(data[data$sQTL_pip / data$combined_pip > 0.8, ])
  bystQTL <- nrow(data[data$stQTL_pip / data$combined_pip > 0.8, ])

  # Count occurrences for combined sQTL and stQTL
  bysQTLstQTL <- nrow(data[((data$stQTL_pip + data$sQTL_pip) / data$combined_pip) > 0.8 &
                             data$stQTL_pip / data$combined_pip < 0.8 &
                             data$sQTL_pip / data$combined_pip < 0.8, ])

  # Count unspecified
  unspecified <- nrow(data) - byeQTL - bysQTL - bystQTL - bysQTLstQTL

  # Create vectors for plotting
  n <- c(byeQTL, bysQTL, bystQTL, bysQTLstQTL, unspecified)
  prop <- round(n / nrow(data), 3)
  labels = c("by eQTL", "by sQTL", "by stQTL", "by sQTL+stQTL", "unspecified")
  lab.ypos = cumsum(prop) - 0.5 * prop

  # Prepare the data frame for plotting
  df <- data.frame("n" = n,
                   "class" = labels,
                   "prop" = prop,
                   "lab.ypos" = lab.ypos)

  # Generate the pie chart
  ggplot(df, aes(x = "", y = prop, fill = class)) +
    geom_bar(width = 1, stat = "identity", color = "white") +
    coord_polar("y", start = 0) +
    geom_text(aes(label = n),
              position = position_stack(vjust = 0.5)) +
    scale_fill_manual(values = colors) +  # Ensure 'palette' is defined
    theme_void()
}

draw_gene_piechart_tissue <- function(data, colors){

  data <- data[data$combined_pip>0.8,]
  tissues <- colnames(data)[3:7]
  tissues <- sub("_pip$", "", tissues)
  colnames(data)[3:7] <- paste0("tissue",c(1:5))


  bytissue1 <- nrow(data[data$tissue1/data$combined_pip>0.8,])
  bytissue2 <- nrow(data[data$tissue2/data$combined_pip>0.8,])
  bytissue3 <- nrow(data[data$tissue3/data$combined_pip>0.8,])
  bytissue4 <- nrow(data[data$tissue4/data$combined_pip>0.8,])
  bytissue5 <- nrow(data[data$tissue5/data$combined_pip>0.8,])
  unspecified <- nrow(data)-bytissue1-bytissue2-bytissue3-bytissue4-bytissue5

  n <- c(bytissue1,bytissue2,bytissue3,bytissue4,bytissue5,unspecified)

  prop <- round(n/nrow(data),3)
  labels = c(tissues,"unspecified")
  lab.ypos = cumsum(prop) - 0.5*prop
  df <- data.frame("n" = n,
                   "class" = labels,
                   "prop" = prop,
                   "lab.ypos" = lab.ypos)
  p <- ggplot(df, aes(x = "", y = prop, fill = class)) +
    geom_bar(width = 1, stat = "identity", color = "white") +
    coord_polar("y", start = 0)+
    geom_text(aes(label = n),
              position = position_stack(vjust = 0.5))+
    scale_fill_manual(values = colors) +
    theme_void()

  return(p)
}

plot_heatmap <- function(heatmap_data, main) {

  rownames(heatmap_data) <- heatmap_data$gene_name
  heatmap_data <- heatmap_data %>% dplyr::select(-gene_name, -combined_pip)

  if(nrow(heatmap_data) ==1){

    heatmap_data <- rbind(heatmap_data,rep(0,ncol(heatmap_data)))
    rownames(heatmap_data)[2] <- "fake_gene_for_plotting"

  }

  heatmap_matrix <- as.matrix(heatmap_data)

  p <- pheatmap(heatmap_matrix,
                cluster_rows = F,   # Cluster the rows (genes)
                cluster_cols = F,   # Cluster the columns (QTL types)
                color = colorRampPalette(c("white", "red"))(50), # Color gradient
                display_numbers = TRUE, # Display numbers in cells
                main = main,labels_row = rownames(heatmap_data), silent = T)

  return(p)
}
aFib-ebi-a-GCST006414
trait <- "aFib-ebi-a-GCST006414"
gwas_n <- samplesize[trait]
tissue <- c("Heart_Atrial_Appendage","Artery_Tibial","Muscle_Skeletal","Stomach","Thyroid")

results_dir_multi <- paste0("/project/xinhe/xsun/multi_group_ctwas/11.multi_group_1008/results/",trait,"/")
ctwas_res_multi <- readRDS(paste0(results_dir_multi,trait,".ctwas.res.RDS"))

param_multi <- ctwas_res_multi$param
make_convergence_plots(param_multi, gwas_n, colors = colors)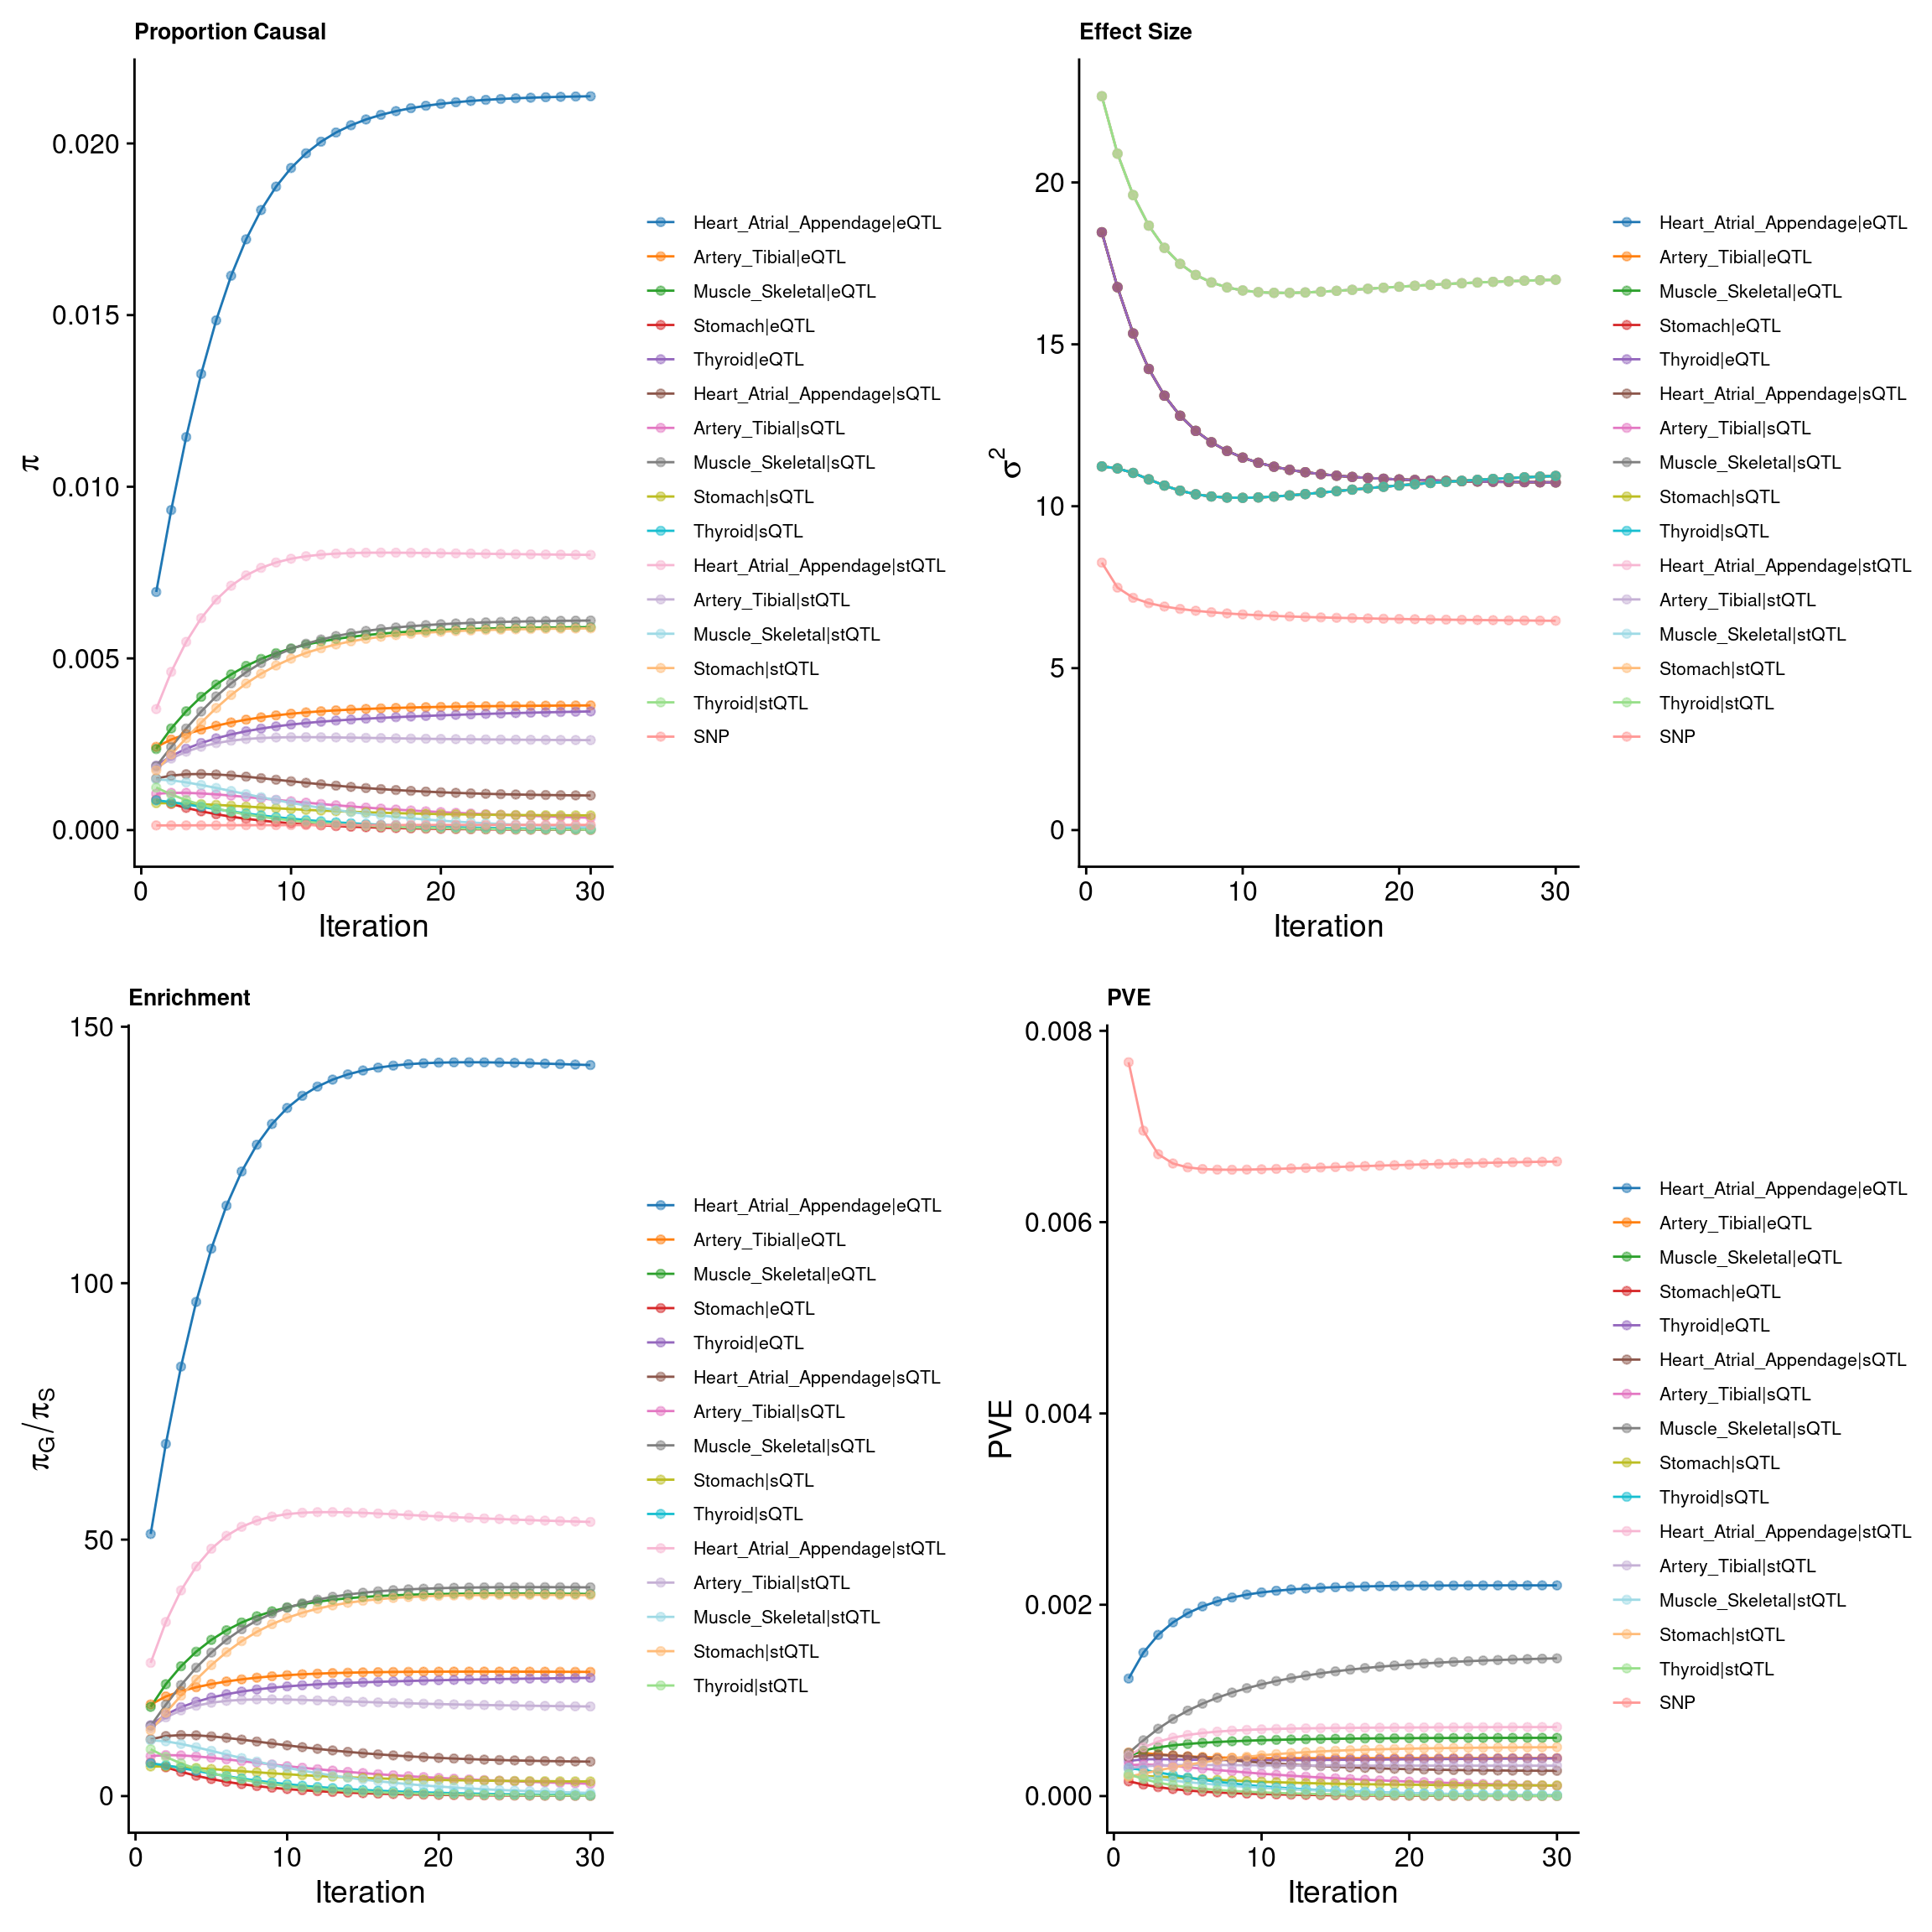
ctwas_parameters_multi <- summarize_param(param_multi, gwas_n)
pve_pie_by_type_multi <- plot_piechart(ctwas_parameters = ctwas_parameters_multi, colors = colors, by = "type")
pve_pie_by_context_multi <- plot_piechart(ctwas_parameters = ctwas_parameters_multi, colors = colors, by = "context")

gridExtra::grid.arrange(pve_pie_by_type_multi,pve_pie_by_context_multi, ncol = 2)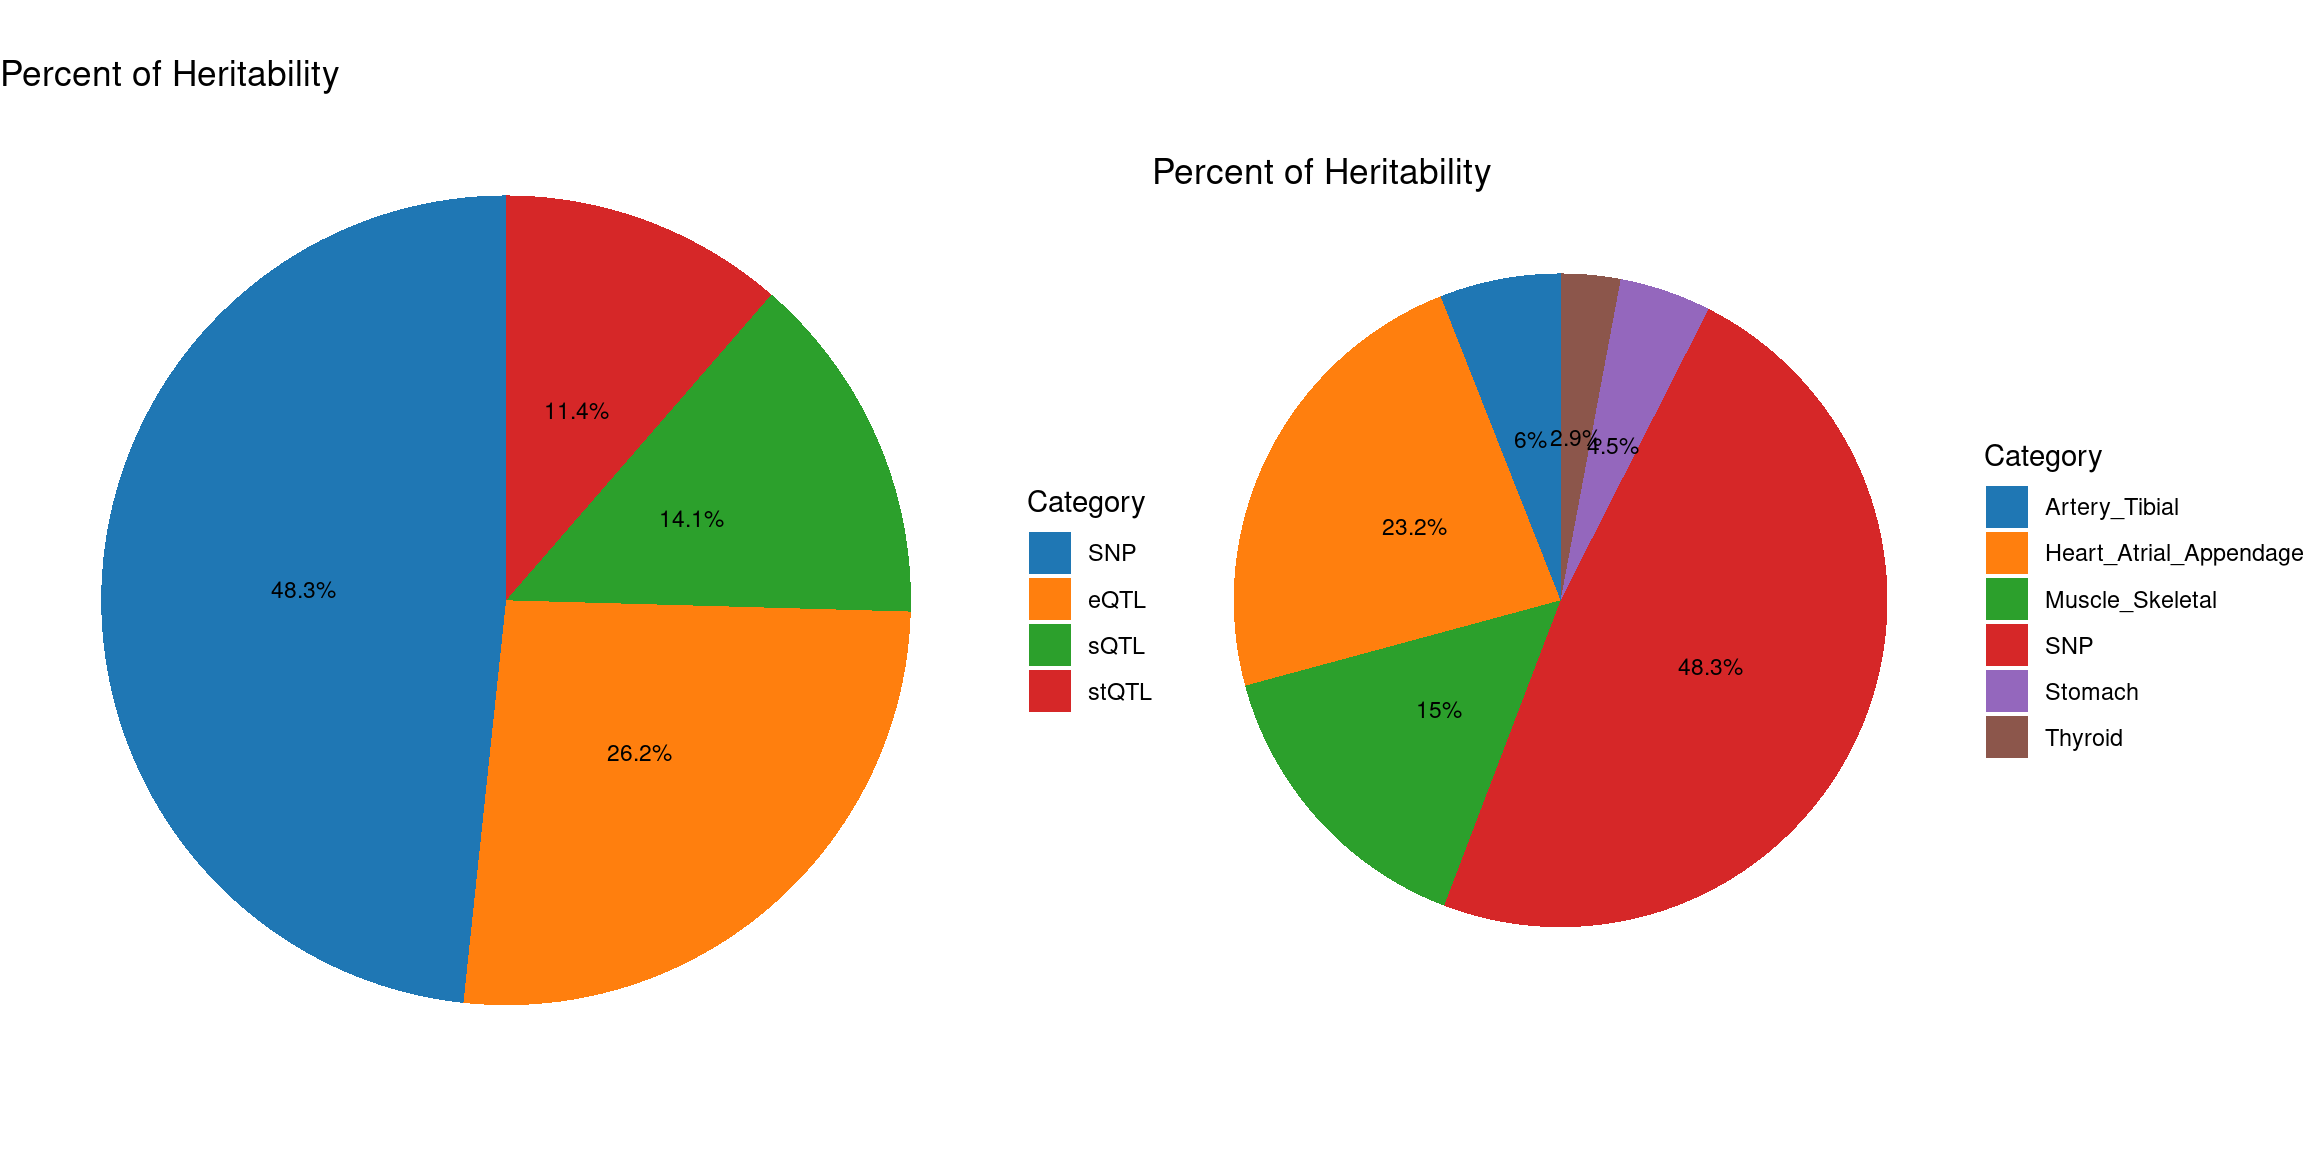
Fine-mapping
susie_alpha_res_multi <- ctwas_res_multi$susie_alpha_res

susie_alpha_res_multi <- anno_susie_alpha_res(susie_alpha_res_multi,
                                        mapping_table = mapping_two,
                                        map_by = "molecular_id",
                                        drop_unmapped = TRUE)
2024-10-15 14:56:28 INFO::Annotating susie alpha result ...
2024-10-15 14:56:30 INFO::Map molecular traits to genes
2024-10-15 14:56:31 INFO::Split PIPs for molecular traits mapped to multiple genescombined_pip_by_type_multi <- combine_gene_pips(susie_alpha_res_multi,
group_by = "gene_name",
by = "type",
method = "combine_cs",
filter_cs = TRUE,
include_cs_id = F)
combined_pip_by_type_cs_multi <- combine_gene_pips(susie_alpha_res_multi,
group_by = "gene_name",
by = "type",
method = "combine_cs",
filter_cs = TRUE,
include_cs_id = T)
combined_pip_by_context_cs_multi <- combine_gene_pips(susie_alpha_res_multi,
group_by = "gene_name",
by = "context",
method = "combine_cs",
filter_cs = TRUE,
include_cs_id = T)
combined_pip_by_context_multi <- combine_gene_pips(susie_alpha_res_multi,
group_by = "gene_name",
by = "context",
method = "combine_cs",
filter_cs = TRUE,
include_cs_id = F)
DT::datatable(combined_pip_by_type_cs_multi[combined_pip_by_type_cs_multi$combined_pip>0.8,],caption = htmltools::tags$caption( style = 'caption-side: topleft; text-align = left; color:black;','Combined PIP by omics'),options = list(pageLength = 5) )DT::datatable(combined_pip_by_context_cs_multi[combined_pip_by_context_cs_multi$combined_pip>0.8,],caption = htmltools::tags$caption( style = 'caption-side: topleft; text-align = left; color:black;','Combined PIP by tissue'),options = list(pageLength = 5) )pie1 <- draw_gene_piechart_type(data = combined_pip_by_type_multi,colors = colors)
pie2 <- draw_gene_piechart_tissue(data = combined_pip_by_context_multi,colors = colors)
gridExtra::grid.arrange(pie1,pie2, ncol = 2)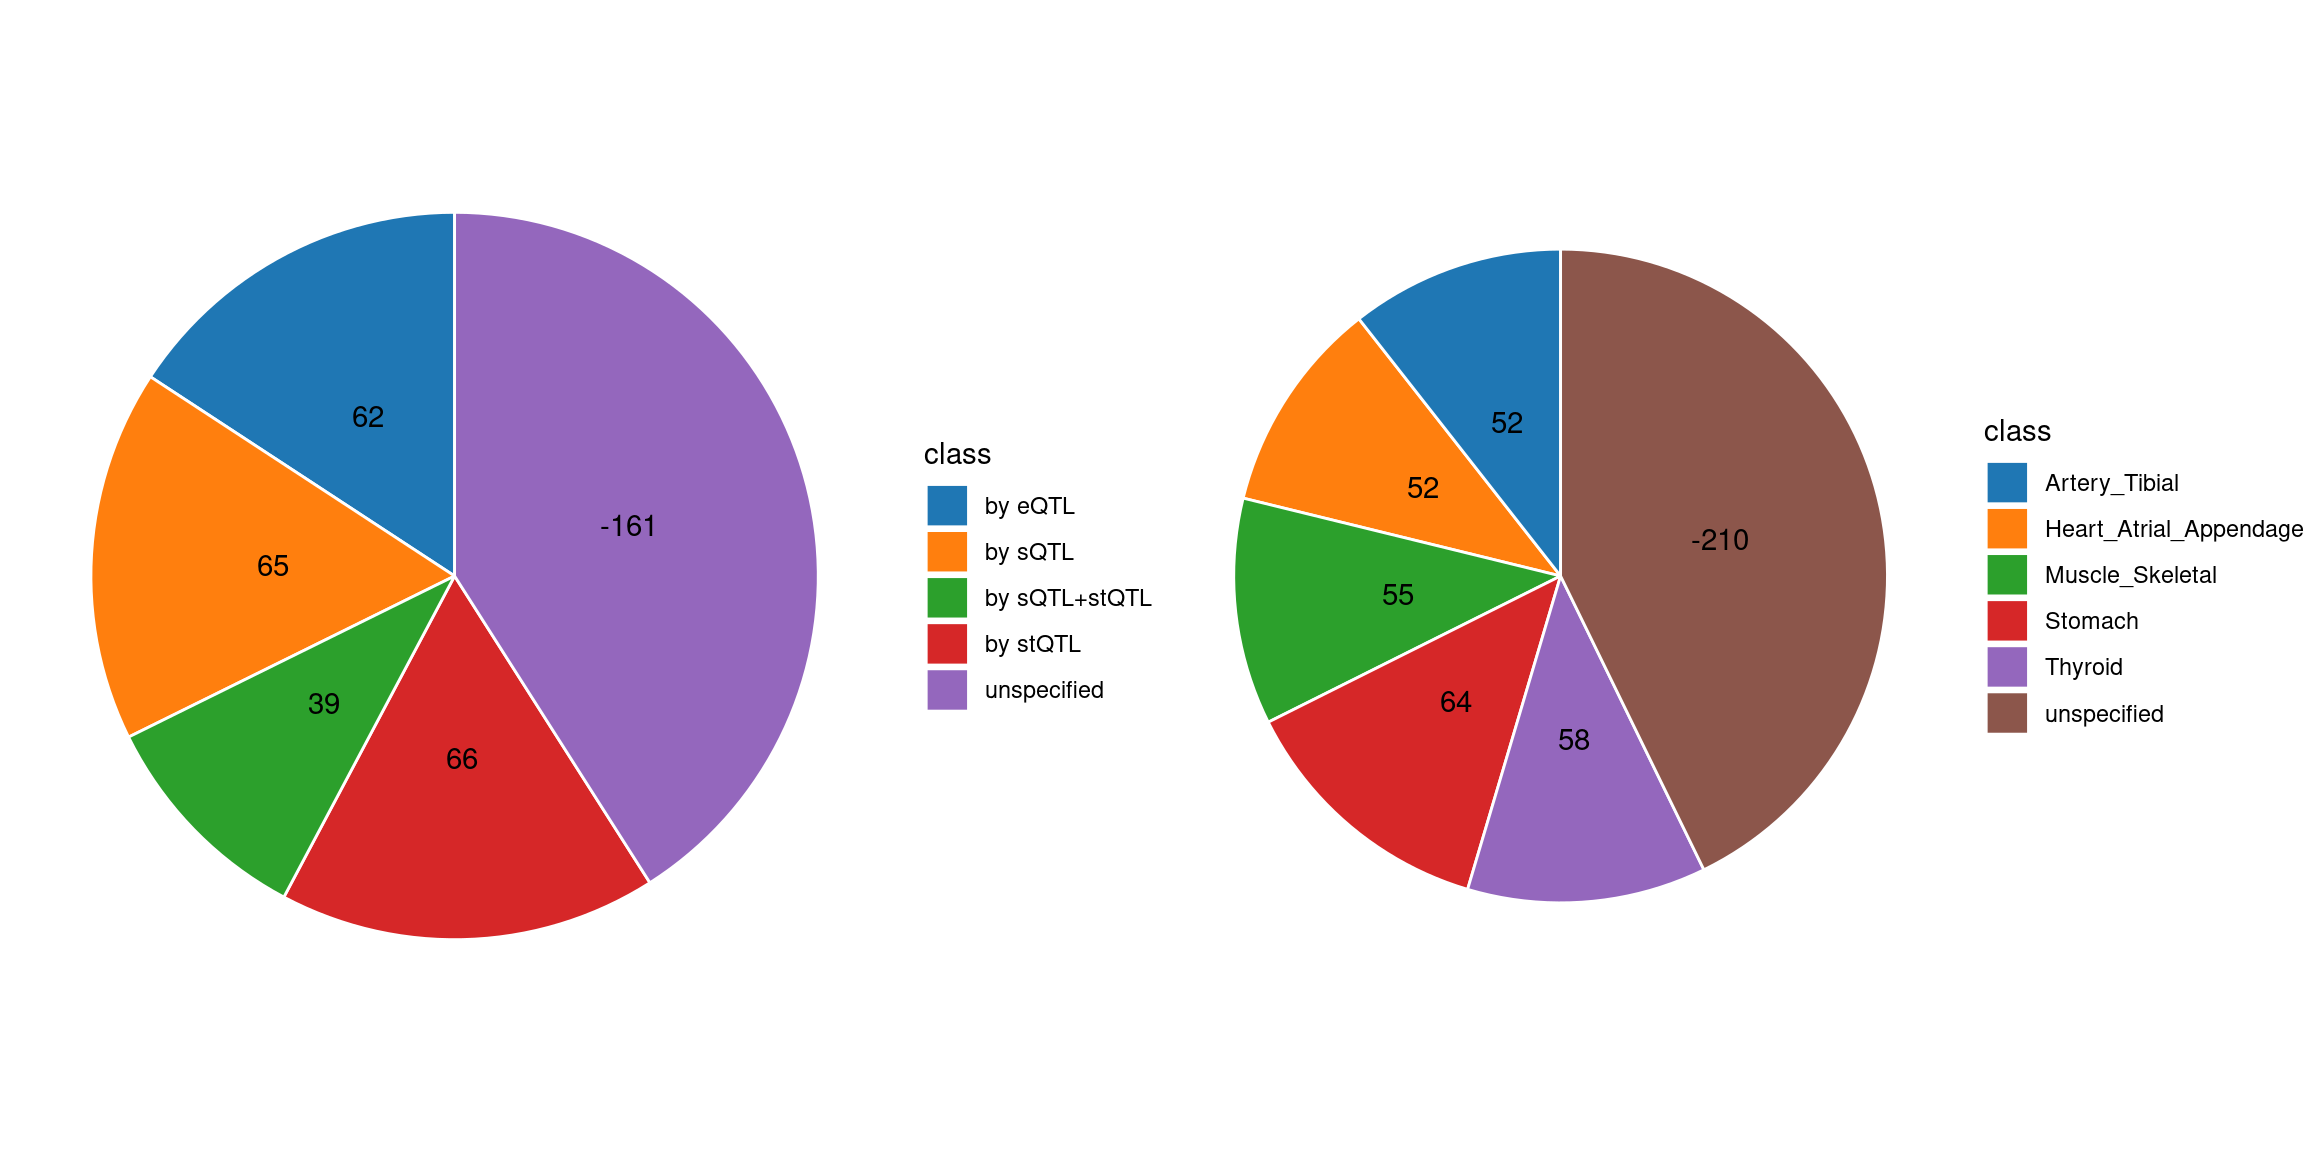
Comparing with single tissue + eQTL analysis
ctwas_res_single <- readRDS(paste0("/project/xinhe/xsun/multi_group_ctwas/10.single_tissue_1007/results/",trait,"/",tissue[1],"/",trait,"_",tissue[1], ".ctwas.res.RDS"))

susie_alpha_res_single <- ctwas_res_single$susie_alpha_res

susie_alpha_res_single <- anno_susie_alpha_res(susie_alpha_res_single,
                                        mapping_table = mapping_predictdb,
                                        map_by = "molecular_id",
                                        drop_unmapped = TRUE)
2024-10-15 14:56:44 INFO::Annotating susie alpha result ...
2024-10-15 14:56:44 INFO::Map molecular traits to genescombined_pip_by_type_single <- combine_gene_pips(susie_alpha_res_single,
group_by = "gene_name",
by = "type",
method = "combine_cs",
filter_cs = TRUE,
include_cs_id = F)
combined_pip_by_type_sig_single <- combined_pip_by_type_single[combined_pip_by_type_single$combined_pip > 0.8,]
combined_pip_by_type_sig_multi <- combined_pip_by_type_multi[combined_pip_by_type_multi$combined_pip > 0.8,]
sprintf("Number of genes with PIP > 0.8 -- Multi-group = %s", nrow(combined_pip_by_type_sig_multi))[1] "Number of genes with PIP > 0.8 -- Multi-group = 71"sprintf("Number of genes with PIP > 0.8 -- single eQTL = %s", nrow(combined_pip_by_type_sig_single))[1] "Number of genes with PIP > 0.8 -- single eQTL = 24"sprintf("Number of overlapped genes = %s", sum(combined_pip_by_type_sig_single$gene_name %in% combined_pip_by_type_sig_multi$gene_name))[1] "Number of overlapped genes = 23"genes_not_reported <- combined_pip_by_type_sig_single$gene_name[!combined_pip_by_type_sig_single$gene_name %in%combined_pip_by_type_sig_multi$gene_name]
DT::datatable(combined_pip_by_type_sig_single[combined_pip_by_type_sig_single$gene_name %in% genes_not_reported,],caption = htmltools::tags$caption( style = 'caption-side: topleft; text-align = left; color:black;','Genes not reported by multi-group analysis'),options = list(pageLength = 5) )DT::datatable(combined_pip_by_type_multi[combined_pip_by_type_multi$gene_name %in% genes_not_reported,],caption = htmltools::tags$caption( style = 'caption-side: topleft; text-align = left; color:black;','Genes not reported by multi-group analysis'),options = list(pageLength = 5) )gene_multi_unique_type <- combined_pip_by_type_sig_multi[!combined_pip_by_type_sig_multi$gene_name %in% combined_pip_by_type_sig_single$gene_name,]
p1 <- plot_heatmap(heatmap_data = gene_multi_unique_type, main = "Unique genes found by multi-group analysis")
combined_pip_by_context_sig_multi <- combined_pip_by_context_multi[combined_pip_by_context_multi$combined_pip > 0.8,]
gene_multi_unique_context <- combined_pip_by_context_sig_multi[!combined_pip_by_context_sig_multi$gene_name %in% combined_pip_by_type_sig_single$gene_name,]
p2 <- plot_heatmap(heatmap_data = gene_multi_unique_context, main = "Unique genes found by multi-group analysis")
g1 <- p1$gtable
g2 <- p2$gtable
gridExtra::grid.arrange(g1, g2, ncol=2)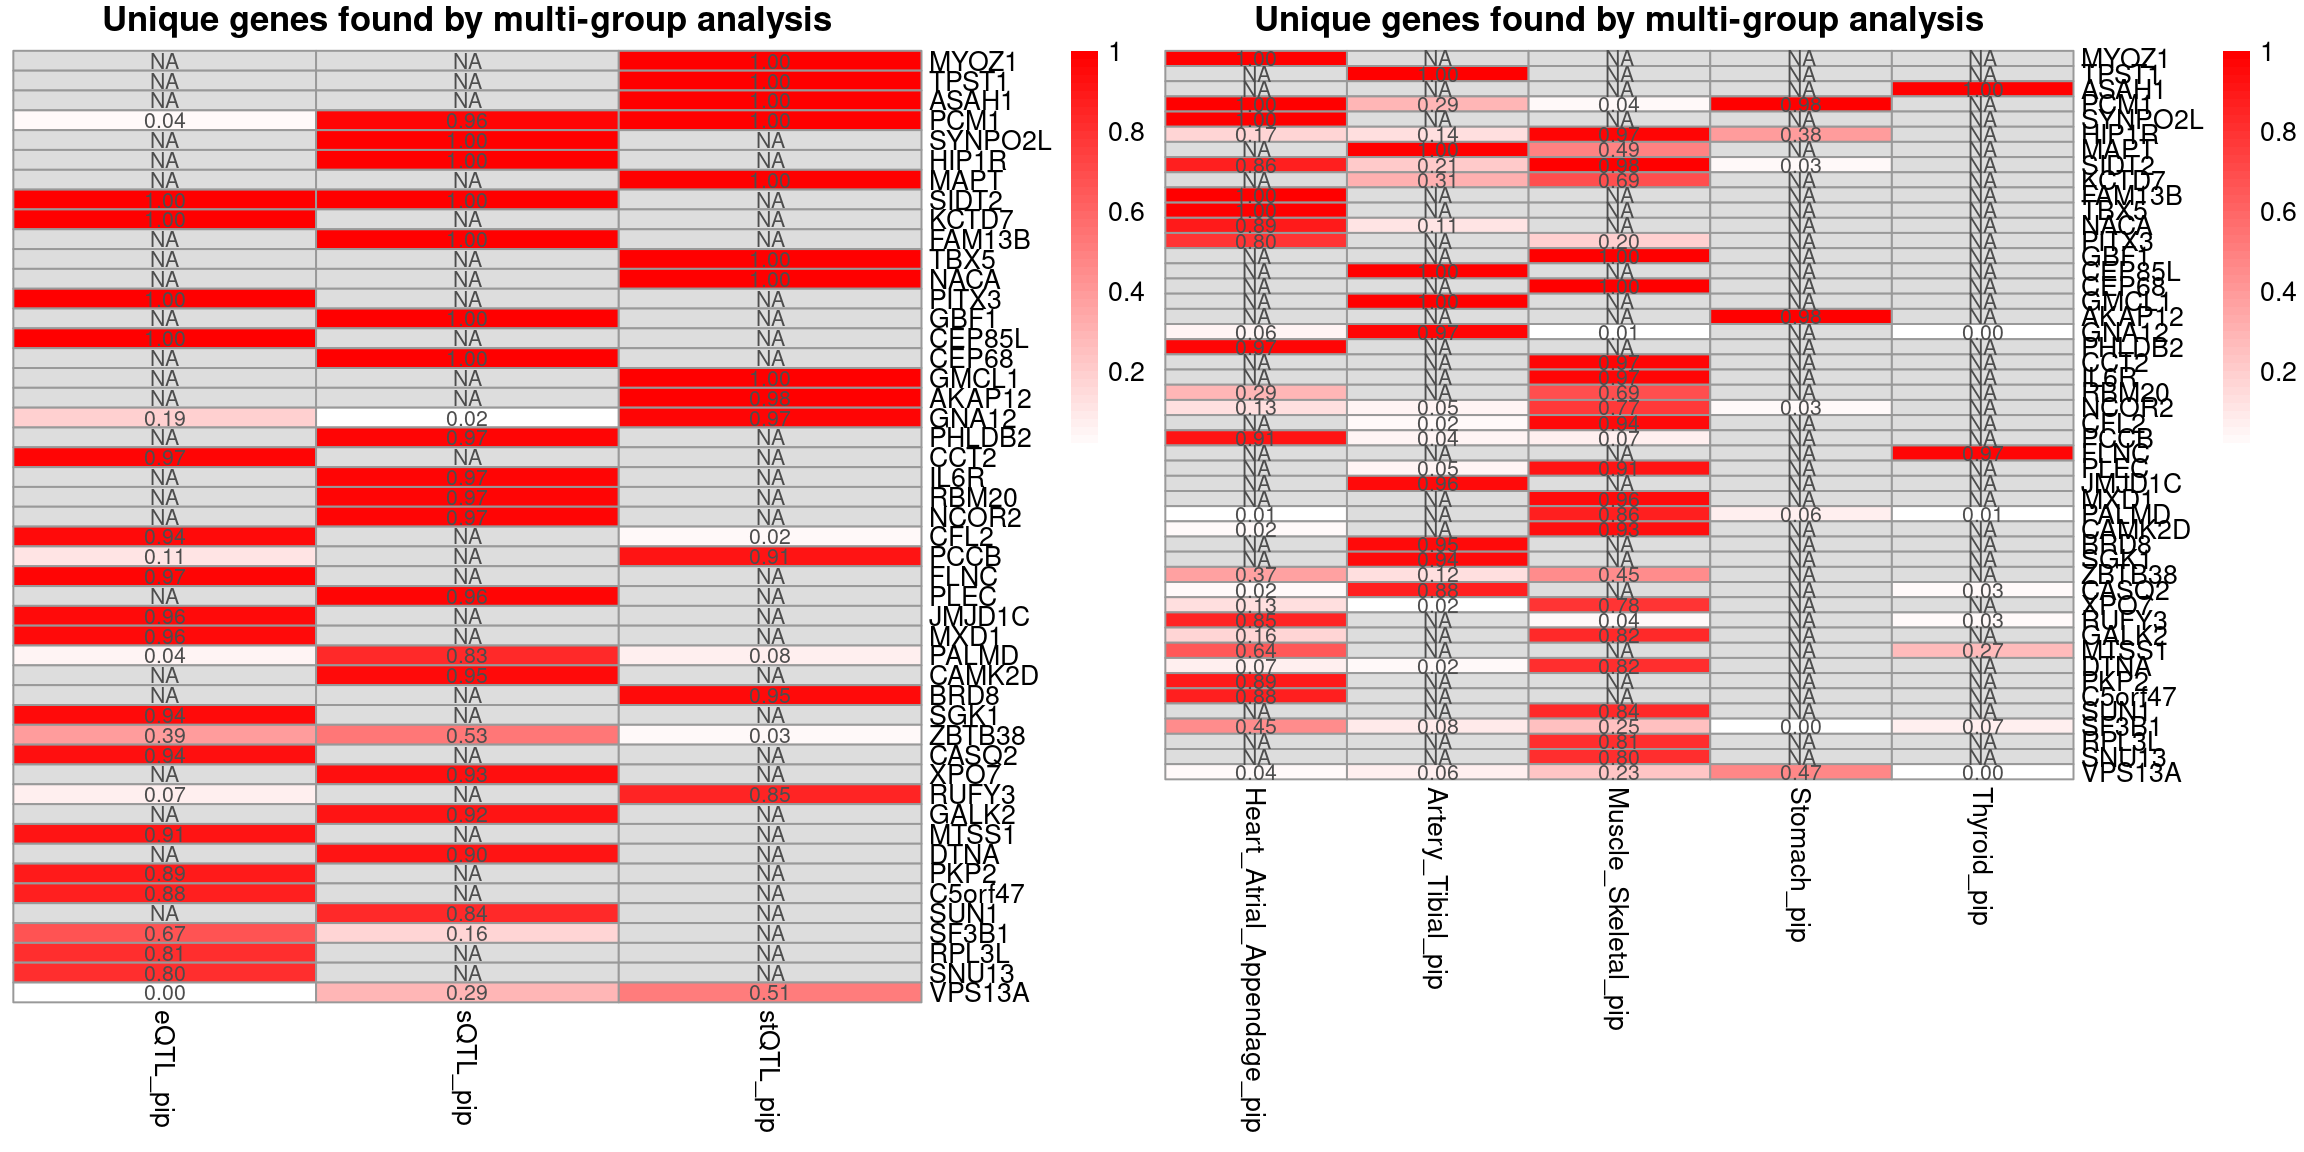
LDL-ukb-d-30780_irnt
trait <- "LDL-ukb-d-30780_irnt"
gwas_n <- samplesize[trait]
tissue <- c("Liver","Spleen","Esophagus_Mucosa","Esophagus_Gastroesophageal_Junction","Skin_Not_Sun_Exposed_Suprapubic")

results_dir_multi <- paste0("/project/xinhe/xsun/multi_group_ctwas/11.multi_group_1008/results/",trait,"/")
ctwas_res_multi <- readRDS(paste0(results_dir_multi,trait,".ctwas.res.RDS"))

param_multi <- ctwas_res_multi$param
make_convergence_plots(param_multi, gwas_n, colors = colors)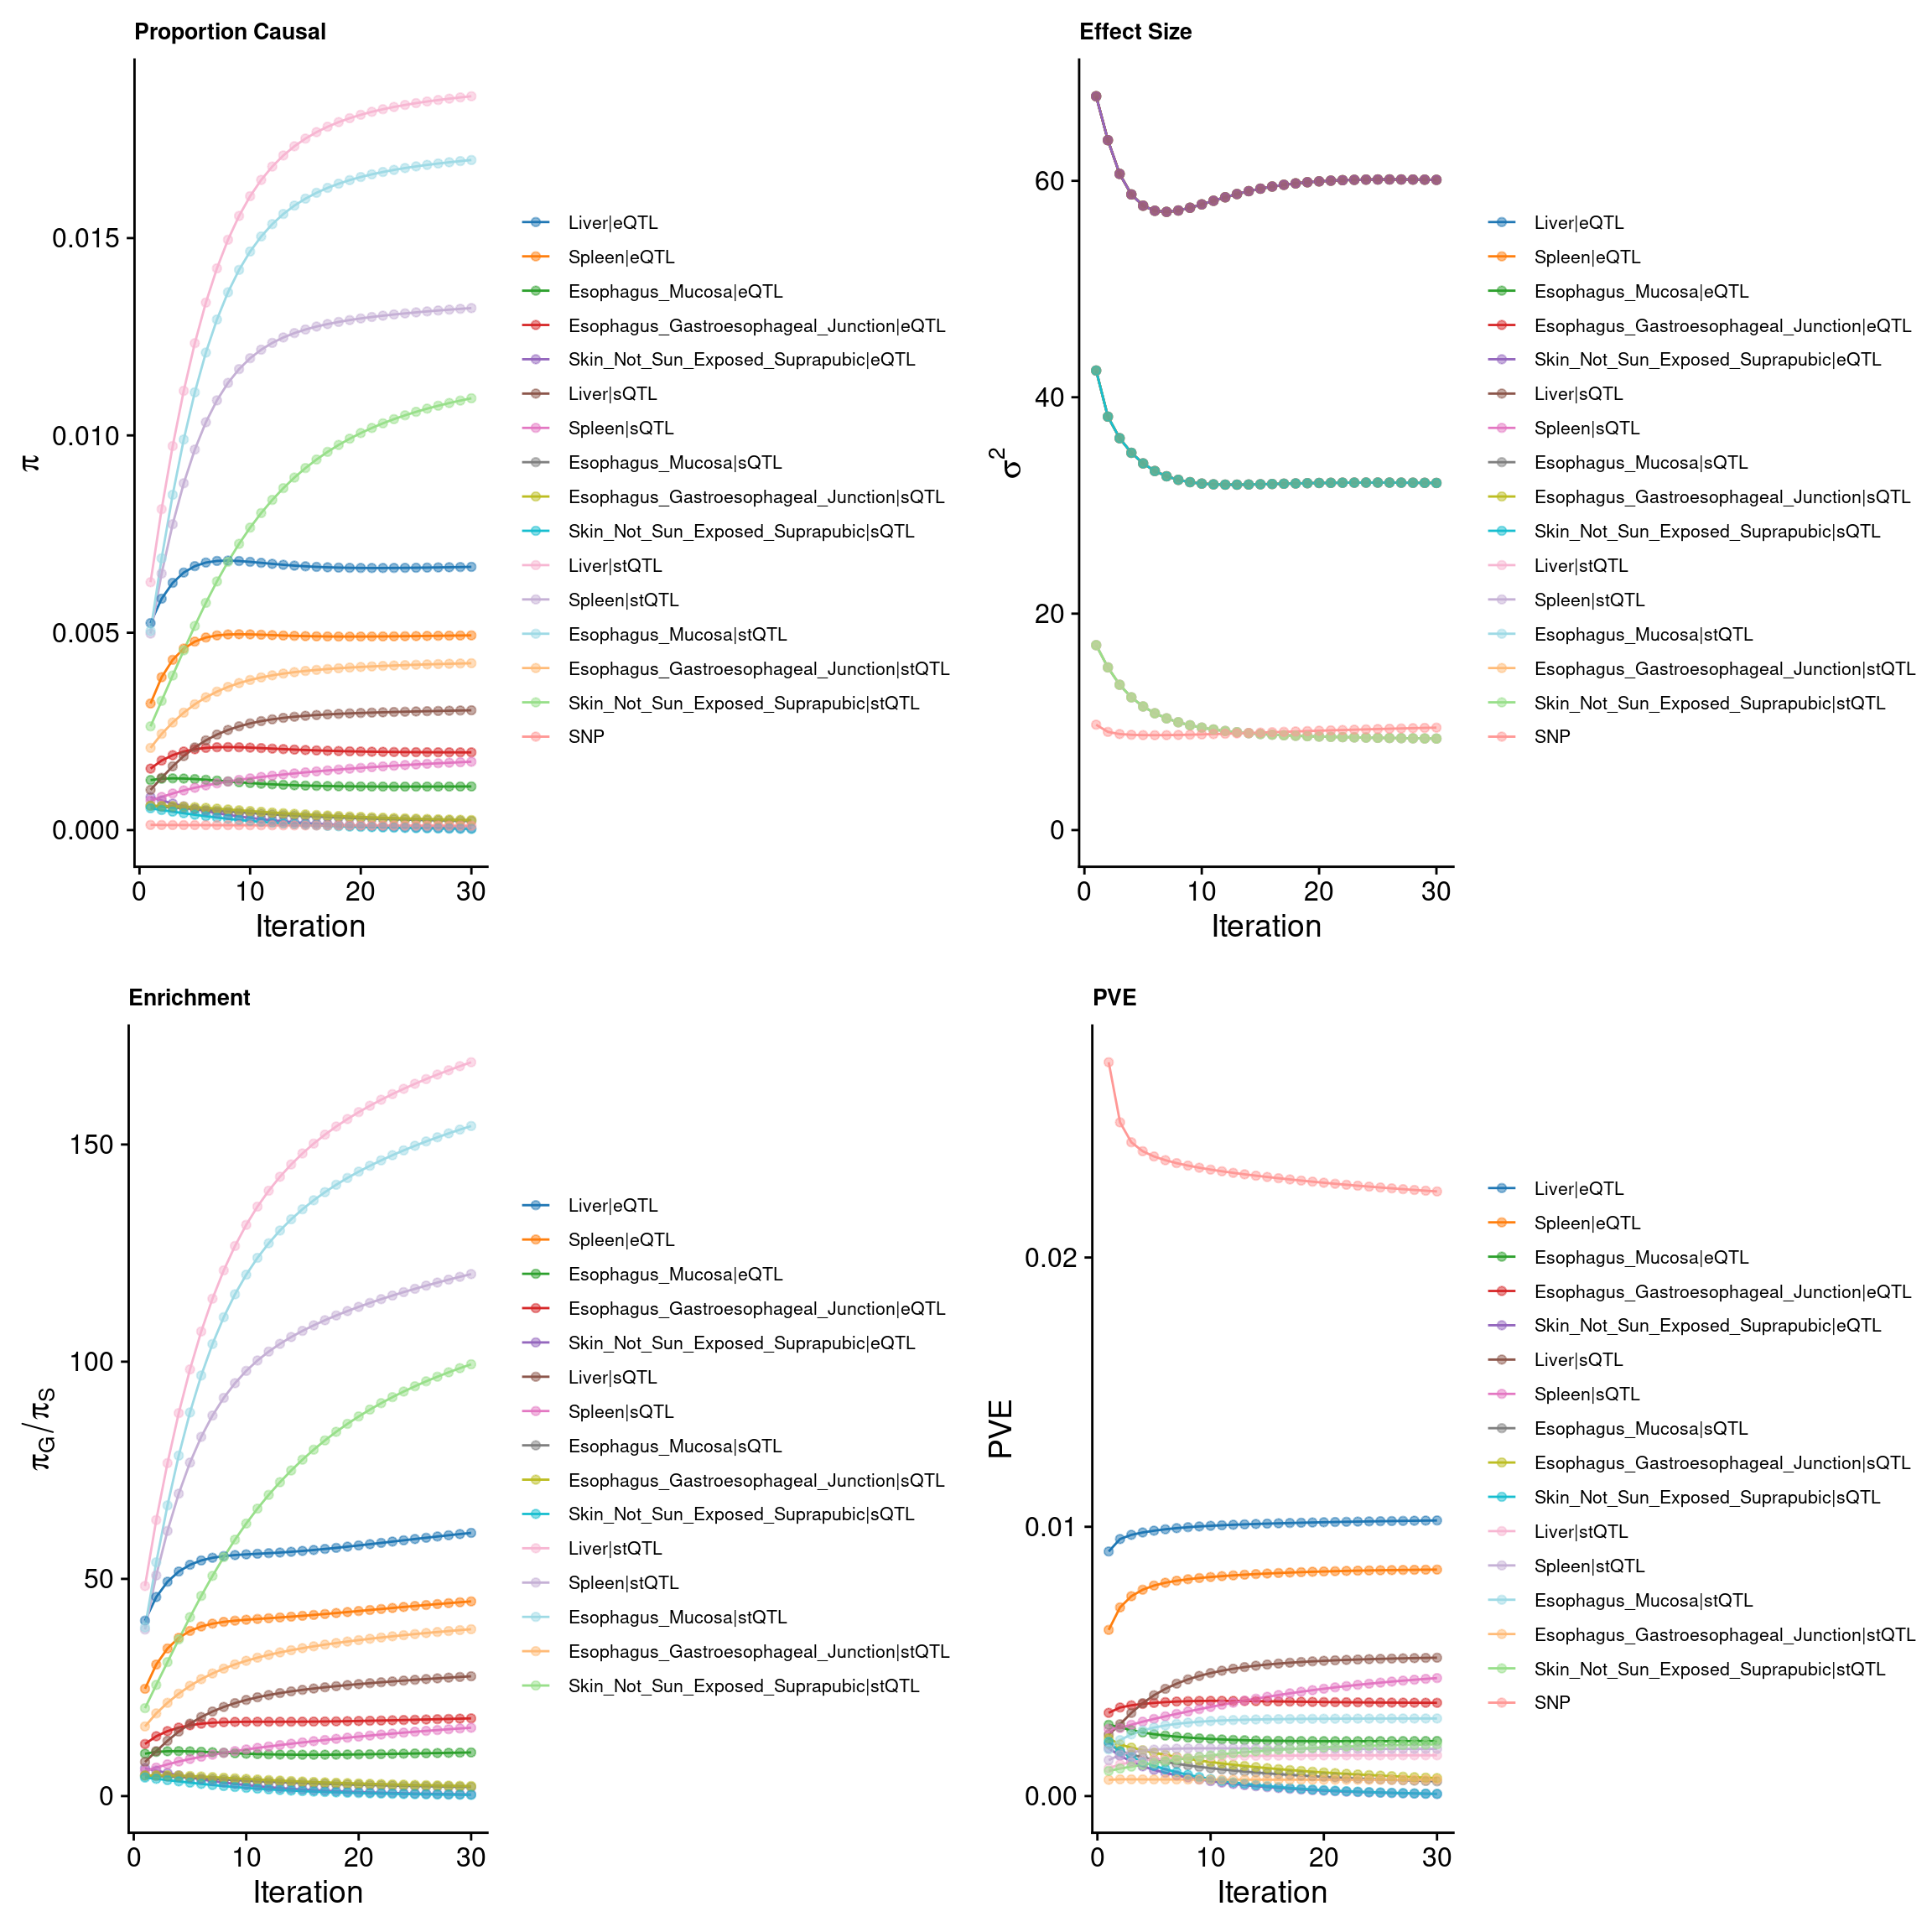
ctwas_parameters_multi <- summarize_param(param_multi, gwas_n)
pve_pie_by_type_multi <- plot_piechart(ctwas_parameters = ctwas_parameters_multi, colors = colors, by = "type")
pve_pie_by_context_multi <- plot_piechart(ctwas_parameters = ctwas_parameters_multi, colors = colors, by = "context")

gridExtra::grid.arrange(pve_pie_by_type_multi,pve_pie_by_context_multi, ncol = 2)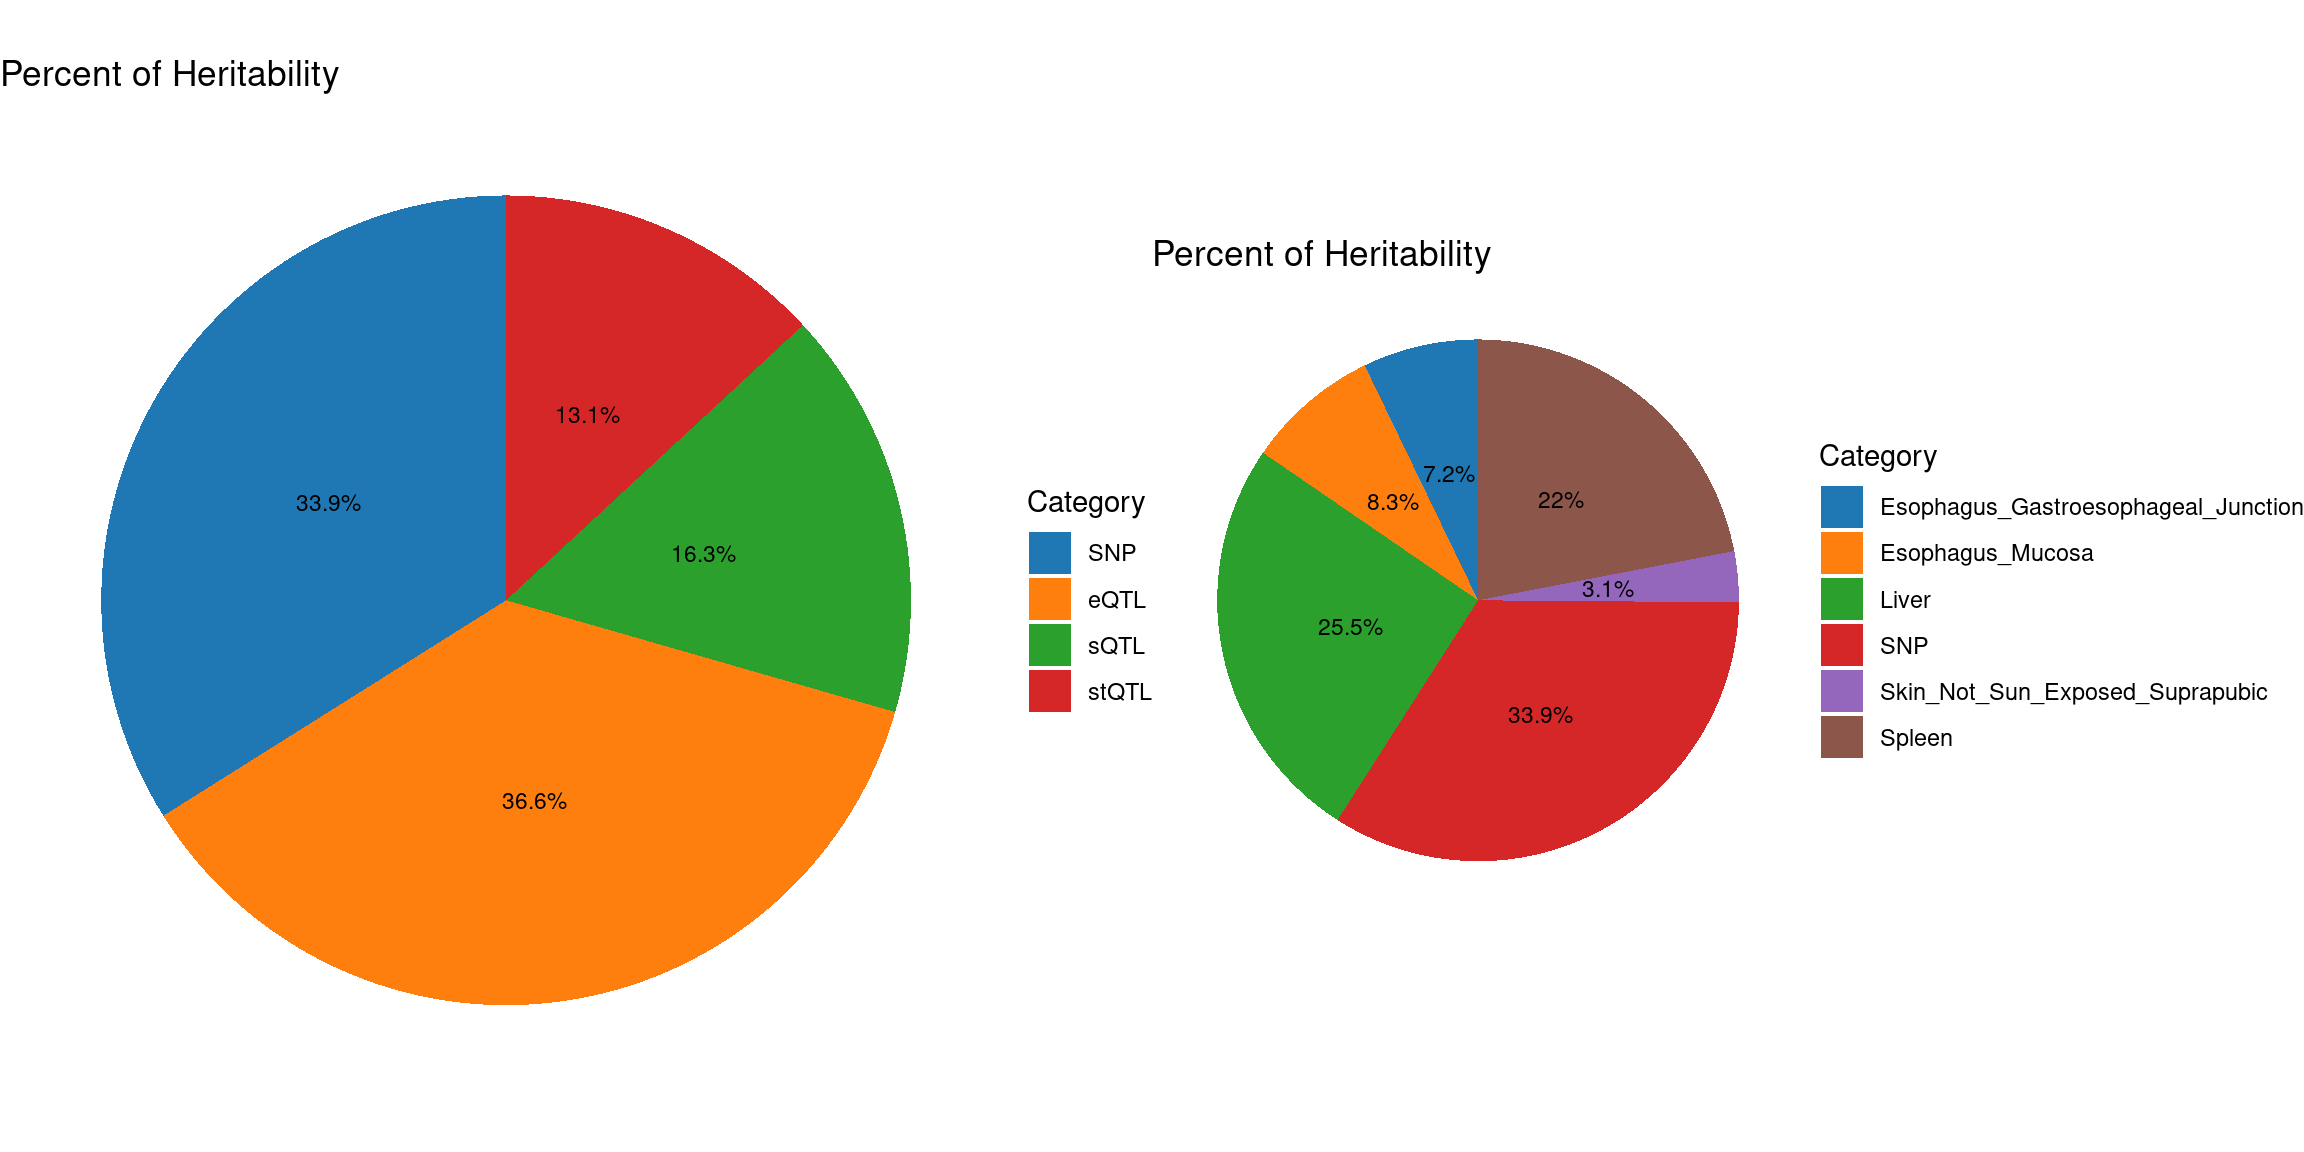
Fine-mapping
susie_alpha_res_multi <- ctwas_res_multi$susie_alpha_res

susie_alpha_res_multi <- anno_susie_alpha_res(susie_alpha_res_multi,
                                        mapping_table = mapping_two,
                                        map_by = "molecular_id",
                                        drop_unmapped = TRUE)
2024-10-15 14:56:58 INFO::Annotating susie alpha result ...
2024-10-15 14:56:58 INFO::Map molecular traits to genes
2024-10-15 14:57:01 INFO::Split PIPs for molecular traits mapped to multiple genescombined_pip_by_type_multi <- combine_gene_pips(susie_alpha_res_multi,
group_by = "gene_name",
by = "type",
method = "combine_cs",
filter_cs = TRUE,
include_cs_id = F)
combined_pip_by_type_cs_multi <- combine_gene_pips(susie_alpha_res_multi,
group_by = "gene_name",
by = "type",
method = "combine_cs",
filter_cs = TRUE,
include_cs_id = T)
combined_pip_by_context_cs_multi <- combine_gene_pips(susie_alpha_res_multi,
group_by = "gene_name",
by = "context",
method = "combine_cs",
filter_cs = TRUE,
include_cs_id = T)
combined_pip_by_context_multi <- combine_gene_pips(susie_alpha_res_multi,
group_by = "gene_name",
by = "context",
method = "combine_cs",
filter_cs = TRUE,
include_cs_id = F)
DT::datatable(combined_pip_by_type_cs_multi[combined_pip_by_type_cs_multi$combined_pip>0.8,],caption = htmltools::tags$caption( style = 'caption-side: topleft; text-align = left; color:black;','Combined PIP by omics'),options = list(pageLength = 5) )DT::datatable(combined_pip_by_context_cs_multi[combined_pip_by_context_cs_multi$combined_pip>0.8,],caption = htmltools::tags$caption( style = 'caption-side: topleft; text-align = left; color:black;','Combined PIP by tissue'),options = list(pageLength = 5) )pie1 <- draw_gene_piechart_type(data = combined_pip_by_type_multi,colors = colors)
pie2 <- draw_gene_piechart_tissue(data = combined_pip_by_context_multi,colors = colors)
gridExtra::grid.arrange(pie1,pie2, ncol = 2)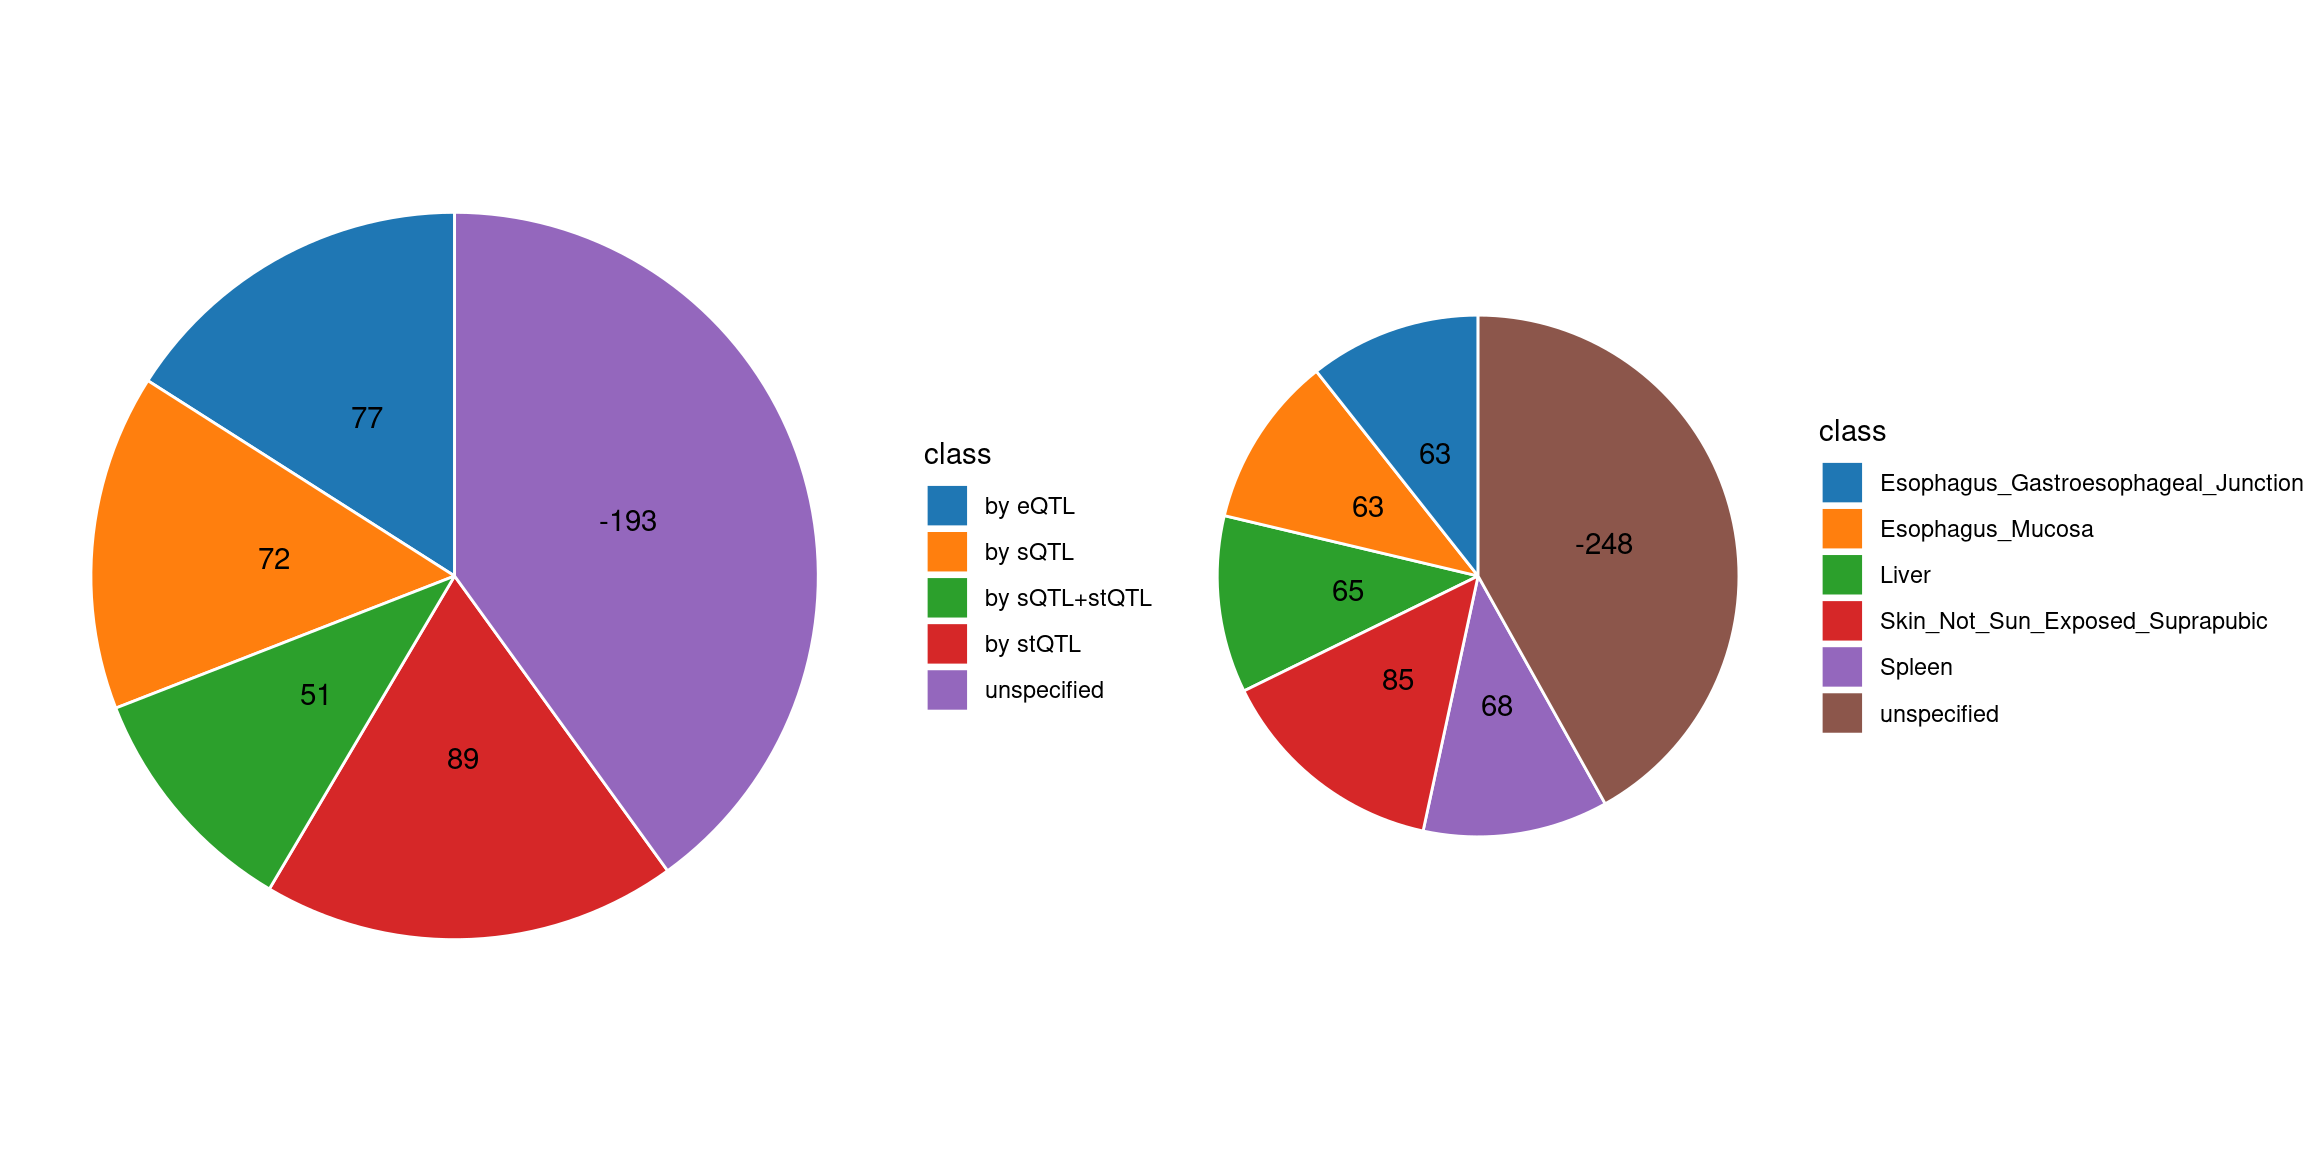
Comparing with single tissue + eQTL analysis
ctwas_res_single <- readRDS(paste0("/project/xinhe/xsun/multi_group_ctwas/10.single_tissue_1007/results/",trait,"/",tissue[1],"/",trait,"_",tissue[1], ".ctwas.res.RDS"))

susie_alpha_res_single <- ctwas_res_single$susie_alpha_res

susie_alpha_res_single <- anno_susie_alpha_res(susie_alpha_res_single,
                                        mapping_table = mapping_predictdb,
                                        map_by = "molecular_id",
                                        drop_unmapped = TRUE)
2024-10-15 14:57:13 INFO::Annotating susie alpha result ...
2024-10-15 14:57:13 INFO::Map molecular traits to genescombined_pip_by_type_single <- combine_gene_pips(susie_alpha_res_single,
group_by = "gene_name",
by = "type",
method = "combine_cs",
filter_cs = TRUE,
include_cs_id = F)
combined_pip_by_type_sig_single <- combined_pip_by_type_single[combined_pip_by_type_single$combined_pip > 0.8,]
combined_pip_by_type_sig_multi <- combined_pip_by_type_multi[combined_pip_by_type_multi$combined_pip > 0.8,]
sprintf("Number of genes with PIP > 0.8 -- Multi-group = %s", nrow(combined_pip_by_type_sig_multi))[1] "Number of genes with PIP > 0.8 -- Multi-group = 96"sprintf("Number of genes with PIP > 0.8 -- single eQTL = %s", nrow(combined_pip_by_type_sig_single))[1] "Number of genes with PIP > 0.8 -- single eQTL = 31"sprintf("Number of overlapped genes = %s", sum(combined_pip_by_type_sig_single$gene_name %in% combined_pip_by_type_sig_multi$gene_name))[1] "Number of overlapped genes = 28"genes_not_reported <- combined_pip_by_type_sig_single$gene_name[!combined_pip_by_type_sig_single$gene_name %in%combined_pip_by_type_sig_multi$gene_name]
DT::datatable(combined_pip_by_type_sig_single[combined_pip_by_type_sig_single$gene_name %in% genes_not_reported,],caption = htmltools::tags$caption( style = 'caption-side: topleft; text-align = left; color:black;','Genes not reported by multi-group analysis'),options = list(pageLength = 5) )DT::datatable(combined_pip_by_type_multi[combined_pip_by_type_multi$gene_name %in% genes_not_reported,],caption = htmltools::tags$caption( style = 'caption-side: topleft; text-align = left; color:black;','Genes not reported by multi-group analysis'),options = list(pageLength = 5) )gene_multi_unique_type <- combined_pip_by_type_sig_multi[!combined_pip_by_type_sig_multi$gene_name %in% combined_pip_by_type_sig_single$gene_name,]
p1 <- plot_heatmap(heatmap_data = gene_multi_unique_type, main = "Unique genes found by multi-group analysis")
combined_pip_by_context_sig_multi <- combined_pip_by_context_multi[combined_pip_by_context_multi$combined_pip > 0.8,]
gene_multi_unique_context <- combined_pip_by_context_sig_multi[!combined_pip_by_context_sig_multi$gene_name %in% combined_pip_by_type_sig_single$gene_name,]
p2 <- plot_heatmap(heatmap_data = gene_multi_unique_context, main = "Unique genes found by multi-group analysis")
g1 <- p1$gtable
g2 <- p2$gtable
gridExtra::grid.arrange(g1, g2, ncol=2)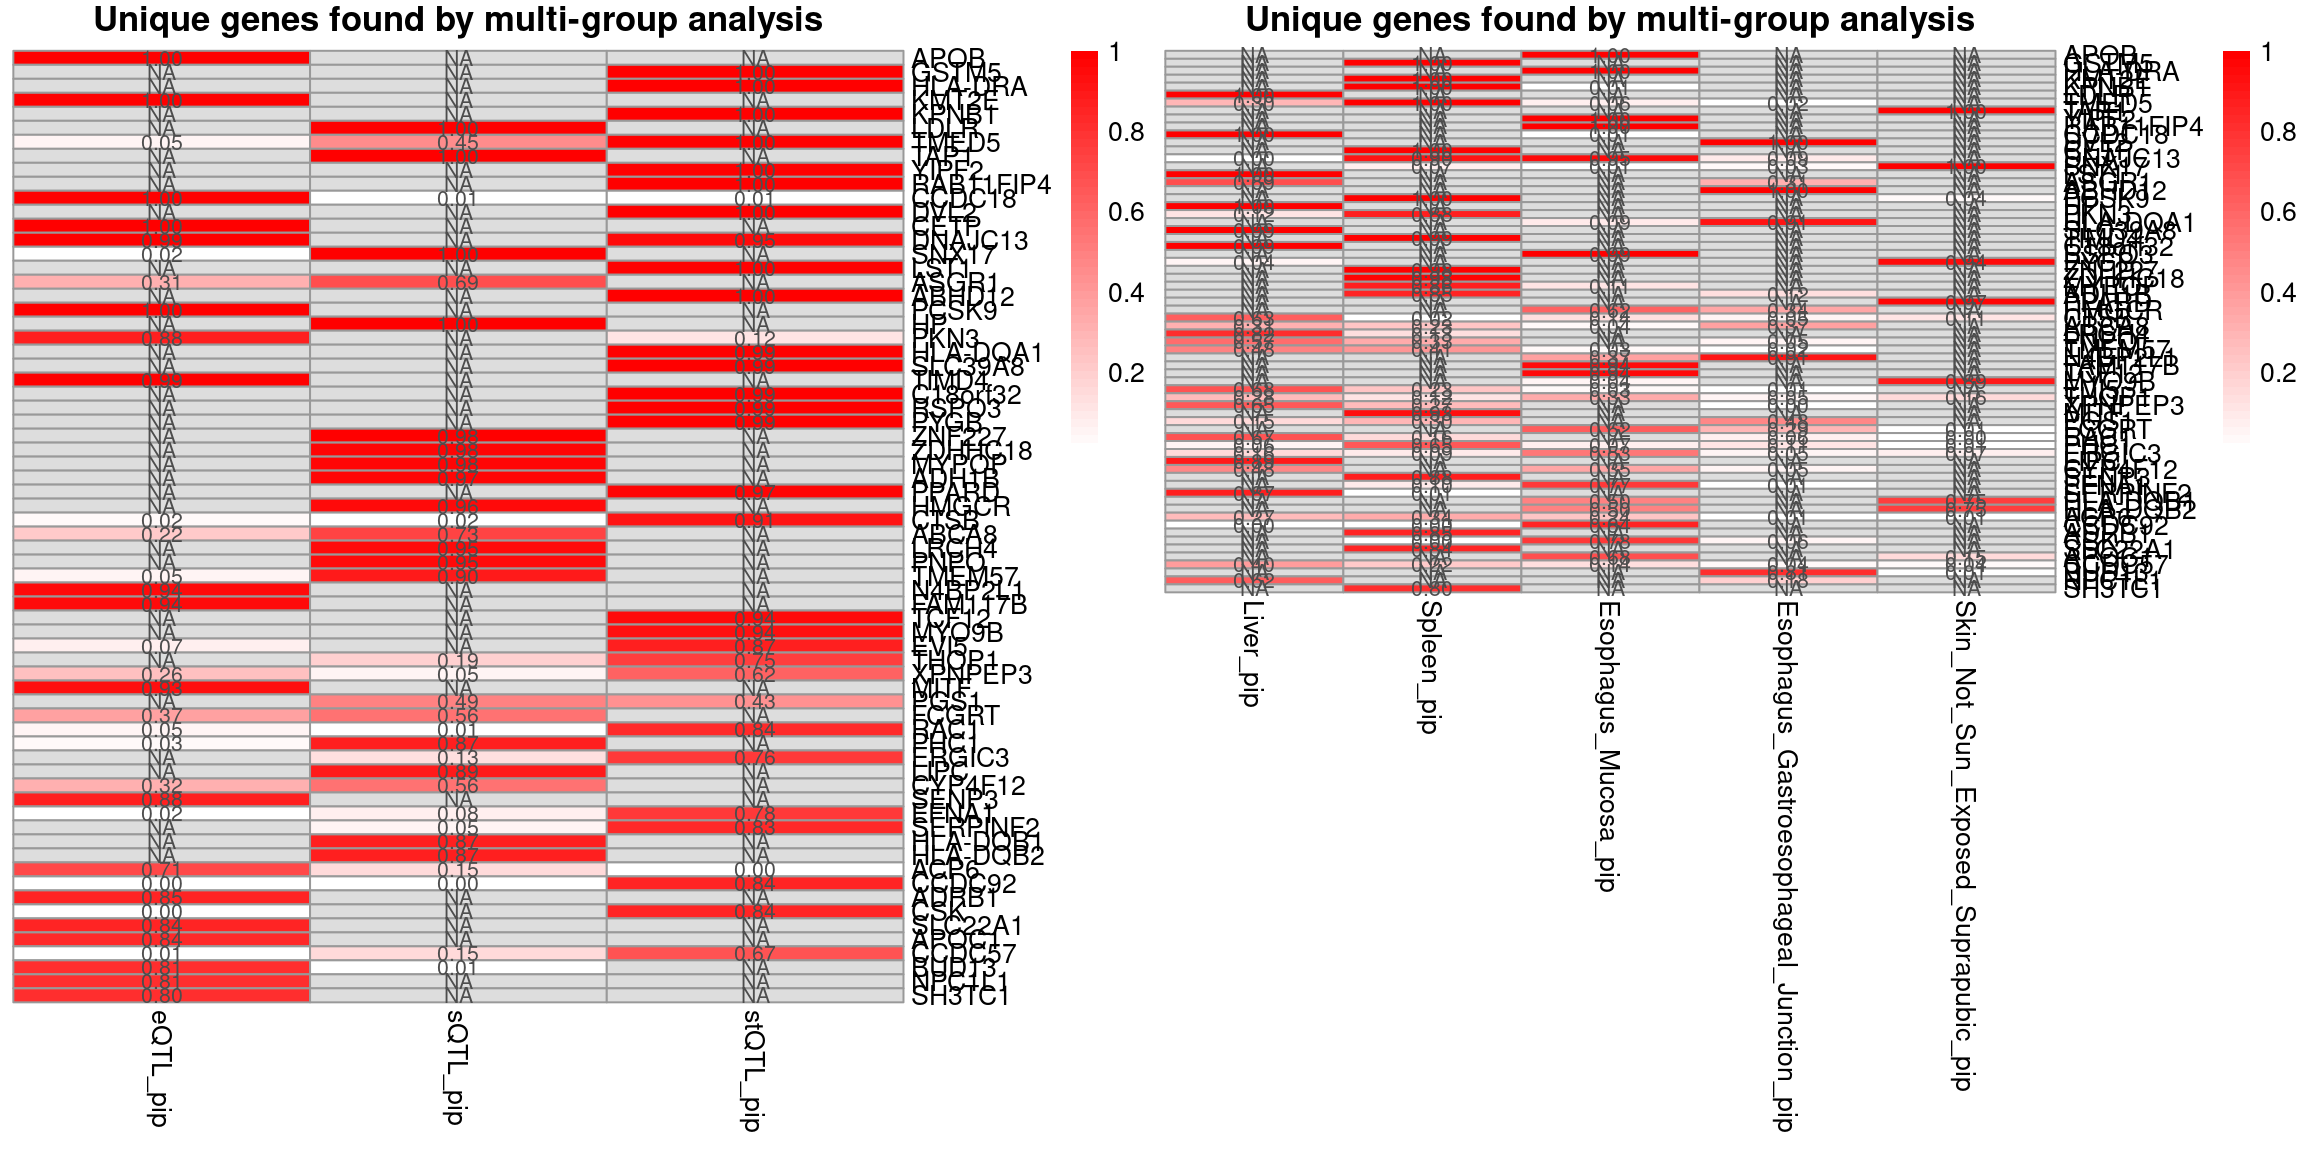
IBD-ebi-a-GCST004131
trait <- "IBD-ebi-a-GCST004131"
gwas_n <- samplesize[trait]
tissue <- c("Whole_Blood","Adipose_Subcutaneous","Cells_Cultured_fibroblasts","Spleen","Testis")


results_dir_multi <- paste0("/project/xinhe/xsun/multi_group_ctwas/11.multi_group_1008/results/",trait,"/")
ctwas_res_multi <- readRDS(paste0(results_dir_multi,trait,".ctwas.res.RDS"))

param_multi <- ctwas_res_multi$param
make_convergence_plots(param_multi, gwas_n, colors = colors)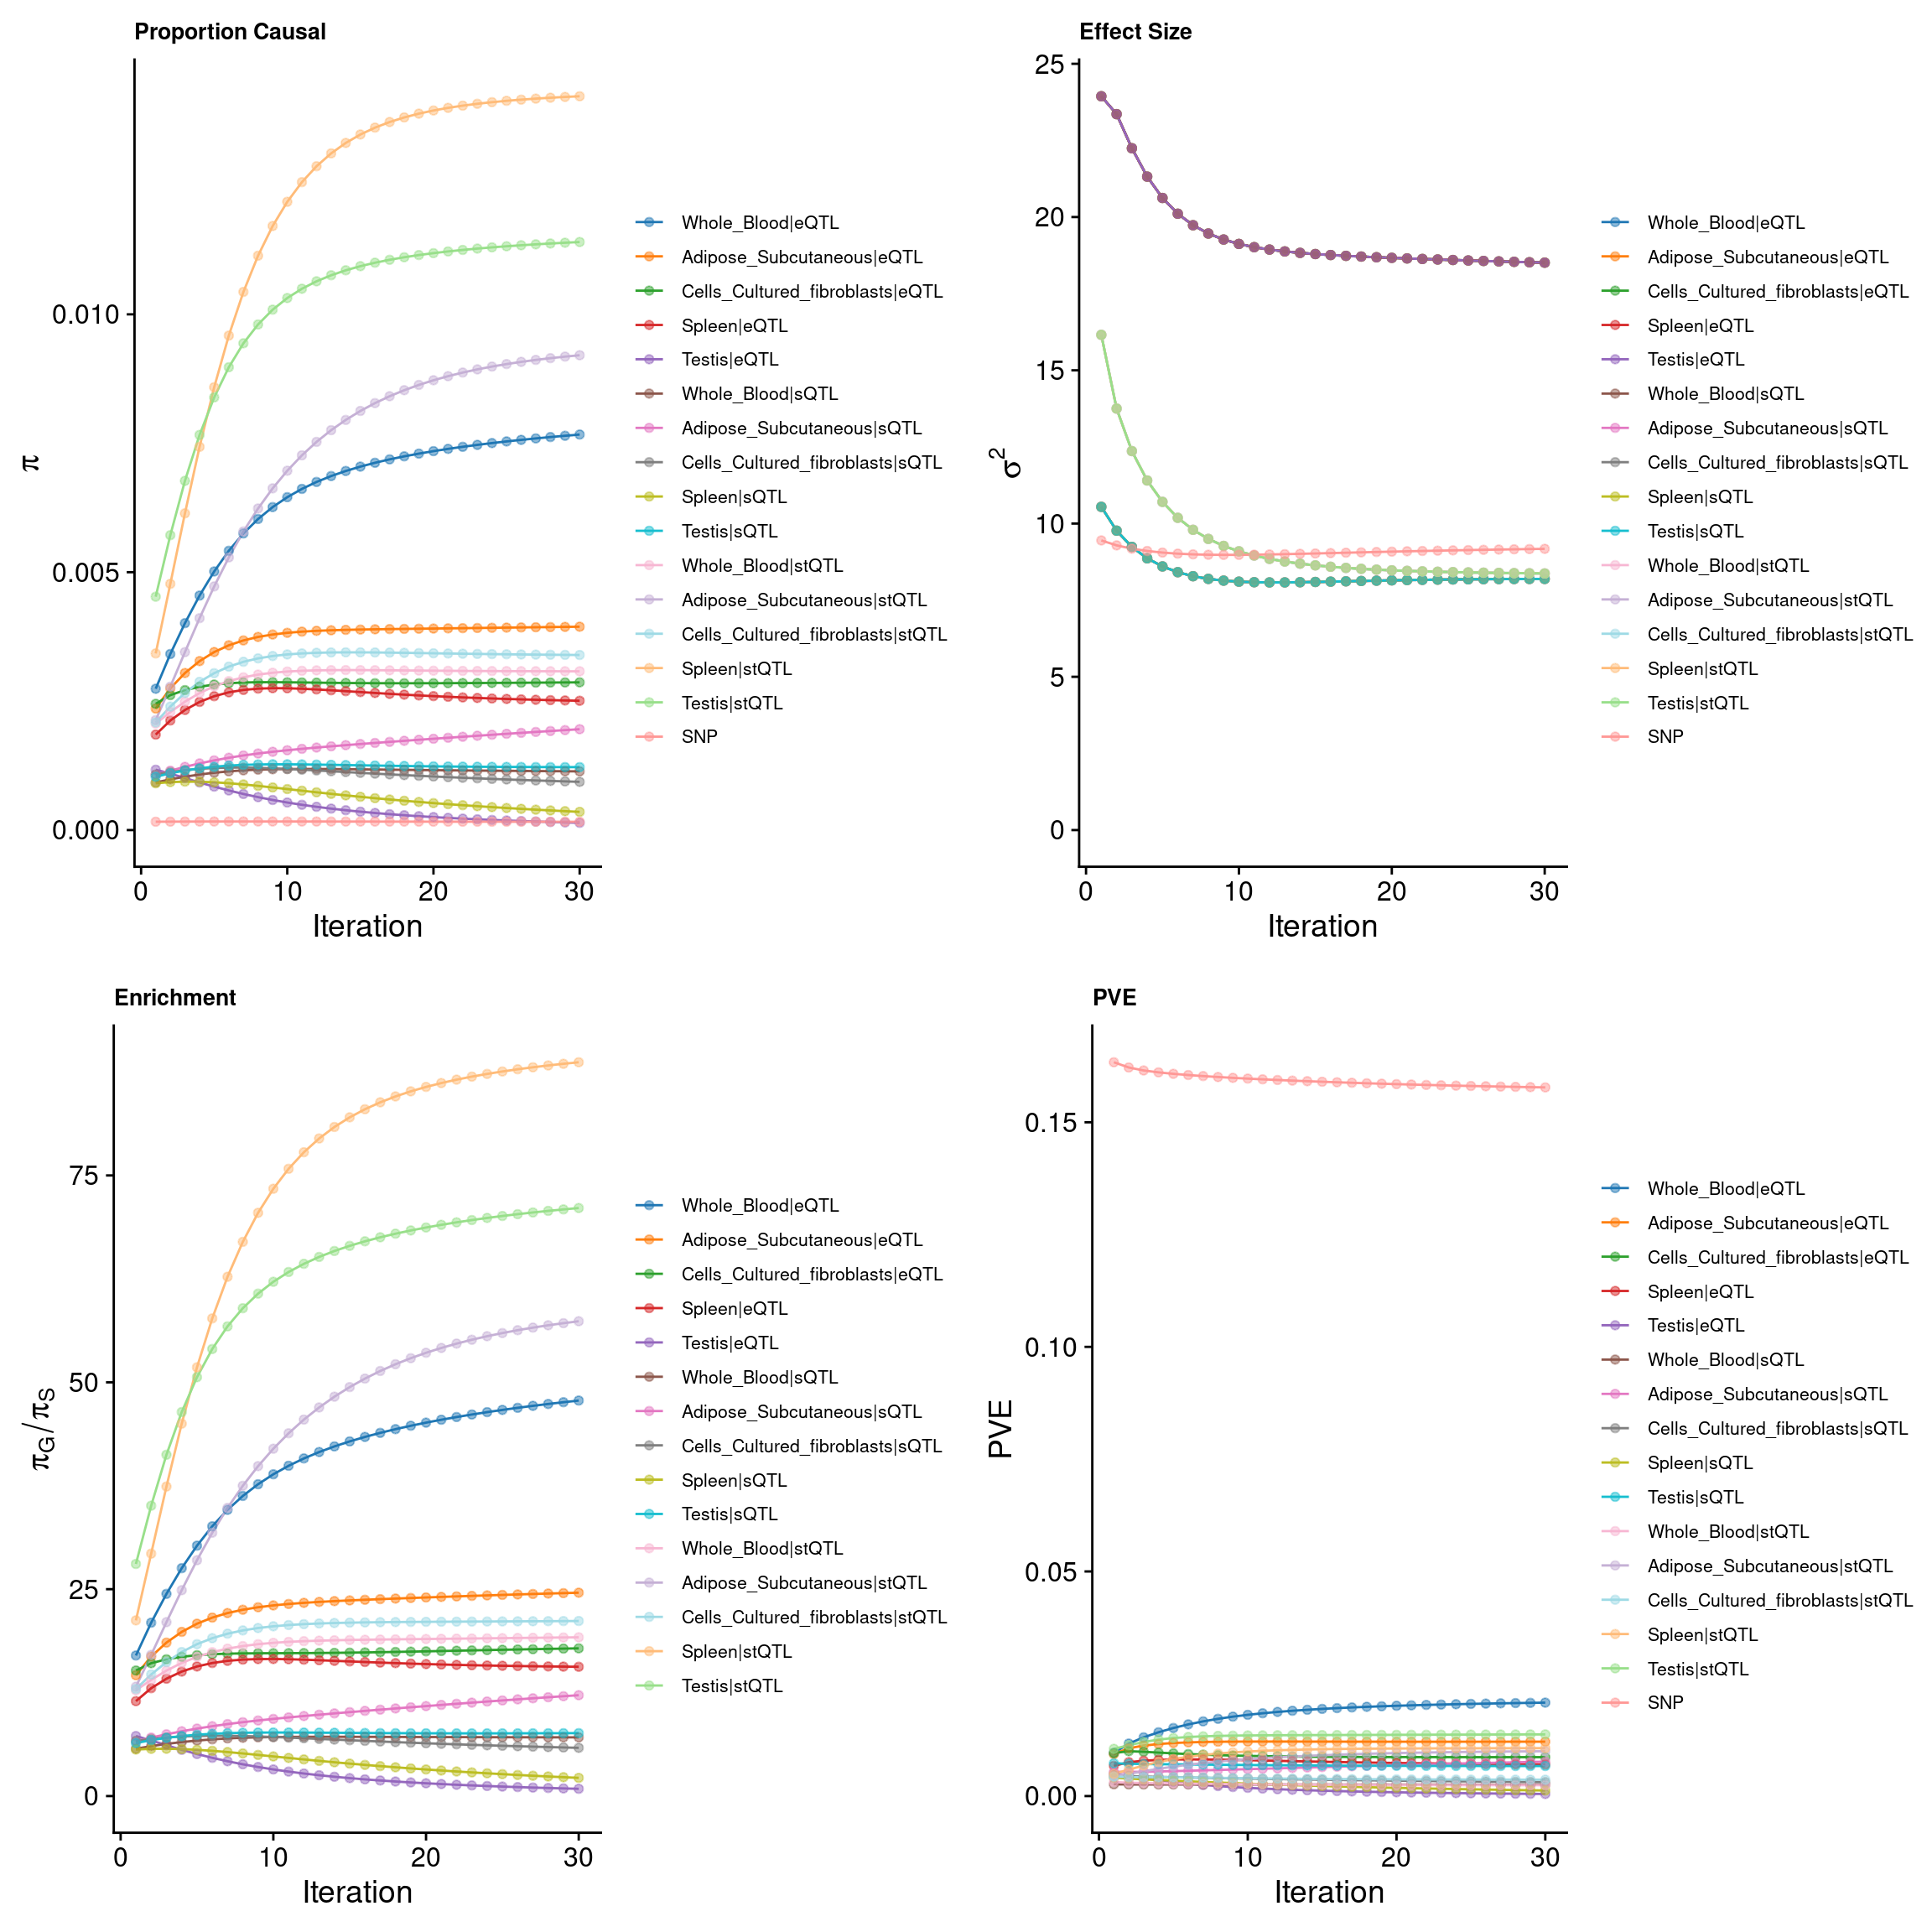
ctwas_parameters_multi <- summarize_param(param_multi, gwas_n)
pve_pie_by_type_multi <- plot_piechart(ctwas_parameters = ctwas_parameters_multi, colors = colors, by = "type")
pve_pie_by_context_multi <- plot_piechart(ctwas_parameters = ctwas_parameters_multi, colors = colors, by = "context")

gridExtra::grid.arrange(pve_pie_by_type_multi,pve_pie_by_context_multi, ncol = 2)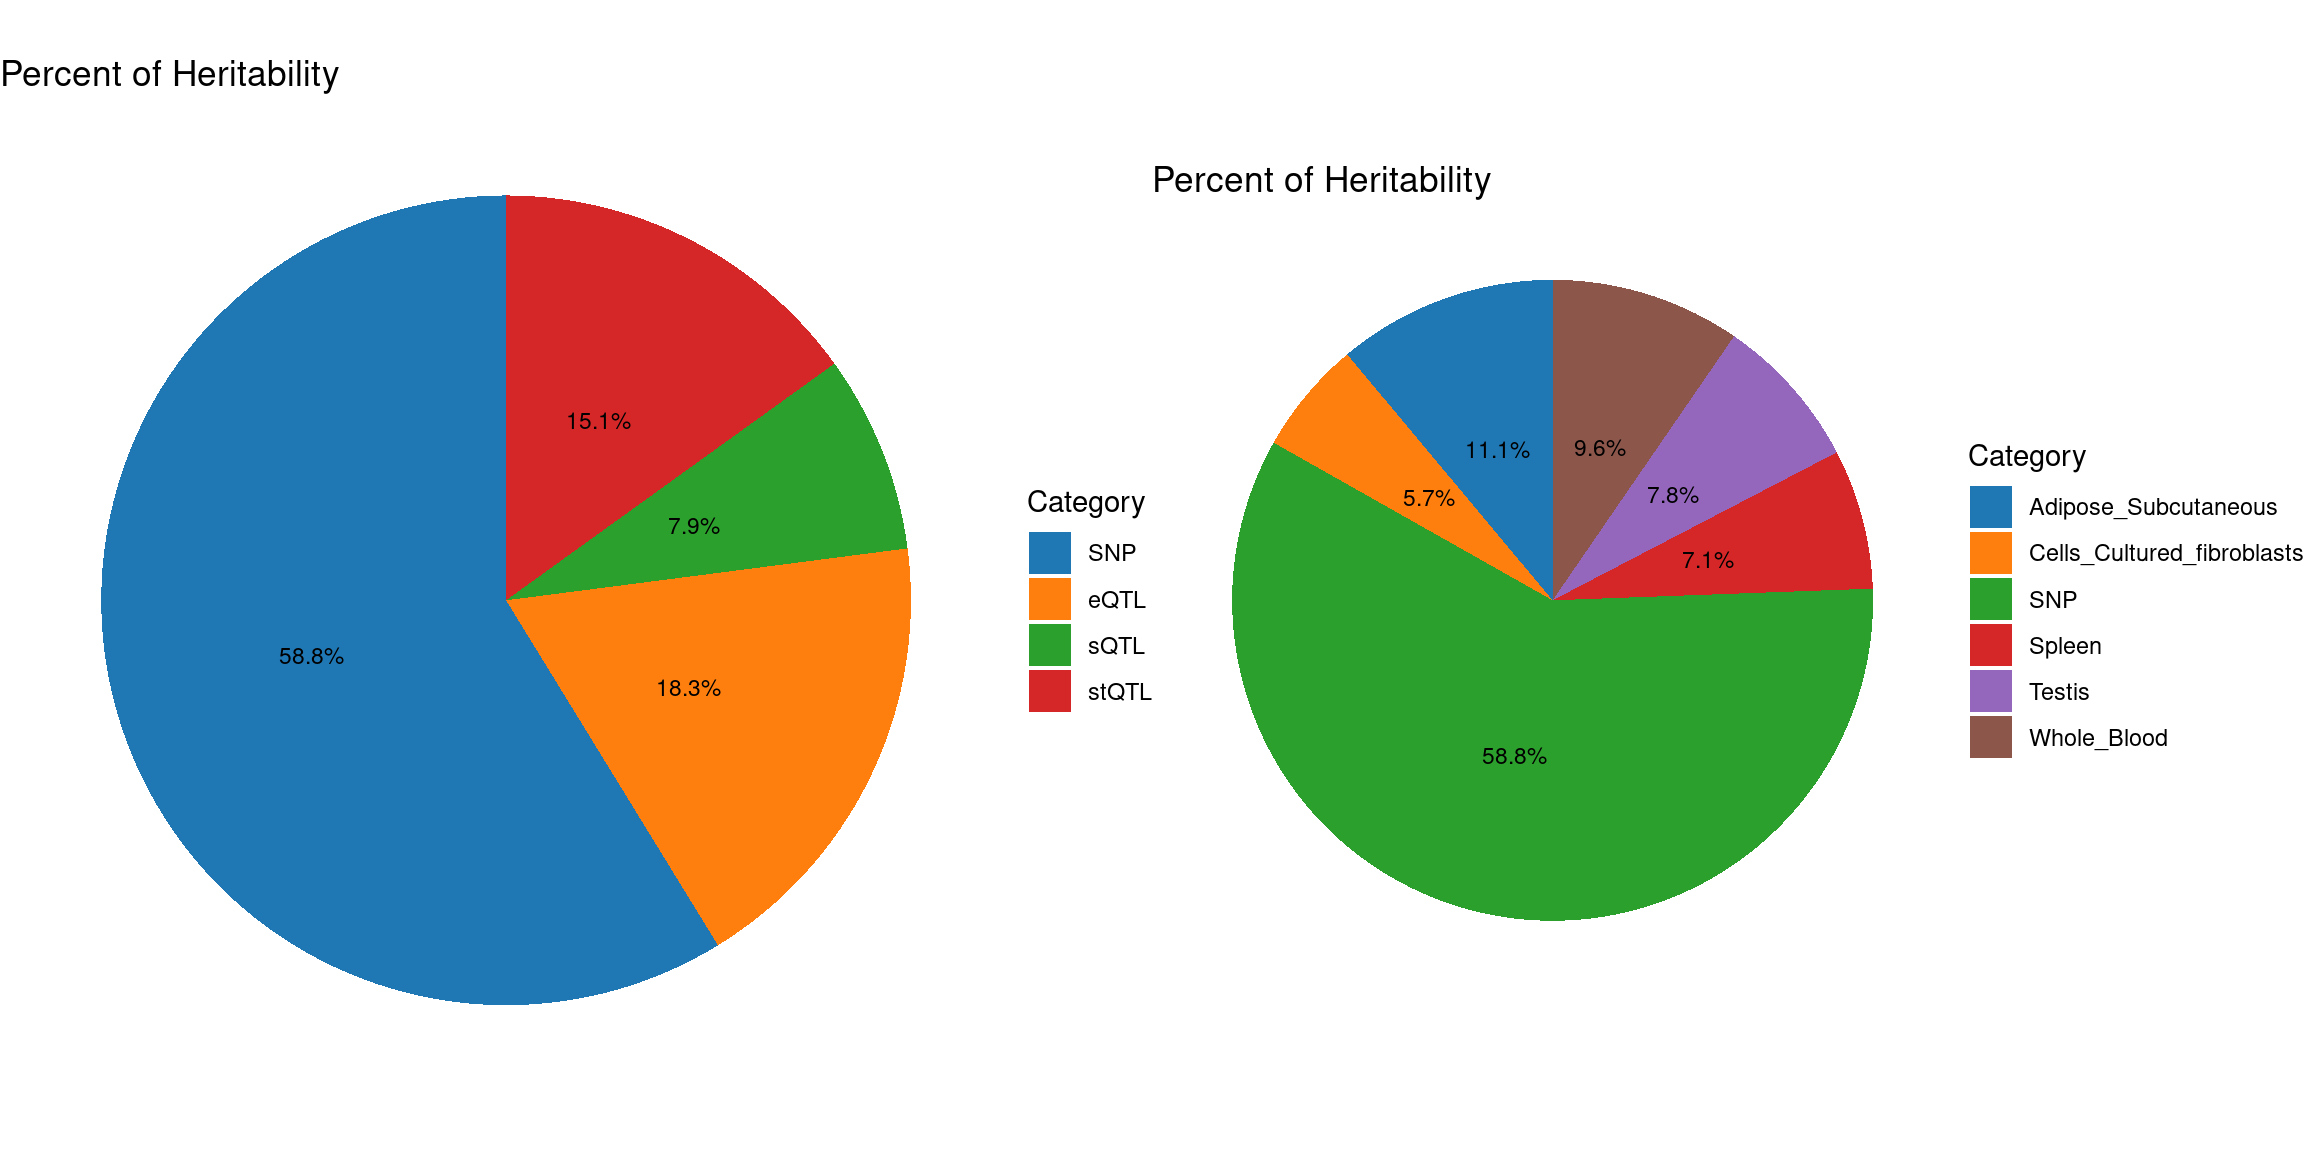
Fine-mapping
susie_alpha_res_multi <- ctwas_res_multi$susie_alpha_res

susie_alpha_res_multi <- anno_susie_alpha_res(susie_alpha_res_multi,
                                        mapping_table = mapping_two,
                                        map_by = "molecular_id",
                                        drop_unmapped = TRUE)
2024-10-15 14:57:23 INFO::Annotating susie alpha result ...
2024-10-15 14:57:23 INFO::Map molecular traits to genes
2024-10-15 14:57:25 INFO::Split PIPs for molecular traits mapped to multiple genescombined_pip_by_type_multi <- combine_gene_pips(susie_alpha_res_multi,
group_by = "gene_name",
by = "type",
method = "combine_cs",
filter_cs = TRUE,
include_cs_id = F)
combined_pip_by_type_cs_multi <- combine_gene_pips(susie_alpha_res_multi,
group_by = "gene_name",
by = "type",
method = "combine_cs",
filter_cs = TRUE,
include_cs_id = T)
combined_pip_by_context_cs_multi <- combine_gene_pips(susie_alpha_res_multi,
group_by = "gene_name",
by = "context",
method = "combine_cs",
filter_cs = TRUE,
include_cs_id = T)
combined_pip_by_context_multi <- combine_gene_pips(susie_alpha_res_multi,
group_by = "gene_name",
by = "context",
method = "combine_cs",
filter_cs = TRUE,
include_cs_id = F)
DT::datatable(combined_pip_by_type_cs_multi[combined_pip_by_type_cs_multi$combined_pip>0.8,],caption = htmltools::tags$caption( style = 'caption-side: topleft; text-align = left; color:black;','Combined PIP by omics'),options = list(pageLength = 5) )DT::datatable(combined_pip_by_context_cs_multi[combined_pip_by_context_cs_multi$combined_pip>0.8,],caption = htmltools::tags$caption( style = 'caption-side: topleft; text-align = left; color:black;','Combined PIP by tissue'),options = list(pageLength = 5) )pie1 <- draw_gene_piechart_type(data = combined_pip_by_type_multi,colors = colors)
pie2 <- draw_gene_piechart_tissue(data = combined_pip_by_context_multi,colors = colors)
gridExtra::grid.arrange(pie1,pie2, ncol = 2)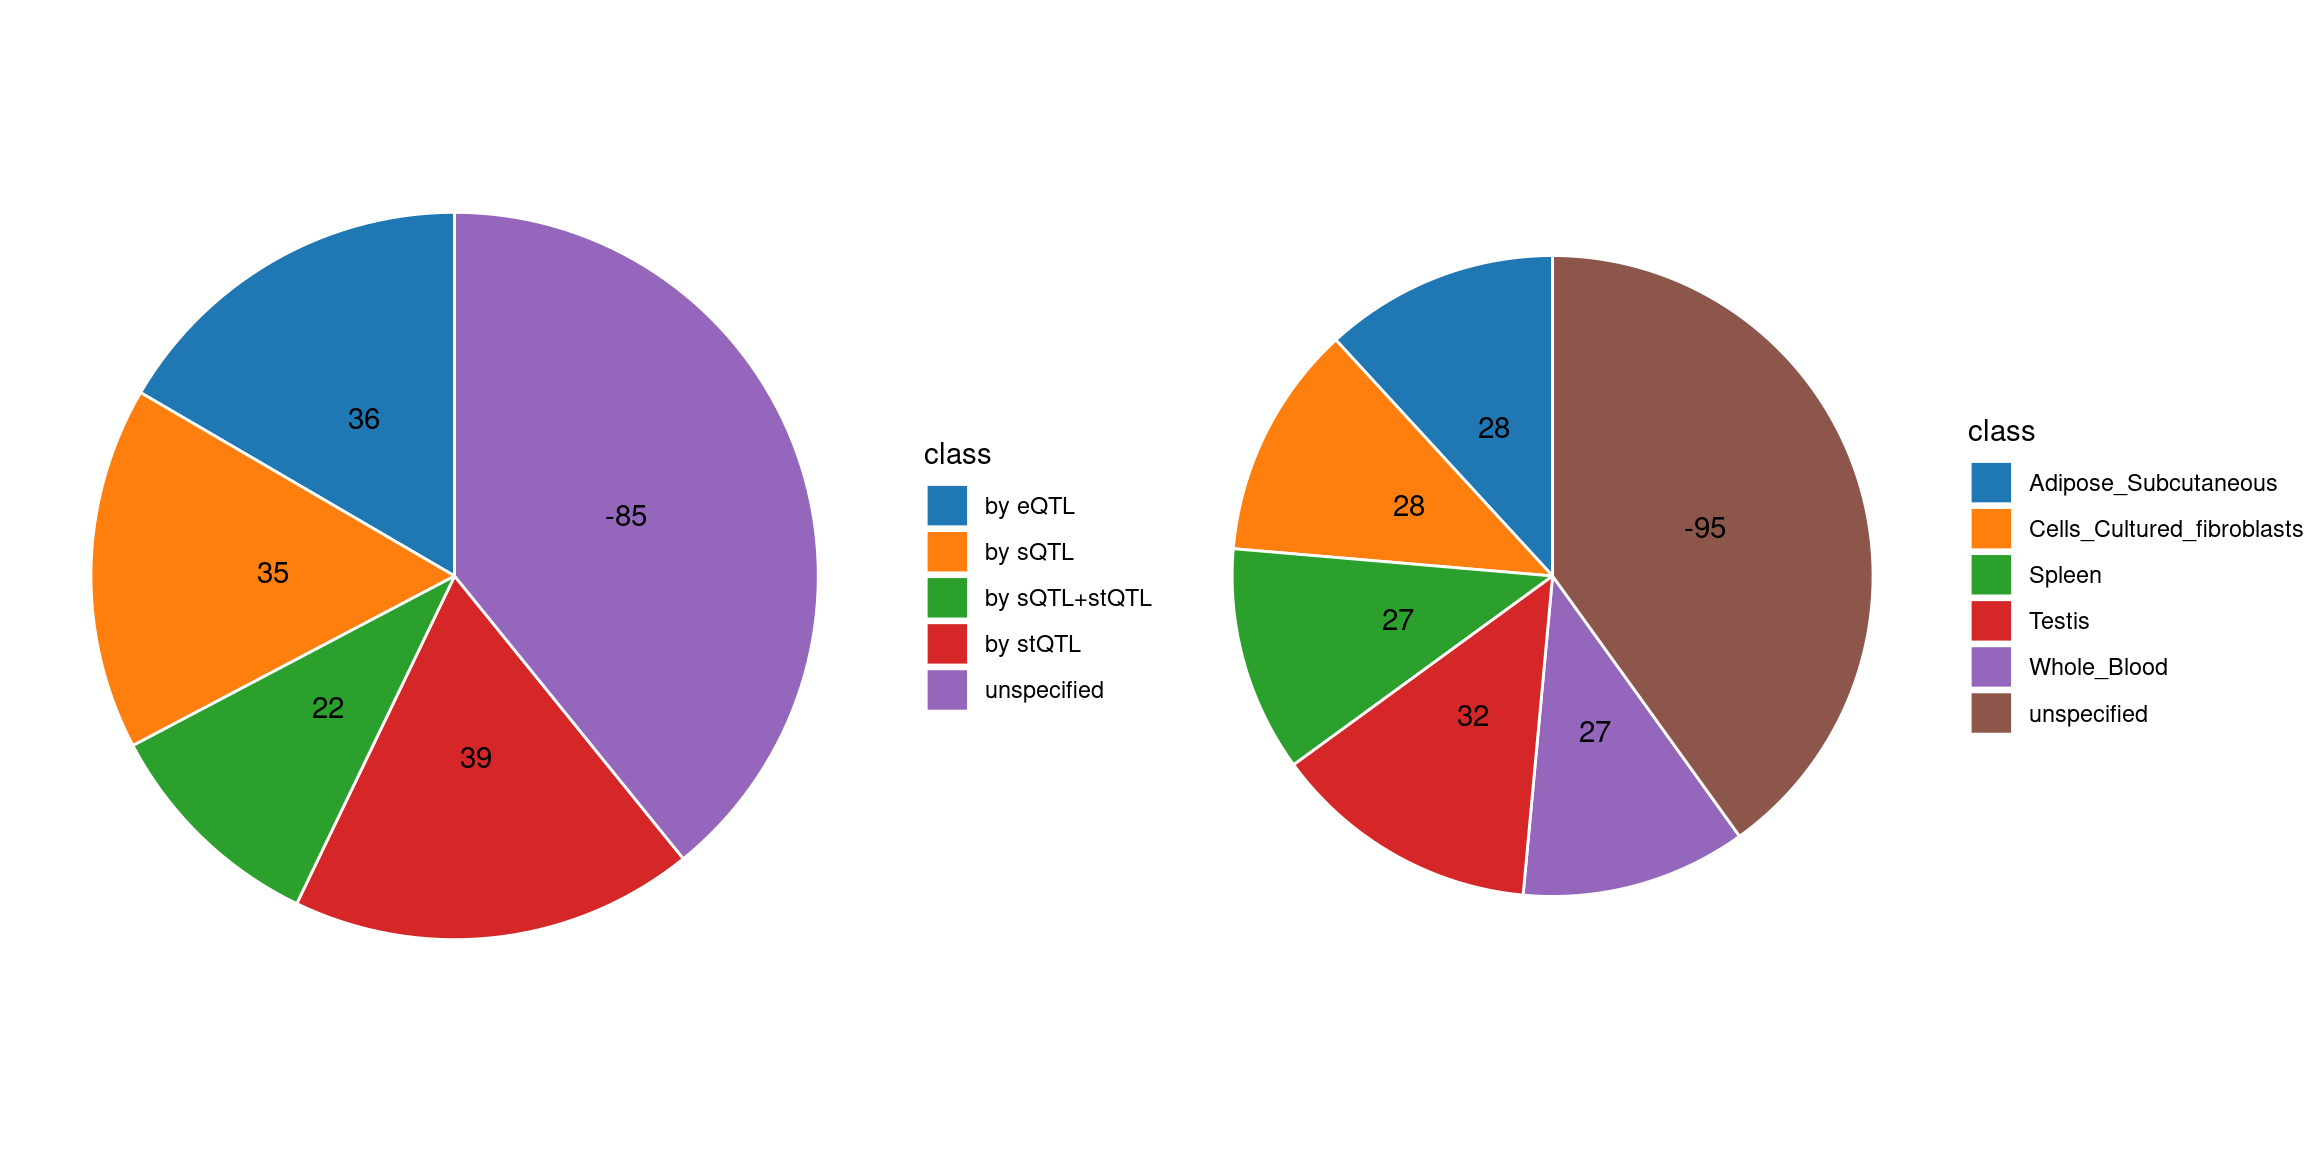
Comparing with single tissue + eQTL analysis
ctwas_res_single <- readRDS(paste0("/project/xinhe/xsun/multi_group_ctwas/10.single_tissue_1007/results/",trait,"/",tissue[1],"/",trait,"_",tissue[1], ".ctwas.res.RDS"))

susie_alpha_res_single <- ctwas_res_single$susie_alpha_res

susie_alpha_res_single <- anno_susie_alpha_res(susie_alpha_res_single,
                                        mapping_table = mapping_predictdb,
                                        map_by = "molecular_id",
                                        drop_unmapped = TRUE)
2024-10-15 14:57:35 INFO::Annotating susie alpha result ...
2024-10-15 14:57:35 INFO::Map molecular traits to genescombined_pip_by_type_single <- combine_gene_pips(susie_alpha_res_single,
group_by = "gene_name",
by = "type",
method = "combine_cs",
filter_cs = TRUE,
include_cs_id = F)
combined_pip_by_type_sig_single <- combined_pip_by_type_single[combined_pip_by_type_single$combined_pip > 0.8,]
combined_pip_by_type_sig_multi <- combined_pip_by_type_multi[combined_pip_by_type_multi$combined_pip > 0.8,]
sprintf("Number of genes with PIP > 0.8 -- Multi-group = %s", nrow(combined_pip_by_type_sig_multi))[1] "Number of genes with PIP > 0.8 -- Multi-group = 47"sprintf("Number of genes with PIP > 0.8 -- single eQTL = %s", nrow(combined_pip_by_type_sig_single))[1] "Number of genes with PIP > 0.8 -- single eQTL = 11"sprintf("Number of overlapped genes = %s", sum(combined_pip_by_type_sig_single$gene_name %in% combined_pip_by_type_sig_multi$gene_name))[1] "Number of overlapped genes = 7"genes_not_reported <- combined_pip_by_type_sig_single$gene_name[!combined_pip_by_type_sig_single$gene_name %in%combined_pip_by_type_sig_multi$gene_name]
DT::datatable(combined_pip_by_type_sig_single[combined_pip_by_type_sig_single$gene_name %in% genes_not_reported,],caption = htmltools::tags$caption( style = 'caption-side: topleft; text-align = left; color:black;','Genes not reported by multi-group analysis'),options = list(pageLength = 5) )DT::datatable(combined_pip_by_type_multi[combined_pip_by_type_multi$gene_name %in% genes_not_reported,],caption = htmltools::tags$caption( style = 'caption-side: topleft; text-align = left; color:black;','Genes not reported by multi-group analysis'),options = list(pageLength = 5) )gene_multi_unique_type <- combined_pip_by_type_sig_multi[!combined_pip_by_type_sig_multi$gene_name %in% combined_pip_by_type_sig_single$gene_name,]
p1 <- plot_heatmap(heatmap_data = gene_multi_unique_type, main = "Unique genes found by multi-group analysis")
combined_pip_by_context_sig_multi <- combined_pip_by_context_multi[combined_pip_by_context_multi$combined_pip > 0.8,]
gene_multi_unique_context <- combined_pip_by_context_sig_multi[!combined_pip_by_context_sig_multi$gene_name %in% combined_pip_by_type_sig_single$gene_name,]
p2 <- plot_heatmap(heatmap_data = gene_multi_unique_context, main = "Unique genes found by multi-group analysis")
g1 <- p1$gtable
g2 <- p2$gtable
gridExtra::grid.arrange(g1, g2, ncol=2)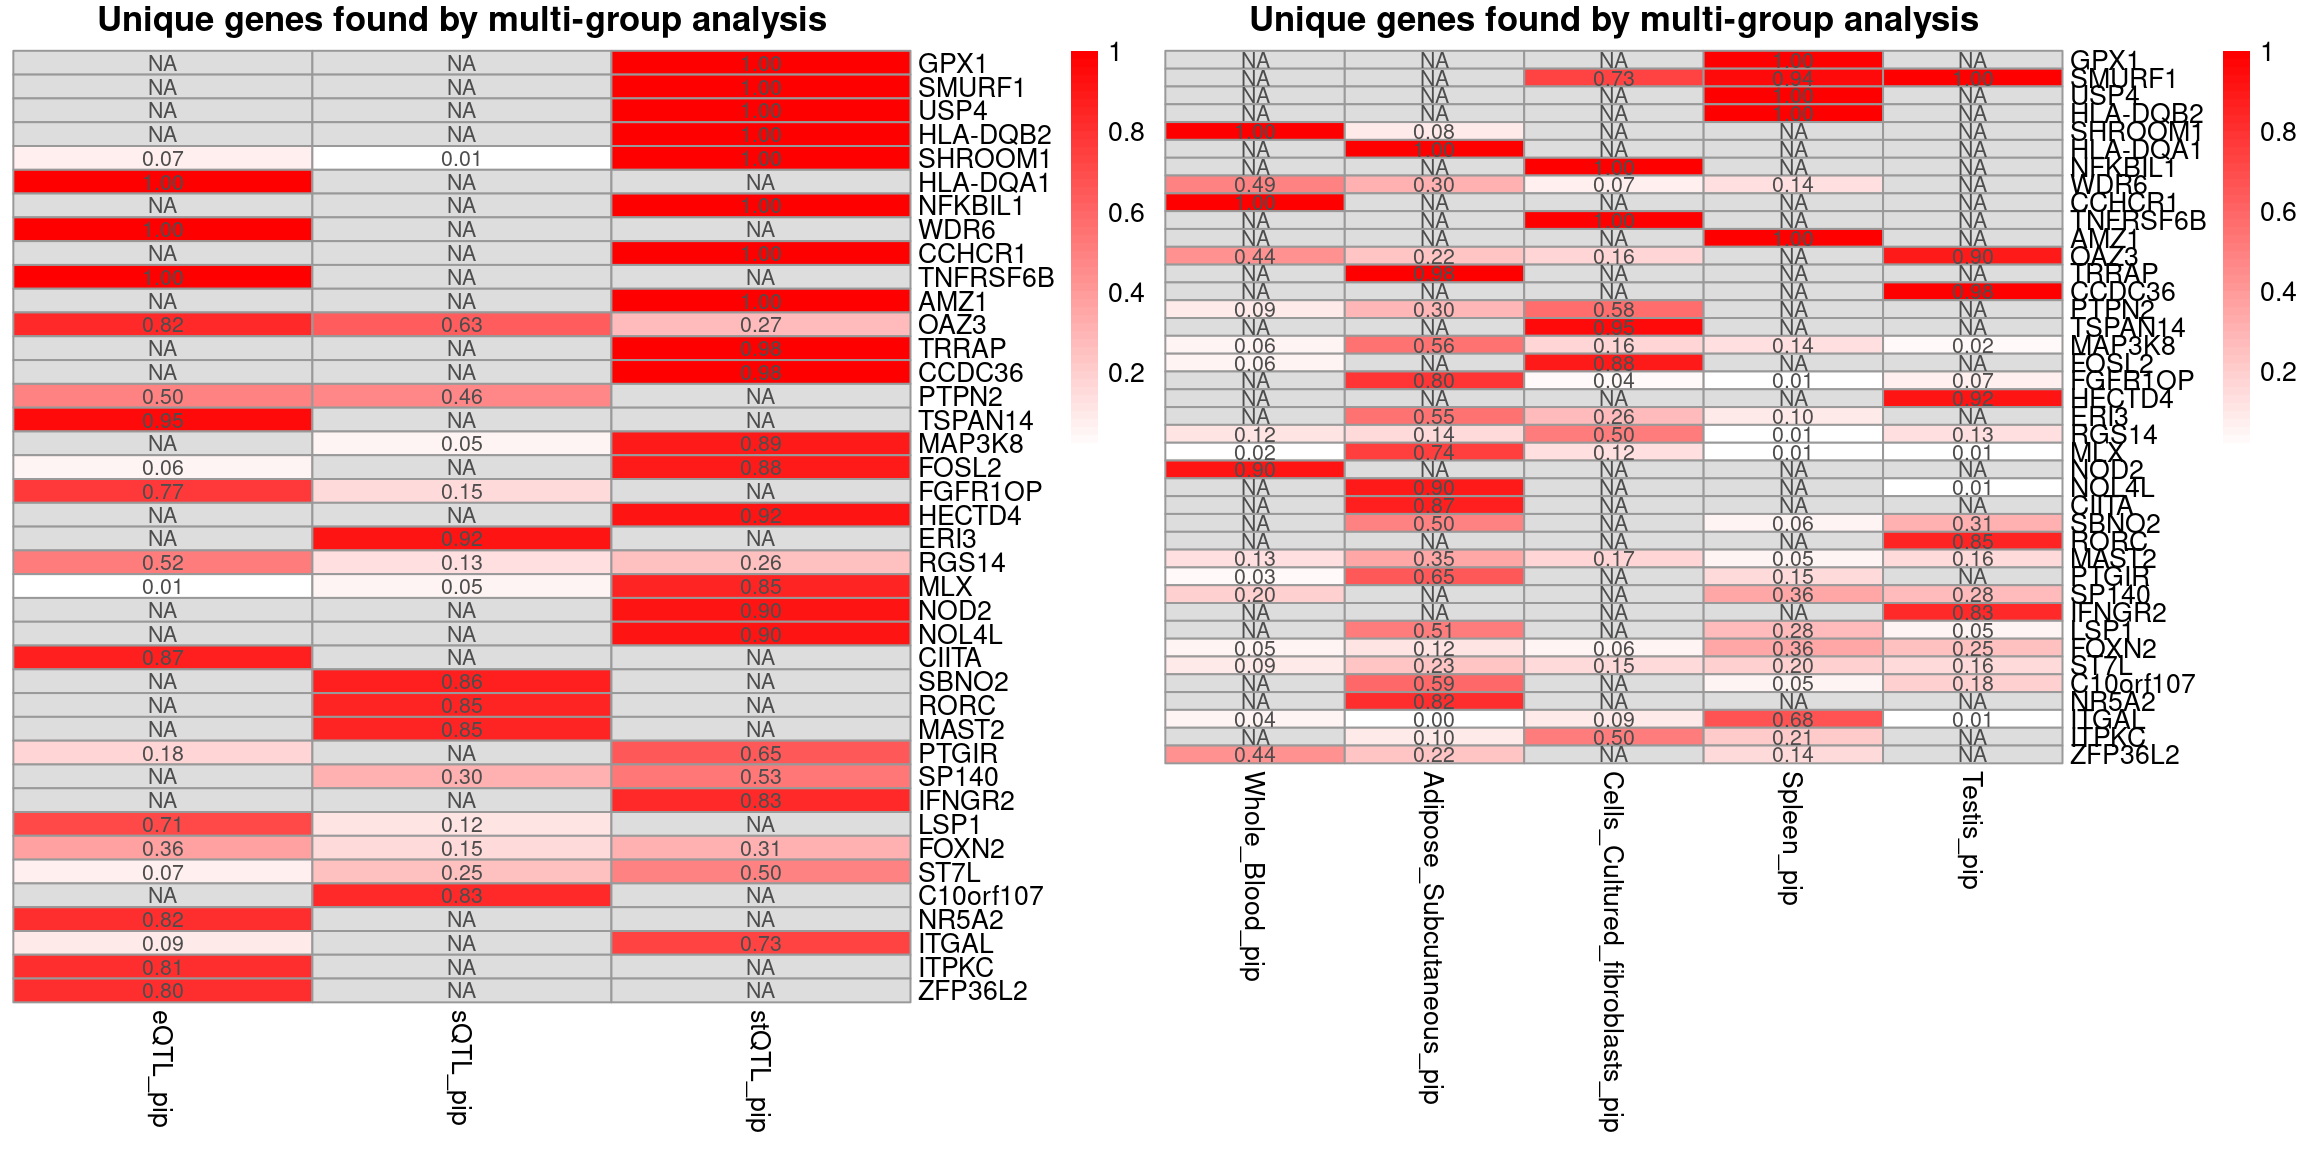
SBP-ukb-a-360
trait <- "SBP-ukb-a-360"
gwas_n <- samplesize[trait]
tissue <- c("Artery_Tibial","Heart_Atrial_Appendage","Adipose_Subcutaneous","Brain_Cortex","Skin_Sun_Exposed_Lower_leg")


results_dir_multi <- paste0("/project/xinhe/xsun/multi_group_ctwas/11.multi_group_1008/results/",trait,"/")
ctwas_res_multi <- readRDS(paste0(results_dir_multi,trait,".ctwas.res.RDS"))

param_multi <- ctwas_res_multi$param
make_convergence_plots(param_multi, gwas_n, colors = colors)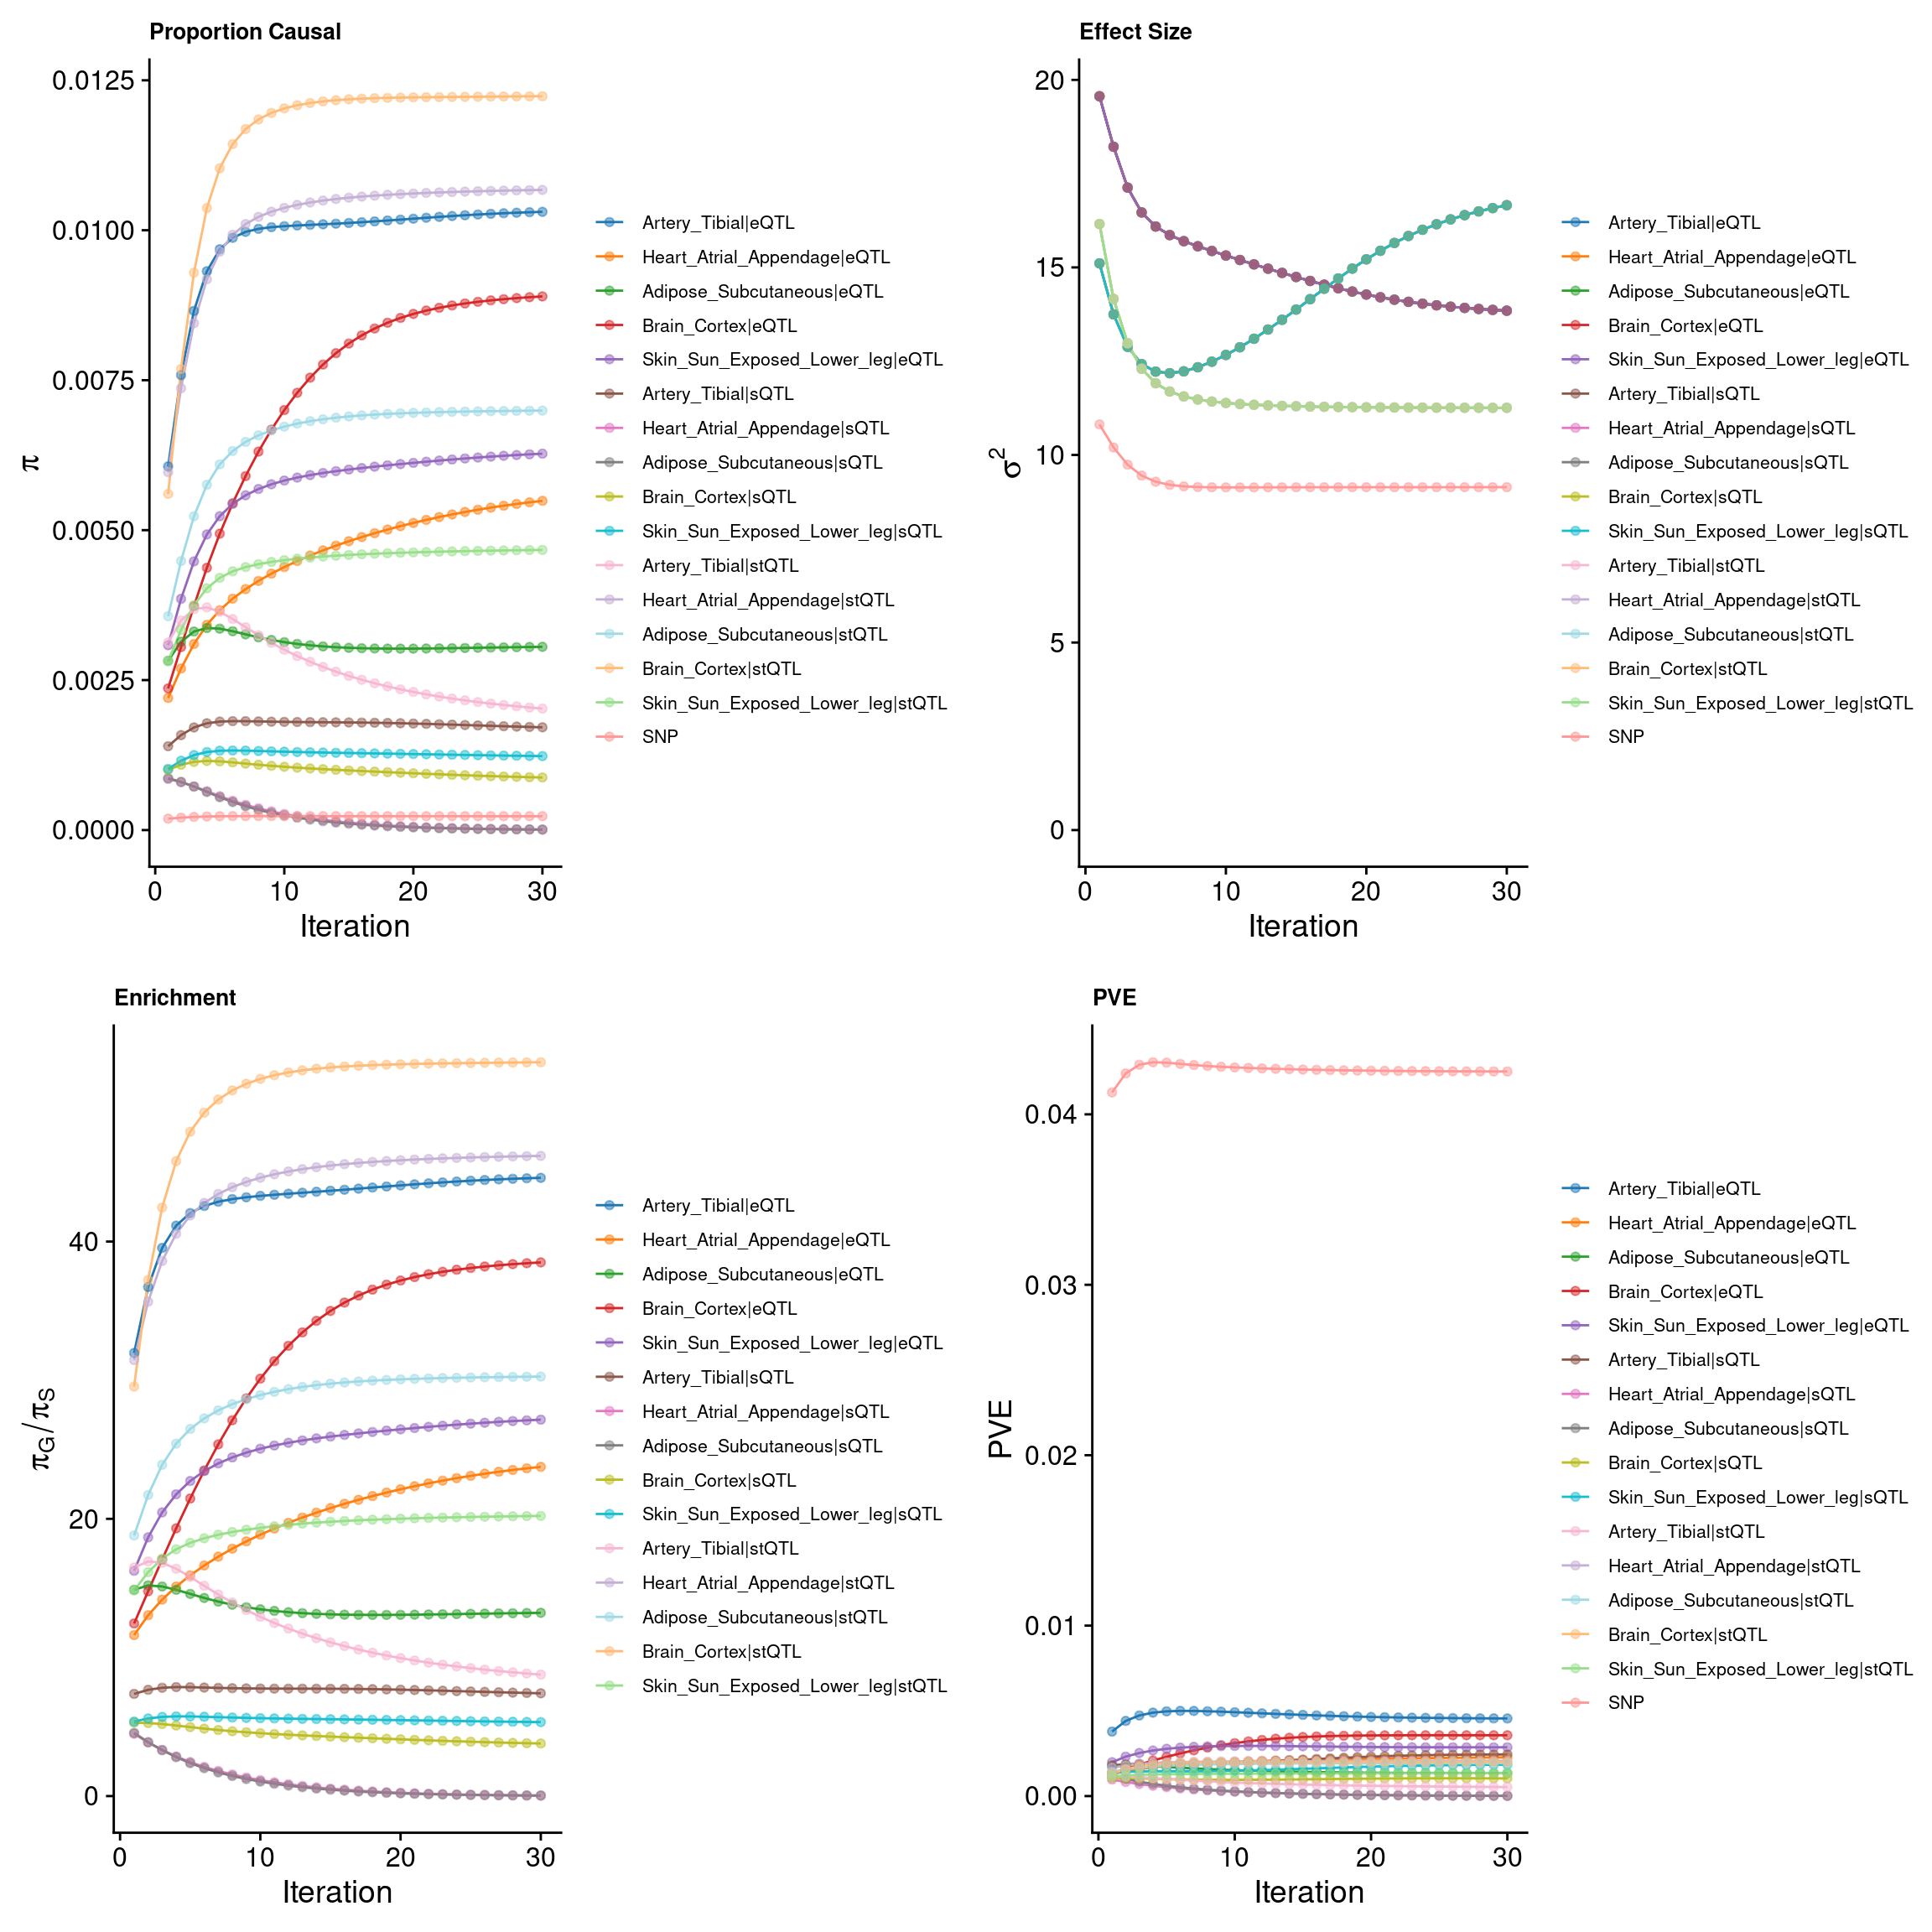
ctwas_parameters_multi <- summarize_param(param_multi, gwas_n)
pve_pie_by_type_multi <- plot_piechart(ctwas_parameters = ctwas_parameters_multi, colors = colors, by = "type")
pve_pie_by_context_multi <- plot_piechart(ctwas_parameters = ctwas_parameters_multi, colors = colors, by = "context")

gridExtra::grid.arrange(pve_pie_by_type_multi,pve_pie_by_context_multi, ncol = 2)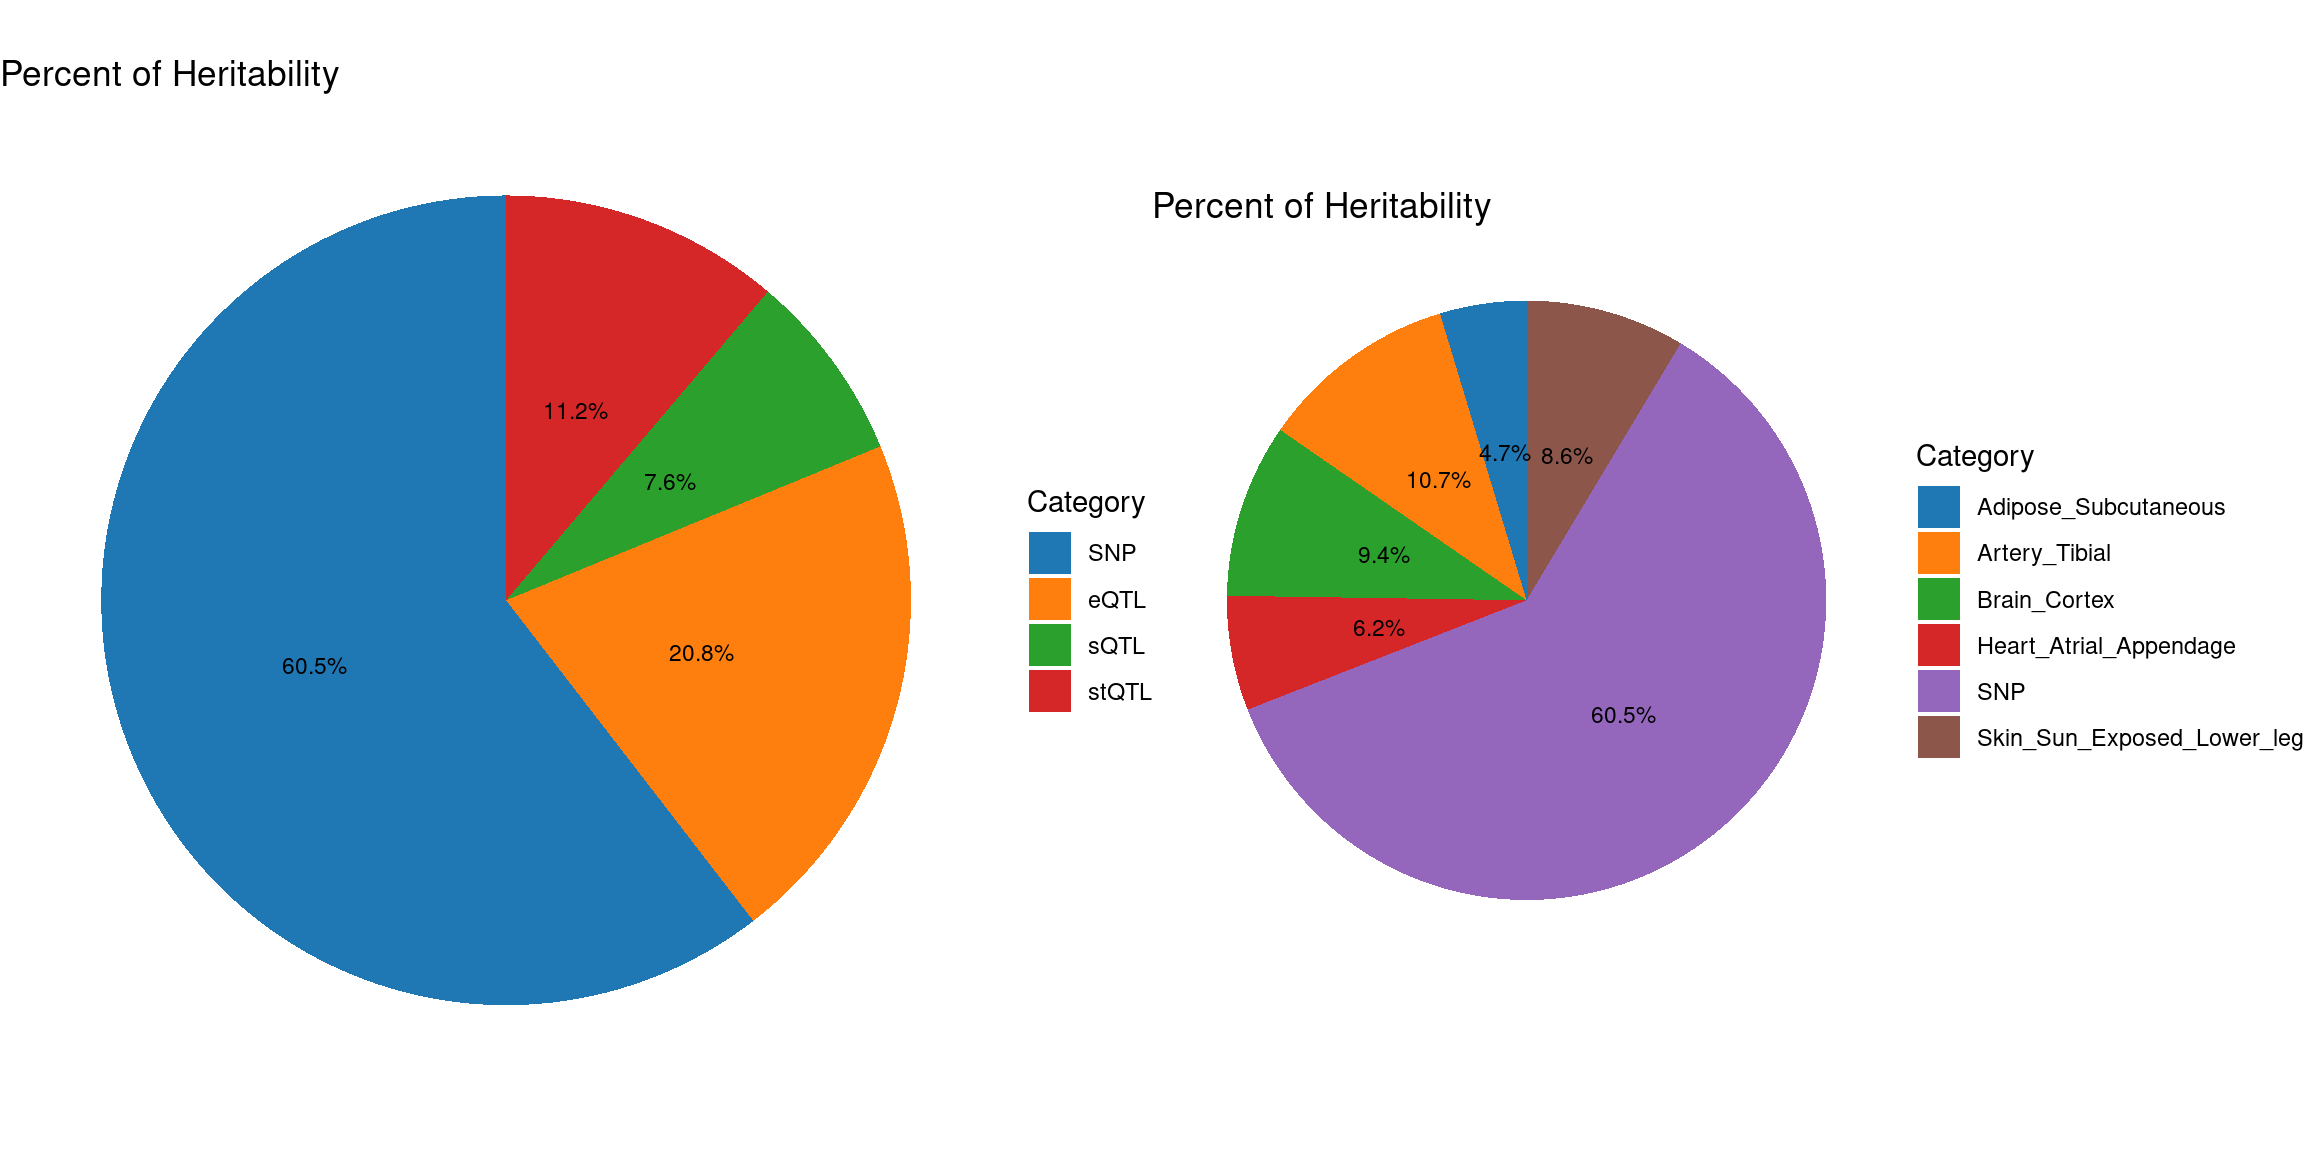
Fine-mapping
susie_alpha_res_multi <- ctwas_res_multi$susie_alpha_res

susie_alpha_res_multi <- anno_susie_alpha_res(susie_alpha_res_multi,
                                        mapping_table = mapping_two,
                                        map_by = "molecular_id",
                                        drop_unmapped = TRUE)
2024-10-15 14:57:47 INFO::Annotating susie alpha result ...
2024-10-15 14:57:47 INFO::Map molecular traits to genes
2024-10-15 14:57:51 INFO::Split PIPs for molecular traits mapped to multiple genescombined_pip_by_type_multi <- combine_gene_pips(susie_alpha_res_multi,
group_by = "gene_name",
by = "type",
method = "combine_cs",
filter_cs = TRUE,
include_cs_id = F)
combined_pip_by_type_cs_multi <- combine_gene_pips(susie_alpha_res_multi,
group_by = "gene_name",
by = "type",
method = "combine_cs",
filter_cs = TRUE,
include_cs_id = T)
combined_pip_by_context_cs_multi <- combine_gene_pips(susie_alpha_res_multi,
group_by = "gene_name",
by = "context",
method = "combine_cs",
filter_cs = TRUE,
include_cs_id = T)
combined_pip_by_context_multi <- combine_gene_pips(susie_alpha_res_multi,
group_by = "gene_name",
by = "context",
method = "combine_cs",
filter_cs = TRUE,
include_cs_id = F)
DT::datatable(combined_pip_by_type_cs_multi[combined_pip_by_type_cs_multi$combined_pip>0.8,],caption = htmltools::tags$caption( style = 'caption-side: topleft; text-align = left; color:black;','Combined PIP by omics'),options = list(pageLength = 5) )DT::datatable(combined_pip_by_context_cs_multi[combined_pip_by_context_cs_multi$combined_pip>0.8,],caption = htmltools::tags$caption( style = 'caption-side: topleft; text-align = left; color:black;','Combined PIP by tissue'),options = list(pageLength = 5) )pie1 <- draw_gene_piechart_type(data = combined_pip_by_type_multi,colors = colors)
pie2 <- draw_gene_piechart_tissue(data = combined_pip_by_context_multi,colors = colors)
gridExtra::grid.arrange(pie1,pie2, ncol = 2)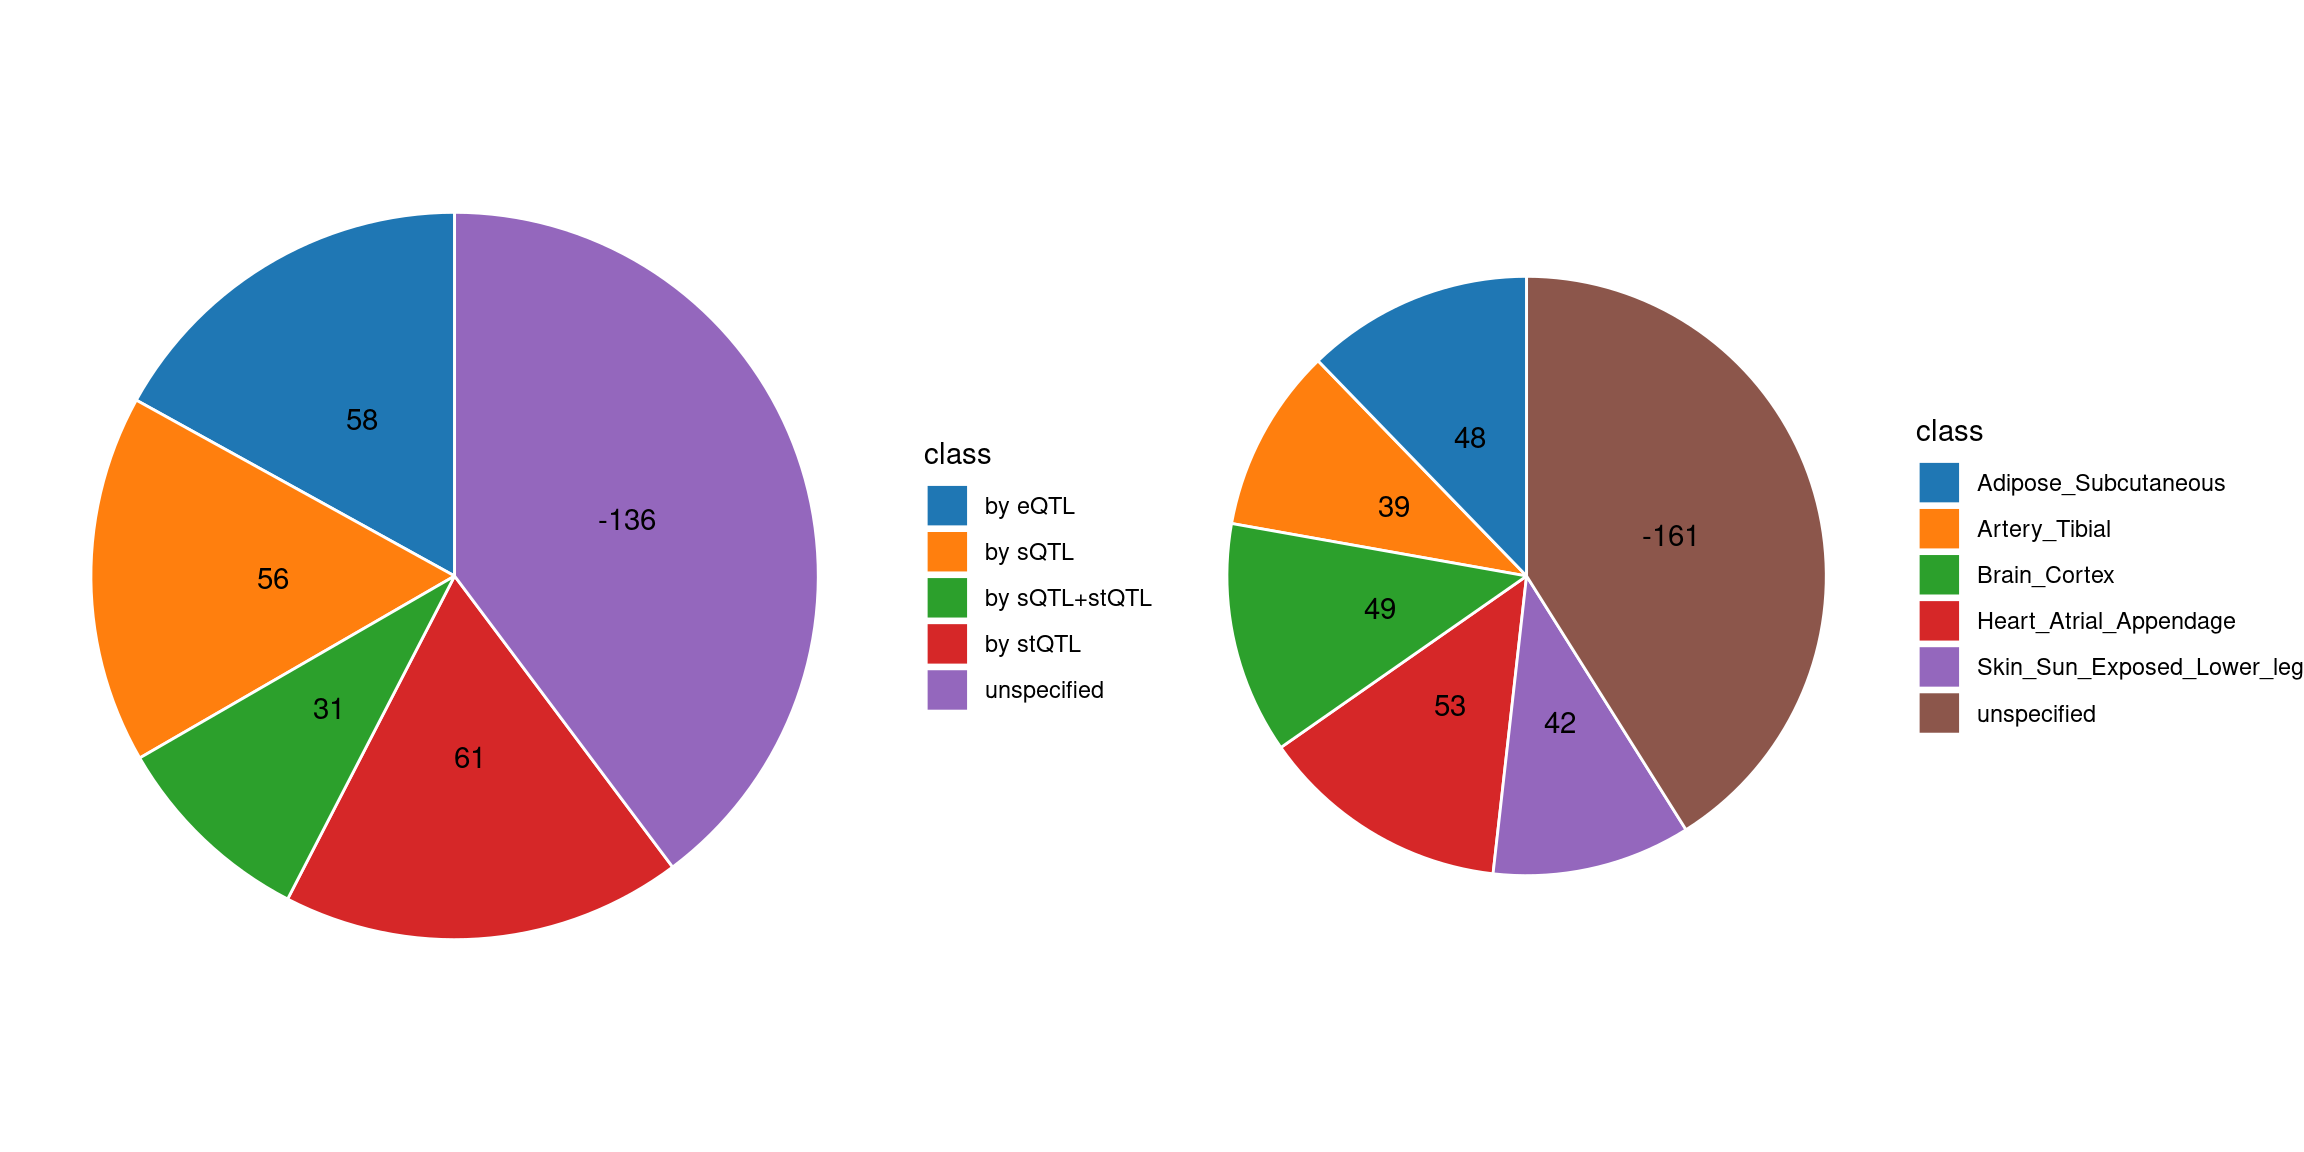
Comparing with single tissue + eQTL analysis
ctwas_res_single <- readRDS(paste0("/project/xinhe/xsun/multi_group_ctwas/10.single_tissue_1007/results/",trait,"/",tissue[1],"/",trait,"_",tissue[1], ".ctwas.res.RDS"))

susie_alpha_res_single <- ctwas_res_single$susie_alpha_res

susie_alpha_res_single <- anno_susie_alpha_res(susie_alpha_res_single,
                                        mapping_table = mapping_predictdb,
                                        map_by = "molecular_id",
                                        drop_unmapped = TRUE)
2024-10-15 14:58:05 INFO::Annotating susie alpha result ...
2024-10-15 14:58:05 INFO::Map molecular traits to genescombined_pip_by_type_single <- combine_gene_pips(susie_alpha_res_single,
group_by = "gene_name",
by = "type",
method = "combine_cs",
filter_cs = TRUE,
include_cs_id = F)
combined_pip_by_type_sig_single <- combined_pip_by_type_single[combined_pip_by_type_single$combined_pip > 0.8,]
combined_pip_by_type_sig_multi <- combined_pip_by_type_multi[combined_pip_by_type_multi$combined_pip > 0.8,]
sprintf("Number of genes with PIP > 0.8 -- Multi-group = %s", nrow(combined_pip_by_type_sig_multi))[1] "Number of genes with PIP > 0.8 -- Multi-group = 70"sprintf("Number of genes with PIP > 0.8 -- single eQTL = %s", nrow(combined_pip_by_type_sig_single))[1] "Number of genes with PIP > 0.8 -- single eQTL = 29"sprintf("Number of overlapped genes = %s", sum(combined_pip_by_type_sig_single$gene_name %in% combined_pip_by_type_sig_multi$gene_name))[1] "Number of overlapped genes = 19"genes_not_reported <- combined_pip_by_type_sig_single$gene_name[!combined_pip_by_type_sig_single$gene_name %in%combined_pip_by_type_sig_multi$gene_name]
DT::datatable(combined_pip_by_type_sig_single[combined_pip_by_type_sig_single$gene_name %in% genes_not_reported,],caption = htmltools::tags$caption( style = 'caption-side: topleft; text-align = left; color:black;','Genes not reported by multi-group analysis'),options = list(pageLength = 5) )DT::datatable(combined_pip_by_type_multi[combined_pip_by_type_multi$gene_name %in% genes_not_reported,],caption = htmltools::tags$caption( style = 'caption-side: topleft; text-align = left; color:black;','Genes not reported by multi-group analysis'),options = list(pageLength = 5) )gene_multi_unique_type <- combined_pip_by_type_sig_multi[!combined_pip_by_type_sig_multi$gene_name %in% combined_pip_by_type_sig_single$gene_name,]
p1 <- plot_heatmap(heatmap_data = gene_multi_unique_type, main = "Unique genes found by multi-group analysis")
combined_pip_by_context_sig_multi <- combined_pip_by_context_multi[combined_pip_by_context_multi$combined_pip > 0.8,]
gene_multi_unique_context <- combined_pip_by_context_sig_multi[!combined_pip_by_context_sig_multi$gene_name %in% combined_pip_by_type_sig_single$gene_name,]
p2 <- plot_heatmap(heatmap_data = gene_multi_unique_context, main = "Unique genes found by multi-group analysis")
g1 <- p1$gtable
g2 <- p2$gtable
gridExtra::grid.arrange(g1, g2, ncol=2)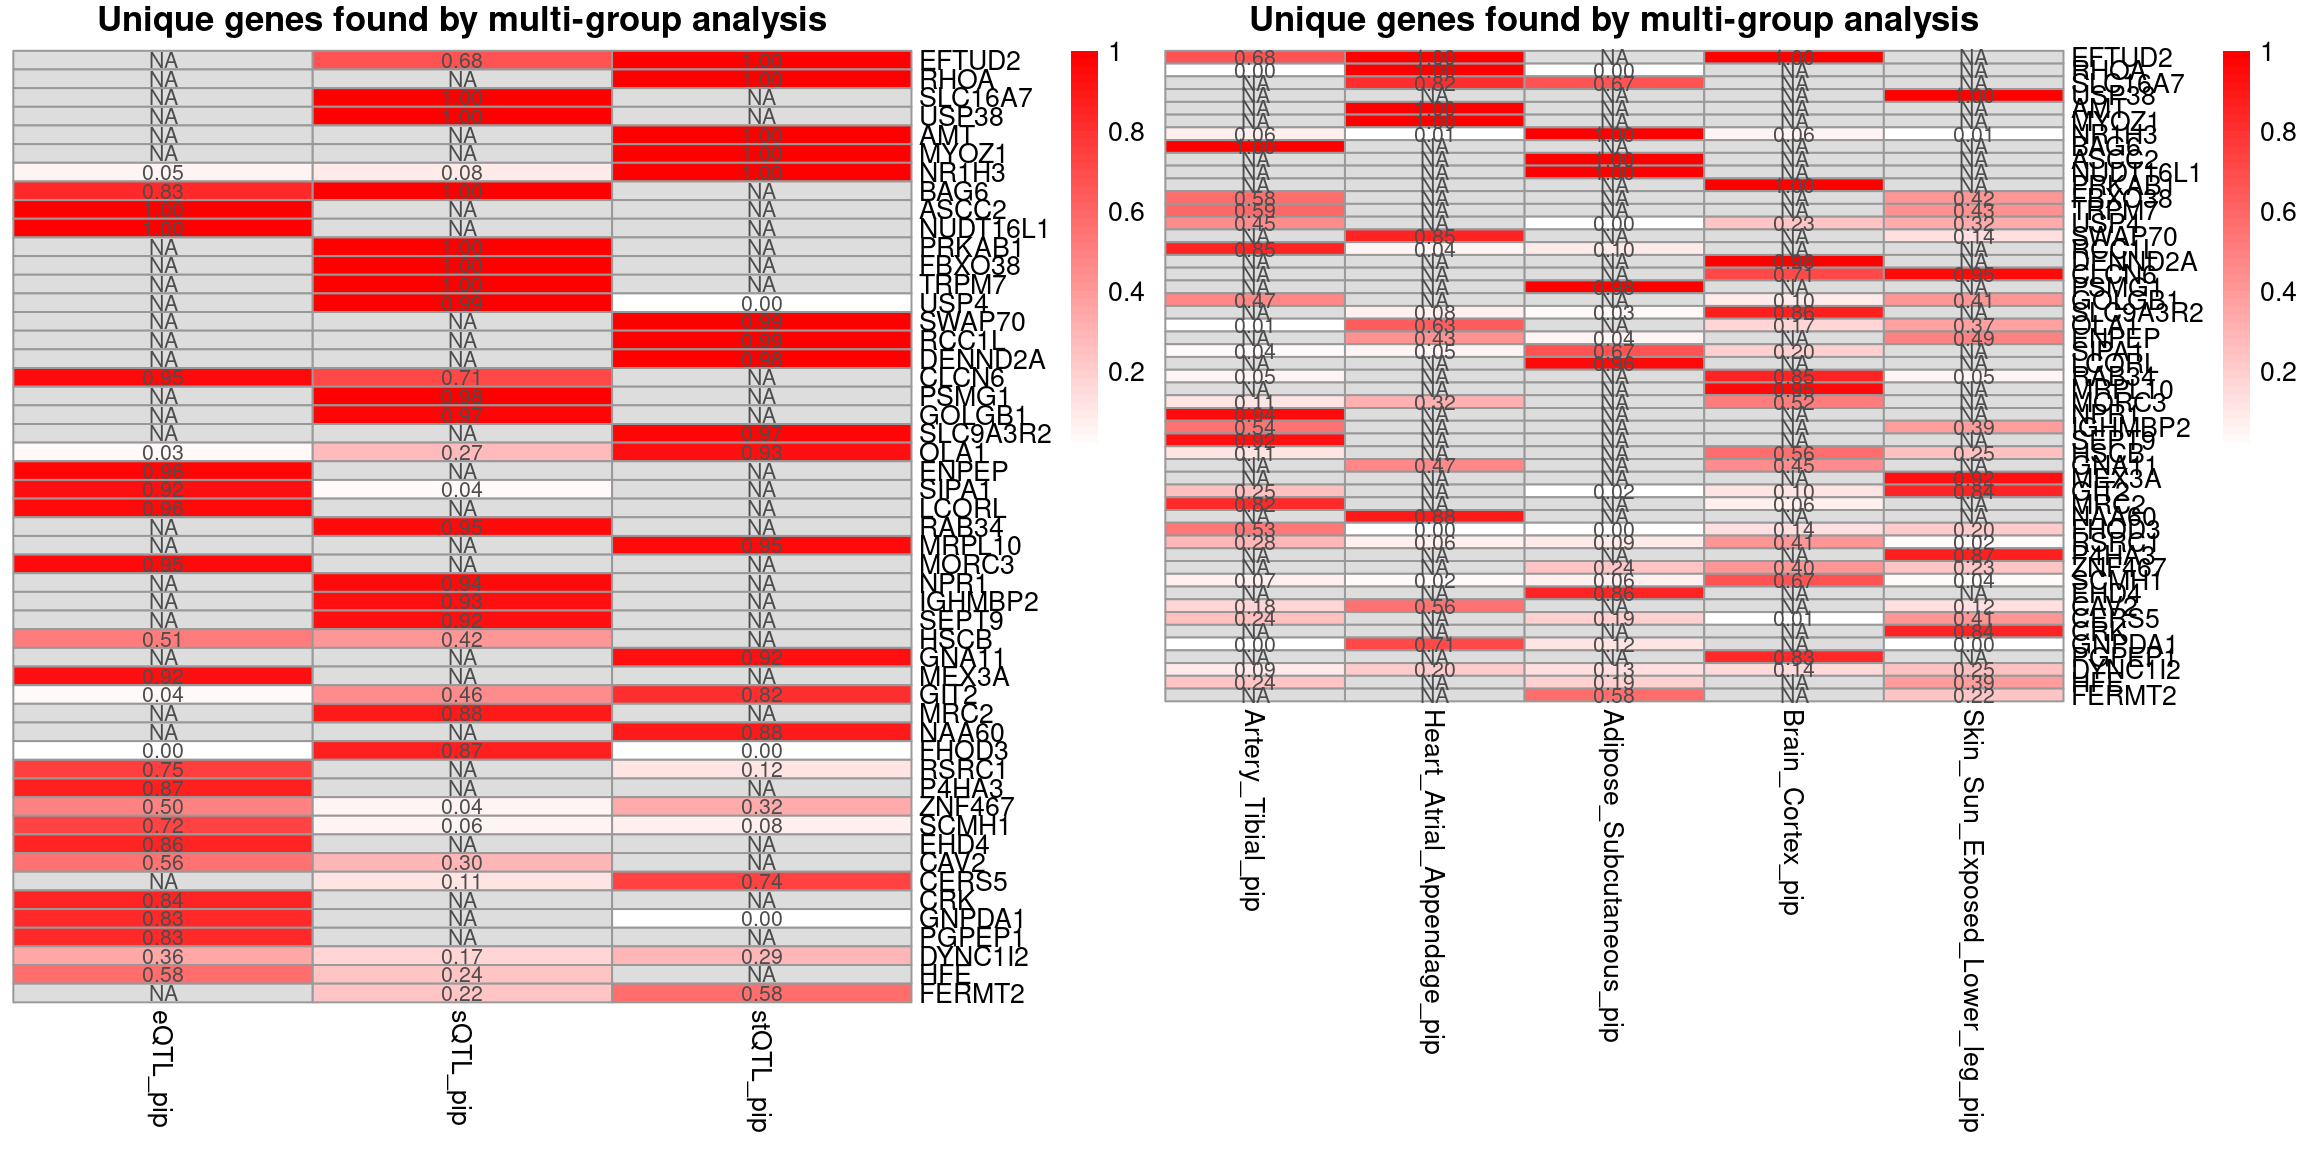
SCZ-ieu-b-5102
trait <- "SCZ-ieu-b-5102"
gwas_n <- samplesize[trait]
tissue <- c("Brain_Hippocampus","Adrenal_Gland","Brain_Spinal_cord_cervical_c-1","Spleen","Heart_Left_Ventricle")


results_dir_multi <- paste0("/project/xinhe/xsun/multi_group_ctwas/11.multi_group_1008/results/",trait,"/")
ctwas_res_multi <- readRDS(paste0(results_dir_multi,trait,".ctwas.res.RDS"))

param_multi <- ctwas_res_multi$param
make_convergence_plots(param_multi, gwas_n, colors = colors)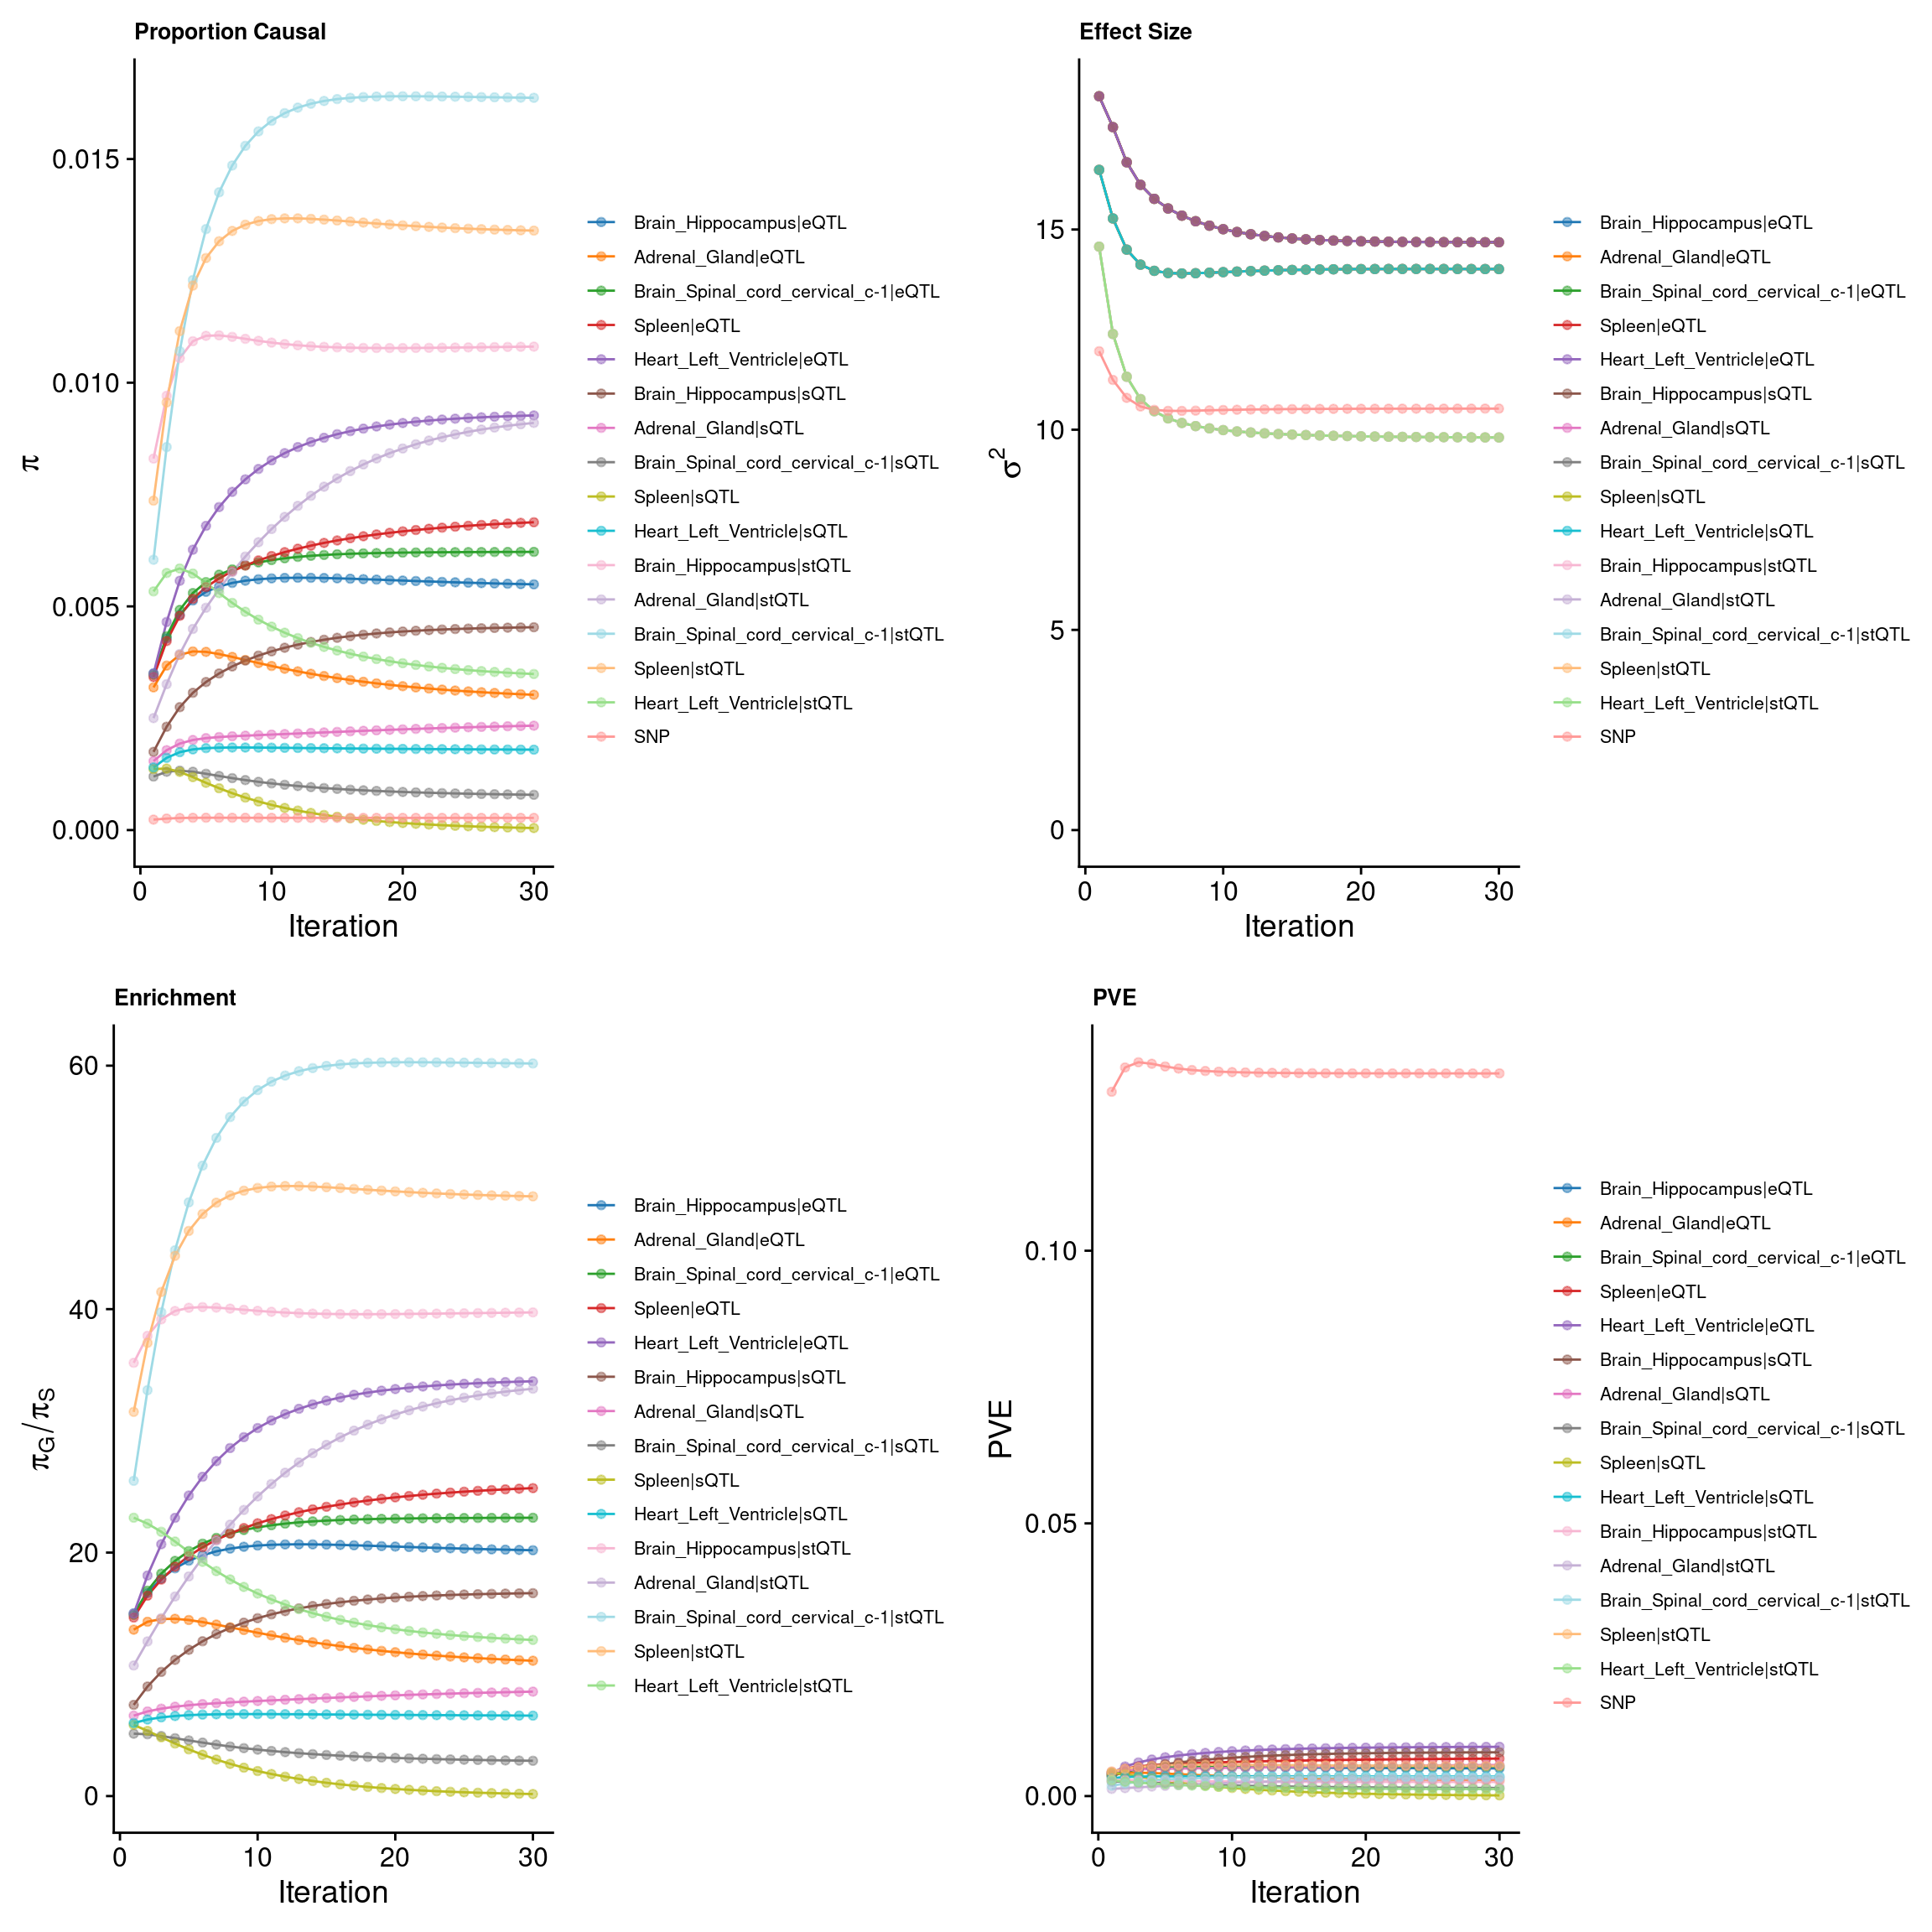
ctwas_parameters_multi <- summarize_param(param_multi, gwas_n)
pve_pie_by_type_multi <- plot_piechart(ctwas_parameters = ctwas_parameters_multi, colors = colors, by = "type")
pve_pie_by_context_multi <- plot_piechart(ctwas_parameters = ctwas_parameters_multi, colors = colors, by = "context")

gridExtra::grid.arrange(pve_pie_by_type_multi,pve_pie_by_context_multi, ncol = 2)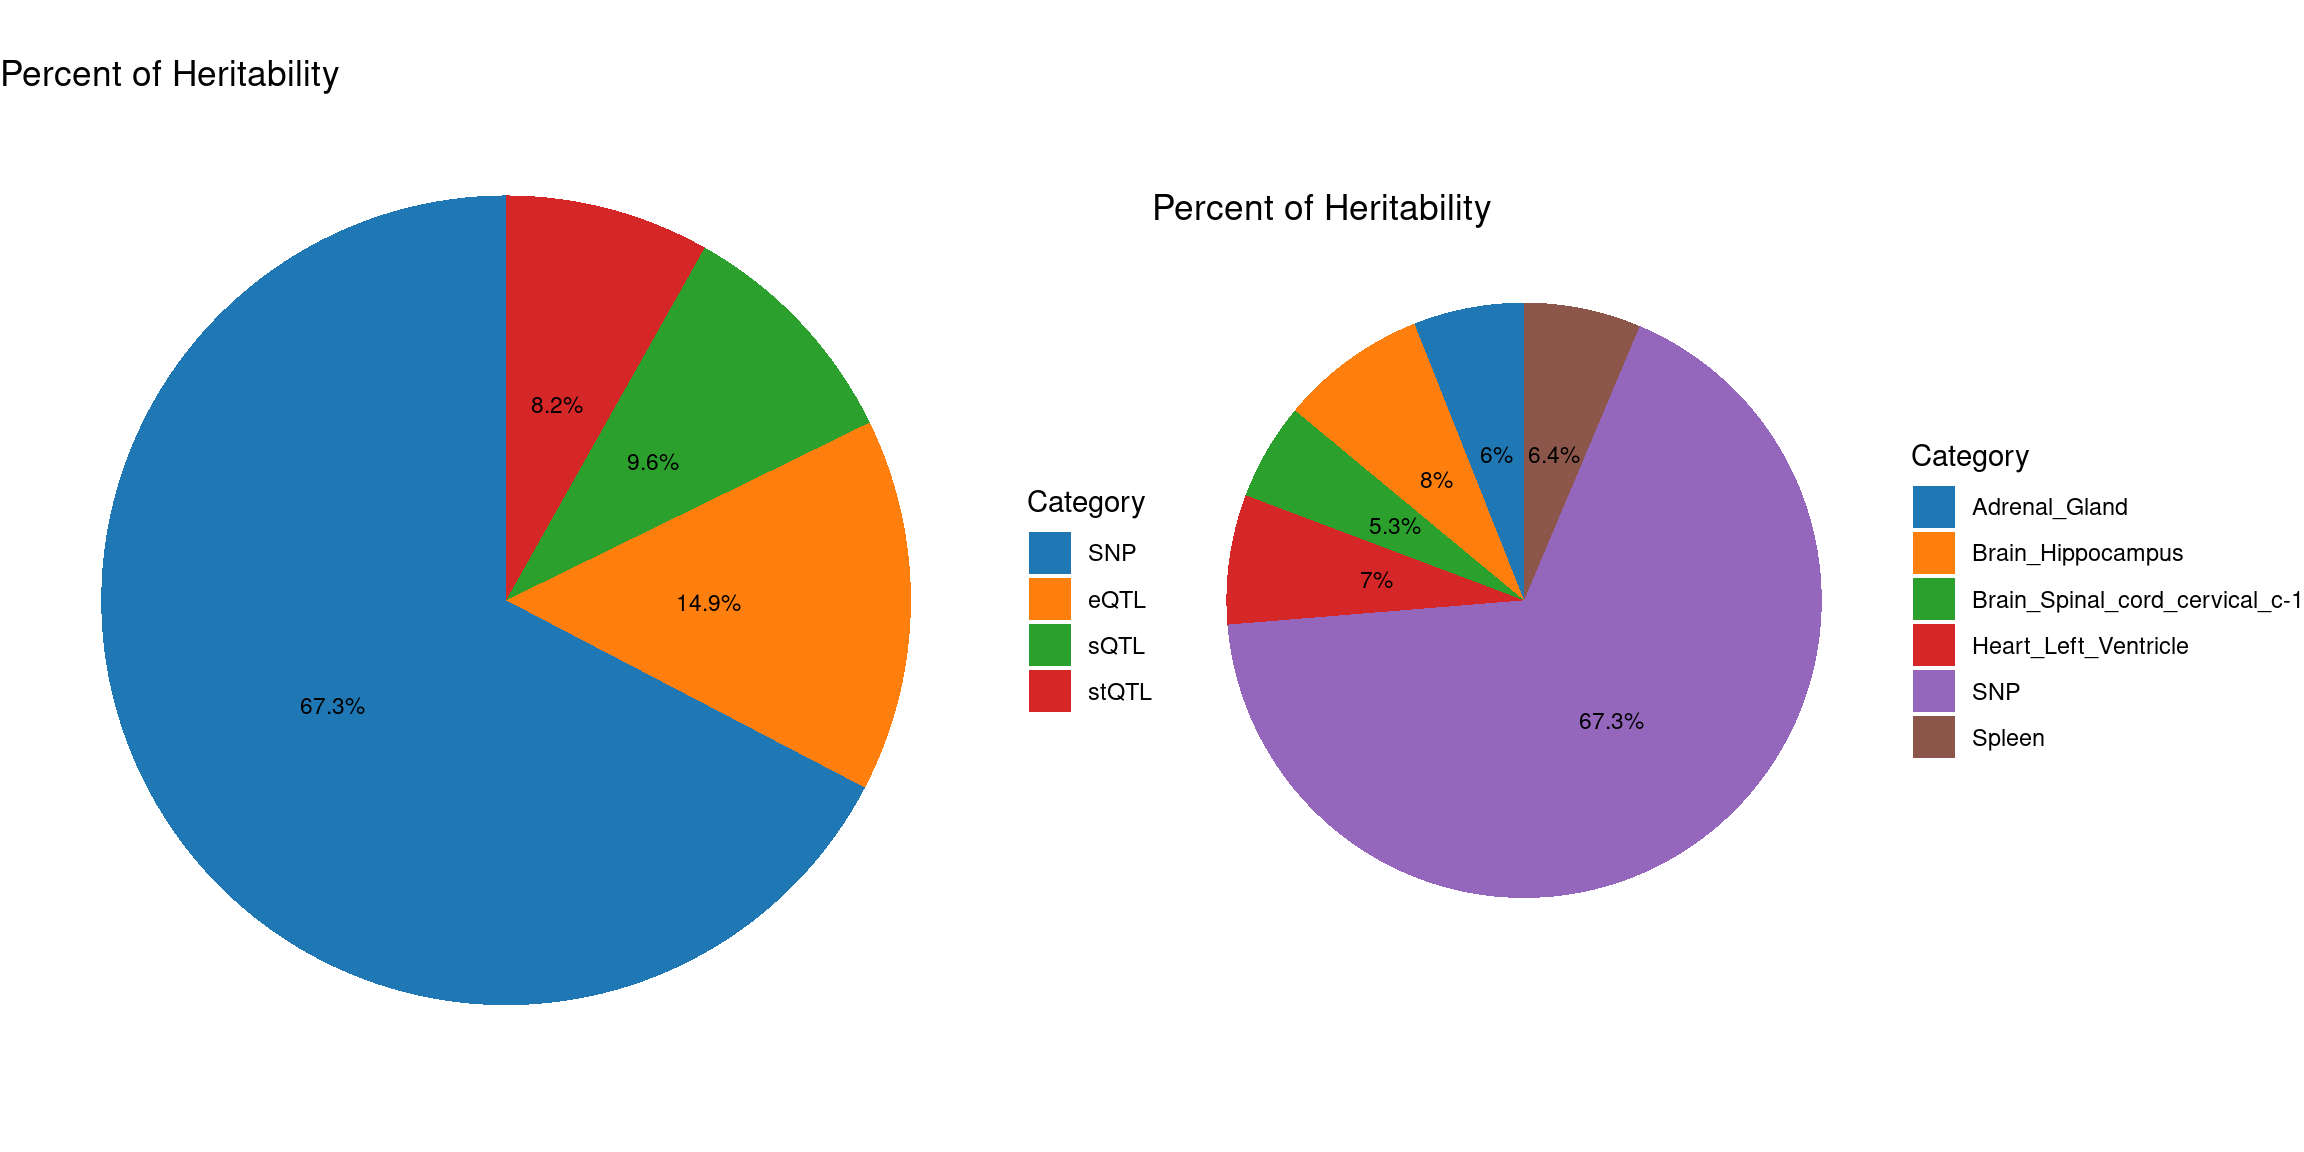
Fine-mapping
susie_alpha_res_multi <- ctwas_res_multi$susie_alpha_res

susie_alpha_res_multi <- anno_susie_alpha_res(susie_alpha_res_multi,
                                        mapping_table = mapping_two,
                                        map_by = "molecular_id",
                                        drop_unmapped = TRUE)
2024-10-15 14:58:19 INFO::Annotating susie alpha result ...
2024-10-15 14:58:19 INFO::Map molecular traits to genes
2024-10-15 14:58:19 INFO::Split PIPs for molecular traits mapped to multiple genescombined_pip_by_type_multi <- combine_gene_pips(susie_alpha_res_multi,
group_by = "gene_name",
by = "type",
method = "combine_cs",
filter_cs = TRUE,
include_cs_id = F)
combined_pip_by_type_cs_multi <- combine_gene_pips(susie_alpha_res_multi,
group_by = "gene_name",
by = "type",
method = "combine_cs",
filter_cs = TRUE,
include_cs_id = T)
combined_pip_by_context_cs_multi <- combine_gene_pips(susie_alpha_res_multi,
group_by = "gene_name",
by = "context",
method = "combine_cs",
filter_cs = TRUE,
include_cs_id = T)
combined_pip_by_context_multi <- combine_gene_pips(susie_alpha_res_multi,
group_by = "gene_name",
by = "context",
method = "combine_cs",
filter_cs = TRUE,
include_cs_id = F)
DT::datatable(combined_pip_by_type_cs_multi[combined_pip_by_type_cs_multi$combined_pip>0.8,],caption = htmltools::tags$caption( style = 'caption-side: topleft; text-align = left; color:black;','Combined PIP by omics'),options = list(pageLength = 5) )DT::datatable(combined_pip_by_context_cs_multi[combined_pip_by_context_cs_multi$combined_pip>0.8,],caption = htmltools::tags$caption( style = 'caption-side: topleft; text-align = left; color:black;','Combined PIP by tissue'),options = list(pageLength = 5) )pie1 <- draw_gene_piechart_type(data = combined_pip_by_type_multi,colors = colors)
pie2 <- draw_gene_piechart_tissue(data = combined_pip_by_context_multi,colors = colors)
gridExtra::grid.arrange(pie1,pie2, ncol = 2)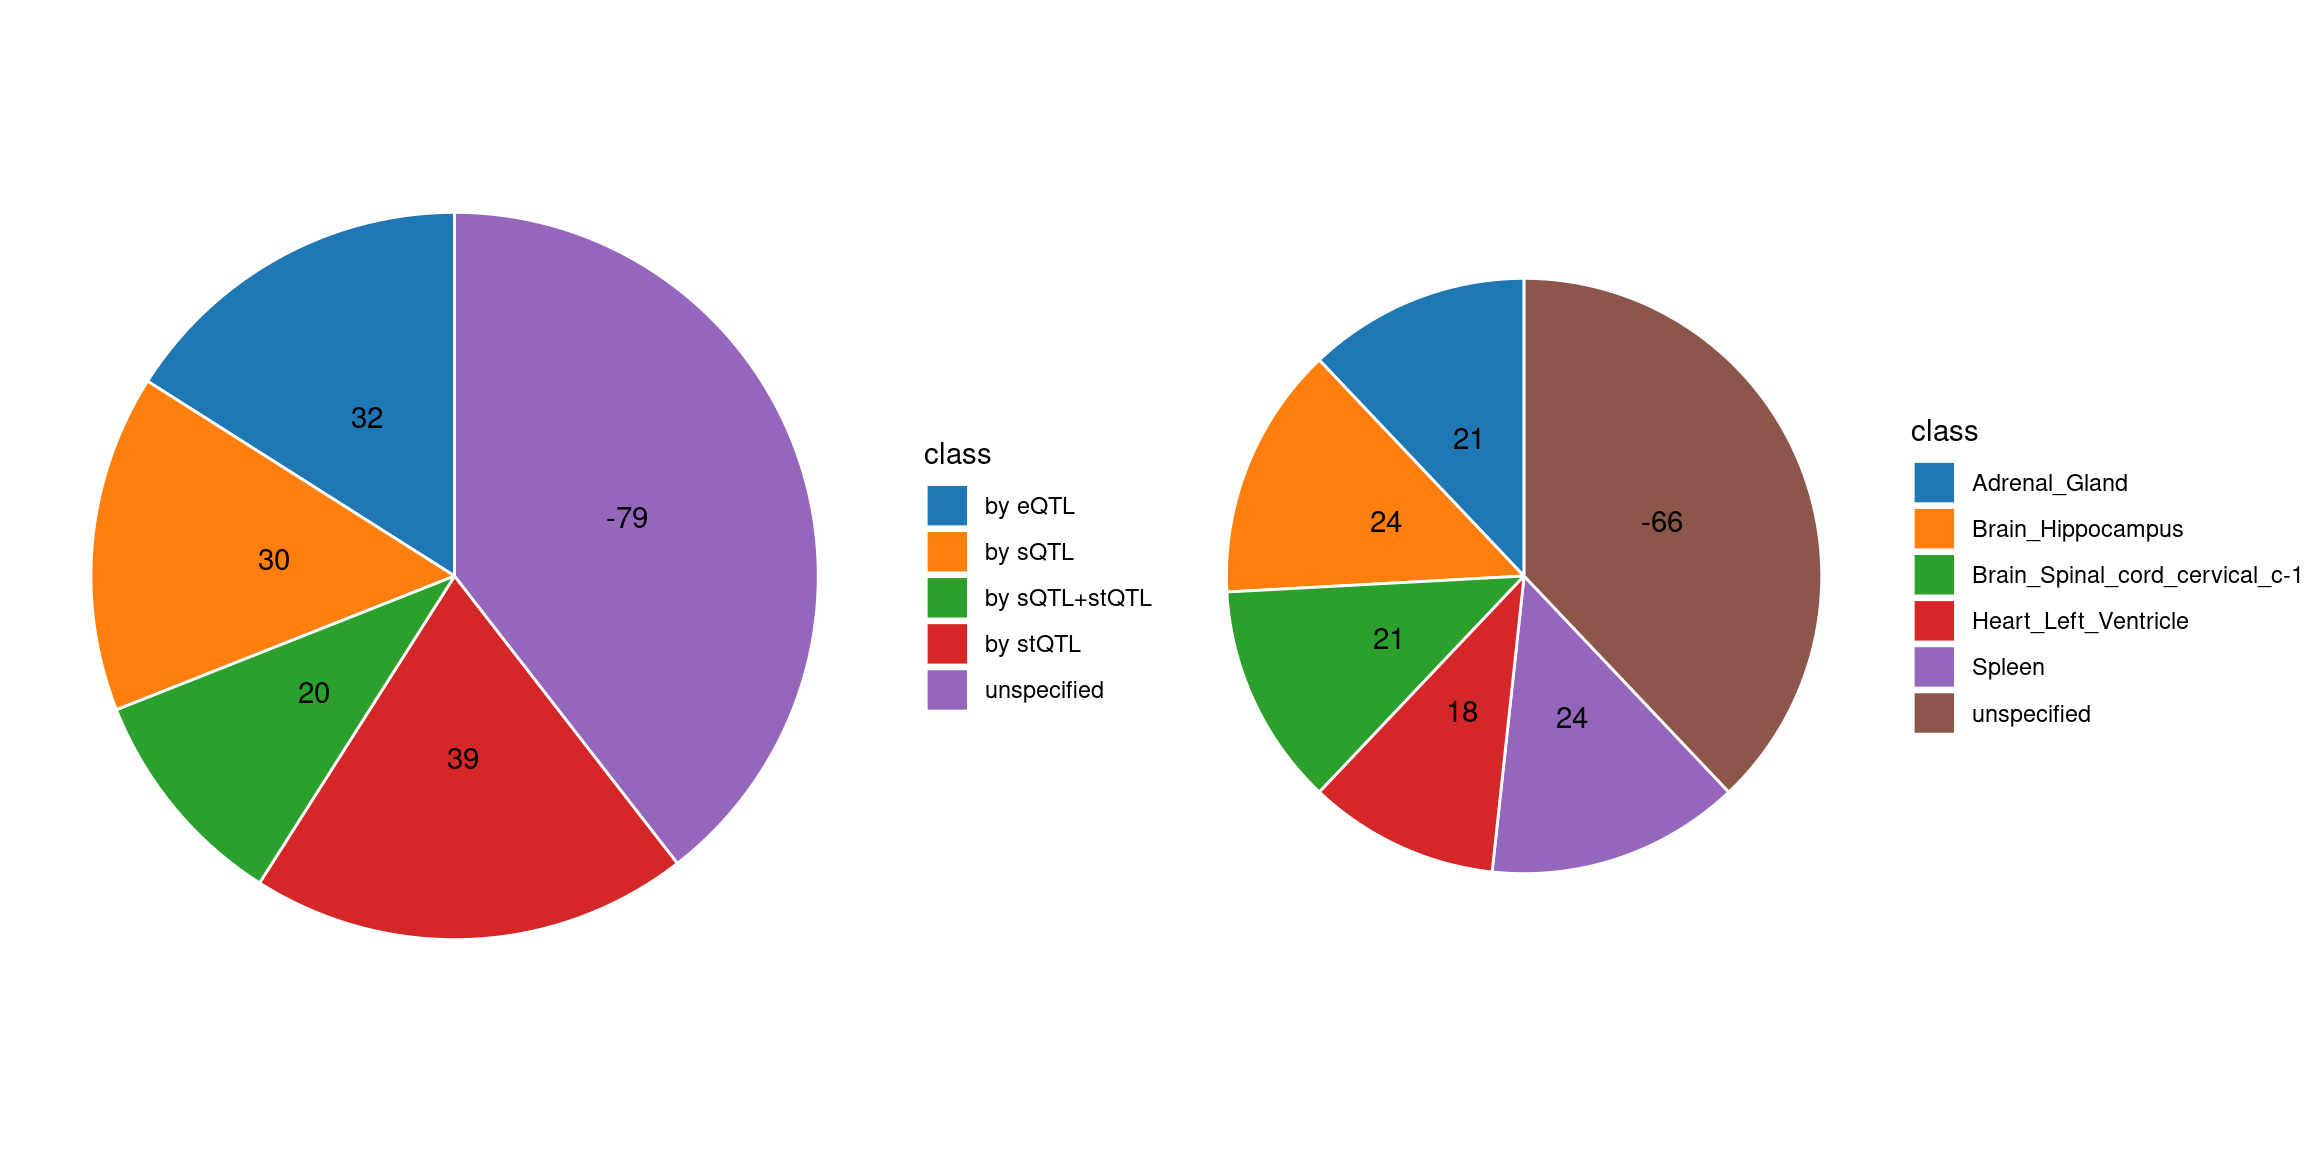
Comparing with single tissue + eQTL analysis
ctwas_res_single <- readRDS(paste0("/project/xinhe/xsun/multi_group_ctwas/10.single_tissue_1007/results/",trait,"/",tissue[1],"/",trait,"_",tissue[1], ".ctwas.res.RDS"))

susie_alpha_res_single <- ctwas_res_single$susie_alpha_res

susie_alpha_res_single <- anno_susie_alpha_res(susie_alpha_res_single,
                                        mapping_table = mapping_predictdb,
                                        map_by = "molecular_id",
                                        drop_unmapped = TRUE)
2024-10-15 14:58:30 INFO::Annotating susie alpha result ...
2024-10-15 14:58:30 INFO::Map molecular traits to genescombined_pip_by_type_single <- combine_gene_pips(susie_alpha_res_single,
group_by = "gene_name",
by = "type",
method = "combine_cs",
filter_cs = TRUE,
include_cs_id = F)
combined_pip_by_type_sig_single <- combined_pip_by_type_single[combined_pip_by_type_single$combined_pip > 0.8,]
combined_pip_by_type_sig_multi <- combined_pip_by_type_multi[combined_pip_by_type_multi$combined_pip > 0.8,]
sprintf("Number of genes with PIP > 0.8 -- Multi-group = %s", nrow(combined_pip_by_type_sig_multi))[1] "Number of genes with PIP > 0.8 -- Multi-group = 42"sprintf("Number of genes with PIP > 0.8 -- single eQTL = %s", nrow(combined_pip_by_type_sig_single))[1] "Number of genes with PIP > 0.8 -- single eQTL = 14"sprintf("Number of overlapped genes = %s", sum(combined_pip_by_type_sig_single$gene_name %in% combined_pip_by_type_sig_multi$gene_name))[1] "Number of overlapped genes = 7"genes_not_reported <- combined_pip_by_type_sig_single$gene_name[!combined_pip_by_type_sig_single$gene_name %in%combined_pip_by_type_sig_multi$gene_name]
DT::datatable(combined_pip_by_type_sig_single[combined_pip_by_type_sig_single$gene_name %in% genes_not_reported,],caption = htmltools::tags$caption( style = 'caption-side: topleft; text-align = left; color:black;','Genes not reported by multi-group analysis'),options = list(pageLength = 5) )DT::datatable(combined_pip_by_type_multi[combined_pip_by_type_multi$gene_name %in% genes_not_reported,],caption = htmltools::tags$caption( style = 'caption-side: topleft; text-align = left; color:black;','Genes not reported by multi-group analysis'),options = list(pageLength = 5) )gene_multi_unique_type <- combined_pip_by_type_sig_multi[!combined_pip_by_type_sig_multi$gene_name %in% combined_pip_by_type_sig_single$gene_name,]
p1 <- plot_heatmap(heatmap_data = gene_multi_unique_type, main = "Unique genes found by multi-group analysis")
combined_pip_by_context_sig_multi <- combined_pip_by_context_multi[combined_pip_by_context_multi$combined_pip > 0.8,]
gene_multi_unique_context <- combined_pip_by_context_sig_multi[!combined_pip_by_context_sig_multi$gene_name %in% combined_pip_by_type_sig_single$gene_name,]
p2 <- plot_heatmap(heatmap_data = gene_multi_unique_context, main = "Unique genes found by multi-group analysis")
g1 <- p1$gtable
g2 <- p2$gtable
gridExtra::grid.arrange(g1, g2, ncol=2)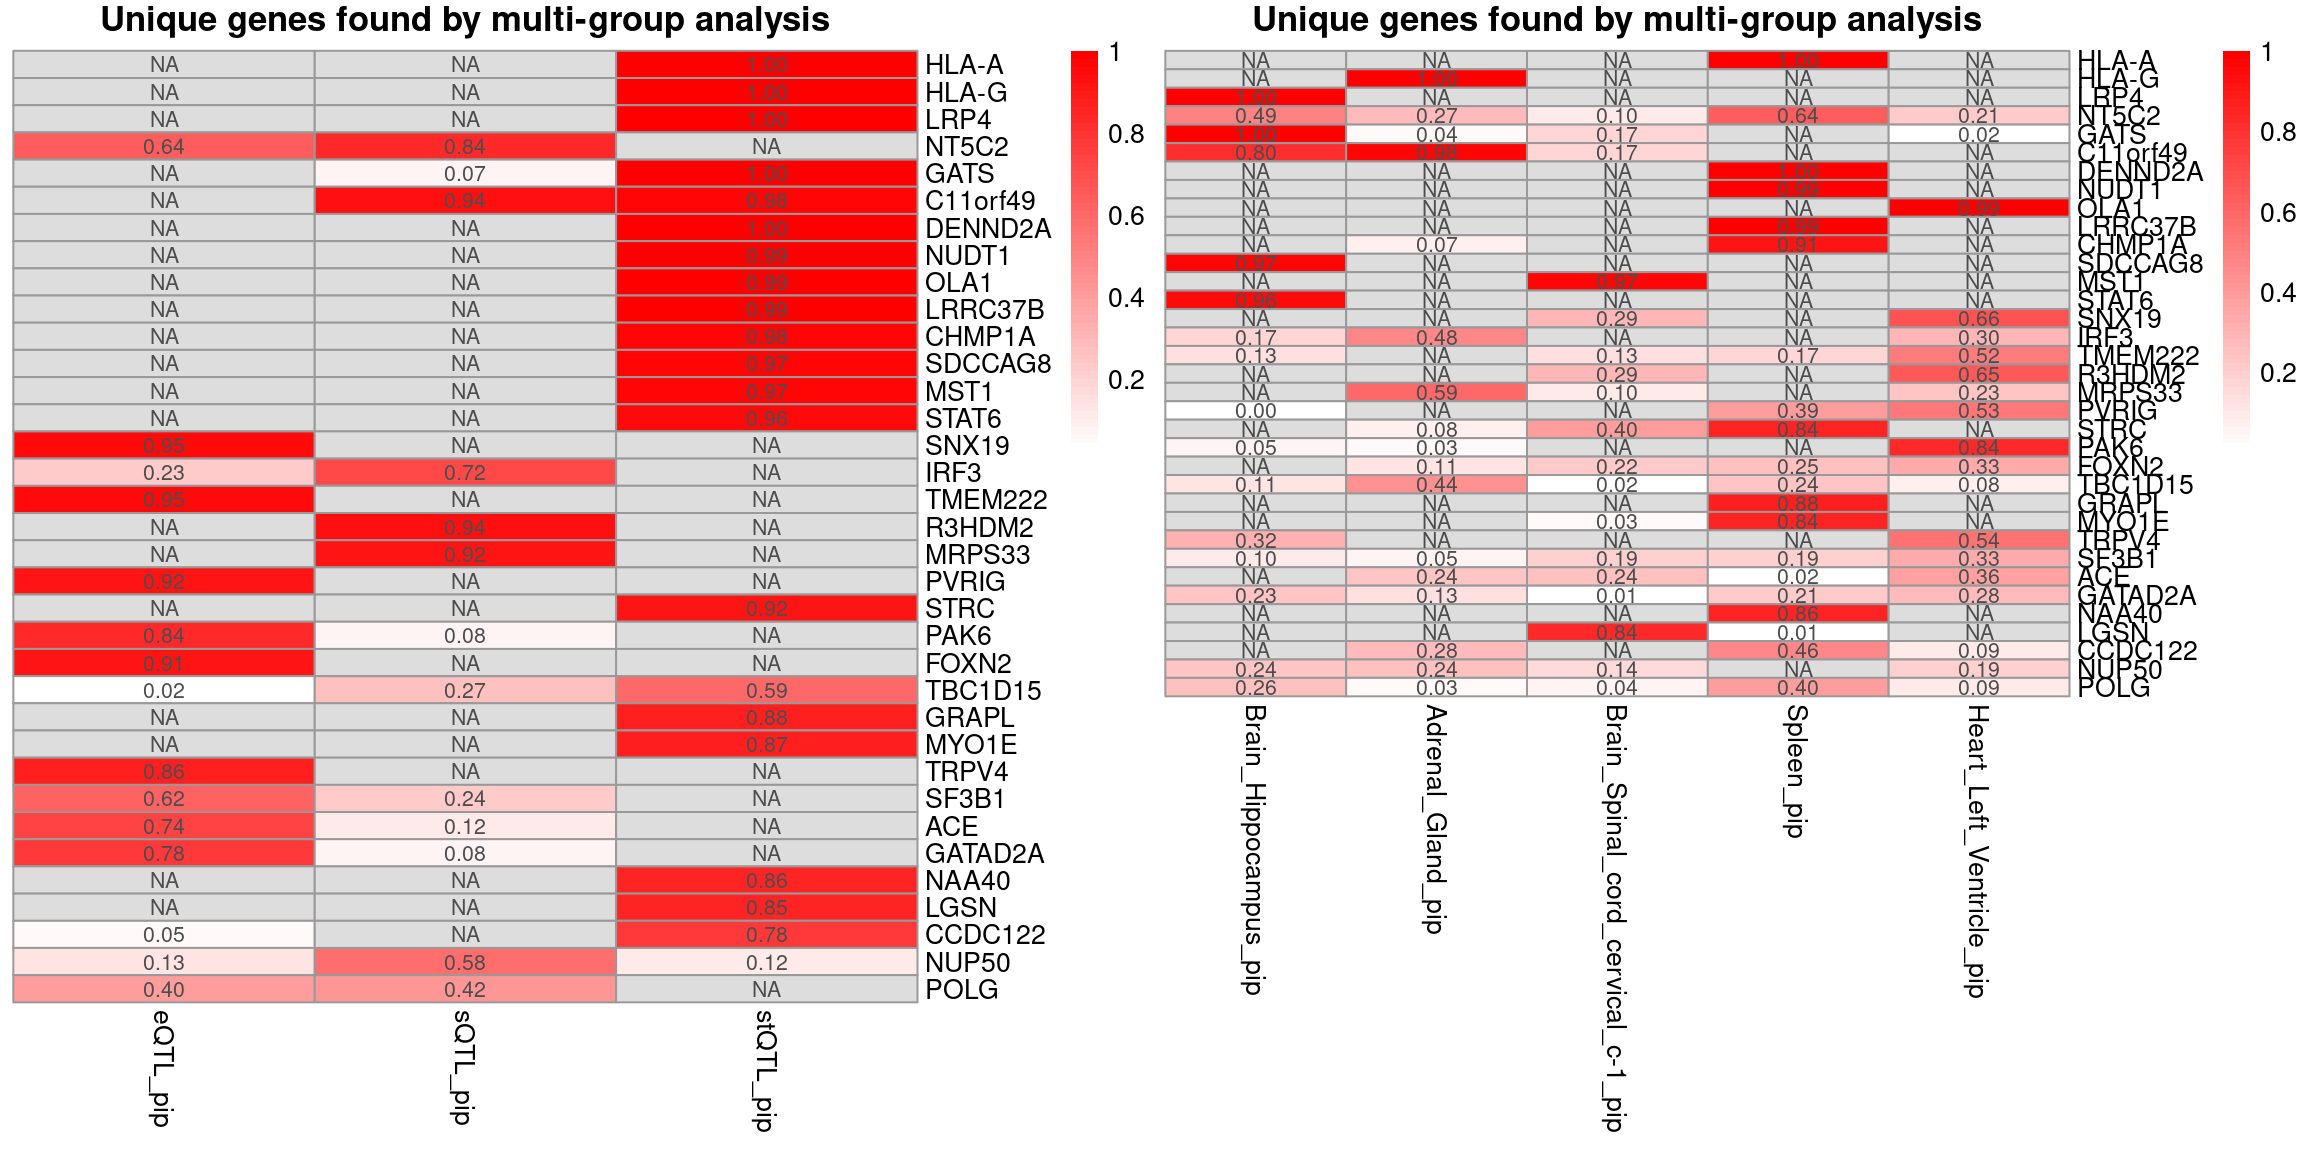
WBC-ieu-b-30
trait <- "WBC-ieu-b-30"
gwas_n <- samplesize[trait]
tissue <- c("Whole_Blood","Adipose_Subcutaneous","Esophagus_Muscularis","Cells_Cultured_fibroblasts","Thyroid")


results_dir_multi <- paste0("/project/xinhe/xsun/multi_group_ctwas/11.multi_group_1008/results/",trait,"/")
ctwas_res_multi <- readRDS(paste0(results_dir_multi,trait,".ctwas.res.RDS"))

param_multi <- ctwas_res_multi$param
make_convergence_plots(param_multi, gwas_n, colors = colors)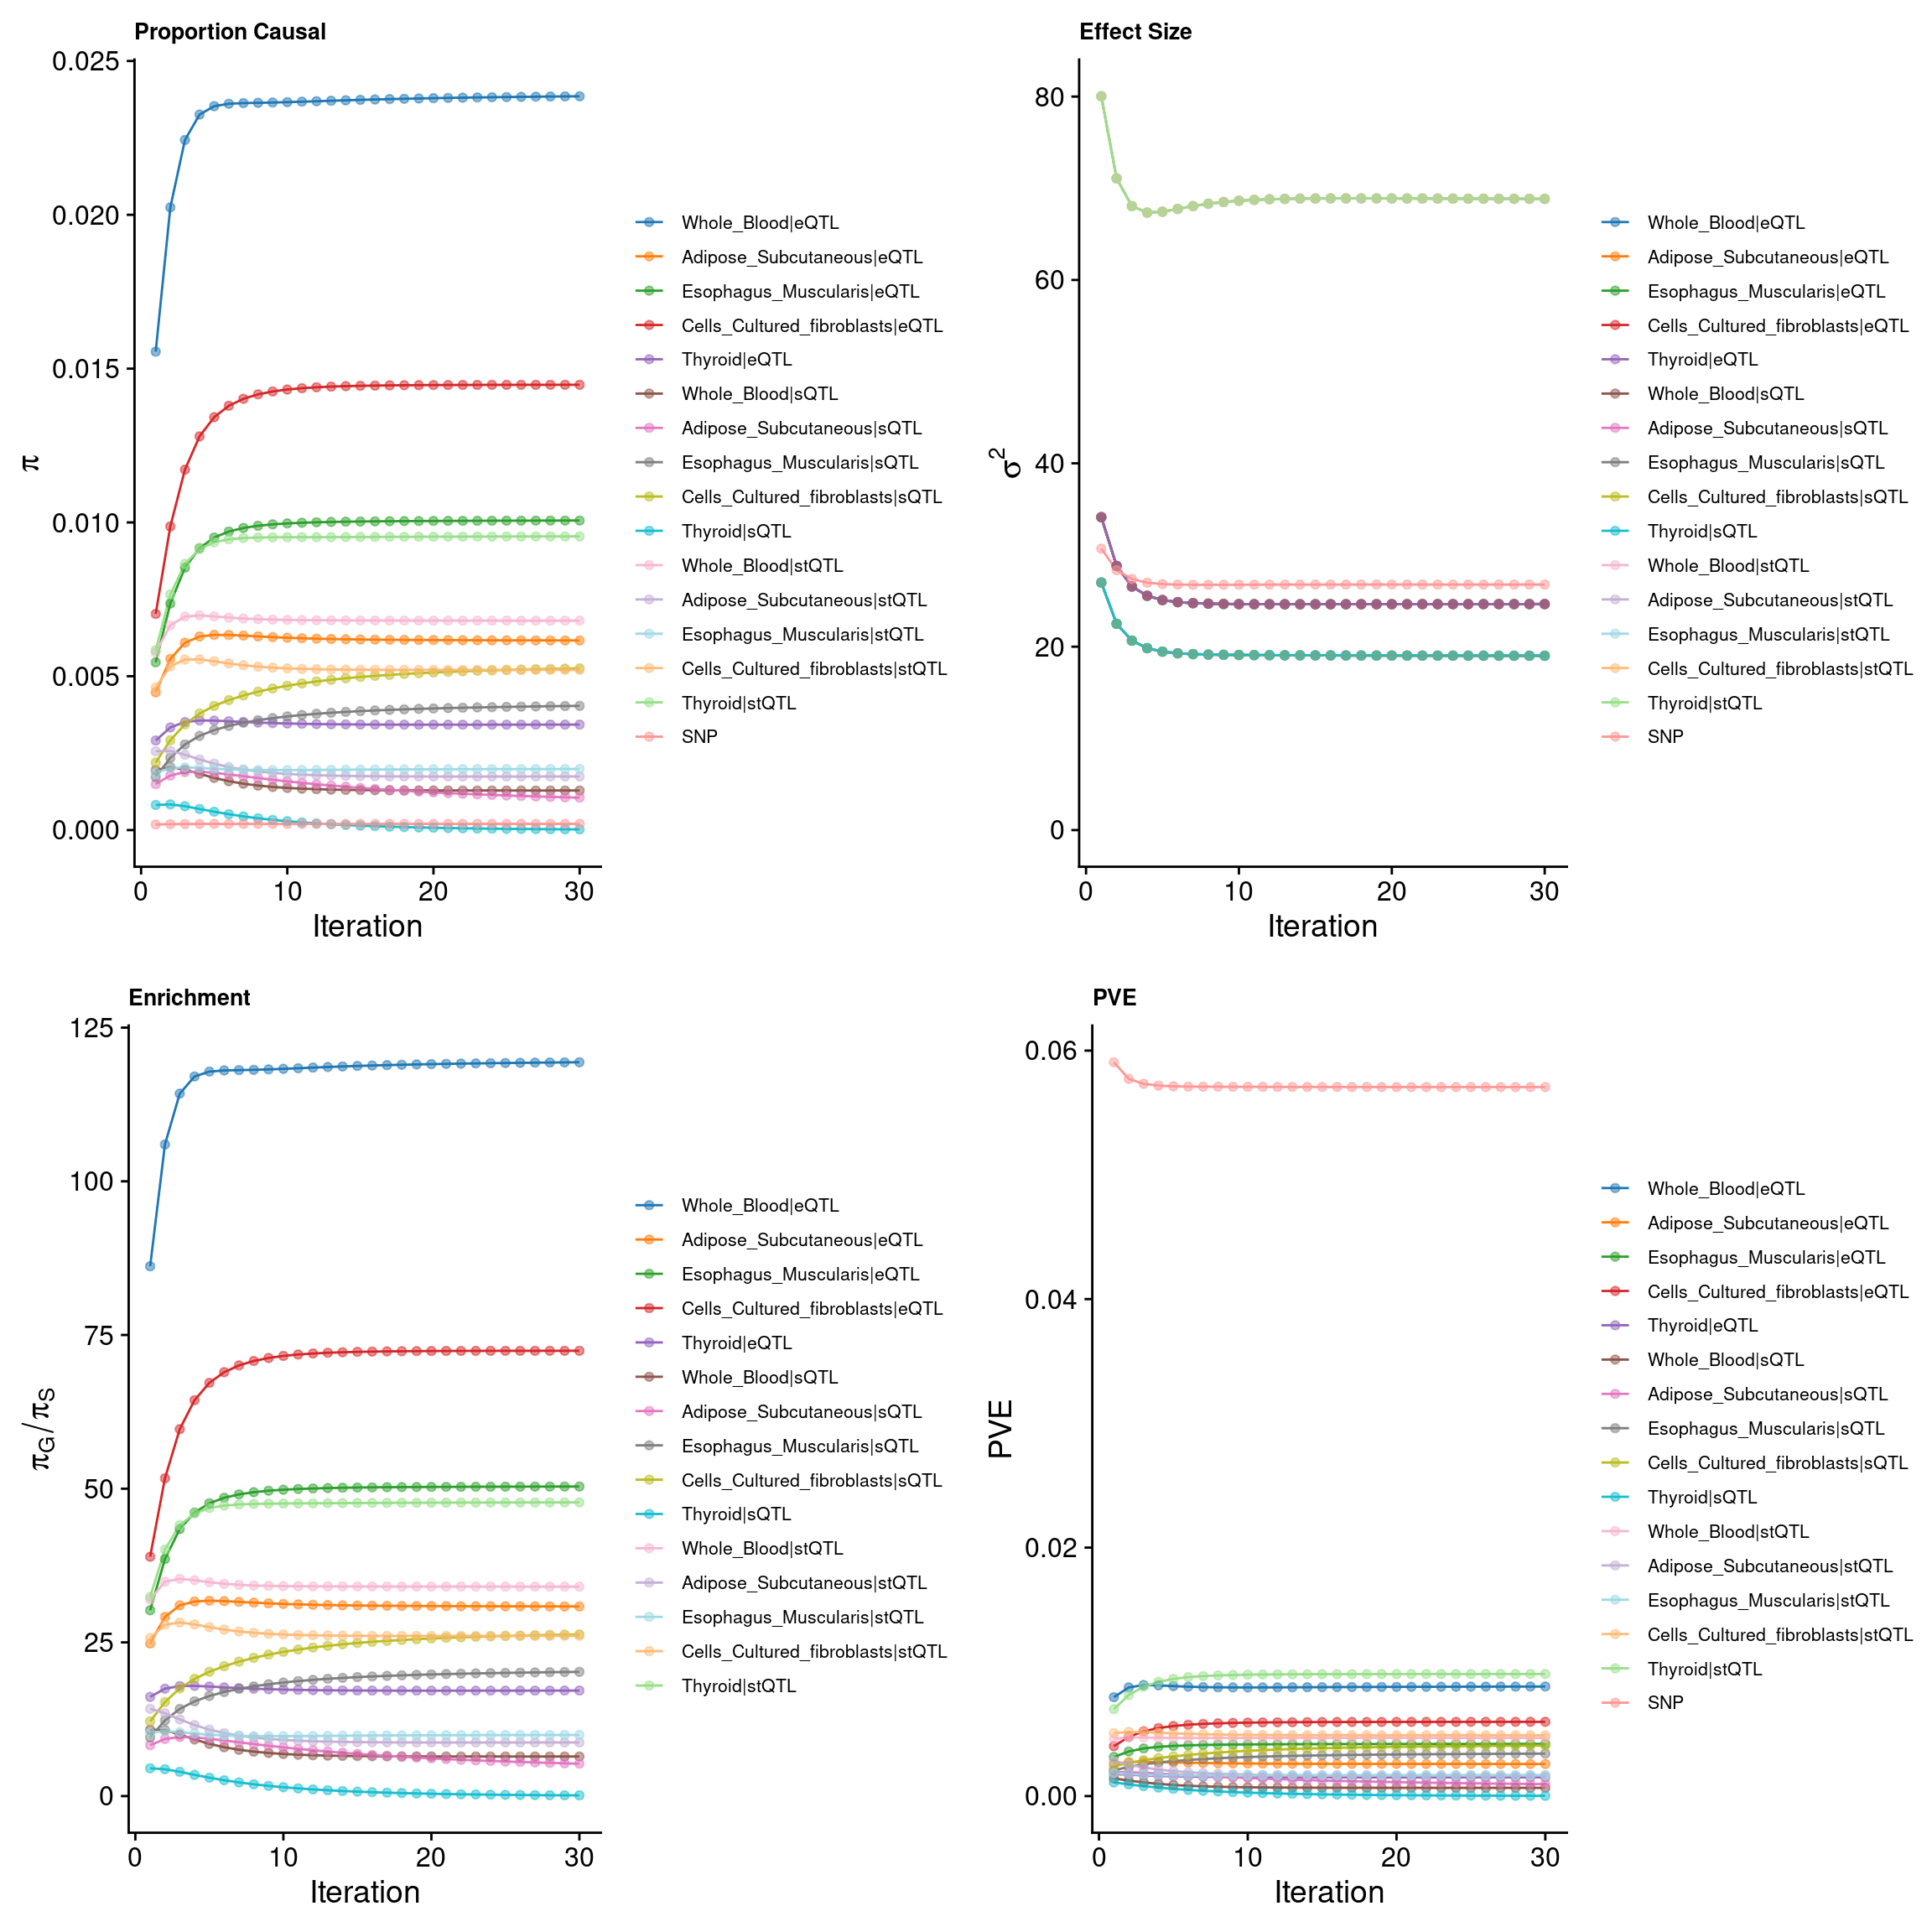
ctwas_parameters_multi <- summarize_param(param_multi, gwas_n)
pve_pie_by_type_multi <- plot_piechart(ctwas_parameters = ctwas_parameters_multi, colors = colors, by = "type")
pve_pie_by_context_multi <- plot_piechart(ctwas_parameters = ctwas_parameters_multi, colors = colors, by = "context")

gridExtra::grid.arrange(pve_pie_by_type_multi,pve_pie_by_context_multi, ncol = 2)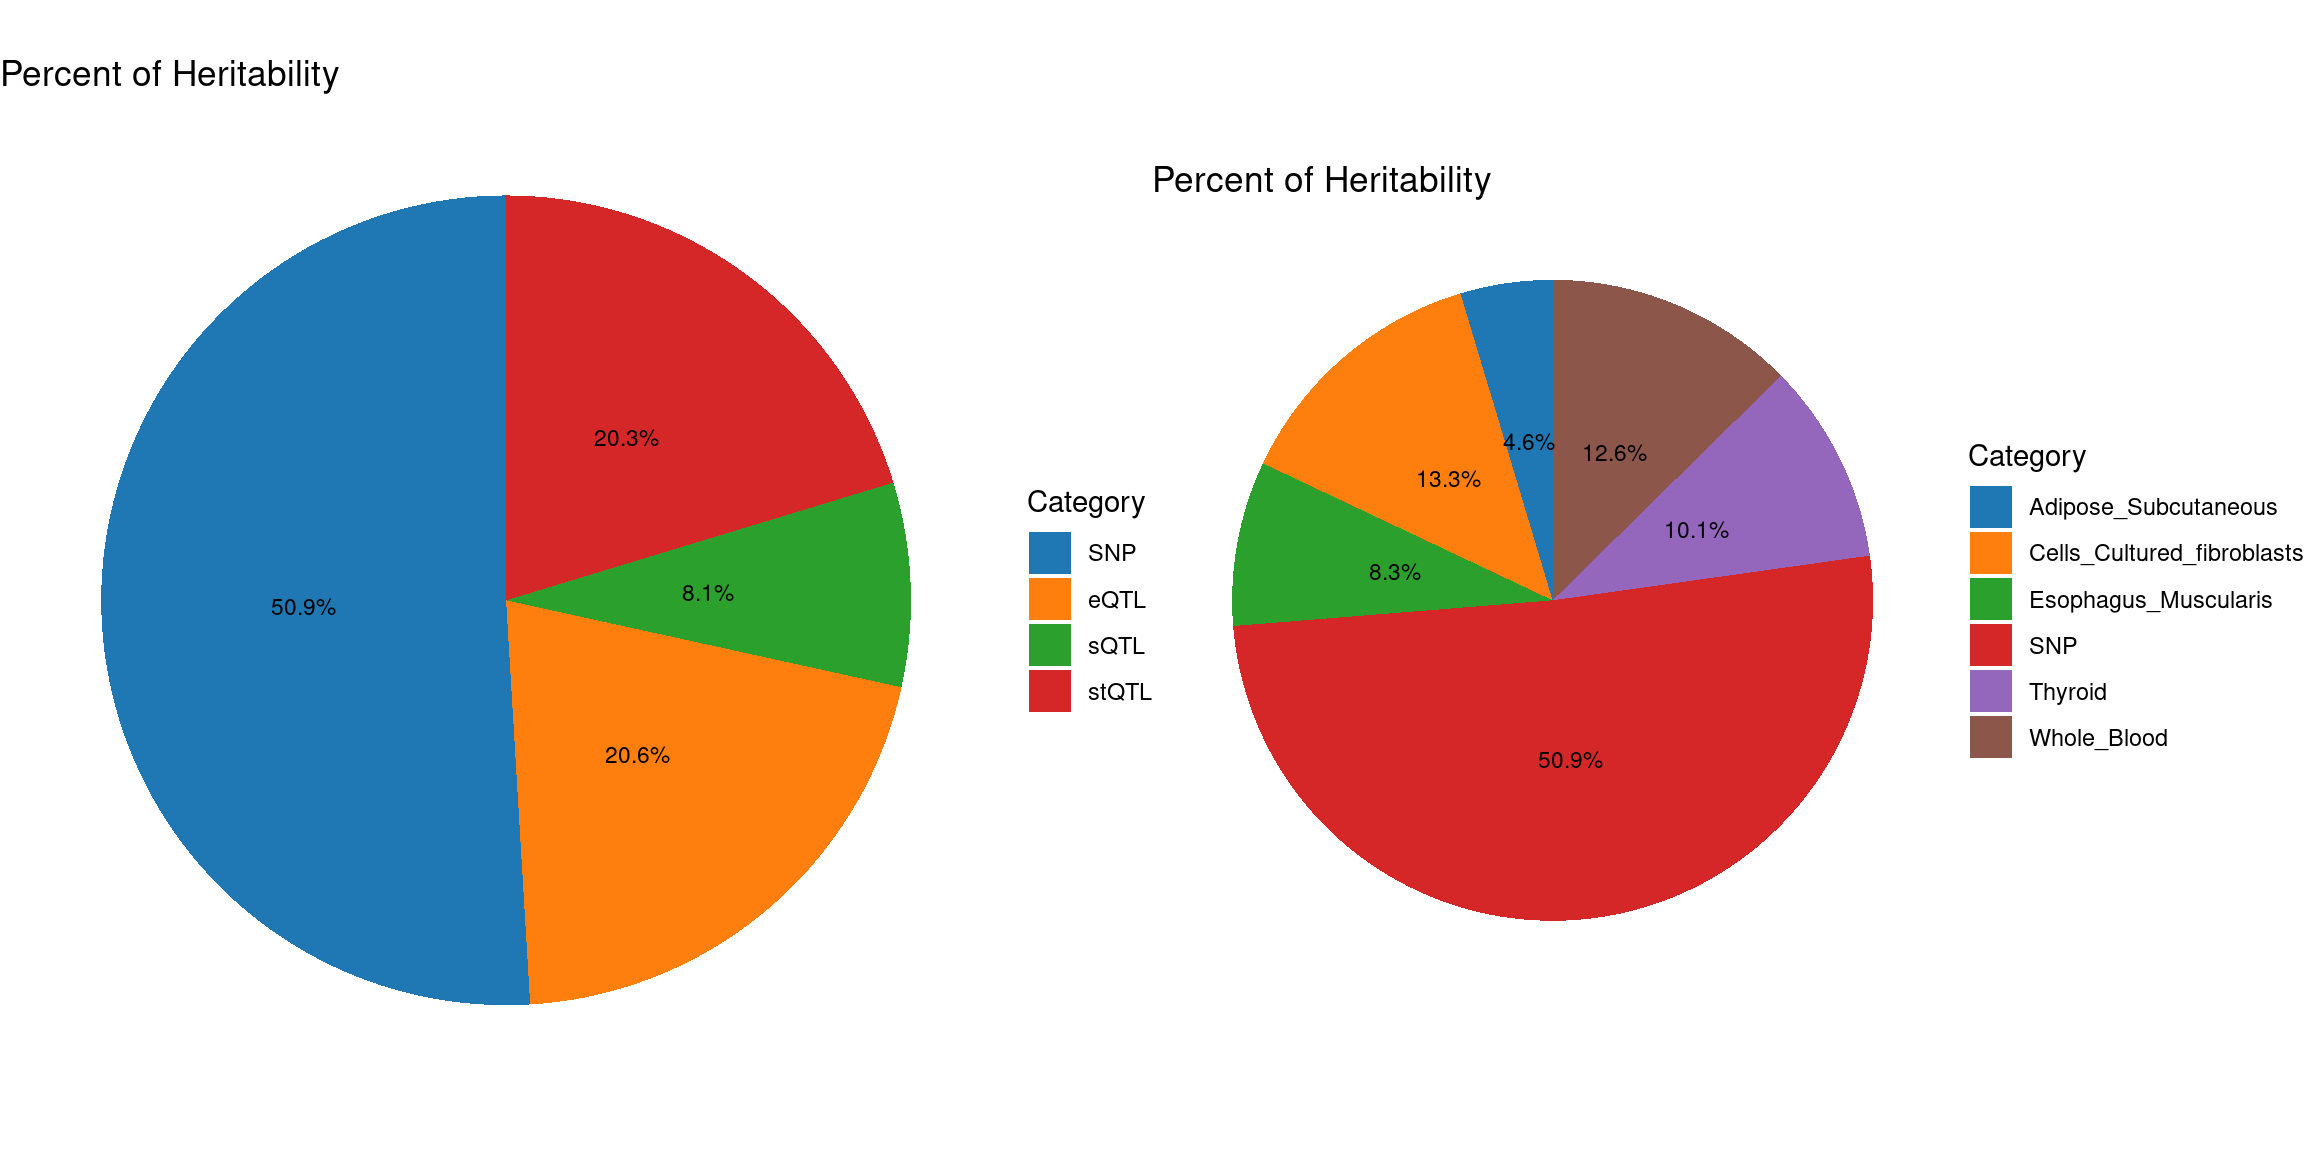
Fine-mapping
susie_alpha_res_multi <- ctwas_res_multi$susie_alpha_res

susie_alpha_res_multi <- anno_susie_alpha_res(susie_alpha_res_multi,
                                        mapping_table = mapping_two,
                                        map_by = "molecular_id",
                                        drop_unmapped = TRUE)
2024-10-15 14:58:51 INFO::Annotating susie alpha result ...
2024-10-15 14:58:51 INFO::Map molecular traits to genes
2024-10-15 14:58:52 INFO::Split PIPs for molecular traits mapped to multiple genescombined_pip_by_type_multi <- combine_gene_pips(susie_alpha_res_multi,
group_by = "gene_name",
by = "type",
method = "combine_cs",
filter_cs = TRUE,
include_cs_id = F)
combined_pip_by_type_cs_multi <- combine_gene_pips(susie_alpha_res_multi,
group_by = "gene_name",
by = "type",
method = "combine_cs",
filter_cs = TRUE,
include_cs_id = T)
combined_pip_by_context_cs_multi <- combine_gene_pips(susie_alpha_res_multi,
group_by = "gene_name",
by = "context",
method = "combine_cs",
filter_cs = TRUE,
include_cs_id = T)
combined_pip_by_context_multi <- combine_gene_pips(susie_alpha_res_multi,
group_by = "gene_name",
by = "context",
method = "combine_cs",
filter_cs = TRUE,
include_cs_id = F)
DT::datatable(combined_pip_by_type_cs_multi[combined_pip_by_type_cs_multi$combined_pip>0.8,],caption = htmltools::tags$caption( style = 'caption-side: topleft; text-align = left; color:black;','Combined PIP by omics'),options = list(pageLength = 5) )DT::datatable(combined_pip_by_context_cs_multi[combined_pip_by_context_cs_multi$combined_pip>0.8,],caption = htmltools::tags$caption( style = 'caption-side: topleft; text-align = left; color:black;','Combined PIP by tissue'),options = list(pageLength = 5) )pie1 <- draw_gene_piechart_type(data = combined_pip_by_type_multi,colors = colors)
pie2 <- draw_gene_piechart_tissue(data = combined_pip_by_context_multi,colors = colors)
gridExtra::grid.arrange(pie1,pie2, ncol = 2)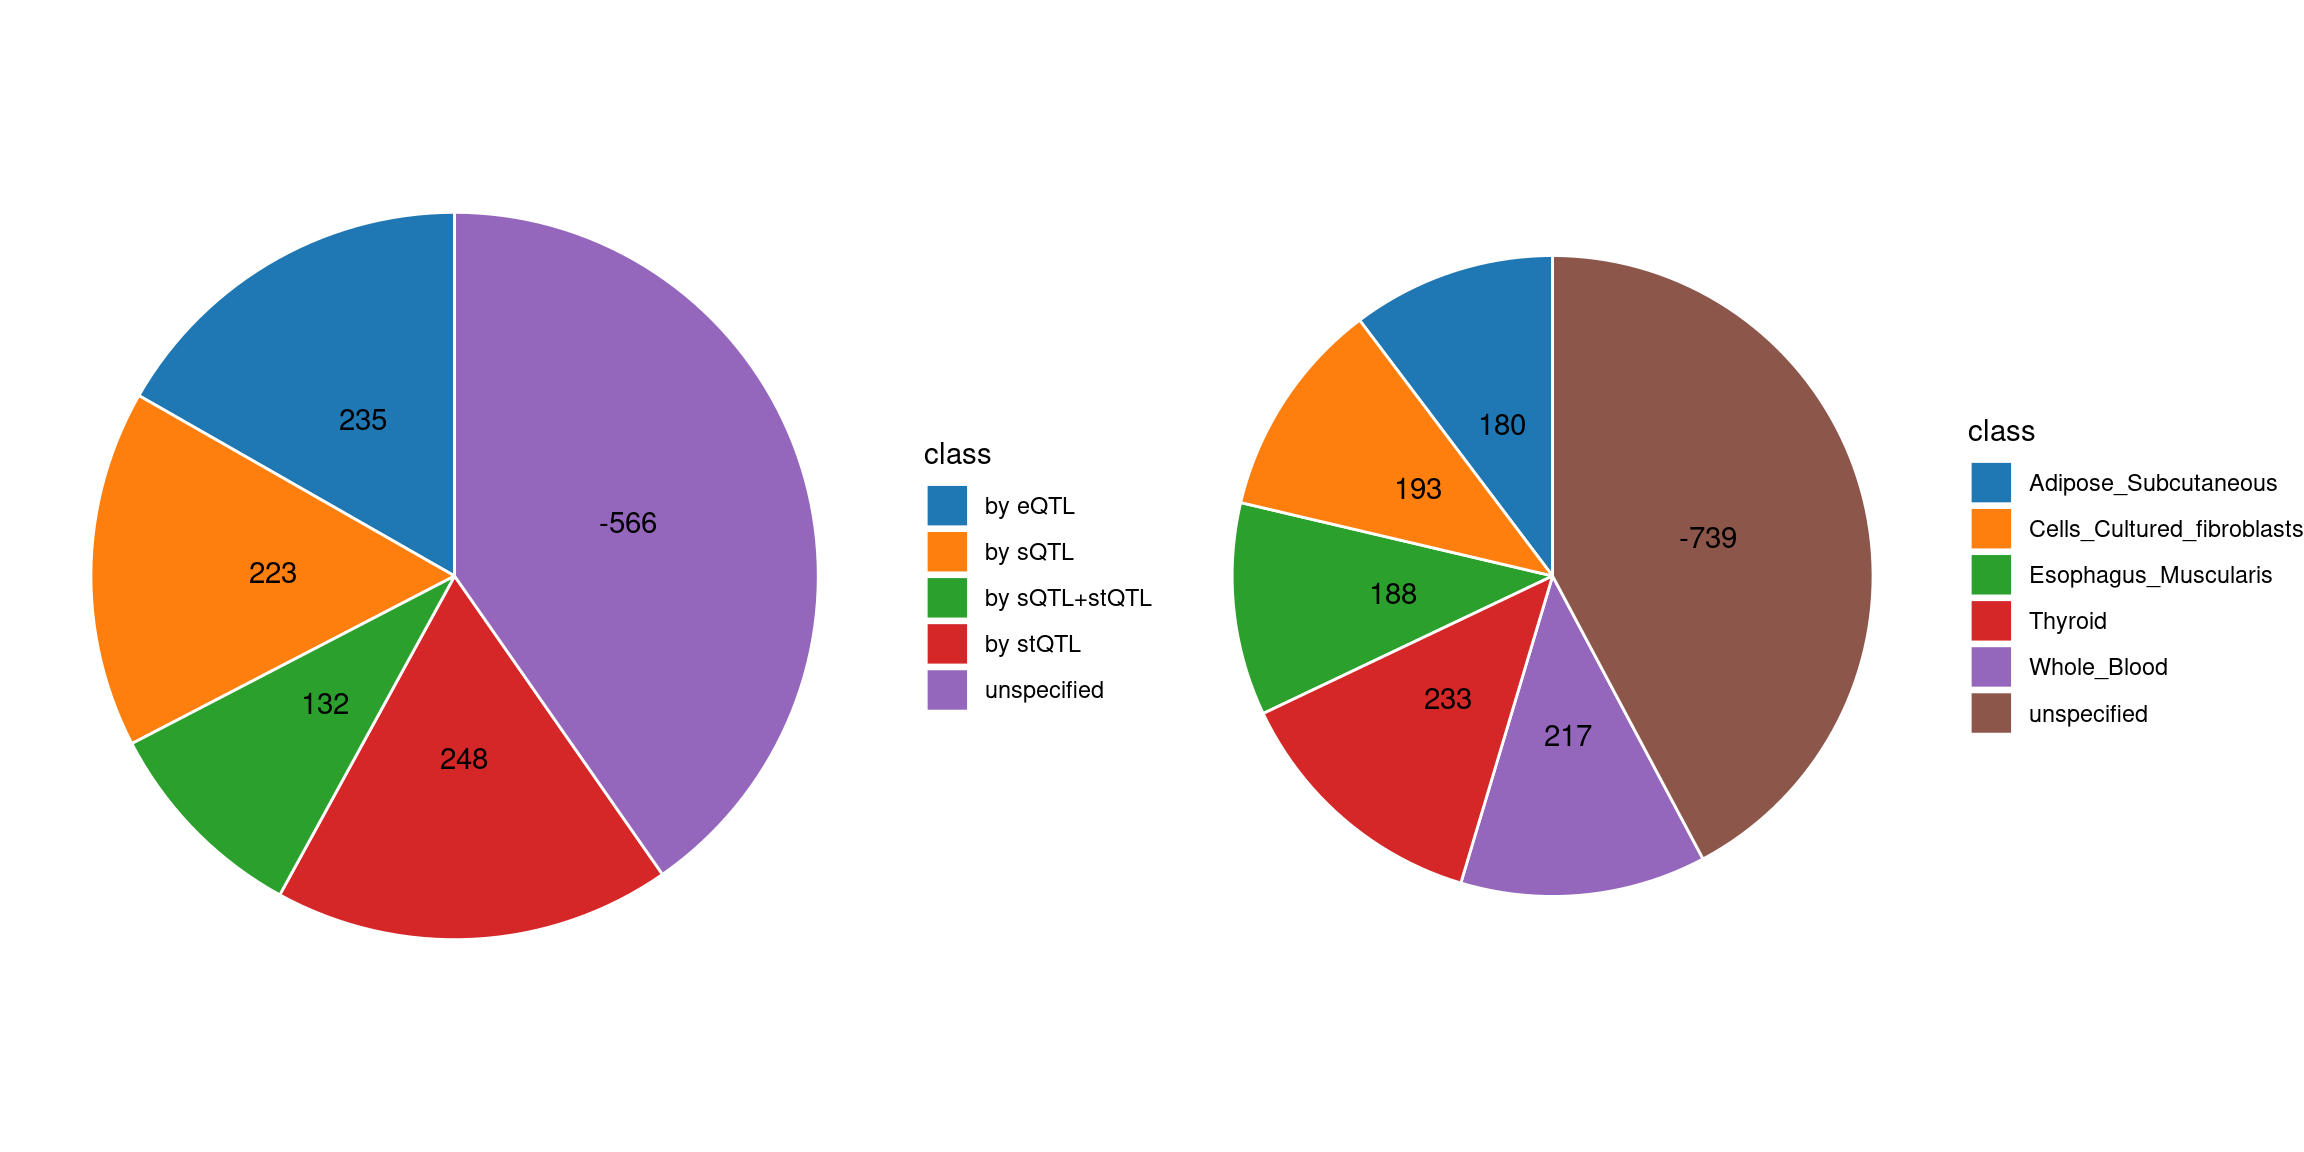
Comparing with single tissue + eQTL analysis
ctwas_res_single <- readRDS(paste0("/project/xinhe/xsun/multi_group_ctwas/10.single_tissue_1007/results/",trait,"/",tissue[1],"/",trait,"_",tissue[1], ".ctwas.res.RDS"))

susie_alpha_res_single <- ctwas_res_single$susie_alpha_res

susie_alpha_res_single <- anno_susie_alpha_res(susie_alpha_res_single,
                                        mapping_table = mapping_predictdb,
                                        map_by = "molecular_id",
                                        drop_unmapped = TRUE)
2024-10-15 14:59:24 INFO::Annotating susie alpha result ...
2024-10-15 14:59:24 INFO::Map molecular traits to genescombined_pip_by_type_single <- combine_gene_pips(susie_alpha_res_single,
group_by = "gene_name",
by = "type",
method = "combine_cs",
filter_cs = TRUE,
include_cs_id = F)
combined_pip_by_type_sig_single <- combined_pip_by_type_single[combined_pip_by_type_single$combined_pip > 0.8,]
combined_pip_by_type_sig_multi <- combined_pip_by_type_multi[combined_pip_by_type_multi$combined_pip > 0.8,]
sprintf("Number of genes with PIP > 0.8 -- Multi-group = %s", nrow(combined_pip_by_type_sig_multi))[1] "Number of genes with PIP > 0.8 -- Multi-group = 272"sprintf("Number of genes with PIP > 0.8 -- single eQTL = %s", nrow(combined_pip_by_type_sig_single))[1] "Number of genes with PIP > 0.8 -- single eQTL = 81"sprintf("Number of overlapped genes = %s", sum(combined_pip_by_type_sig_single$gene_name %in% combined_pip_by_type_sig_multi$gene_name))[1] "Number of overlapped genes = 61"genes_not_reported <- combined_pip_by_type_sig_single$gene_name[!combined_pip_by_type_sig_single$gene_name %in%combined_pip_by_type_sig_multi$gene_name]
DT::datatable(combined_pip_by_type_sig_single[combined_pip_by_type_sig_single$gene_name %in% genes_not_reported,],caption = htmltools::tags$caption( style = 'caption-side: topleft; text-align = left; color:black;','Genes not reported by multi-group analysis'),options = list(pageLength = 5) )DT::datatable(combined_pip_by_type_multi[combined_pip_by_type_multi$gene_name %in% genes_not_reported,],caption = htmltools::tags$caption( style = 'caption-side: topleft; text-align = left; color:black;','Genes not reported by multi-group analysis'),options = list(pageLength = 5) )gene_multi_unique_type <- combined_pip_by_type_sig_multi[!combined_pip_by_type_sig_multi$gene_name %in% combined_pip_by_type_sig_single$gene_name,]
p1 <- plot_heatmap(heatmap_data = gene_multi_unique_type, main = "Unique genes found by multi-group analysis")
combined_pip_by_context_sig_multi <- combined_pip_by_context_multi[combined_pip_by_context_multi$combined_pip > 0.8,]
gene_multi_unique_context <- combined_pip_by_context_sig_multi[!combined_pip_by_context_sig_multi$gene_name %in% combined_pip_by_type_sig_single$gene_name,]
p2 <- plot_heatmap(heatmap_data = gene_multi_unique_context, main = "Unique genes found by multi-group analysis")
g1 <- p1$gtable
g2 <- p2$gtable
gridExtra::grid.arrange(g1, g2, ncol=2)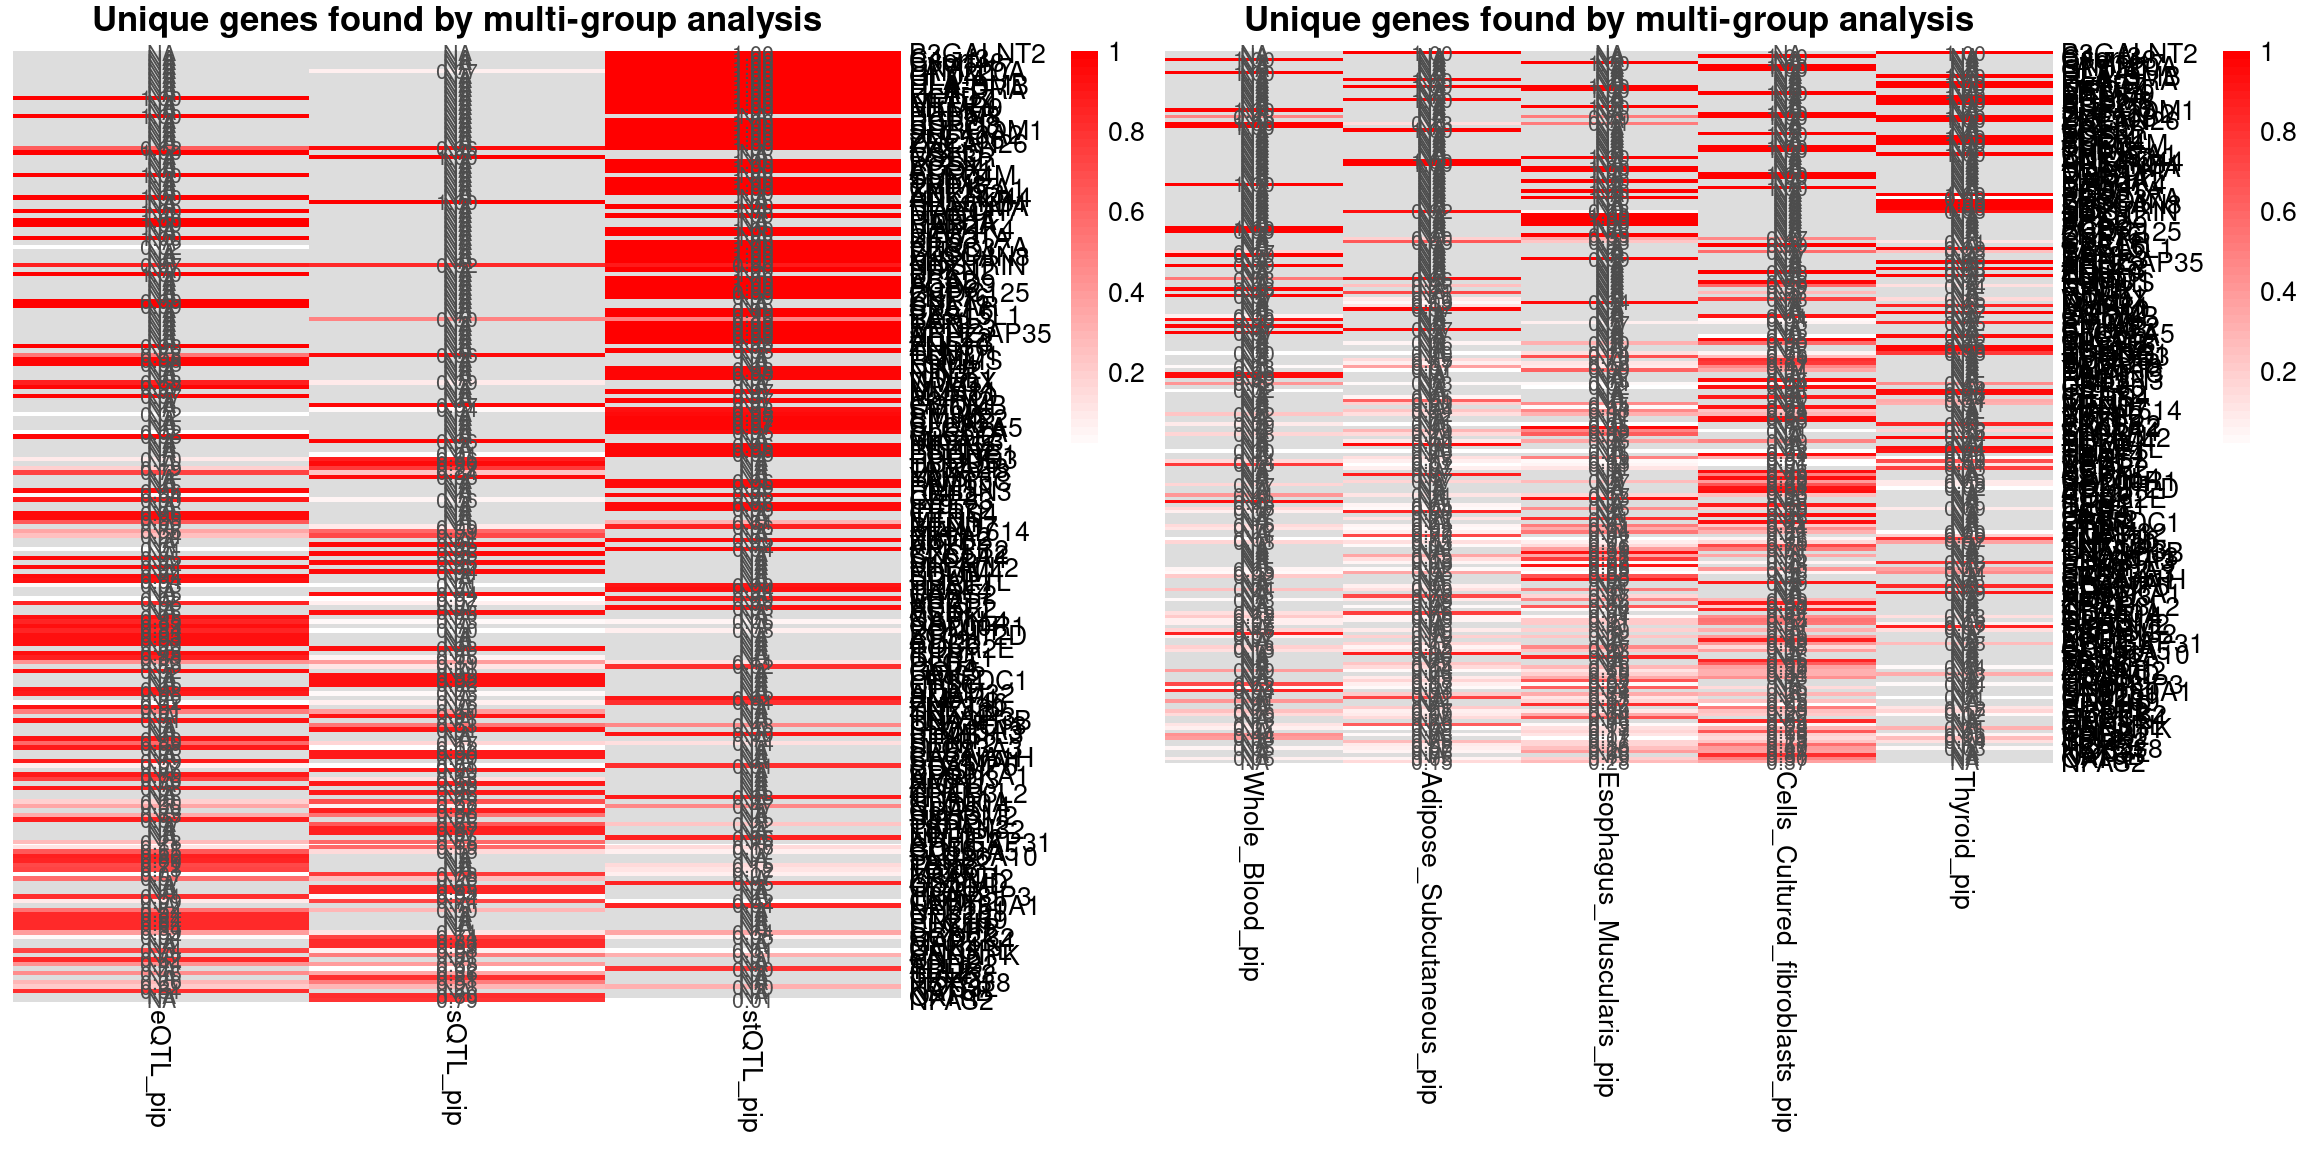
sessionInfo()R version 4.2.0 (2022-04-22)
Platform: x86_64-pc-linux-gnu (64-bit)
Running under: CentOS Linux 7 (Core)
Matrix products: default
BLAS/LAPACK: /software/openblas-0.3.13-el7-x86_64/lib/libopenblas_haswellp-r0.3.13.so
locale:
[1] C
attached base packages:
[1] stats graphics grDevices utils datasets methods base
other attached packages:
[1] pheatmap_1.0.12 forcats_0.5.1 stringr_1.5.1 dplyr_1.1.4
[5] purrr_1.0.2 readr_2.1.2 tidyr_1.3.0 tibble_3.2.1
[9] tidyverse_1.3.1 ggplot2_3.5.1 ctwas_0.4.15
loaded via a namespace (and not attached):
[1] colorspace_2.0-3 rjson_0.2.21
[3] ellipsis_0.3.2 rprojroot_2.0.3
[5] XVector_0.36.0 locuszoomr_0.2.1
[7] GenomicRanges_1.48.0 fs_1.5.2
[9] rstudioapi_0.13 farver_2.1.0
[11] DT_0.22 ggrepel_0.9.1
[13] bit64_4.0.5 lubridate_1.8.0
[15] AnnotationDbi_1.58.0 fansi_1.0.3
[17] xml2_1.3.3 codetools_0.2-18
[19] logging_0.10-108 cachem_1.0.6
[21] knitr_1.39 jsonlite_1.8.0
[23] workflowr_1.7.0 Rsamtools_2.12.0
[25] broom_0.8.0 dbplyr_2.1.1
[27] png_0.1-7 compiler_4.2.0
[29] httr_1.4.3 backports_1.4.1
[31] assertthat_0.2.1 Matrix_1.5-3
[33] fastmap_1.1.0 lazyeval_0.2.2
[35] cli_3.6.1 later_1.3.0
[37] htmltools_0.5.2 prettyunits_1.1.1
[39] tools_4.2.0 gtable_0.3.0
[41] glue_1.6.2 GenomeInfoDbData_1.2.8
[43] rappdirs_0.3.3 Rcpp_1.0.12
[45] Biobase_2.56.0 cellranger_1.1.0
[47] jquerylib_0.1.4 vctrs_0.6.5
[49] Biostrings_2.64.0 rtracklayer_1.56.0
[51] crosstalk_1.2.0 xfun_0.41
[53] rvest_1.0.2 lifecycle_1.0.4
[55] irlba_2.3.5 restfulr_0.0.14
[57] ensembldb_2.20.2 XML_3.99-0.14
[59] zlibbioc_1.42.0 zoo_1.8-10
[61] scales_1.3.0 gggrid_0.2-0
[63] hms_1.1.1 promises_1.2.0.1
[65] MatrixGenerics_1.8.0 ProtGenerics_1.28.0
[67] parallel_4.2.0 SummarizedExperiment_1.26.1
[69] RColorBrewer_1.1-3 AnnotationFilter_1.20.0
[71] LDlinkR_1.2.3 yaml_2.3.5
[73] curl_4.3.2 gridExtra_2.3
[75] memoise_2.0.1 sass_0.4.1
[77] biomaRt_2.54.1 stringi_1.7.6
[79] RSQLite_2.3.1 highr_0.9
[81] S4Vectors_0.34.0 BiocIO_1.6.0
[83] GenomicFeatures_1.48.3 BiocGenerics_0.42.0
[85] filelock_1.0.2 BiocParallel_1.30.3
[87] GenomeInfoDb_1.39.9 rlang_1.1.2
[89] pkgconfig_2.0.3 matrixStats_0.62.0
[91] bitops_1.0-7 evaluate_0.15
[93] lattice_0.20-45 labeling_0.4.2
[95] GenomicAlignments_1.32.0 htmlwidgets_1.5.4
[97] cowplot_1.1.1 bit_4.0.4
[99] tidyselect_1.2.0 magrittr_2.0.3
[101] R6_2.5.1 IRanges_2.30.0
[103] generics_0.1.2 DelayedArray_0.22.0
[105] DBI_1.2.2 haven_2.5.0
[107] pgenlibr_0.3.3 pillar_1.9.0
[109] withr_2.5.0 KEGGREST_1.36.3
[111] RCurl_1.98-1.7 mixsqp_0.3-43
[113] modelr_0.1.8 crayon_1.5.1
[115] utf8_1.2.2 BiocFileCache_2.4.0
[117] plotly_4.10.0 tzdb_0.4.0
[119] rmarkdown_2.25 progress_1.2.2
[121] readxl_1.4.0 grid_4.2.0
[123] data.table_1.14.2 blob_1.2.3
[125] git2r_0.30.1 reprex_2.0.1
[127] digest_0.6.29 httpuv_1.6.5
[129] stats4_4.2.0 munsell_0.5.0
[131] viridisLite_0.4.0 bslib_0.3.1