PVE share pattern
XSun
2025-08-06
Last updated: 2025-08-20
Checks: 6 1
Knit directory: multigroup_ctwas_analysis/
This reproducible R Markdown analysis was created with workflowr (version 1.7.0). The Checks tab describes the reproducibility checks that were applied when the results were created. The Past versions tab lists the development history.
The R Markdown file has unstaged changes. To know which version of
the R Markdown file created these results, you’ll want to first commit
it to the Git repo. If you’re still working on the analysis, you can
ignore this warning. When you’re finished, you can run
wflow_publish to commit the R Markdown file and build the
HTML.
Great job! The global environment was empty. Objects defined in the global environment can affect the analysis in your R Markdown file in unknown ways. For reproduciblity it’s best to always run the code in an empty environment.
The command set.seed(20231112) was run prior to running
the code in the R Markdown file. Setting a seed ensures that any results
that rely on randomness, e.g. subsampling or permutations, are
reproducible.
Great job! Recording the operating system, R version, and package versions is critical for reproducibility.
Nice! There were no cached chunks for this analysis, so you can be confident that you successfully produced the results during this run.
Great job! Using relative paths to the files within your workflowr project makes it easier to run your code on other machines.
Great! You are using Git for version control. Tracking code development and connecting the code version to the results is critical for reproducibility.
The results in this page were generated with repository version c9ed9e1. See the Past versions tab to see a history of the changes made to the R Markdown and HTML files.
Note that you need to be careful to ensure that all relevant files for
the analysis have been committed to Git prior to generating the results
(you can use wflow_publish or
wflow_git_commit). workflowr only checks the R Markdown
file, but you know if there are other scripts or data files that it
depends on. Below is the status of the Git repository when the results
were generated:
Ignored files:
    Ignored:    .Rhistory
    Ignored:    cv/
    Ignored:    figures/lz/IBD-ebi-a-GCST004131/single/
    Ignored:    figures/lz_ld/IBD-ebi-a-GCST004131/single/

Unstaged changes:
    Modified:   analysis/realdata_final_PVE_share_pattern.Rmd
Note that any generated files, e.g. HTML, png, CSS, etc., are not included in this status report because it is ok for generated content to have uncommitted changes.
These are the previous versions of the repository in which changes were
made to the R Markdown
(analysis/realdata_final_PVE_share_pattern.Rmd) and HTML
(docs/realdata_final_PVE_share_pattern.html) files. If
you’ve configured a remote Git repository (see
?wflow_git_remote), click on the hyperlinks in the table
below to view the files as they were in that past version.
| File | Version | Author | Date | Message |
|---|---|---|---|---|
| Rmd | d350ce9 | XSun | 2025-08-20 | update |
| html | d350ce9 | XSun | 2025-08-20 | update |
| Rmd | 88dcf6c | XSun | 2025-08-15 | update |
| html | 88dcf6c | XSun | 2025-08-15 | update |
Introduction
We ranked tissues by the number of genes identified in single-tissue eQTL analyses and selected the top 10.
From the 10 selected tissues, we obtained 45 unique tissue pairs. For each pair, we
For each tissue pair \((A, B)\), we first estimated the PHE of tissue \(A\) when analyzed alone (in single-tissue eQTL/sQTL analysis), and then conducted both two-tissue eQTL and two-tissue sQTL analyses to estimate the PHE of each tissue in the joint analysis. We then calculated the relative change as:
\[ \frac{\text{PHE}_{\text{joint}} - \text{PHE}_{\text{single}}}{\text{PHE}_{\text{single}}} \]
Results
library(ctwas)
library(ComplexHeatmap)
library(grid)
library(circlize)

trait_nopsy <- c("LDL-ukb-d-30780_irnt","IBD-ebi-a-GCST004131","aFib-ebi-a-GCST006414","SBP-ukb-a-360",
                 "T1D-GCST90014023","T2D-panukb","ATH_gtexukb","BMI-panukb","HB-panukb",
                 "Height-panukb","HTN-panukb","PLT-panukb","RA-panukb","RBC-panukb",
                 "WBC-ieu-b-30"
                 )
trait_psy <- c("SCZ-ieu-b-5102","BIP-ieu-b-5110","MDD-ieu-b-102","PD-ieu-b-7",
               "NS-ukb-a-230","ASD-ieu-a-1185","ADHD-ieu-a-1183")
traits <- c(trait_nopsy,trait_psy)
#

#traits <- c("LDL-ukb-d-30780_irnt","IBD-ebi-a-GCST004131","SCZ-ieu-b-5102")


source("/project/xinhe/xsun/multi_group_ctwas/data/samplesize.R")

get_top_tissues <- function(trait, n_top = 10, folder_results) {


  # Find files matching pattern
  finalfiles <- list.files(folder_results, pattern = "_csinclude")

  # Collect tissue summaries
  trait_sum <- do.call(rbind, lapply(finalfiles, function(file) {
    gene_pip <- readRDS(file.path(folder_results, file))

    tissue <- gsub(pattern = paste0(trait, "_"), replacement = "", x = file)
    tissue <- gsub(pattern = ".combined_pip_bygroup_final_csinclude.RDS", replacement = "", x = tissue)

    data.frame(tissue = tissue,
               num_gene_pip08 = sum(gene_pip$combined_pip > 0.8),
               stringsAsFactors = FALSE)
  }))

  # Filter, order, and select top tissues

  # trait_sum <- trait_sum[trait_sum$num_gene_pip08 > 0, ]
  trait_sum <- trait_sum[order(trait_sum$num_gene_pip08, decreasing = TRUE), ]

  # Return top tissues
  head(trait_sum$tissue, n_top)
}
#trait <- "LDL-ukb-d-30780_irnt"
for (trait in traits){
print(trait)
gwas_n <- samplesize[trait]
folder_results <- paste0("/project/xinhe/xsun/multi_group_ctwas/22.singlegroup_0515/ctwas_output/expression/",trait,"/")
top_tissues <- get_top_tissues(
trait = trait,
n_top = 10,
folder_results = folder_results
)
## single tissue eQTL
prob_pve_alltissue <- c()
for (tissue in top_tissues){
file_param_single <- paste0(folder_results,"/",trait,"_",tissue,".thin1.shared_all.param.RDS")
param_single <- readRDS(file_param_single)
ctwas_parameters_single <- summarize_param(param_single, gwas_n, enrichment_test = "fisher")
prob_pve <- ctwas_parameters_single$prop_heritability[1]
prob_pve_alltissue <- c(prob_pve_alltissue, prob_pve)
}
names(prob_pve_alltissue) <- gsub(pattern = "\\|eQTL",x = names(prob_pve_alltissue), replacement = "")
## pairwise
tissue_combination <- combn(top_tissues, 2, simplify = FALSE)
mat <- matrix(NA, nrow = length(top_tissues), ncol = length(top_tissues),
dimnames = list(top_tissues, top_tissues))
for (i in 1:length(tissue_combination)){
tissue1 <- tissue_combination[[i]][1]
pve_tissue1 <- prob_pve_alltissue[tissue1]
tissue2 <- tissue_combination[[i]][2]
pve_tissue2 <- prob_pve_alltissue[tissue2]
tissue_pair <- paste0(tissue_combination[[i]], collapse = "-")
file_param_pair <- paste0("/project/xinhe/xsun/multi_group_ctwas/23.multi_group_0515/pairwise_snakemake_outputs/",trait,"/",trait,".",tissue_pair,".eqtlonly.thin1.shared_all.param.RDS")
param_pair <- readRDS(file_param_pair)
ctwas_parameters_pair <- summarize_param(param_pair, gwas_n, enrichment_test = "fisher")
pve_tissue1_joint <- ctwas_parameters_pair$prop_heritability[paste0(tissue1,"|eQTL")]
pve_tissue2_joint <- ctwas_parameters_pair$prop_heritability[paste0(tissue2,"|eQTL")]
pct_pve_shared_tissue1 <- (pve_tissue1 - pve_tissue1_joint)/pve_tissue1 * 100
pct_pve_shared_tissue2 <- (pve_tissue2 - pve_tissue2_joint)/pve_tissue2 * 100
mat[tissue1, tissue2] <- pct_pve_shared_tissue1
mat[tissue2, tissue1] <- pct_pve_shared_tissue2
}
if (any(mat < 0, na.rm = TRUE)) {
mat_range <- range(mat, na.rm = TRUE) # includes negatives
# create diverging color function
col_fun <- colorRamp2(
c(mat_range[1], 0, mat_range[2]), # min (neg), 0, max (pos)
c("blue", "white", "red") # colors
)
ht1 <- Heatmap(mat,
name = "%PVE decrease",
cluster_rows = FALSE,
cluster_columns = FALSE,
col = col_fun,
row_names_side = "left",
column_title = paste0("%PVE decreased after \n adding the second tissue(column) -- \n", trait," (eQTL)"),
rect_gp = gpar(col = "black", lwd = 0.5),
cell_fun = function(j, i, x, y, width, height, fill) {
if (!is.na(mat[i, j])) {
grid.text(sprintf("%.1f", mat[i, j]), x, y, gp = gpar(fontsize = 8))
}
})
}else{
ht1 <- Heatmap(mat,
name = "%PVE decrease",
cluster_rows = FALSE,
cluster_columns = FALSE,
col = colorRampPalette(c("white", "red"))(100),
row_names_side = "left", # can also be "right"
column_title = paste0("%PVE decreased after \n adding the second tissue(column) -- \n", trait," (eQTL)"),
rect_gp = gpar(col = "black", lwd = 0.5), # draw grid lines
cell_fun = function(j, i, x, y, width, height, fill) {
grid.text(sprintf("%.1f", mat[i, j]), x, y, gp = gpar(fontsize = 8))
})
}
## single tissue sQTL
folder_results <- paste0("/project/xinhe/xsun/multi_group_ctwas/22.singlegroup_0515/ctwas_output/splicing/",trait,"/")
prob_pve_alltissue <- c()
for (tissue in top_tissues){
file_param_single <- paste0(folder_results,"/",trait,"_",tissue,".thin1.shared_all.param.RDS")
param_single <- readRDS(file_param_single)
ctwas_parameters_single <- summarize_param(param_single, gwas_n, enrichment_test = "fisher")
prob_pve <- ctwas_parameters_single$prop_heritability[1]
prob_pve_alltissue <- c(prob_pve_alltissue, prob_pve)
}
names(prob_pve_alltissue) <- gsub(pattern = "\\|sQTL",x = names(prob_pve_alltissue), replacement = "")
for (i in 1:length(tissue_combination)){
tissue1 <- tissue_combination[[i]][1]
pve_tissue1 <- prob_pve_alltissue[tissue1]
tissue2 <- tissue_combination[[i]][2]
pve_tissue2 <- prob_pve_alltissue[tissue2]
tissue_pair <- paste0(tissue_combination[[i]], collapse = "-")
file_param_pair <- paste0("/project/xinhe/xsun/multi_group_ctwas/23.multi_group_0515/pairwise_snakemake_outputs/",trait,"/",trait,".",tissue_pair,".sqtlonly.thin1.shared_all.param.RDS")
param_pair <- readRDS(file_param_pair)
ctwas_parameters_pair <- summarize_param(param_pair, gwas_n, enrichment_test = "fisher")
pve_tissue1_joint <- ctwas_parameters_pair$prop_heritability[paste0(tissue1,"|sQTL")]
pve_tissue2_joint <- ctwas_parameters_pair$prop_heritability[paste0(tissue2,"|sQTL")]
pct_pve_shared_tissue1 <- (pve_tissue1 - pve_tissue1_joint)/pve_tissue1 * 100
pct_pve_shared_tissue2 <- (pve_tissue2 - pve_tissue2_joint)/pve_tissue2 * 100
mat[tissue1, tissue2] <- pct_pve_shared_tissue1
mat[tissue2, tissue1] <- pct_pve_shared_tissue2
}
if (any(mat < 0, na.rm = TRUE)) {
mat_range <- range(mat, na.rm = TRUE) # includes negatives
# create diverging color function
col_fun <- colorRamp2(
c(mat_range[1], 0, mat_range[2]), # min (neg), 0, max (pos)
c("blue", "white", "red") # colors
)
ht2 <- Heatmap(mat,
name = "%PVE decrease",
cluster_rows = FALSE,
cluster_columns = FALSE,
col = col_fun,
row_names_side = "left",
column_title = paste0("%PVE decreased after \n adding the second tissue(column) -- \n", trait," (sQTL)"),
rect_gp = gpar(col = "black", lwd = 0.5),
cell_fun = function(j, i, x, y, width, height, fill) {
if (!is.na(mat[i, j])) {
grid.text(sprintf("%.1f", mat[i, j]), x, y, gp = gpar(fontsize = 8))
}
})
}else{
ht2 <- Heatmap(mat,
name = "%PVE decrease",
cluster_rows = FALSE,
cluster_columns = FALSE,
col = colorRampPalette(c("white", "red"))(100),
row_names_side = "left", # can also be "right"
column_title = paste0("%PVE decreased after \n adding the second tissue(column) -- \n", trait," (sQTL)"),
rect_gp = gpar(col = "black", lwd = 0.5), # draw grid lines
cell_fun = function(j, i, x, y, width, height, fill) {
grid.text(sprintf("%.1f", mat[i, j]), x, y, gp = gpar(fontsize = 8))
})
}
draw(ht1 + ht2)
}[1] "LDL-ukb-d-30780_irnt"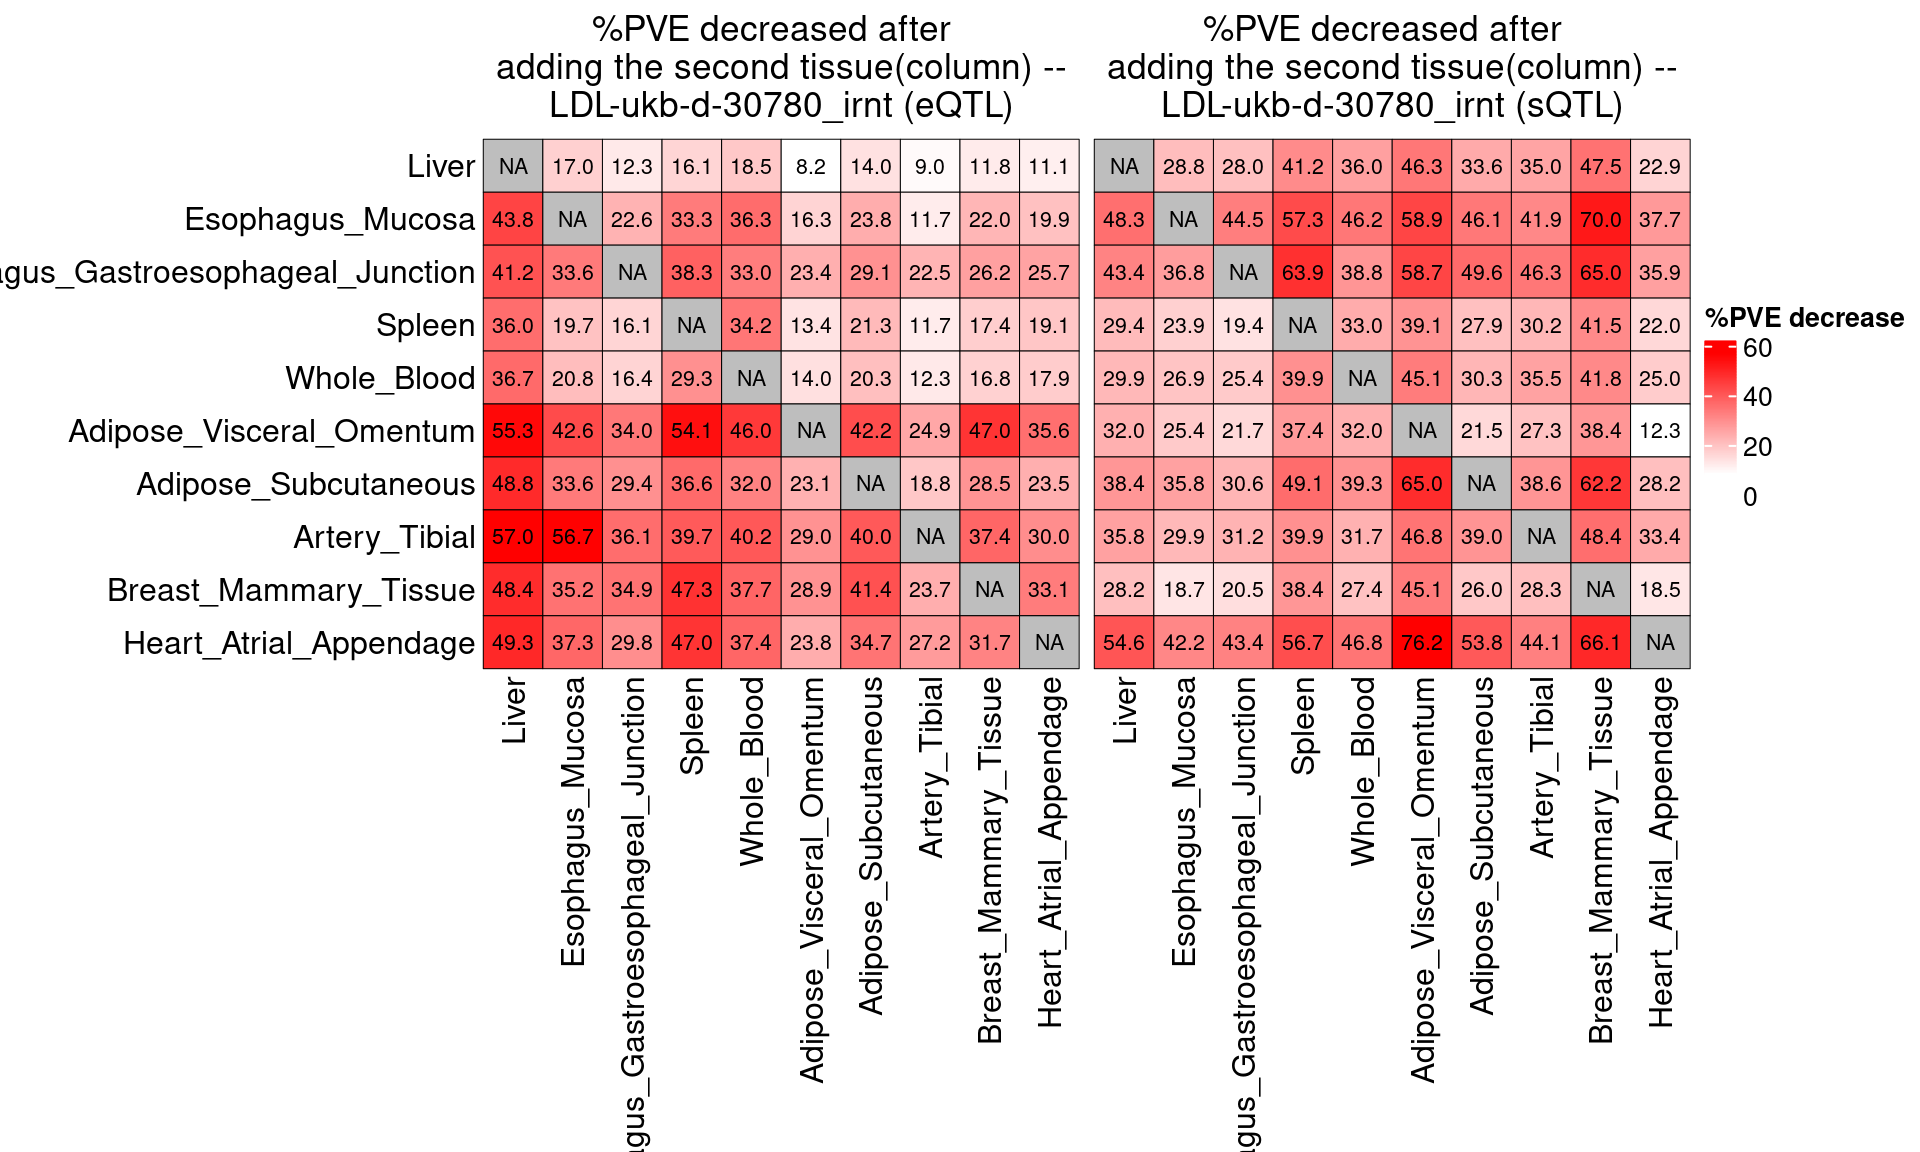
[1] "IBD-ebi-a-GCST004131"
| Version | Author | Date |
|---|---|---|
| d350ce9 | XSun | 2025-08-20 |
[1] "aFib-ebi-a-GCST006414"
| Version | Author | Date |
|---|---|---|
| d350ce9 | XSun | 2025-08-20 |
[1] "SBP-ukb-a-360"
| Version | Author | Date |
|---|---|---|
| d350ce9 | XSun | 2025-08-20 |
[1] "T1D-GCST90014023"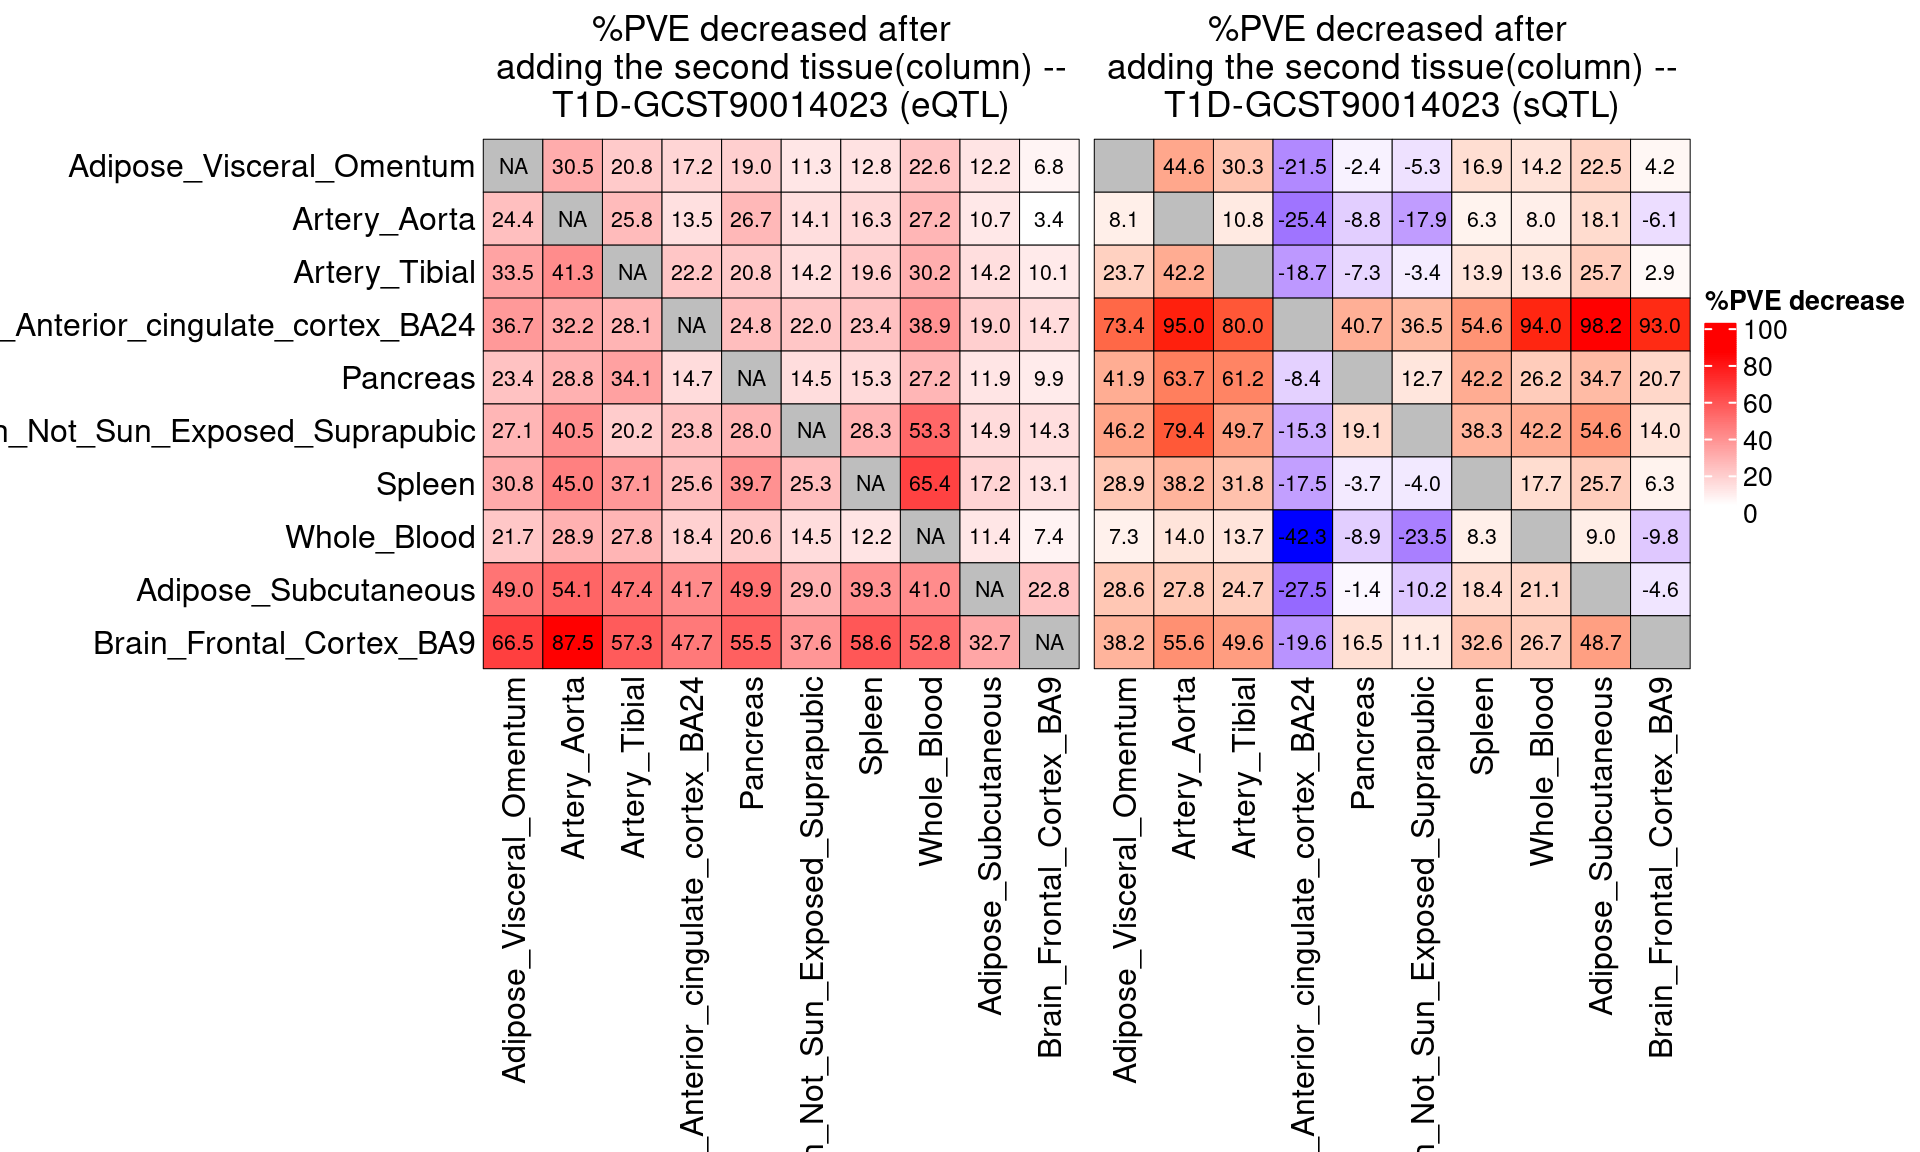
| Version | Author | Date |
|---|---|---|
| d350ce9 | XSun | 2025-08-20 |
[1] "T2D-panukb"
| Version | Author | Date |
|---|---|---|
| d350ce9 | XSun | 2025-08-20 |
[1] "ATH_gtexukb"
| Version | Author | Date |
|---|---|---|
| d350ce9 | XSun | 2025-08-20 |
[1] "BMI-panukb"
| Version | Author | Date |
|---|---|---|
| d350ce9 | XSun | 2025-08-20 |
[1] "HB-panukb"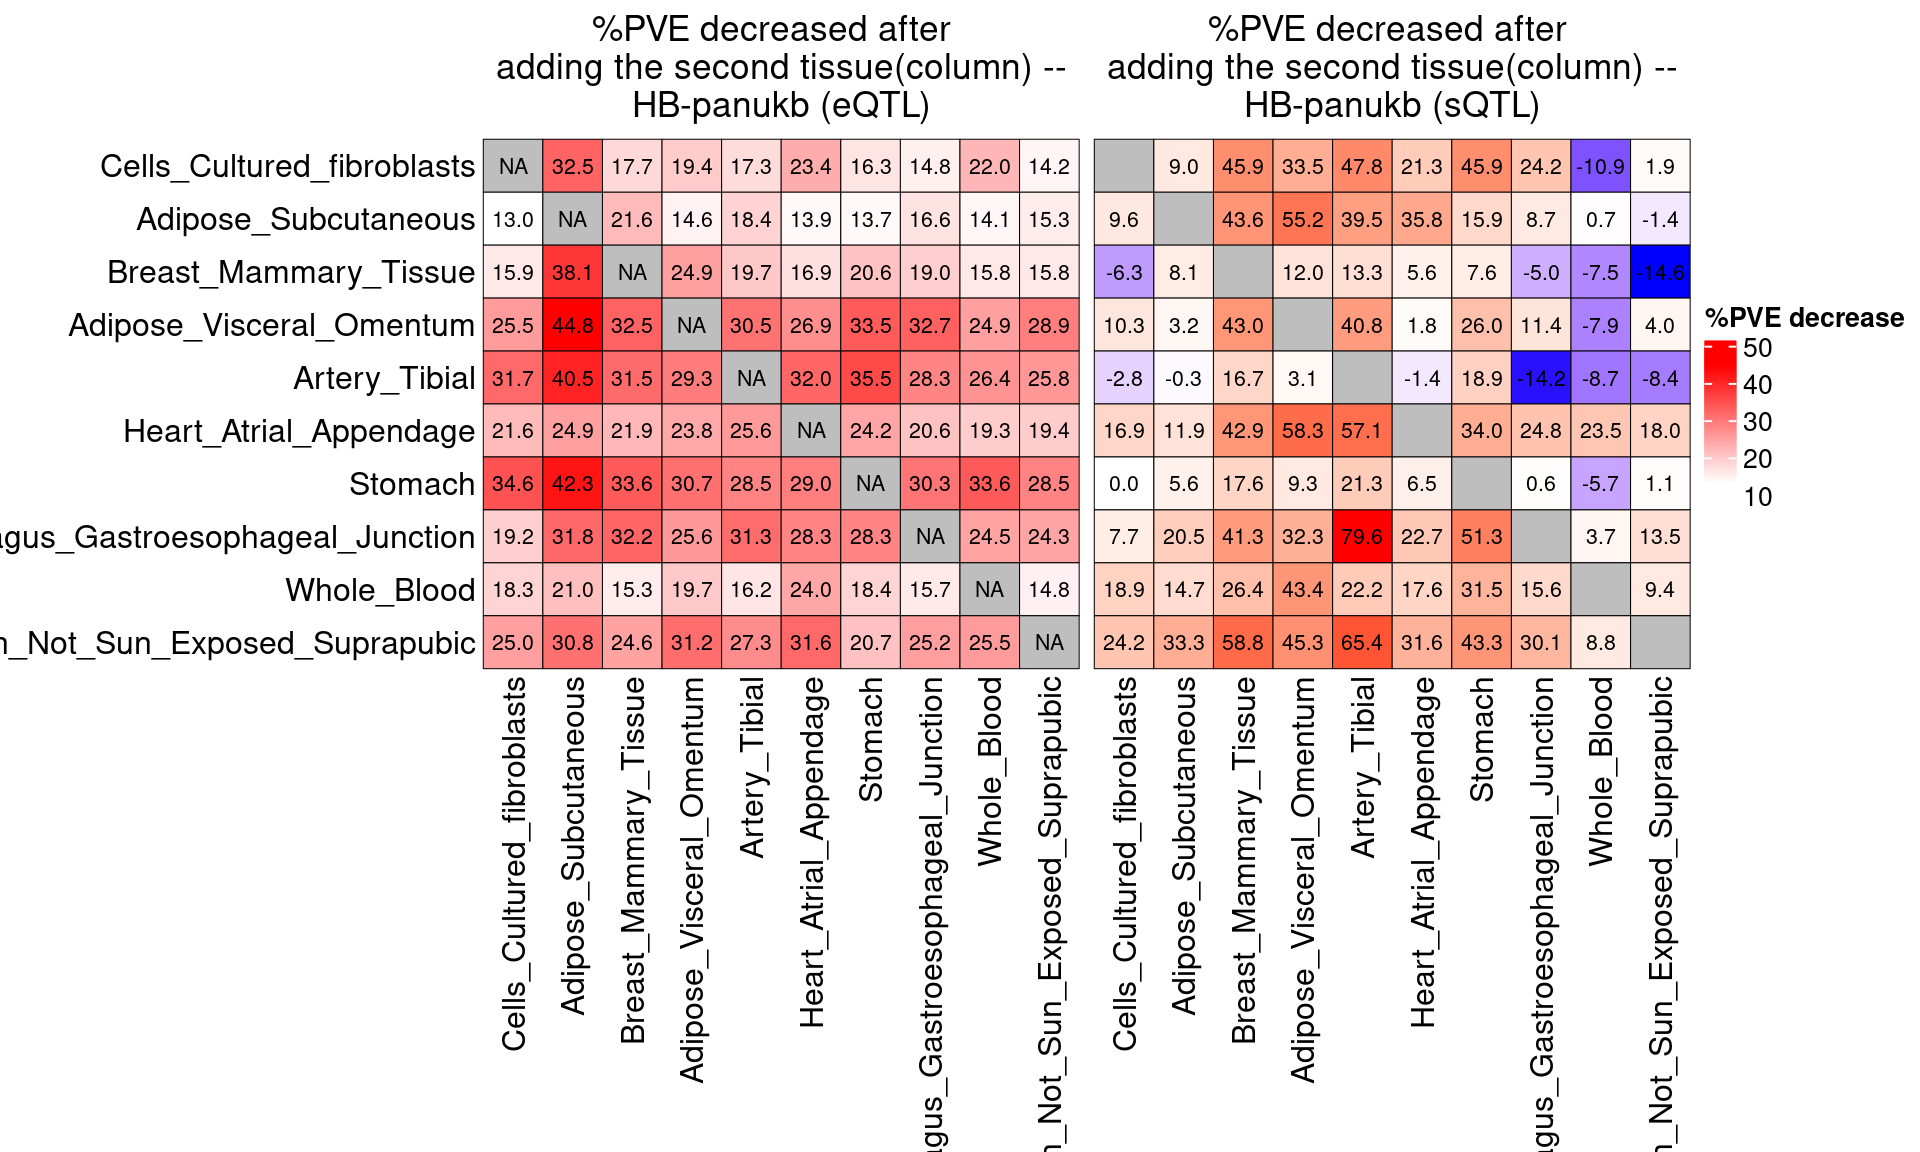
| Version | Author | Date |
|---|---|---|
| d350ce9 | XSun | 2025-08-20 |
[1] "Height-panukb"
| Version | Author | Date |
|---|---|---|
| d350ce9 | XSun | 2025-08-20 |
[1] "HTN-panukb"
| Version | Author | Date |
|---|---|---|
| d350ce9 | XSun | 2025-08-20 |
[1] "PLT-panukb"
| Version | Author | Date |
|---|---|---|
| d350ce9 | XSun | 2025-08-20 |
[1] "RA-panukb"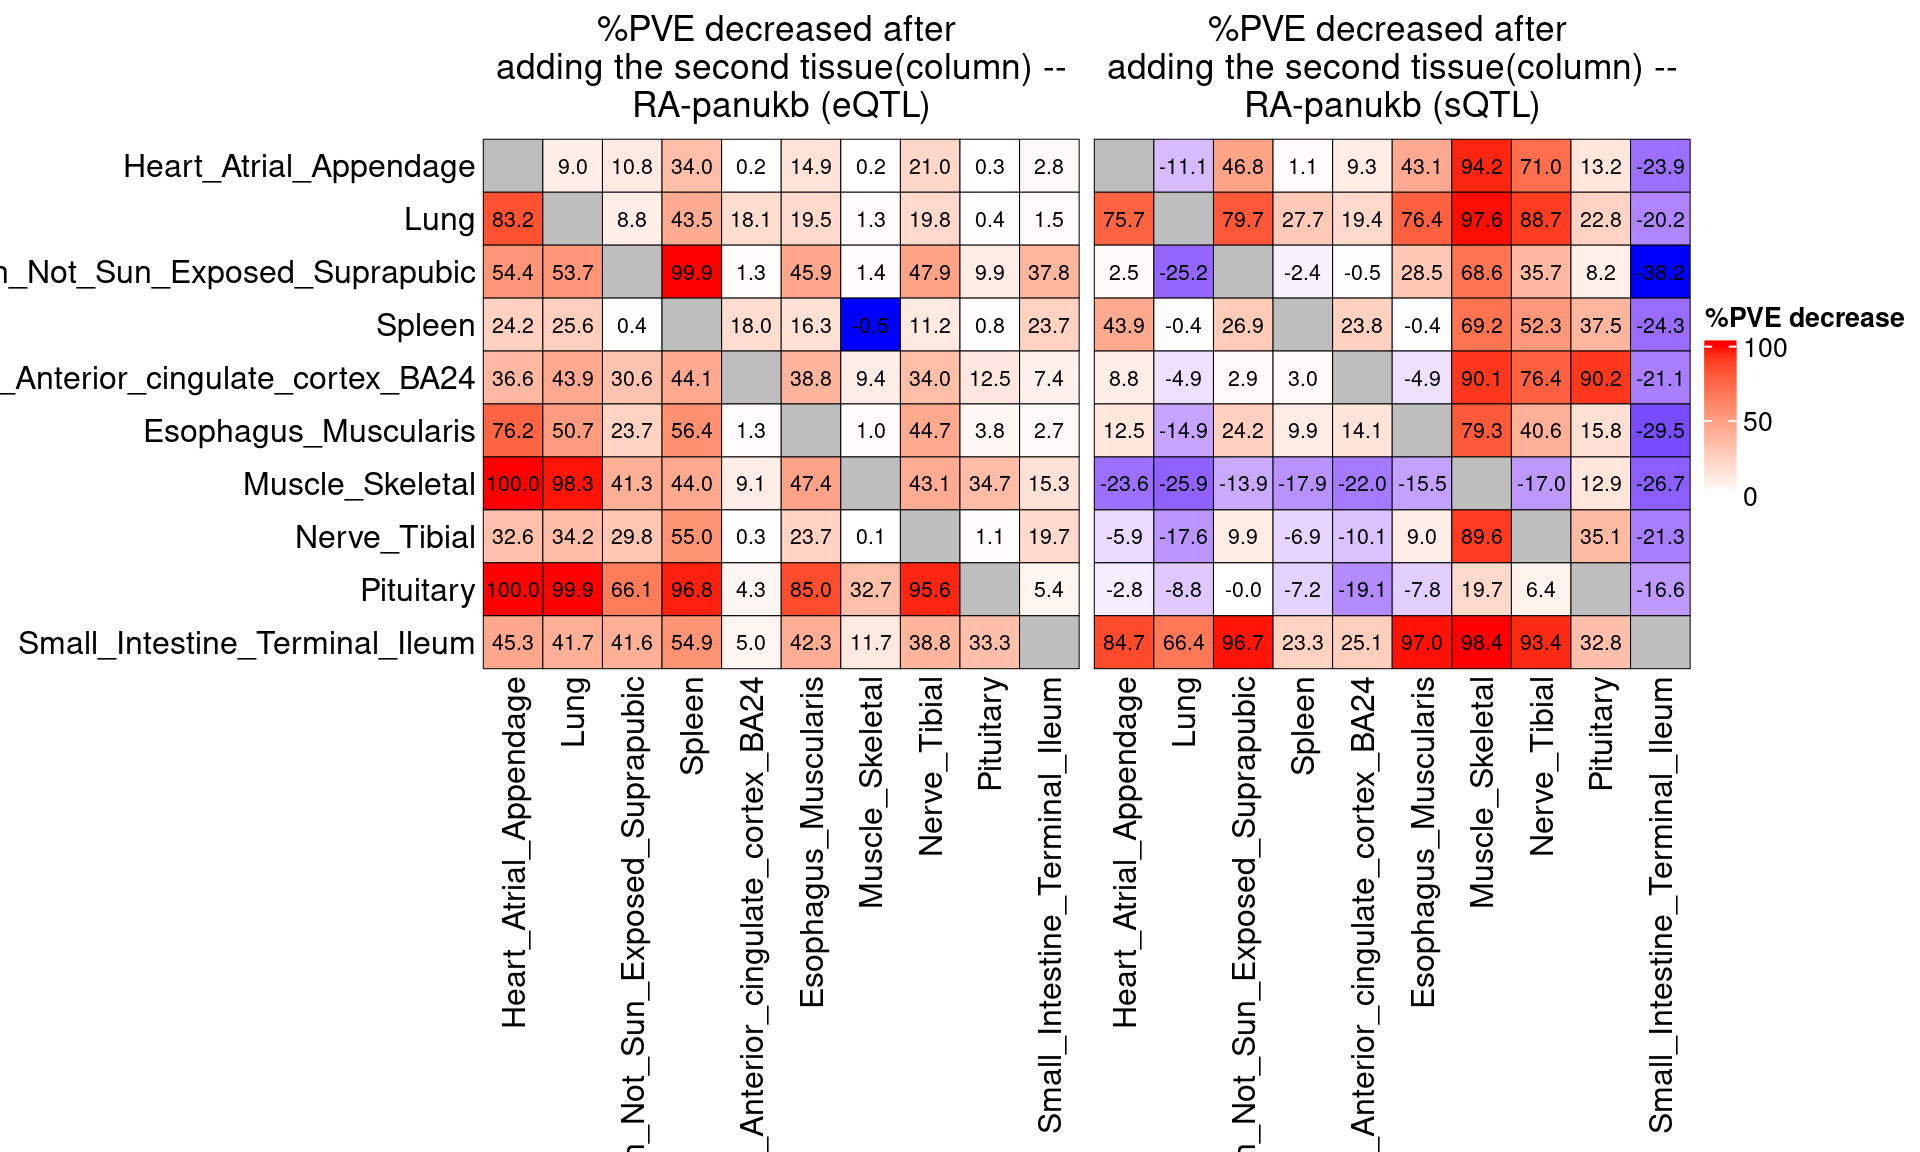
| Version | Author | Date |
|---|---|---|
| d350ce9 | XSun | 2025-08-20 |
[1] "RBC-panukb"
| Version | Author | Date |
|---|---|---|
| d350ce9 | XSun | 2025-08-20 |
[1] "WBC-ieu-b-30"
| Version | Author | Date |
|---|---|---|
| d350ce9 | XSun | 2025-08-20 |
[1] "SCZ-ieu-b-5102"
| Version | Author | Date |
|---|---|---|
| d350ce9 | XSun | 2025-08-20 |
[1] "BIP-ieu-b-5110"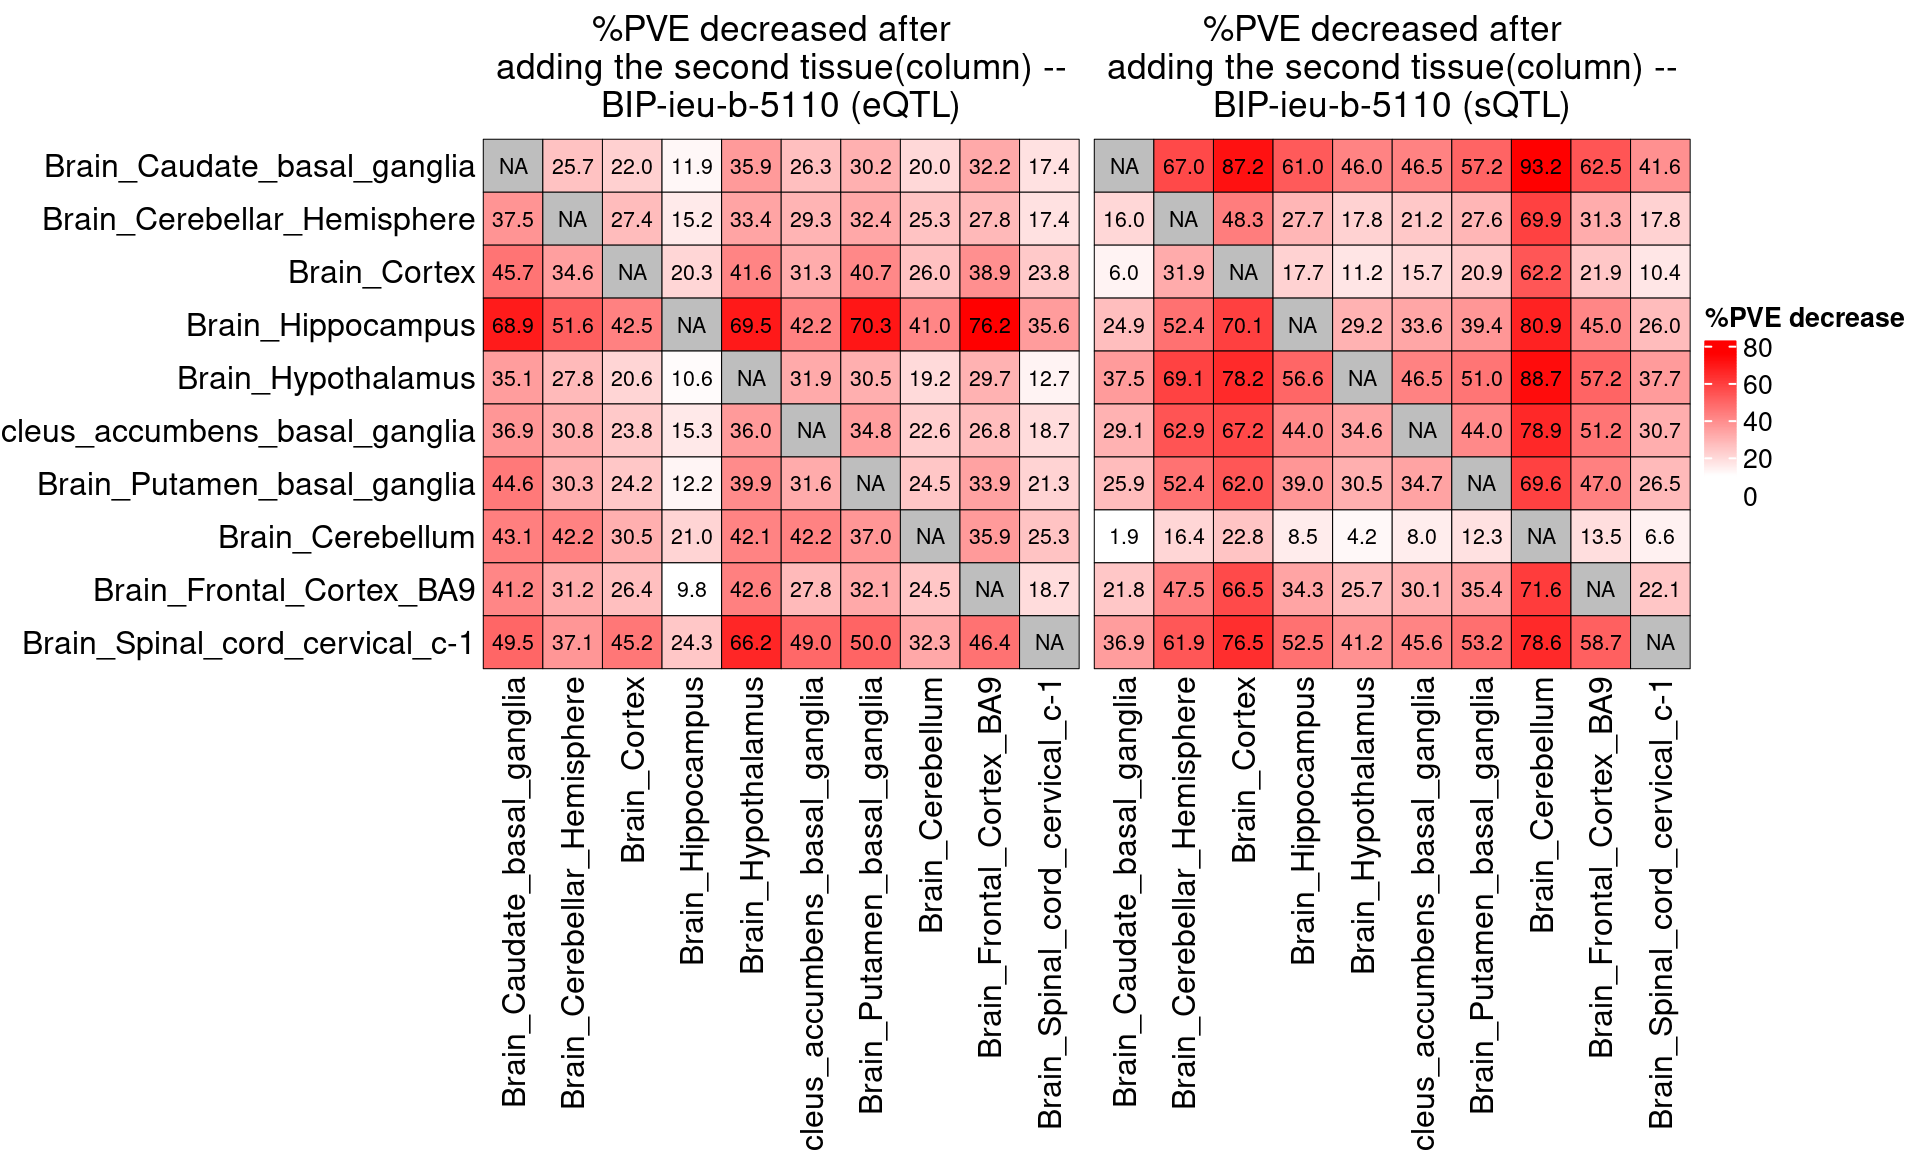
| Version | Author | Date |
|---|---|---|
| d350ce9 | XSun | 2025-08-20 |
[1] "MDD-ieu-b-102"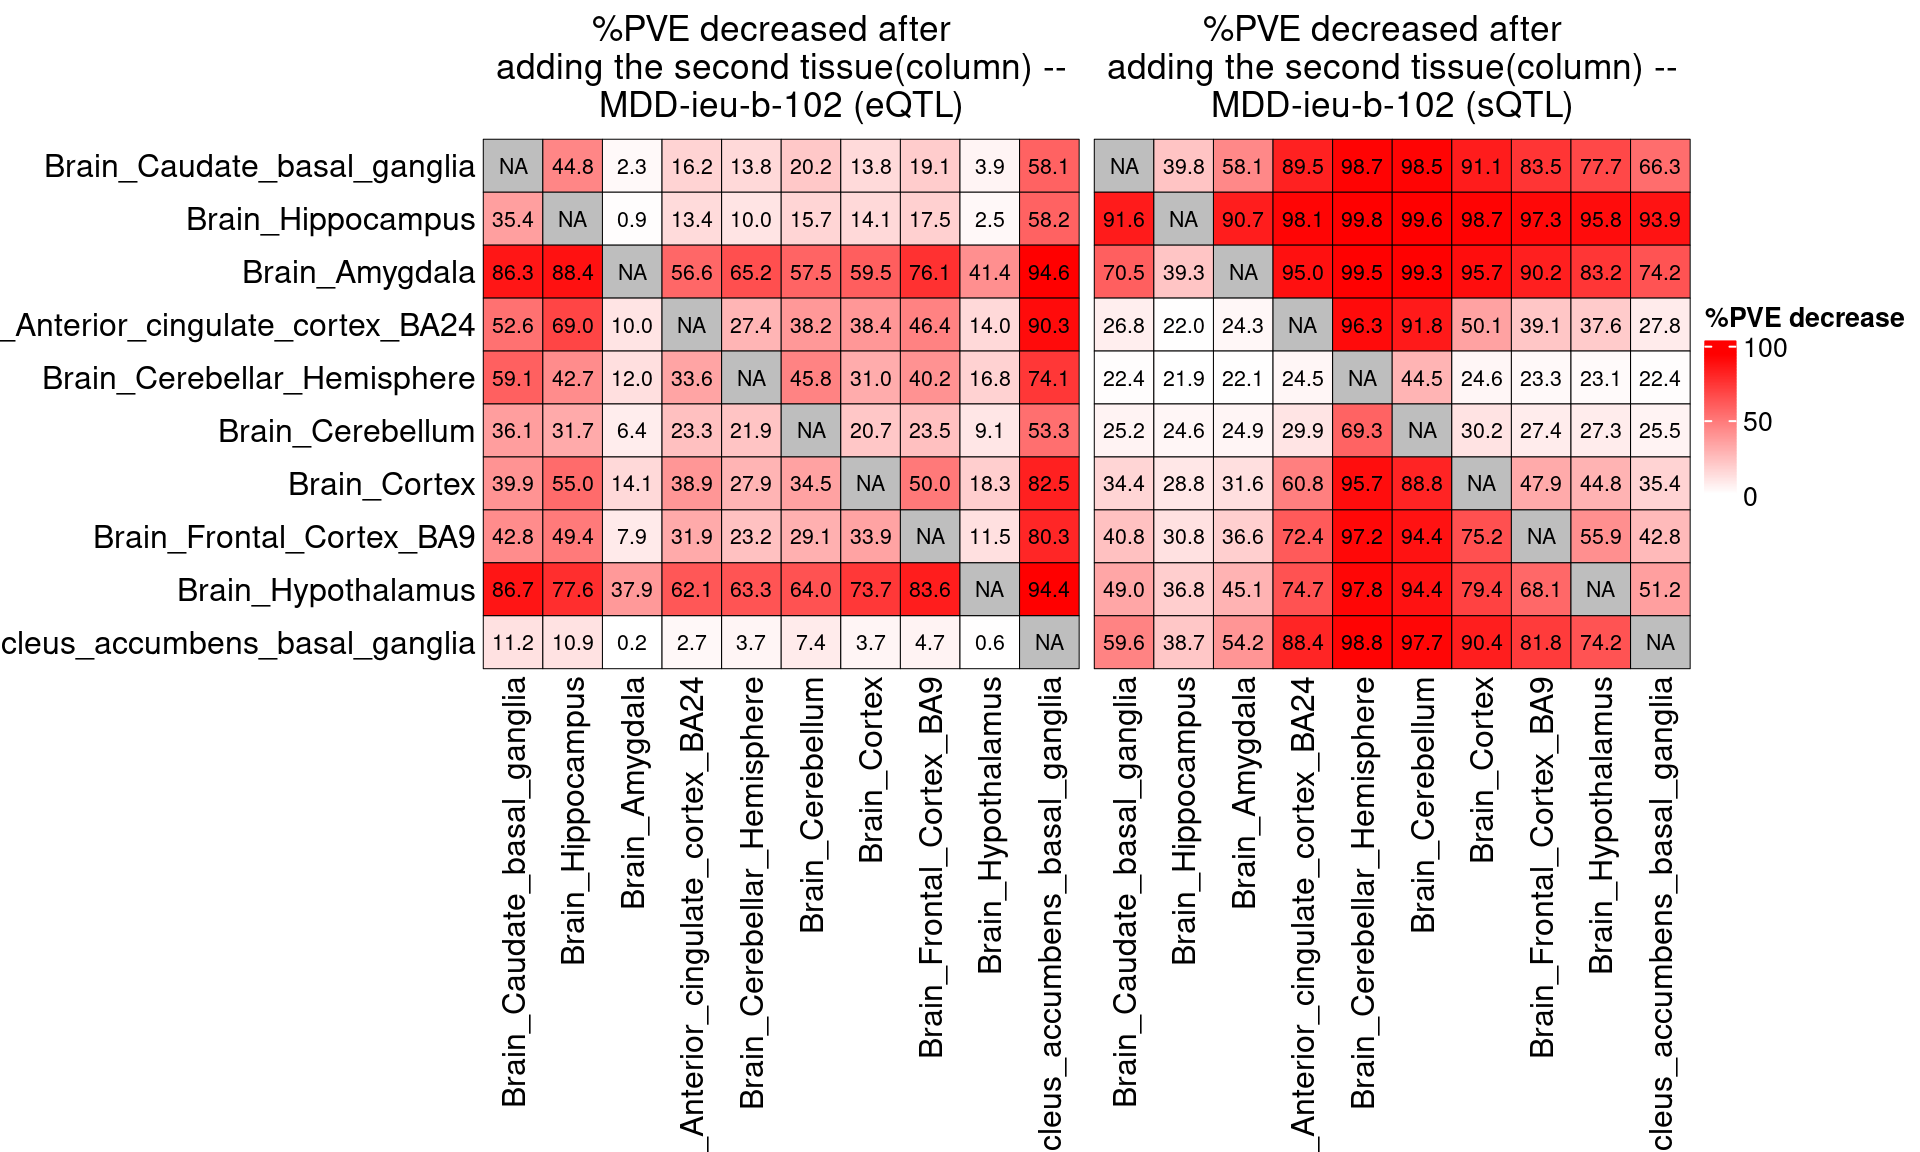
| Version | Author | Date |
|---|---|---|
| d350ce9 | XSun | 2025-08-20 |
[1] "PD-ieu-b-7"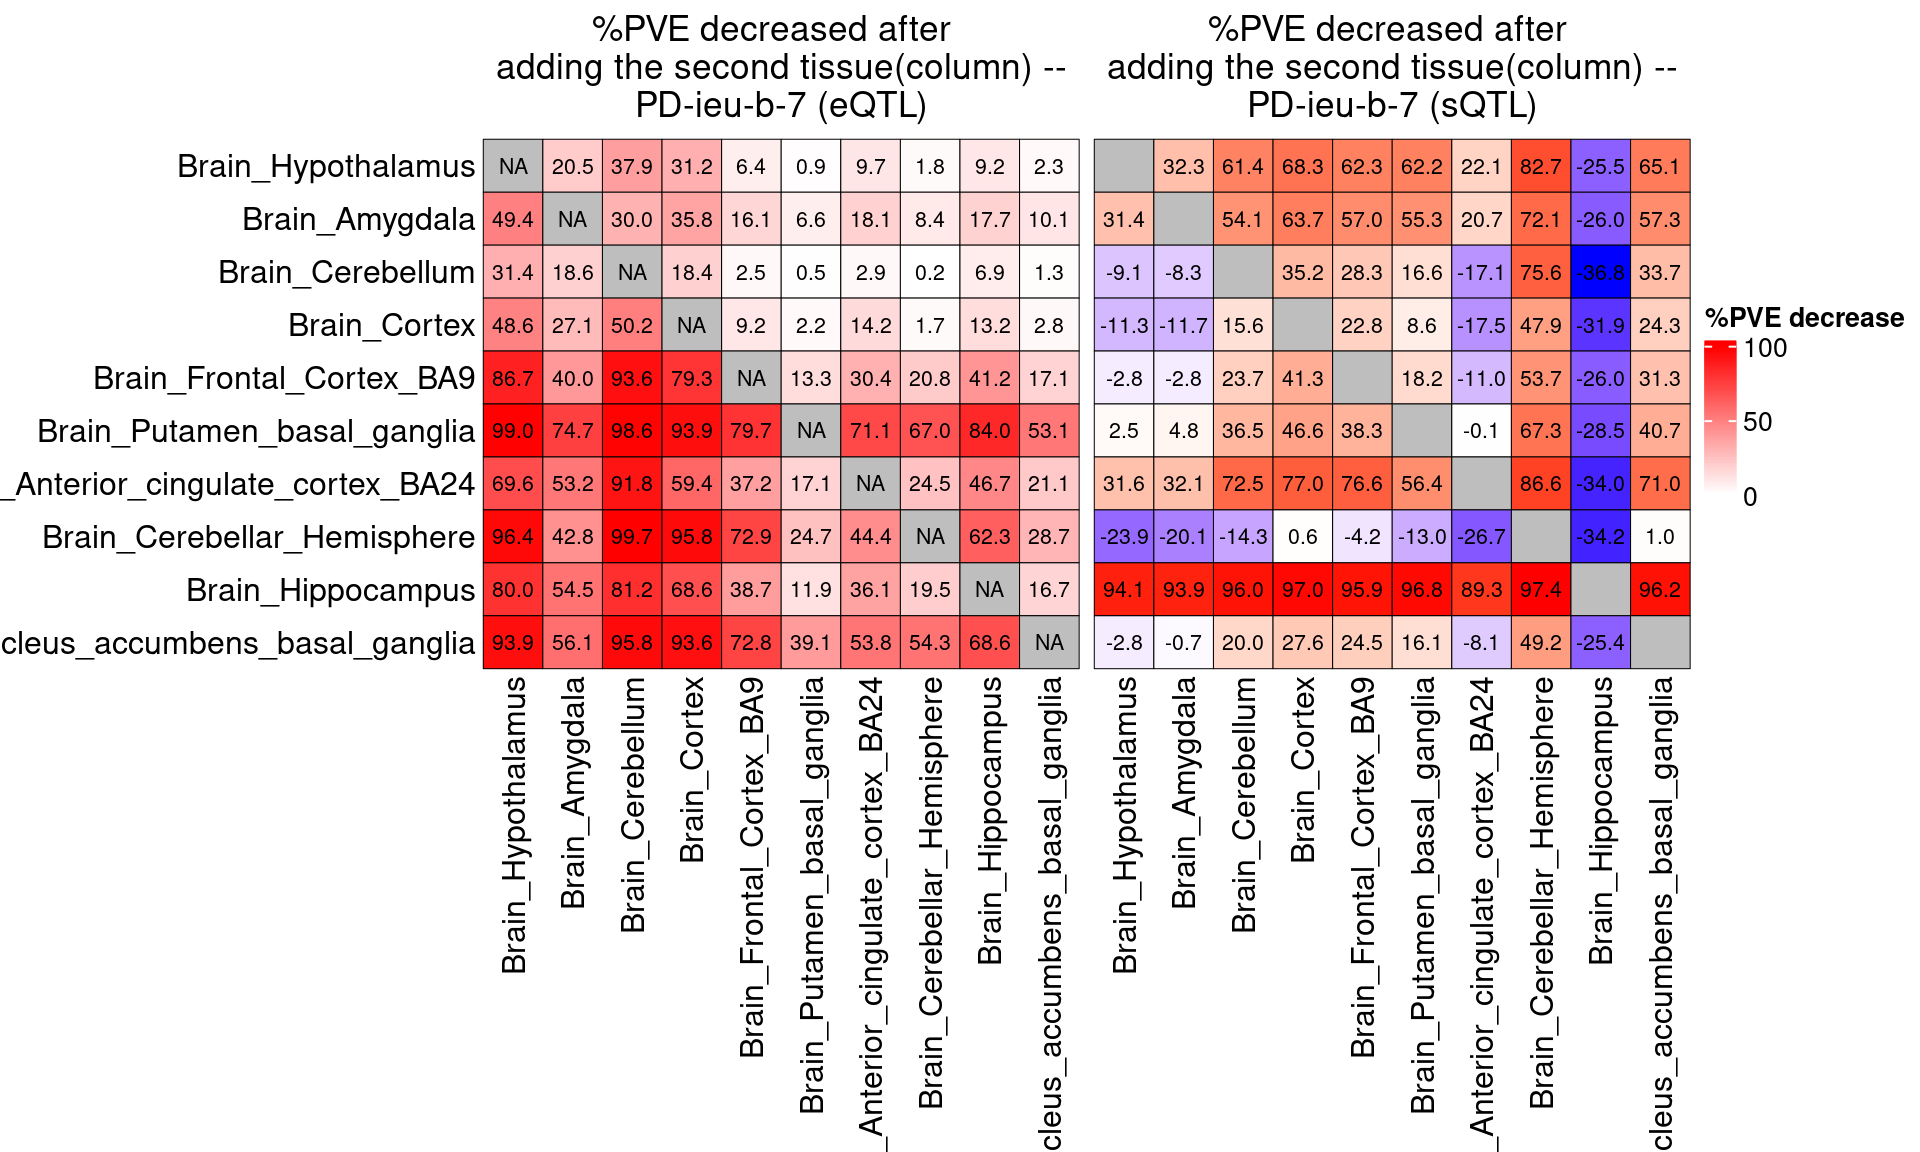
| Version | Author | Date |
|---|---|---|
| d350ce9 | XSun | 2025-08-20 |
[1] "NS-ukb-a-230"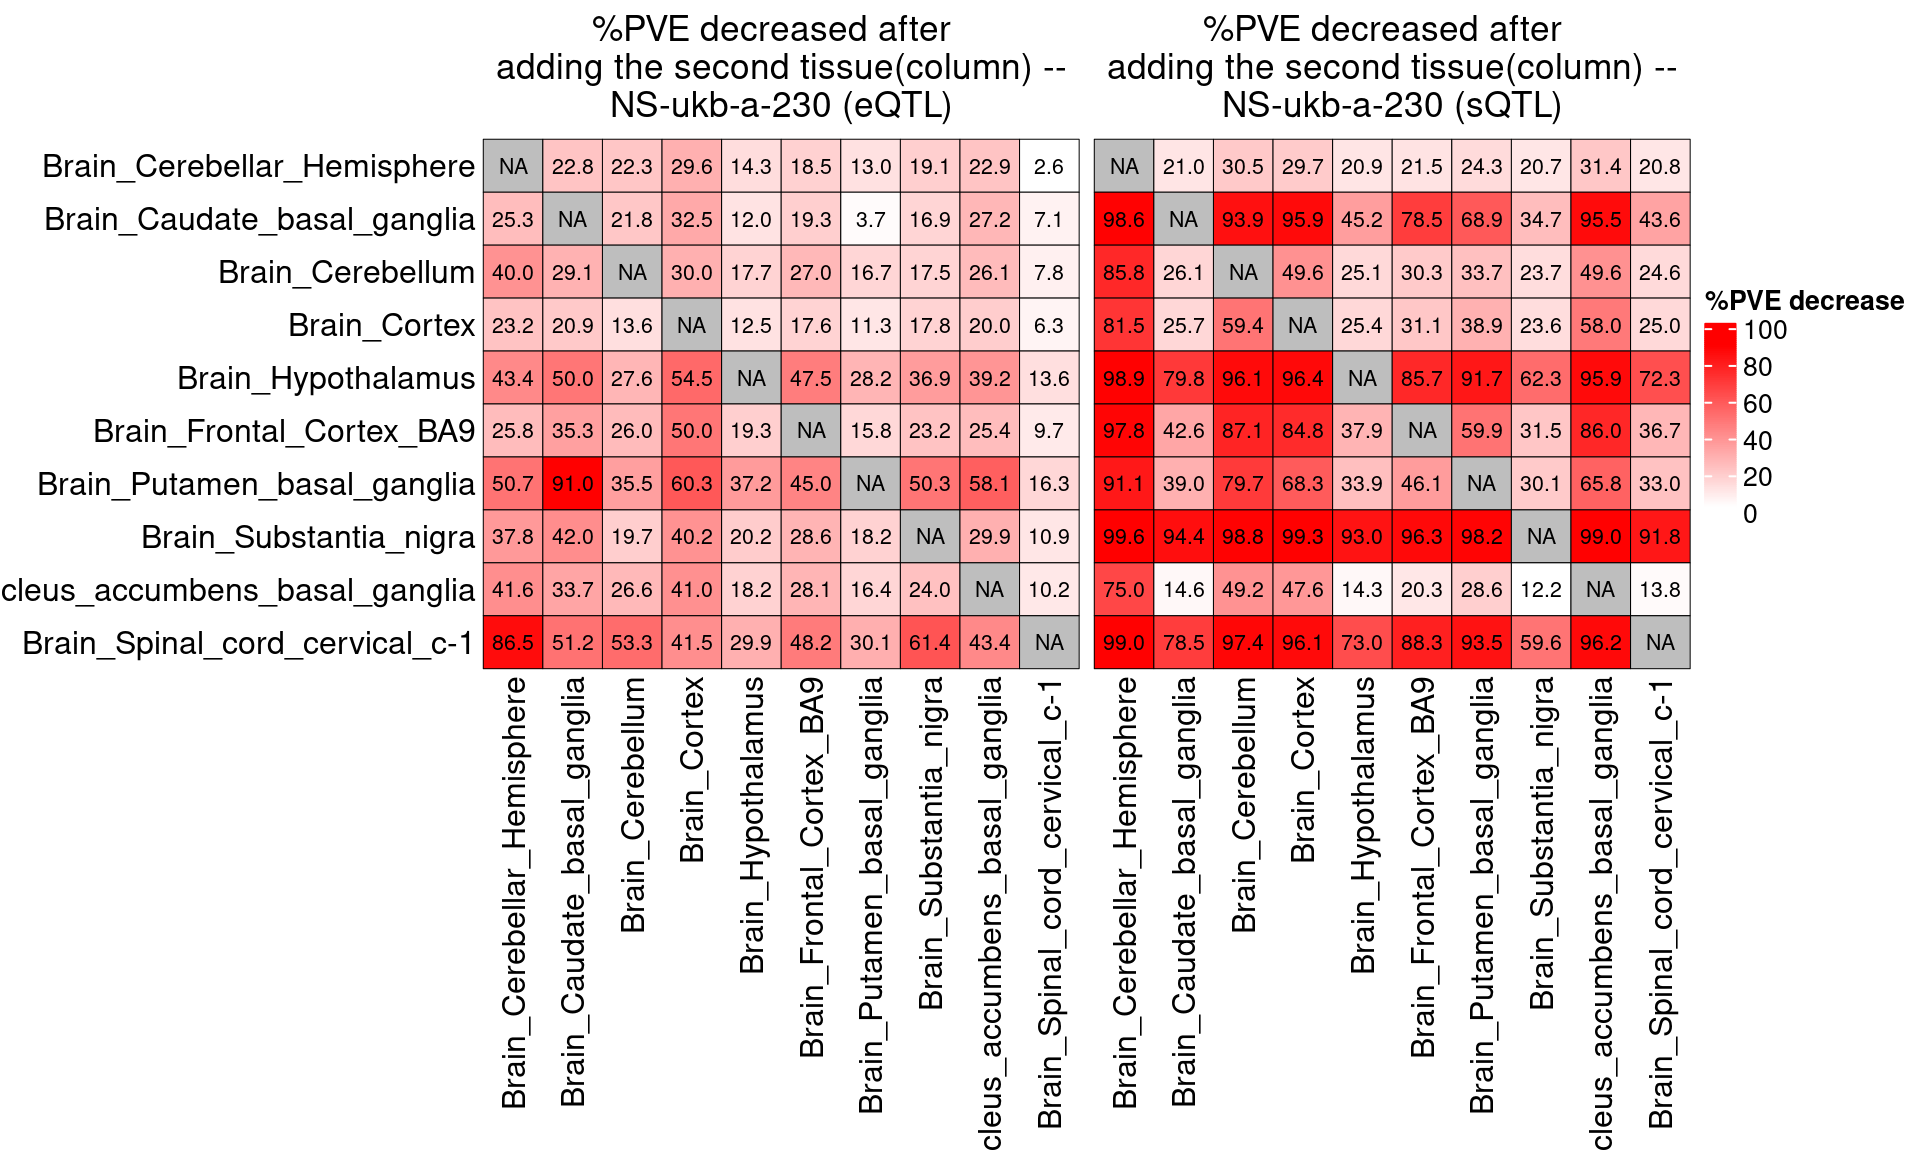
| Version | Author | Date |
|---|---|---|
| d350ce9 | XSun | 2025-08-20 |
[1] "ASD-ieu-a-1185"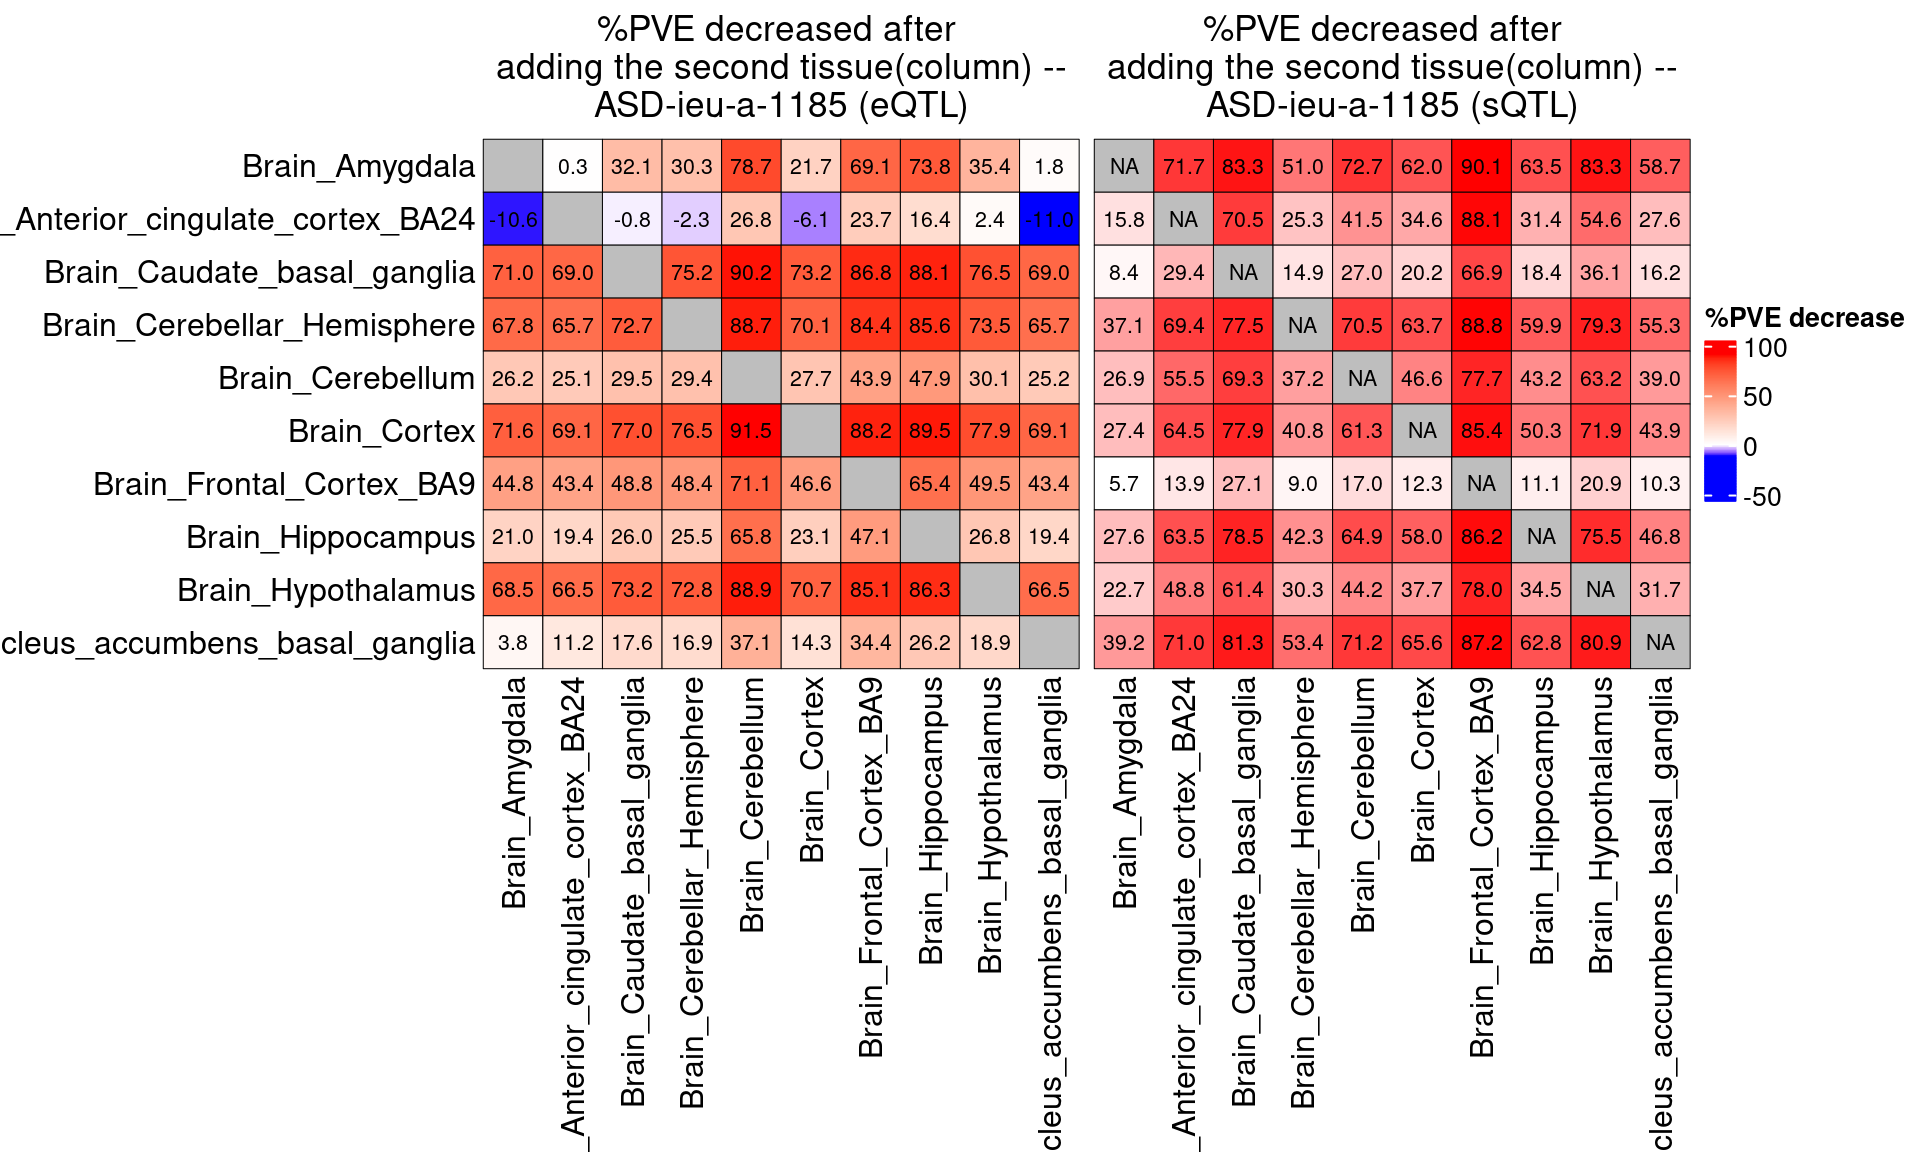
| Version | Author | Date |
|---|---|---|
| d350ce9 | XSun | 2025-08-20 |
[1] "ADHD-ieu-a-1183"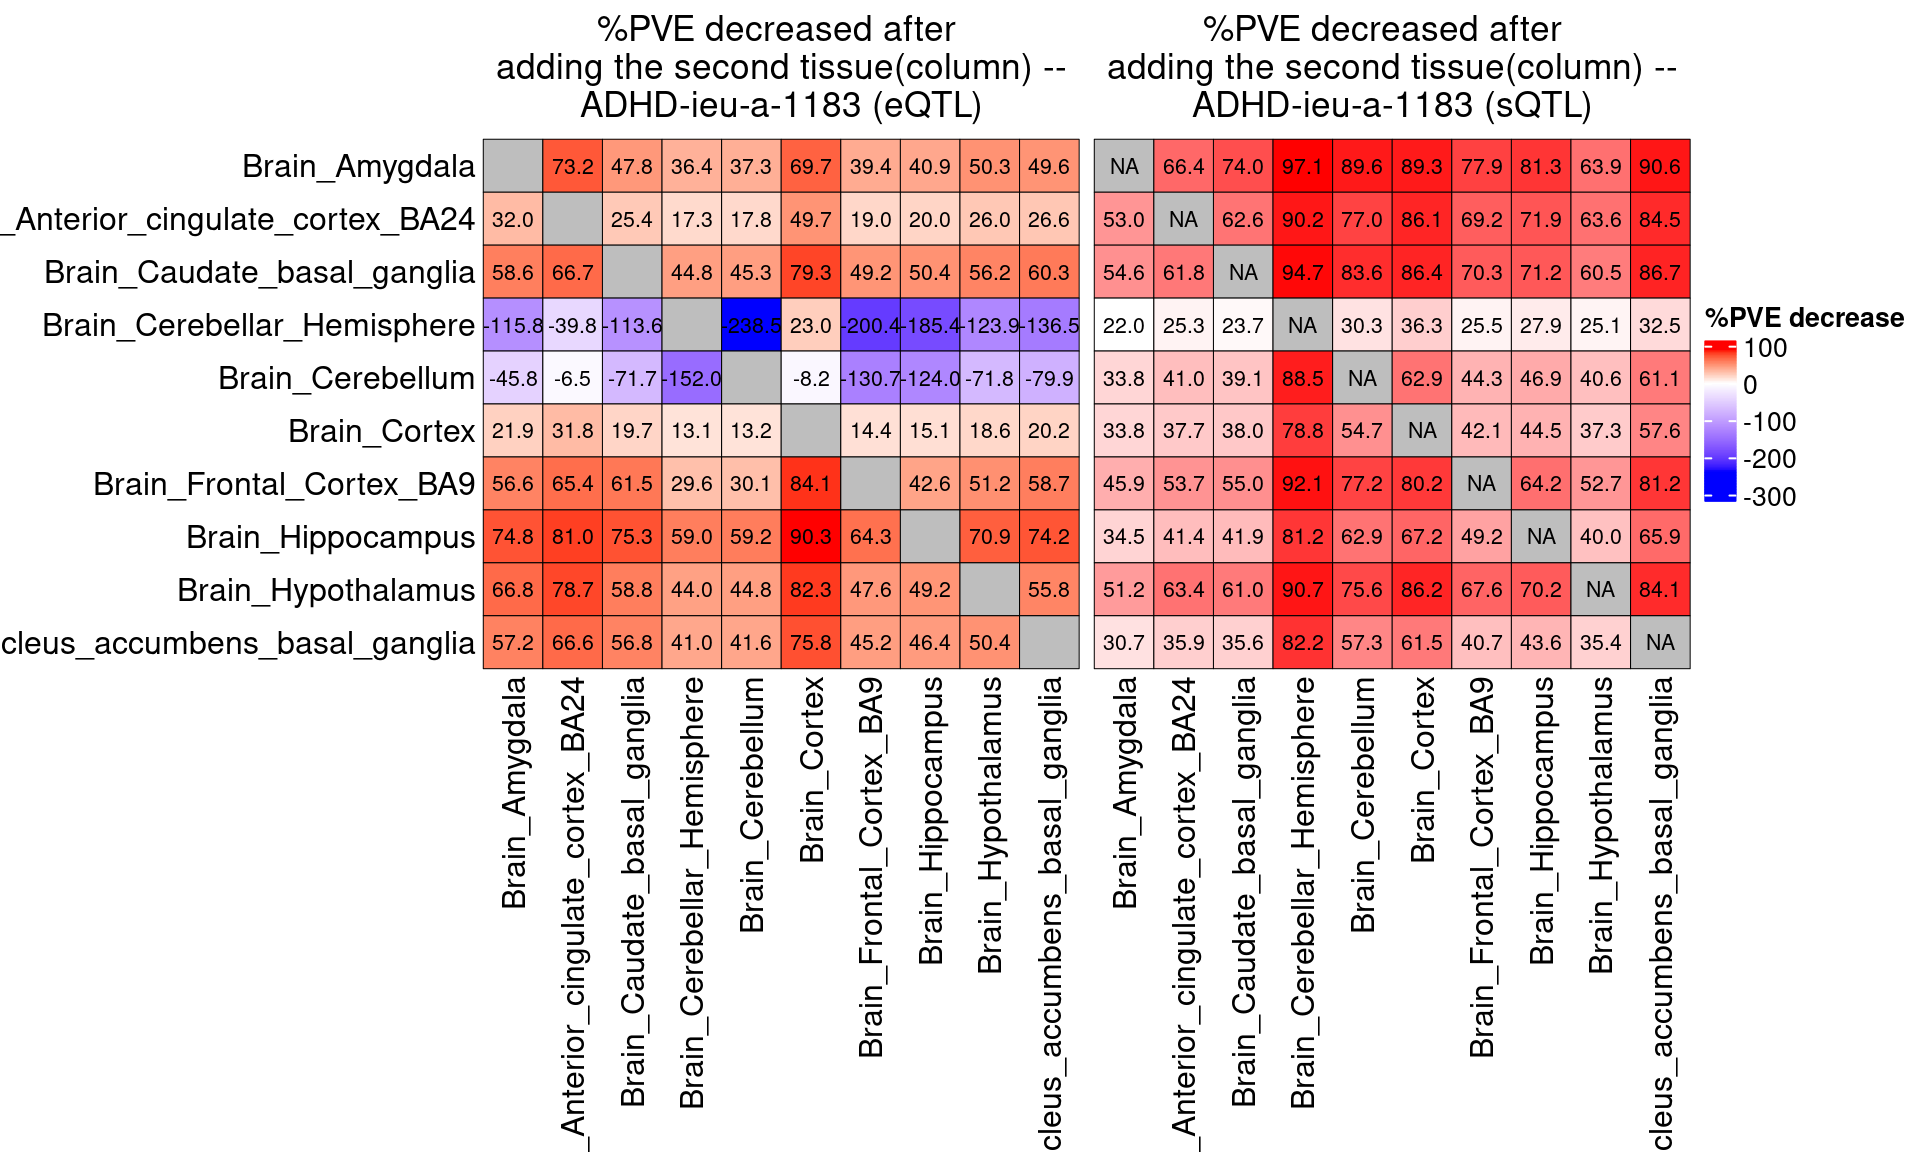
| Version | Author | Date |
|---|---|---|
| d350ce9 | XSun | 2025-08-20 |
sessionInfo()R version 4.2.0 (2022-04-22)
Platform: x86_64-pc-linux-gnu (64-bit)
Running under: CentOS Linux 7 (Core)
Matrix products: default
BLAS/LAPACK: /software/openblas-0.3.13-el7-x86_64/lib/libopenblas_haswellp-r0.3.13.so
locale:
[1] C
attached base packages:
[1] grid stats graphics grDevices utils datasets methods
[8] base
other attached packages:
[1] circlize_0.4.15 ComplexHeatmap_2.12.0 ctwas_0.5.32
loaded via a namespace (and not attached):
[1] colorspace_2.0-3 rjson_0.2.21
[3] ellipsis_0.3.2 rprojroot_2.0.3
[5] XVector_0.36.0 locuszoomr_0.2.1
[7] GlobalOptions_0.1.2 GenomicRanges_1.48.0
[9] base64enc_0.1-3 fs_1.5.2
[11] clue_0.3-61 rstudioapi_0.13
[13] ggrepel_0.9.1 bit64_4.0.5
[15] AnnotationDbi_1.58.0 fansi_1.0.3
[17] xml2_1.3.3 codetools_0.2-18
[19] logging_0.10-108 doParallel_1.0.17
[21] cachem_1.0.6 knitr_1.39
[23] jsonlite_1.8.0 workflowr_1.7.0
[25] Rsamtools_2.12.0 cluster_2.1.3
[27] dbplyr_2.1.1 png_0.1-7
[29] readr_2.1.2 compiler_4.2.0
[31] httr_1.4.3 assertthat_0.2.1
[33] Matrix_1.5-3 fastmap_1.1.0
[35] lazyeval_0.2.2 cli_3.6.1
[37] later_1.3.0 htmltools_0.5.2
[39] prettyunits_1.1.1 tools_4.2.0
[41] gtable_0.3.0 glue_1.6.2
[43] GenomeInfoDbData_1.2.8 dplyr_1.1.4
[45] rappdirs_0.3.3 Rcpp_1.0.12
[47] Biobase_2.56.0 jquerylib_0.1.4
[49] vctrs_0.6.5 Biostrings_2.64.0
[51] rtracklayer_1.56.0 iterators_1.0.14
[53] xfun_0.41 stringr_1.5.1
[55] irlba_2.3.5 lifecycle_1.0.4
[57] restfulr_0.0.14 ensembldb_2.20.2
[59] XML_3.99-0.14 zlibbioc_1.42.0
[61] zoo_1.8-10 scales_1.3.0
[63] gggrid_0.2-0 hms_1.1.1
[65] promises_1.2.0.1 MatrixGenerics_1.8.0
[67] ProtGenerics_1.28.0 parallel_4.2.0
[69] SummarizedExperiment_1.26.1 RColorBrewer_1.1-3
[71] AnnotationFilter_1.20.0 LDlinkR_1.2.3
[73] yaml_2.3.5 curl_4.3.2
[75] memoise_2.0.1 ggplot2_3.5.1
[77] sass_0.4.1 biomaRt_2.54.1
[79] stringi_1.7.6 RSQLite_2.3.1
[81] highr_0.9 S4Vectors_0.34.0
[83] BiocIO_1.6.0 foreach_1.5.2
[85] GenomicFeatures_1.48.3 BiocGenerics_0.42.0
[87] filelock_1.0.2 BiocParallel_1.30.3
[89] shape_1.4.6 repr_1.1.4
[91] GenomeInfoDb_1.39.9 rlang_1.1.2
[93] pkgconfig_2.0.3 matrixStats_0.62.0
[95] bitops_1.0-7 evaluate_0.15
[97] lattice_0.20-45 purrr_1.0.2
[99] GenomicAlignments_1.32.0 htmlwidgets_1.5.4
[101] cowplot_1.1.1 bit_4.0.4
[103] tidyselect_1.2.0 magrittr_2.0.3
[105] AMR_2.1.1 R6_2.5.1
[107] IRanges_2.30.0 generics_0.1.2
[109] DelayedArray_0.22.0 DBI_1.2.2
[111] pgenlibr_0.3.3 pillar_1.9.0
[113] whisker_0.4 mixsqp_0.3-43
[115] KEGGREST_1.36.3 RCurl_1.98-1.7
[117] tibble_3.2.1 crayon_1.5.1
[119] utf8_1.2.2 BiocFileCache_2.4.0
[121] plotly_4.10.0 tzdb_0.4.0
[123] rmarkdown_2.25 GetoptLong_1.0.5
[125] progress_1.2.2 data.table_1.14.2
[127] blob_1.2.3 git2r_0.30.1
[129] digest_0.6.29 tidyr_1.3.0
[131] httpuv_1.6.5 stats4_4.2.0
[133] munsell_0.5.0 viridisLite_0.4.0
[135] skimr_2.1.4 bslib_0.3.1