Compare results from different number of topics (k) in Cusanovich2018 data
Kaixuan Luo
Last updated: 2021-02-25
Checks: 7 0
Knit directory: scATACseq-topics/
This reproducible R Markdown analysis was created with workflowr (version 1.6.2). The Checks tab describes the reproducibility checks that were applied when the results were created. The Past versions tab lists the development history.
Great! Since the R Markdown file has been committed to the Git repository, you know the exact version of the code that produced these results.
Great job! The global environment was empty. Objects defined in the global environment can affect the analysis in your R Markdown file in unknown ways. For reproduciblity it's best to always run the code in an empty environment.
The command set.seed(20200729) was run prior to running the code in the R Markdown file. Setting a seed ensures that any results that rely on randomness, e.g. subsampling or permutations, are reproducible.
Great job! Recording the operating system, R version, and package versions is critical for reproducibility.
Nice! There were no cached chunks for this analysis, so you can be confident that you successfully produced the results during this run.
Great job! Using relative paths to the files within your workflowr project makes it easier to run your code on other machines.
Great! You are using Git for version control. Tracking code development and connecting the code version to the results is critical for reproducibility.
The results in this page were generated with repository version 88e1f8d. See the Past versions tab to see a history of the changes made to the R Markdown and HTML files.
Note that you need to be careful to ensure that all relevant files for the analysis have been committed to Git prior to generating the results (you can use wflow_publish or wflow_git_commit). workflowr only checks the R Markdown file, but you know if there are other scripts or data files that it depends on. Below is the status of the Git repository when the results were generated:
Ignored files:
    Ignored:    .Rhistory
    Ignored:    .Rproj.user/
    Ignored:    output/plotly/Buenrostro_2018_Chen2019pipeline/

Untracked files:
    Untracked:  analysis/process_data_Buenrostro2018_Chen2019.Rmd
    Untracked:  output/clustering-Cusanovich2018.rds
    Untracked:  output/plotly/Cusanovich2018/gsea_topic_10_genebody-sum_files/crosstalk-1.1.1/
    Untracked:  output/plotly/Cusanovich2018/gsea_topic_10_genebody-sum_files/jquery-3.5.1/
    Untracked:  output/plotly/Cusanovich2018/gsea_topic_10_genebody-sum_files/plotly-binding-4.9.3/
    Untracked:  output/plotly/Cusanovich2018/gsea_topic_10_genebody-sum_files/plotly-htmlwidgets-css-1.57.1/
    Untracked:  output/plotly/Cusanovich2018/gsea_topic_10_genebody-sum_files/plotly-main-1.57.1/
    Untracked:  output/plotly/Cusanovich2018/gsea_topic_10_tss-sum_files/crosstalk-1.1.1/
    Untracked:  output/plotly/Cusanovich2018/gsea_topic_10_tss-sum_files/jquery-3.5.1/
    Untracked:  output/plotly/Cusanovich2018/gsea_topic_10_tss-sum_files/plotly-binding-4.9.3/
    Untracked:  output/plotly/Cusanovich2018/gsea_topic_10_tss-sum_files/plotly-htmlwidgets-css-1.57.1/
    Untracked:  output/plotly/Cusanovich2018/gsea_topic_10_tss-sum_files/plotly-main-1.57.1/
    Untracked:  output/plotly/Cusanovich2018/gsea_topic_11_genebody-sum_files/crosstalk-1.1.1/
    Untracked:  output/plotly/Cusanovich2018/gsea_topic_11_genebody-sum_files/jquery-3.5.1/
    Untracked:  output/plotly/Cusanovich2018/gsea_topic_11_genebody-sum_files/plotly-binding-4.9.3/
    Untracked:  output/plotly/Cusanovich2018/gsea_topic_11_genebody-sum_files/plotly-htmlwidgets-css-1.57.1/
    Untracked:  output/plotly/Cusanovich2018/gsea_topic_11_genebody-sum_files/plotly-main-1.57.1/
    Untracked:  output/plotly/Cusanovich2018/gsea_topic_11_tss-sum_files/crosstalk-1.1.1/
    Untracked:  output/plotly/Cusanovich2018/gsea_topic_11_tss-sum_files/jquery-3.5.1/
    Untracked:  output/plotly/Cusanovich2018/gsea_topic_11_tss-sum_files/plotly-binding-4.9.3/
    Untracked:  output/plotly/Cusanovich2018/gsea_topic_11_tss-sum_files/plotly-htmlwidgets-css-1.57.1/
    Untracked:  output/plotly/Cusanovich2018/gsea_topic_11_tss-sum_files/plotly-main-1.57.1/
    Untracked:  output/plotly/Cusanovich2018/gsea_topic_12_genebody-sum_files/crosstalk-1.1.1/
    Untracked:  output/plotly/Cusanovich2018/gsea_topic_12_genebody-sum_files/jquery-3.5.1/
    Untracked:  output/plotly/Cusanovich2018/gsea_topic_12_genebody-sum_files/plotly-binding-4.9.3/
    Untracked:  output/plotly/Cusanovich2018/gsea_topic_12_genebody-sum_files/plotly-htmlwidgets-css-1.57.1/
    Untracked:  output/plotly/Cusanovich2018/gsea_topic_12_genebody-sum_files/plotly-main-1.57.1/
    Untracked:  output/plotly/Cusanovich2018/gsea_topic_12_tss-sum_files/crosstalk-1.1.1/
    Untracked:  output/plotly/Cusanovich2018/gsea_topic_12_tss-sum_files/jquery-3.5.1/
    Untracked:  output/plotly/Cusanovich2018/gsea_topic_12_tss-sum_files/plotly-binding-4.9.3/
    Untracked:  output/plotly/Cusanovich2018/gsea_topic_12_tss-sum_files/plotly-htmlwidgets-css-1.57.1/
    Untracked:  output/plotly/Cusanovich2018/gsea_topic_12_tss-sum_files/plotly-main-1.57.1/
    Untracked:  output/plotly/Cusanovich2018/gsea_topic_13_genebody-sum_files/crosstalk-1.1.1/
    Untracked:  output/plotly/Cusanovich2018/gsea_topic_13_genebody-sum_files/jquery-3.5.1/
    Untracked:  output/plotly/Cusanovich2018/gsea_topic_13_genebody-sum_files/plotly-binding-4.9.3/
    Untracked:  output/plotly/Cusanovich2018/gsea_topic_13_genebody-sum_files/plotly-htmlwidgets-css-1.57.1/
    Untracked:  output/plotly/Cusanovich2018/gsea_topic_13_genebody-sum_files/plotly-main-1.57.1/
    Untracked:  output/plotly/Cusanovich2018/gsea_topic_13_tss-sum_files/crosstalk-1.1.1/
    Untracked:  output/plotly/Cusanovich2018/gsea_topic_13_tss-sum_files/jquery-3.5.1/
    Untracked:  output/plotly/Cusanovich2018/gsea_topic_13_tss-sum_files/plotly-binding-4.9.3/
    Untracked:  output/plotly/Cusanovich2018/gsea_topic_13_tss-sum_files/plotly-htmlwidgets-css-1.57.1/
    Untracked:  output/plotly/Cusanovich2018/gsea_topic_13_tss-sum_files/plotly-main-1.57.1/
    Untracked:  output/plotly/Cusanovich2018/gsea_topic_1_genebody-sum_files/crosstalk-1.1.1/
    Untracked:  output/plotly/Cusanovich2018/gsea_topic_1_genebody-sum_files/jquery-3.5.1/
    Untracked:  output/plotly/Cusanovich2018/gsea_topic_1_genebody-sum_files/plotly-binding-4.9.3/
    Untracked:  output/plotly/Cusanovich2018/gsea_topic_1_genebody-sum_files/plotly-htmlwidgets-css-1.57.1/
    Untracked:  output/plotly/Cusanovich2018/gsea_topic_1_genebody-sum_files/plotly-main-1.57.1/
    Untracked:  output/plotly/Cusanovich2018/gsea_topic_1_tss-sum_files/crosstalk-1.1.1/
    Untracked:  output/plotly/Cusanovich2018/gsea_topic_1_tss-sum_files/jquery-3.5.1/
    Untracked:  output/plotly/Cusanovich2018/gsea_topic_1_tss-sum_files/plotly-binding-4.9.3/
    Untracked:  output/plotly/Cusanovich2018/gsea_topic_1_tss-sum_files/plotly-htmlwidgets-css-1.57.1/
    Untracked:  output/plotly/Cusanovich2018/gsea_topic_1_tss-sum_files/plotly-main-1.57.1/
    Untracked:  output/plotly/Cusanovich2018/gsea_topic_2_genebody-sum_files/crosstalk-1.1.1/
    Untracked:  output/plotly/Cusanovich2018/gsea_topic_2_genebody-sum_files/jquery-3.5.1/
    Untracked:  output/plotly/Cusanovich2018/gsea_topic_2_genebody-sum_files/plotly-binding-4.9.3/
    Untracked:  output/plotly/Cusanovich2018/gsea_topic_2_genebody-sum_files/plotly-htmlwidgets-css-1.57.1/
    Untracked:  output/plotly/Cusanovich2018/gsea_topic_2_genebody-sum_files/plotly-main-1.57.1/
    Untracked:  output/plotly/Cusanovich2018/gsea_topic_2_tss-sum_files/crosstalk-1.1.1/
    Untracked:  output/plotly/Cusanovich2018/gsea_topic_2_tss-sum_files/jquery-3.5.1/
    Untracked:  output/plotly/Cusanovich2018/gsea_topic_2_tss-sum_files/plotly-binding-4.9.3/
    Untracked:  output/plotly/Cusanovich2018/gsea_topic_2_tss-sum_files/plotly-htmlwidgets-css-1.57.1/
    Untracked:  output/plotly/Cusanovich2018/gsea_topic_2_tss-sum_files/plotly-main-1.57.1/
    Untracked:  output/plotly/Cusanovich2018/gsea_topic_3_genebody-sum_files/crosstalk-1.1.1/
    Untracked:  output/plotly/Cusanovich2018/gsea_topic_3_genebody-sum_files/jquery-3.5.1/
    Untracked:  output/plotly/Cusanovich2018/gsea_topic_3_genebody-sum_files/plotly-binding-4.9.3/
    Untracked:  output/plotly/Cusanovich2018/gsea_topic_3_genebody-sum_files/plotly-htmlwidgets-css-1.57.1/
    Untracked:  output/plotly/Cusanovich2018/gsea_topic_3_genebody-sum_files/plotly-main-1.57.1/
    Untracked:  output/plotly/Cusanovich2018/gsea_topic_3_tss-sum_files/crosstalk-1.1.1/
    Untracked:  output/plotly/Cusanovich2018/gsea_topic_3_tss-sum_files/jquery-3.5.1/
    Untracked:  output/plotly/Cusanovich2018/gsea_topic_3_tss-sum_files/plotly-binding-4.9.3/
    Untracked:  output/plotly/Cusanovich2018/gsea_topic_3_tss-sum_files/plotly-htmlwidgets-css-1.57.1/
    Untracked:  output/plotly/Cusanovich2018/gsea_topic_3_tss-sum_files/plotly-main-1.57.1/
    Untracked:  output/plotly/Cusanovich2018/gsea_topic_4_genebody-sum_files/crosstalk-1.1.1/
    Untracked:  output/plotly/Cusanovich2018/gsea_topic_4_genebody-sum_files/jquery-3.5.1/
    Untracked:  output/plotly/Cusanovich2018/gsea_topic_4_genebody-sum_files/plotly-binding-4.9.3/
    Untracked:  output/plotly/Cusanovich2018/gsea_topic_4_genebody-sum_files/plotly-htmlwidgets-css-1.57.1/
    Untracked:  output/plotly/Cusanovich2018/gsea_topic_4_genebody-sum_files/plotly-main-1.57.1/
    Untracked:  output/plotly/Cusanovich2018/gsea_topic_4_tss-sum_files/crosstalk-1.1.1/
    Untracked:  output/plotly/Cusanovich2018/gsea_topic_4_tss-sum_files/jquery-3.5.1/
    Untracked:  output/plotly/Cusanovich2018/gsea_topic_4_tss-sum_files/plotly-binding-4.9.3/
    Untracked:  output/plotly/Cusanovich2018/gsea_topic_4_tss-sum_files/plotly-htmlwidgets-css-1.57.1/
    Untracked:  output/plotly/Cusanovich2018/gsea_topic_4_tss-sum_files/plotly-main-1.57.1/
    Untracked:  output/plotly/Cusanovich2018/gsea_topic_5_genebody-sum_files/crosstalk-1.1.1/
    Untracked:  output/plotly/Cusanovich2018/gsea_topic_5_genebody-sum_files/jquery-3.5.1/
    Untracked:  output/plotly/Cusanovich2018/gsea_topic_5_genebody-sum_files/plotly-binding-4.9.3/
    Untracked:  output/plotly/Cusanovich2018/gsea_topic_5_genebody-sum_files/plotly-htmlwidgets-css-1.57.1/
    Untracked:  output/plotly/Cusanovich2018/gsea_topic_5_genebody-sum_files/plotly-main-1.57.1/
    Untracked:  output/plotly/Cusanovich2018/gsea_topic_5_tss-sum_files/crosstalk-1.1.1/
    Untracked:  output/plotly/Cusanovich2018/gsea_topic_5_tss-sum_files/jquery-3.5.1/
    Untracked:  output/plotly/Cusanovich2018/gsea_topic_5_tss-sum_files/plotly-binding-4.9.3/
    Untracked:  output/plotly/Cusanovich2018/gsea_topic_5_tss-sum_files/plotly-htmlwidgets-css-1.57.1/
    Untracked:  output/plotly/Cusanovich2018/gsea_topic_5_tss-sum_files/plotly-main-1.57.1/
    Untracked:  output/plotly/Cusanovich2018/gsea_topic_6_genebody-sum_files/crosstalk-1.1.1/
    Untracked:  output/plotly/Cusanovich2018/gsea_topic_6_genebody-sum_files/jquery-3.5.1/
    Untracked:  output/plotly/Cusanovich2018/gsea_topic_6_genebody-sum_files/plotly-binding-4.9.3/
    Untracked:  output/plotly/Cusanovich2018/gsea_topic_6_genebody-sum_files/plotly-htmlwidgets-css-1.57.1/
    Untracked:  output/plotly/Cusanovich2018/gsea_topic_6_genebody-sum_files/plotly-main-1.57.1/
    Untracked:  output/plotly/Cusanovich2018/gsea_topic_6_tss-sum_files/crosstalk-1.1.1/
    Untracked:  output/plotly/Cusanovich2018/gsea_topic_6_tss-sum_files/jquery-3.5.1/
    Untracked:  output/plotly/Cusanovich2018/gsea_topic_6_tss-sum_files/plotly-binding-4.9.3/
    Untracked:  output/plotly/Cusanovich2018/gsea_topic_6_tss-sum_files/plotly-htmlwidgets-css-1.57.1/
    Untracked:  output/plotly/Cusanovich2018/gsea_topic_6_tss-sum_files/plotly-main-1.57.1/
    Untracked:  output/plotly/Cusanovich2018/gsea_topic_7_genebody-sum_files/crosstalk-1.1.1/
    Untracked:  output/plotly/Cusanovich2018/gsea_topic_7_genebody-sum_files/jquery-3.5.1/
    Untracked:  output/plotly/Cusanovich2018/gsea_topic_7_genebody-sum_files/plotly-binding-4.9.3/
    Untracked:  output/plotly/Cusanovich2018/gsea_topic_7_genebody-sum_files/plotly-htmlwidgets-css-1.57.1/
    Untracked:  output/plotly/Cusanovich2018/gsea_topic_7_genebody-sum_files/plotly-main-1.57.1/
    Untracked:  output/plotly/Cusanovich2018/gsea_topic_7_tss-sum_files/crosstalk-1.1.1/
    Untracked:  output/plotly/Cusanovich2018/gsea_topic_7_tss-sum_files/jquery-3.5.1/
    Untracked:  output/plotly/Cusanovich2018/gsea_topic_7_tss-sum_files/plotly-binding-4.9.3/
    Untracked:  output/plotly/Cusanovich2018/gsea_topic_7_tss-sum_files/plotly-htmlwidgets-css-1.57.1/
    Untracked:  output/plotly/Cusanovich2018/gsea_topic_7_tss-sum_files/plotly-main-1.57.1/
    Untracked:  output/plotly/Cusanovich2018/gsea_topic_8_genebody-sum_files/crosstalk-1.1.1/
    Untracked:  output/plotly/Cusanovich2018/gsea_topic_8_genebody-sum_files/jquery-3.5.1/
    Untracked:  output/plotly/Cusanovich2018/gsea_topic_8_genebody-sum_files/plotly-binding-4.9.3/
    Untracked:  output/plotly/Cusanovich2018/gsea_topic_8_genebody-sum_files/plotly-htmlwidgets-css-1.57.1/
    Untracked:  output/plotly/Cusanovich2018/gsea_topic_8_genebody-sum_files/plotly-main-1.57.1/
    Untracked:  output/plotly/Cusanovich2018/gsea_topic_8_tss-sum_files/crosstalk-1.1.1/
    Untracked:  output/plotly/Cusanovich2018/gsea_topic_8_tss-sum_files/jquery-3.5.1/
    Untracked:  output/plotly/Cusanovich2018/gsea_topic_8_tss-sum_files/plotly-binding-4.9.3/
    Untracked:  output/plotly/Cusanovich2018/gsea_topic_8_tss-sum_files/plotly-htmlwidgets-css-1.57.1/
    Untracked:  output/plotly/Cusanovich2018/gsea_topic_8_tss-sum_files/plotly-main-1.57.1/
    Untracked:  output/plotly/Cusanovich2018/gsea_topic_9_genebody-sum_files/crosstalk-1.1.1/
    Untracked:  output/plotly/Cusanovich2018/gsea_topic_9_genebody-sum_files/jquery-3.5.1/
    Untracked:  output/plotly/Cusanovich2018/gsea_topic_9_genebody-sum_files/plotly-binding-4.9.3/
    Untracked:  output/plotly/Cusanovich2018/gsea_topic_9_genebody-sum_files/plotly-htmlwidgets-css-1.57.1/
    Untracked:  output/plotly/Cusanovich2018/gsea_topic_9_genebody-sum_files/plotly-main-1.57.1/
    Untracked:  output/plotly/Cusanovich2018/gsea_topic_9_tss-sum_files/crosstalk-1.1.1/
    Untracked:  output/plotly/Cusanovich2018/gsea_topic_9_tss-sum_files/jquery-3.5.1/
    Untracked:  output/plotly/Cusanovich2018/gsea_topic_9_tss-sum_files/plotly-binding-4.9.3/
    Untracked:  output/plotly/Cusanovich2018/gsea_topic_9_tss-sum_files/plotly-htmlwidgets-css-1.57.1/
    Untracked:  output/plotly/Cusanovich2018/gsea_topic_9_tss-sum_files/plotly-main-1.57.1/
    Untracked:  output/plotly/Cusanovich2018/volcano_topic_10_genebody-sum_files/crosstalk-1.1.1/
    Untracked:  output/plotly/Cusanovich2018/volcano_topic_10_genebody-sum_files/jquery-3.5.1/
    Untracked:  output/plotly/Cusanovich2018/volcano_topic_10_genebody-sum_files/plotly-binding-4.9.3/
    Untracked:  output/plotly/Cusanovich2018/volcano_topic_10_genebody-sum_files/plotly-htmlwidgets-css-1.57.1/
    Untracked:  output/plotly/Cusanovich2018/volcano_topic_10_genebody-sum_files/plotly-main-1.57.1/
    Untracked:  output/plotly/Cusanovich2018/volcano_topic_10_tss-sum_files/crosstalk-1.1.1/
    Untracked:  output/plotly/Cusanovich2018/volcano_topic_10_tss-sum_files/jquery-3.5.1/
    Untracked:  output/plotly/Cusanovich2018/volcano_topic_10_tss-sum_files/plotly-binding-4.9.3/
    Untracked:  output/plotly/Cusanovich2018/volcano_topic_10_tss-sum_files/plotly-htmlwidgets-css-1.57.1/
    Untracked:  output/plotly/Cusanovich2018/volcano_topic_10_tss-sum_files/plotly-main-1.57.1/
    Untracked:  output/plotly/Cusanovich2018/volcano_topic_11_genebody-sum_files/crosstalk-1.1.1/
    Untracked:  output/plotly/Cusanovich2018/volcano_topic_11_genebody-sum_files/jquery-3.5.1/
    Untracked:  output/plotly/Cusanovich2018/volcano_topic_11_genebody-sum_files/plotly-binding-4.9.3/
    Untracked:  output/plotly/Cusanovich2018/volcano_topic_11_genebody-sum_files/plotly-htmlwidgets-css-1.57.1/
    Untracked:  output/plotly/Cusanovich2018/volcano_topic_11_genebody-sum_files/plotly-main-1.57.1/
    Untracked:  output/plotly/Cusanovich2018/volcano_topic_11_tss-sum_files/crosstalk-1.1.1/
    Untracked:  output/plotly/Cusanovich2018/volcano_topic_11_tss-sum_files/jquery-3.5.1/
    Untracked:  output/plotly/Cusanovich2018/volcano_topic_11_tss-sum_files/plotly-binding-4.9.3/
    Untracked:  output/plotly/Cusanovich2018/volcano_topic_11_tss-sum_files/plotly-htmlwidgets-css-1.57.1/
    Untracked:  output/plotly/Cusanovich2018/volcano_topic_11_tss-sum_files/plotly-main-1.57.1/
    Untracked:  output/plotly/Cusanovich2018/volcano_topic_12_genebody-sum_files/crosstalk-1.1.1/
    Untracked:  output/plotly/Cusanovich2018/volcano_topic_12_genebody-sum_files/jquery-3.5.1/
    Untracked:  output/plotly/Cusanovich2018/volcano_topic_12_genebody-sum_files/plotly-binding-4.9.3/
    Untracked:  output/plotly/Cusanovich2018/volcano_topic_12_genebody-sum_files/plotly-htmlwidgets-css-1.57.1/
    Untracked:  output/plotly/Cusanovich2018/volcano_topic_12_genebody-sum_files/plotly-main-1.57.1/
    Untracked:  output/plotly/Cusanovich2018/volcano_topic_12_tss-sum_files/crosstalk-1.1.1/
    Untracked:  output/plotly/Cusanovich2018/volcano_topic_12_tss-sum_files/jquery-3.5.1/
    Untracked:  output/plotly/Cusanovich2018/volcano_topic_12_tss-sum_files/plotly-binding-4.9.3/
    Untracked:  output/plotly/Cusanovich2018/volcano_topic_12_tss-sum_files/plotly-htmlwidgets-css-1.57.1/
    Untracked:  output/plotly/Cusanovich2018/volcano_topic_12_tss-sum_files/plotly-main-1.57.1/
    Untracked:  output/plotly/Cusanovich2018/volcano_topic_13_genebody-sum_files/crosstalk-1.1.1/
    Untracked:  output/plotly/Cusanovich2018/volcano_topic_13_genebody-sum_files/jquery-3.5.1/
    Untracked:  output/plotly/Cusanovich2018/volcano_topic_13_genebody-sum_files/plotly-binding-4.9.3/
    Untracked:  output/plotly/Cusanovich2018/volcano_topic_13_genebody-sum_files/plotly-htmlwidgets-css-1.57.1/
    Untracked:  output/plotly/Cusanovich2018/volcano_topic_13_genebody-sum_files/plotly-main-1.57.1/
    Untracked:  output/plotly/Cusanovich2018/volcano_topic_13_tss-sum_files/crosstalk-1.1.1/
    Untracked:  output/plotly/Cusanovich2018/volcano_topic_13_tss-sum_files/jquery-3.5.1/
    Untracked:  output/plotly/Cusanovich2018/volcano_topic_13_tss-sum_files/plotly-binding-4.9.3/
    Untracked:  output/plotly/Cusanovich2018/volcano_topic_13_tss-sum_files/plotly-htmlwidgets-css-1.57.1/
    Untracked:  output/plotly/Cusanovich2018/volcano_topic_13_tss-sum_files/plotly-main-1.57.1/
    Untracked:  output/plotly/Cusanovich2018/volcano_topic_1_genebody-sum_files/crosstalk-1.1.1/
    Untracked:  output/plotly/Cusanovich2018/volcano_topic_1_genebody-sum_files/jquery-3.5.1/
    Untracked:  output/plotly/Cusanovich2018/volcano_topic_1_genebody-sum_files/plotly-binding-4.9.3/
    Untracked:  output/plotly/Cusanovich2018/volcano_topic_1_genebody-sum_files/plotly-htmlwidgets-css-1.57.1/
    Untracked:  output/plotly/Cusanovich2018/volcano_topic_1_genebody-sum_files/plotly-main-1.57.1/
    Untracked:  output/plotly/Cusanovich2018/volcano_topic_1_tss-sum_files/crosstalk-1.1.1/
    Untracked:  output/plotly/Cusanovich2018/volcano_topic_1_tss-sum_files/jquery-3.5.1/
    Untracked:  output/plotly/Cusanovich2018/volcano_topic_1_tss-sum_files/plotly-binding-4.9.3/
    Untracked:  output/plotly/Cusanovich2018/volcano_topic_1_tss-sum_files/plotly-htmlwidgets-css-1.57.1/
    Untracked:  output/plotly/Cusanovich2018/volcano_topic_1_tss-sum_files/plotly-main-1.57.1/
    Untracked:  output/plotly/Cusanovich2018/volcano_topic_2_genebody-sum_files/crosstalk-1.1.1/
    Untracked:  output/plotly/Cusanovich2018/volcano_topic_2_genebody-sum_files/jquery-3.5.1/
    Untracked:  output/plotly/Cusanovich2018/volcano_topic_2_genebody-sum_files/plotly-binding-4.9.3/
    Untracked:  output/plotly/Cusanovich2018/volcano_topic_2_genebody-sum_files/plotly-htmlwidgets-css-1.57.1/
    Untracked:  output/plotly/Cusanovich2018/volcano_topic_2_genebody-sum_files/plotly-main-1.57.1/
    Untracked:  output/plotly/Cusanovich2018/volcano_topic_2_tss-sum_files/crosstalk-1.1.1/
    Untracked:  output/plotly/Cusanovich2018/volcano_topic_2_tss-sum_files/jquery-3.5.1/
    Untracked:  output/plotly/Cusanovich2018/volcano_topic_2_tss-sum_files/plotly-binding-4.9.3/
    Untracked:  output/plotly/Cusanovich2018/volcano_topic_2_tss-sum_files/plotly-htmlwidgets-css-1.57.1/
    Untracked:  output/plotly/Cusanovich2018/volcano_topic_2_tss-sum_files/plotly-main-1.57.1/
    Untracked:  output/plotly/Cusanovich2018/volcano_topic_3_genebody-sum_files/crosstalk-1.1.1/
    Untracked:  output/plotly/Cusanovich2018/volcano_topic_3_genebody-sum_files/jquery-3.5.1/
    Untracked:  output/plotly/Cusanovich2018/volcano_topic_3_genebody-sum_files/plotly-binding-4.9.3/
    Untracked:  output/plotly/Cusanovich2018/volcano_topic_3_genebody-sum_files/plotly-htmlwidgets-css-1.57.1/
    Untracked:  output/plotly/Cusanovich2018/volcano_topic_3_genebody-sum_files/plotly-main-1.57.1/
    Untracked:  output/plotly/Cusanovich2018/volcano_topic_3_tss-sum_files/crosstalk-1.1.1/
    Untracked:  output/plotly/Cusanovich2018/volcano_topic_3_tss-sum_files/jquery-3.5.1/
    Untracked:  output/plotly/Cusanovich2018/volcano_topic_3_tss-sum_files/plotly-binding-4.9.3/
    Untracked:  output/plotly/Cusanovich2018/volcano_topic_3_tss-sum_files/plotly-htmlwidgets-css-1.57.1/
    Untracked:  output/plotly/Cusanovich2018/volcano_topic_3_tss-sum_files/plotly-main-1.57.1/
    Untracked:  output/plotly/Cusanovich2018/volcano_topic_4_genebody-sum_files/crosstalk-1.1.1/
    Untracked:  output/plotly/Cusanovich2018/volcano_topic_4_genebody-sum_files/jquery-3.5.1/
    Untracked:  output/plotly/Cusanovich2018/volcano_topic_4_genebody-sum_files/plotly-binding-4.9.3/
    Untracked:  output/plotly/Cusanovich2018/volcano_topic_4_genebody-sum_files/plotly-htmlwidgets-css-1.57.1/
    Untracked:  output/plotly/Cusanovich2018/volcano_topic_4_genebody-sum_files/plotly-main-1.57.1/
    Untracked:  output/plotly/Cusanovich2018/volcano_topic_4_tss-sum_files/crosstalk-1.1.1/
    Untracked:  output/plotly/Cusanovich2018/volcano_topic_4_tss-sum_files/jquery-3.5.1/
    Untracked:  output/plotly/Cusanovich2018/volcano_topic_4_tss-sum_files/plotly-binding-4.9.3/
    Untracked:  output/plotly/Cusanovich2018/volcano_topic_4_tss-sum_files/plotly-htmlwidgets-css-1.57.1/
    Untracked:  output/plotly/Cusanovich2018/volcano_topic_4_tss-sum_files/plotly-main-1.57.1/
    Untracked:  output/plotly/Cusanovich2018/volcano_topic_5_genebody-sum_files/crosstalk-1.1.1/
    Untracked:  output/plotly/Cusanovich2018/volcano_topic_5_genebody-sum_files/jquery-3.5.1/
    Untracked:  output/plotly/Cusanovich2018/volcano_topic_5_genebody-sum_files/plotly-binding-4.9.3/
    Untracked:  output/plotly/Cusanovich2018/volcano_topic_5_genebody-sum_files/plotly-htmlwidgets-css-1.57.1/
    Untracked:  output/plotly/Cusanovich2018/volcano_topic_5_genebody-sum_files/plotly-main-1.57.1/
    Untracked:  output/plotly/Cusanovich2018/volcano_topic_5_tss-sum_files/crosstalk-1.1.1/
    Untracked:  output/plotly/Cusanovich2018/volcano_topic_5_tss-sum_files/jquery-3.5.1/
    Untracked:  output/plotly/Cusanovich2018/volcano_topic_5_tss-sum_files/plotly-binding-4.9.3/
    Untracked:  output/plotly/Cusanovich2018/volcano_topic_5_tss-sum_files/plotly-htmlwidgets-css-1.57.1/
    Untracked:  output/plotly/Cusanovich2018/volcano_topic_5_tss-sum_files/plotly-main-1.57.1/
    Untracked:  output/plotly/Cusanovich2018/volcano_topic_6_genebody-sum_files/crosstalk-1.1.1/
    Untracked:  output/plotly/Cusanovich2018/volcano_topic_6_genebody-sum_files/jquery-3.5.1/
    Untracked:  output/plotly/Cusanovich2018/volcano_topic_6_genebody-sum_files/plotly-binding-4.9.3/
    Untracked:  output/plotly/Cusanovich2018/volcano_topic_6_genebody-sum_files/plotly-htmlwidgets-css-1.57.1/
    Untracked:  output/plotly/Cusanovich2018/volcano_topic_6_genebody-sum_files/plotly-main-1.57.1/
    Untracked:  output/plotly/Cusanovich2018/volcano_topic_6_tss-sum_files/crosstalk-1.1.1/
    Untracked:  output/plotly/Cusanovich2018/volcano_topic_6_tss-sum_files/jquery-3.5.1/
    Untracked:  output/plotly/Cusanovich2018/volcano_topic_6_tss-sum_files/plotly-binding-4.9.3/
    Untracked:  output/plotly/Cusanovich2018/volcano_topic_6_tss-sum_files/plotly-htmlwidgets-css-1.57.1/
    Untracked:  output/plotly/Cusanovich2018/volcano_topic_6_tss-sum_files/plotly-main-1.57.1/
    Untracked:  output/plotly/Cusanovich2018/volcano_topic_7_genebody-sum_files/crosstalk-1.1.1/
    Untracked:  output/plotly/Cusanovich2018/volcano_topic_7_genebody-sum_files/jquery-3.5.1/
    Untracked:  output/plotly/Cusanovich2018/volcano_topic_7_genebody-sum_files/plotly-binding-4.9.3/
    Untracked:  output/plotly/Cusanovich2018/volcano_topic_7_genebody-sum_files/plotly-htmlwidgets-css-1.57.1/
    Untracked:  output/plotly/Cusanovich2018/volcano_topic_7_genebody-sum_files/plotly-main-1.57.1/
    Untracked:  output/plotly/Cusanovich2018/volcano_topic_7_tss-sum_files/crosstalk-1.1.1/
    Untracked:  output/plotly/Cusanovich2018/volcano_topic_7_tss-sum_files/jquery-3.5.1/
    Untracked:  output/plotly/Cusanovich2018/volcano_topic_7_tss-sum_files/plotly-binding-4.9.3/
    Untracked:  output/plotly/Cusanovich2018/volcano_topic_7_tss-sum_files/plotly-htmlwidgets-css-1.57.1/
    Untracked:  output/plotly/Cusanovich2018/volcano_topic_7_tss-sum_files/plotly-main-1.57.1/
    Untracked:  output/plotly/Cusanovich2018/volcano_topic_8_genebody-sum_files/crosstalk-1.1.1/
    Untracked:  output/plotly/Cusanovich2018/volcano_topic_8_genebody-sum_files/jquery-3.5.1/
    Untracked:  output/plotly/Cusanovich2018/volcano_topic_8_genebody-sum_files/plotly-binding-4.9.3/
    Untracked:  output/plotly/Cusanovich2018/volcano_topic_8_genebody-sum_files/plotly-htmlwidgets-css-1.57.1/
    Untracked:  output/plotly/Cusanovich2018/volcano_topic_8_genebody-sum_files/plotly-main-1.57.1/
    Untracked:  output/plotly/Cusanovich2018/volcano_topic_8_tss-sum_files/crosstalk-1.1.1/
    Untracked:  output/plotly/Cusanovich2018/volcano_topic_8_tss-sum_files/jquery-3.5.1/
    Untracked:  output/plotly/Cusanovich2018/volcano_topic_8_tss-sum_files/plotly-binding-4.9.3/
    Untracked:  output/plotly/Cusanovich2018/volcano_topic_8_tss-sum_files/plotly-htmlwidgets-css-1.57.1/
    Untracked:  output/plotly/Cusanovich2018/volcano_topic_8_tss-sum_files/plotly-main-1.57.1/
    Untracked:  output/plotly/Cusanovich2018/volcano_topic_9_genebody-sum_files/crosstalk-1.1.1/
    Untracked:  output/plotly/Cusanovich2018/volcano_topic_9_genebody-sum_files/jquery-3.5.1/
    Untracked:  output/plotly/Cusanovich2018/volcano_topic_9_genebody-sum_files/plotly-binding-4.9.3/
    Untracked:  output/plotly/Cusanovich2018/volcano_topic_9_genebody-sum_files/plotly-htmlwidgets-css-1.57.1/
    Untracked:  output/plotly/Cusanovich2018/volcano_topic_9_genebody-sum_files/plotly-main-1.57.1/
    Untracked:  output/plotly/Cusanovich2018/volcano_topic_9_tss-sum_files/crosstalk-1.1.1/
    Untracked:  output/plotly/Cusanovich2018/volcano_topic_9_tss-sum_files/jquery-3.5.1/
    Untracked:  output/plotly/Cusanovich2018/volcano_topic_9_tss-sum_files/plotly-binding-4.9.3/
    Untracked:  output/plotly/Cusanovich2018/volcano_topic_9_tss-sum_files/plotly-htmlwidgets-css-1.57.1/
    Untracked:  output/plotly/Cusanovich2018/volcano_topic_9_tss-sum_files/plotly-main-1.57.1/
    Untracked:  scripts/fit_all_models_Buenrostro_2018_chromVar_scPeaks_filtered.sbatch
    Untracked:  scripts/fit_models_Cusanovich2018_tissues.sh

Unstaged changes:
    Modified:   analysis/clusters_Cusanovich2018_k13.Rmd
    Modified:   analysis/gene_analysis_Cusanovich2018.Rmd
    Modified:   analysis/motif_analysis_Buenrostro2018_Chen2019pipeline.Rmd
    Modified:   analysis/plots_Cusanovich2018.Rmd
    Modified:   analysis/process_data_Cusanovich2018.Rmd
    Modified:   code/plots.R
    Modified:   output/plotly/Cusanovich2018/gsea_topic_10_genebody-sum.html
    Modified:   output/plotly/Cusanovich2018/gsea_topic_10_tss-sum.html
    Modified:   output/plotly/Cusanovich2018/gsea_topic_11_genebody-sum.html
    Modified:   output/plotly/Cusanovich2018/gsea_topic_11_tss-sum.html
    Modified:   output/plotly/Cusanovich2018/gsea_topic_12_genebody-sum.html
    Modified:   output/plotly/Cusanovich2018/gsea_topic_12_tss-sum.html
    Modified:   output/plotly/Cusanovich2018/gsea_topic_13_genebody-sum.html
    Modified:   output/plotly/Cusanovich2018/gsea_topic_13_tss-sum.html
    Modified:   output/plotly/Cusanovich2018/gsea_topic_1_genebody-sum.html
    Modified:   output/plotly/Cusanovich2018/gsea_topic_1_tss-sum.html
    Modified:   output/plotly/Cusanovich2018/gsea_topic_2_genebody-sum.html
    Modified:   output/plotly/Cusanovich2018/gsea_topic_2_tss-sum.html
    Modified:   output/plotly/Cusanovich2018/gsea_topic_3_genebody-sum.html
    Modified:   output/plotly/Cusanovich2018/gsea_topic_3_tss-sum.html
    Modified:   output/plotly/Cusanovich2018/gsea_topic_4_genebody-sum.html
    Modified:   output/plotly/Cusanovich2018/gsea_topic_4_tss-sum.html
    Modified:   output/plotly/Cusanovich2018/gsea_topic_5_genebody-sum.html
    Modified:   output/plotly/Cusanovich2018/gsea_topic_5_tss-sum.html
    Modified:   output/plotly/Cusanovich2018/gsea_topic_6_genebody-sum.html
    Modified:   output/plotly/Cusanovich2018/gsea_topic_6_tss-sum.html
    Modified:   output/plotly/Cusanovich2018/gsea_topic_7_genebody-sum.html
    Modified:   output/plotly/Cusanovich2018/gsea_topic_7_tss-sum.html
    Modified:   output/plotly/Cusanovich2018/gsea_topic_8_genebody-sum.html
    Modified:   output/plotly/Cusanovich2018/gsea_topic_8_tss-sum.html
    Modified:   output/plotly/Cusanovich2018/gsea_topic_9_genebody-sum.html
    Modified:   output/plotly/Cusanovich2018/gsea_topic_9_tss-sum.html
    Modified:   output/plotly/Cusanovich2018/volcano_topic_10_genebody-sum.html
    Modified:   output/plotly/Cusanovich2018/volcano_topic_10_tss-sum.html
    Modified:   output/plotly/Cusanovich2018/volcano_topic_11_genebody-sum.html
    Modified:   output/plotly/Cusanovich2018/volcano_topic_11_tss-sum.html
    Modified:   output/plotly/Cusanovich2018/volcano_topic_12_genebody-sum.html
    Modified:   output/plotly/Cusanovich2018/volcano_topic_12_tss-sum.html
    Modified:   output/plotly/Cusanovich2018/volcano_topic_13_genebody-sum.html
    Modified:   output/plotly/Cusanovich2018/volcano_topic_13_tss-sum.html
    Modified:   output/plotly/Cusanovich2018/volcano_topic_1_genebody-sum.html
    Modified:   output/plotly/Cusanovich2018/volcano_topic_1_tss-sum.html
    Modified:   output/plotly/Cusanovich2018/volcano_topic_2_genebody-sum.html
    Modified:   output/plotly/Cusanovich2018/volcano_topic_2_tss-sum.html
    Modified:   output/plotly/Cusanovich2018/volcano_topic_3_genebody-sum.html
    Modified:   output/plotly/Cusanovich2018/volcano_topic_3_tss-sum.html
    Modified:   output/plotly/Cusanovich2018/volcano_topic_4_genebody-sum.html
    Modified:   output/plotly/Cusanovich2018/volcano_topic_4_tss-sum.html
    Modified:   output/plotly/Cusanovich2018/volcano_topic_5_genebody-sum.html
    Modified:   output/plotly/Cusanovich2018/volcano_topic_5_tss-sum.html
    Modified:   output/plotly/Cusanovich2018/volcano_topic_6_genebody-sum.html
    Modified:   output/plotly/Cusanovich2018/volcano_topic_6_tss-sum.html
    Modified:   output/plotly/Cusanovich2018/volcano_topic_7_genebody-sum.html
    Modified:   output/plotly/Cusanovich2018/volcano_topic_7_tss-sum.html
    Modified:   output/plotly/Cusanovich2018/volcano_topic_8_genebody-sum.html
    Modified:   output/plotly/Cusanovich2018/volcano_topic_8_tss-sum.html
    Modified:   output/plotly/Cusanovich2018/volcano_topic_9_genebody-sum.html
    Modified:   output/plotly/Cusanovich2018/volcano_topic_9_tss-sum.html
    Modified:   scripts/fit_all_models_Cusanovich2018.sh
Note that any generated files, e.g. HTML, png, CSS, etc., are not included in this status report because it is ok for generated content to have uncommitted changes.
These are the previous versions of the repository in which changes were made to the R Markdown (analysis/compare_different_k_Cusanovich2018.Rmd) and HTML (docs/compare_different_k_Cusanovich2018.html) files. If you've configured a remote Git repository (see ?wflow_git_remote), click on the hyperlinks in the table below to view the files as they were in that past version.
| File | Version | Author | Date | Message |
|---|---|---|---|---|
| Rmd | 88e1f8d | kevinlkx | 2021-02-25 | added tissue distribution plots with k = 20 |
| html | 51a34ba | kevinlkx | 2021-02-24 | Build site. |
| Rmd | f7a84f5 | kevinlkx | 2021-02-24 | reordered the tissues |
| html | 842c681 | kevinlkx | 2021-02-24 | Build site. |
| Rmd | d9c3e5a | kevinlkx | 2021-02-24 | created structure plots for different k's |
Here we examine and compare the topic modeling results for the scATAC-seq dataset from the mouse single-cell atlas paper Cusanovich et al (2018)
Load the packages used in the analysis below, as well as additional functions that will be used to generate some of the plots.
library(fastTopics)
library(ggplot2)
library(cowplot)
library(Matrix)
library(tools)
library(reshape2)
library(dplyr)
library(RColorBrewer)
source("code/plots.R")
colors
col_13 <- c("#a6cee3","#1f78b4","#b2df8a","#33a02c","#fb9a99","#e31a1c",
            "#fdbf6f","#ff7f00","#cab2d6","#6a3d9a","#ffff99","#b15928",
            "gray")

col_15 <- c("#a6cee3","#1f78b4","#b2df8a","#33a02c","#fb9a99","#e31a1c",
            "#fdbf6f","#ff7f00","#cab2d6","#6a3d9a","#ffff99","gold1",
            "#b15928", "gray", "black")

# from https://stackoverflow.com/questions/9563711/r-color-palettes-for-many-data-classes/41230685#41230685
col_25 <- c(
  "dodgerblue2", "#E31A1C", # red
  "green4",
  "#6A3D9A", # purple
  "#FF7F00", # orange
  "black", "gold1",
  "skyblue2", "#FB9A99", # lt pink
  "palegreen2",
  "#CAB2D6", # lt purple
  "#FDBF6F", # lt orange
  "gray70", "khaki2",
  "maroon", "orchid1", "deeppink1", "blue1", "steelblue4",
  "darkturquoise", "green1", "yellow4", "yellow3",
  "darkorange4", "brown"
)

# from https://stackoverflow.com/questions/15282580/how-to-generate-a-number-of-most-distinctive-colors-in-r
qual_col_pals <- brewer.pal.info[brewer.pal.info$category == 'qual',]
col_74 <- unlist(mapply(brewer.pal, qual_col_pals$maxcolors, rownames(qual_col_pals)))

# colors for tissues as shown in the original paper
colors_tissues <- c("darkblue",    # BoneMarrow
                    "gray30",      # Cerebellum
                    "red",         # Heart
                    "springgreen", # Kidney
                    "brown",       # LargeIntestine
                    "purple",      # Liver
                    "deepskyblue", # Lung
                    "black",       # PreFrontalCortex
                    "darkgreen",   # SmallIntestine
                    "plum",        # Spleen
                    "gold",        # Testes
                    "darkorange",  # Thymus
                    "gray")        # WholeBrain
Load Cusanovich 2018 mouse scATAC-seq data
Load the data and Poisson NMF model fit
Load the data
data.dir <- "/project2/mstephens/kevinluo/scATACseq-topics/data/Cusanovich_2018/processed_data/"
load(file.path(data.dir, "Cusanovich_2018.RData"))
cat(sprintf("%d x %d counts matrix.\n",nrow(counts),ncol(counts)))
rm(counts)
# 81173 x 436206 counts matrix.
About the samples:
The study measured single cell chromatin accessibility for 17 samples spanning 13 different tissues in 8-week old mice.
cat(nrow(samples), "samples (cells). \n")
# 81173 samples (cells).
Tissues:
samples$tissue <- factor(samples$tissue, levels = c("Heart", "Liver", "Thymus",
                                                    "Spleen","Lung",  "Kidney",
                                                    "LargeIntestine", "SmallIntestine", "Testes",
                                                    "BoneMarrow",
                                                    "Cerebellum", "PreFrontalCortex", "WholeBrain"))
cat(length(levels(samples$tissue)), "tissues. \n")
table(samples$tissue)
# 13 tissues.
#
#            Heart            Liver           Thymus           Spleen
#             7650             6167             7617             4020
#             Lung           Kidney   LargeIntestine   SmallIntestine
#             9996             6431             7086             4077
#           Testes       BoneMarrow       Cerebellum PreFrontalCortex
#             2723             8403             2278             5959
#       WholeBrain
#             8766
Cell types labels:
samples$cell_label <- as.factor(samples$cell_label)
cat(length(levels(samples$cell_label)), "cell types \n")
table(samples$cell_label)
# 40 cell types
#
#          Activated B cells       Alveolar macrophages
#                        500                        559
#                 Astrocytes                    B cells
#                       1666                       5772
#             Cardiomyocytes   Cerebellar granule cells
#                       4076                       4099
#            Collecting duct                 Collisions
#                        164                       1218
#                     DCT/CD            Dendritic cells
#                        506                        958
#   Distal convoluted tubule Endothelial I (glomerular)
#                        319                        552
#        Endothelial I cells       Endothelial II cells
#                        952                       3019
#                Enterocytes              Erythroblasts
#                       4783                       2811
#            Ex. neurons CPN          Ex. neurons CThPN
#                       1832                       1540
#           Ex. neurons SCPN  Hematopoietic progenitors
#                       1466                       3425
#                Hepatocytes           Immature B cells
#                       5664                        571
#         Inhibitory neurons              Loop of henle
#                       1828                        815
#                Macrophages                  Microglia
#                        711                        422
#                  Monocytes                   NK cells
#                       1173                        321
#           Oligodendrocytes                  Podocytes
#                       1558                        498
#            Proximal tubule         Proximal tubule S3
#                       2570                        594
#             Purkinje cells         Regulatory T cells
#                        320                        507
#          SOM+ Interneurons                      Sperm
#                        553                       2089
#                    T cells         Type I pneumocytes
#                       8954                       1622
#        Type II pneumocytes                    Unknown
#                        157                      10029
Structure plots using different number of \(k\)
The structure plots below summarize the topic proportions in the samples grouped by different tissues.
\(k = 13\)
fit.dir <- "/project2/mstephens/kevinluo/scATACseq-topics/output/Cusanovich_2018"
fit <- readRDS(file.path(fit.dir, "/fit-Cusanovich2018-scd-ex-k=13.rds"))$fit
fit_multinom <- poisson2multinom(fit)
set.seed(10)
colors_topics <- col_13
idx_selected_samples <- sample(nrow(fit_multinom$L),4000)
p.structure <- structure_plot(select(fit_multinom,loadings = idx_selected_samples),
grouping = samples[idx_selected_samples, "tissue"],
n = Inf,gap = 40, perplexity = 50,
topics = 1:13,colors = colors_topics,
num_threads = 8,verbose = FALSE)
print(p.structure)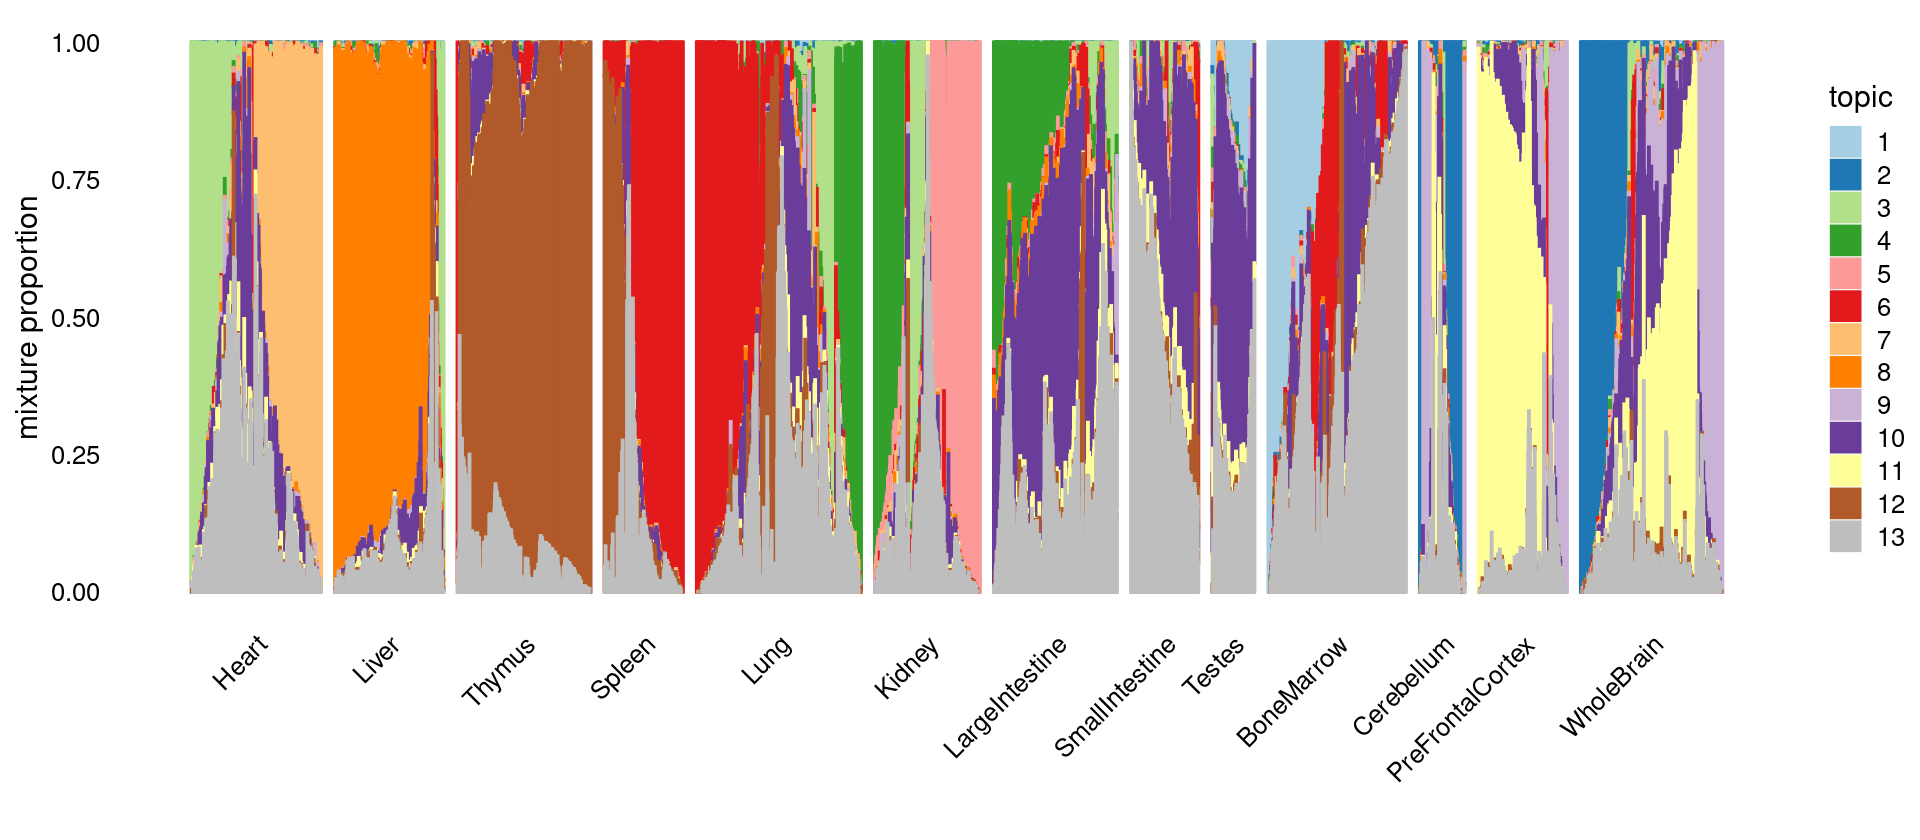
Count the number of tissues has membership > 1% in each topic
topic_proportions <- fit_multinom$L
topic_appearance <- as.matrix((fit_multinom$L > 0.01) + 0)
samples_topics <- samples[,c("cell", "tissue", "cell_label")]
samples_topics <- cbind(samples_topics, topic_appearance)
samples_topics$num_topics <- rowSums(topic_appearance)

freq_table_tissue_in_topic <- matrix(0, nrow = length(levels(samples_topics$tissue)), ncol = ncol(topic_appearance))
rownames(freq_table_tissue_in_topic) <- levels(samples_topics$tissue)
colnames(freq_table_tissue_in_topic) <- colnames(topic_appearance)

for ( k in 1:ncol(topic_appearance)) {
  freq_table_tissue_in_topic[,k] <- table(samples_topics[samples_topics[,paste0("k",k)] == 1, "tissue"])
}
print(freq_table_tissue_in_topic)
#                    k1   k2   k3   k4   k5   k6   k7   k8   k9  k10  k11  k12
# Heart            3189 2241 4936 2477 1483 2095 5960 1581 3092 5728 4526 1918
# Liver            2425  949 1635 1891 1430 1110 1437 5900 1708 3700 1605  999
# Thymus           2138  398  916  954  308 3062  617  352 1138 3283 1349 7542
# Spleen           1162   72  306  320  174 3956  154  239  183 1334  284 2571
# Lung             5148 1802 5619 4624 1118 7180 3634 2894 2819 4750 3804 4308
# Kidney           1607 1090 2345 3524 5541 1457 1549 1095 1993 2352 1394 1153
# LargeIntestine   2307 1643 2751 5941 2908 2265 2385 5252 1902 7026 4237 2265
# SmallIntestine   1176 1263 2944 1677 1850 1758 2184 2050 1519 3825 3742 1493
# Testes           2359 1634  676  901  766  379 1321  590 2092 2698 2318  644
# BoneMarrow       6425 1149 2125 1160  823 5635 1967 1200 1522 5115 1578 3282
# Cerebellum        586 1875  923  750  524  288  859  441 1401 1090 1126  526
# PreFrontalCortex 2262 3170 2331 1691  605 1018 1869  633 4002 3973 5036 1451
# WholeBrain       3244 6643 3313 2605 1856 1579 4108 1700 5938 6177 5947 2316
#                   k13
# Heart            6613
# Liver            4759
# Thymus           5977
# Spleen           2429
# Lung             7772
# Kidney           4587
# LargeIntestine   6894
# SmallIntestine   4055
# Testes           2478
# BoneMarrow       7791
# Cerebellum       1530
# PreFrontalCortex 3523
# WholeBrain       5914
\(k = 15\)
k <- 15
fit.dir <- "/project2/mstephens/kevinluo/scATACseq-topics/output/Cusanovich_2018"
fit <- readRDS(sprintf("%s/fit-Cusanovich2018-scd-ex-k=%d.rds", fit.dir, k))$fit
fit_multinom <- poisson2multinom(fit)
set.seed(10)
colors_topics <- col_15
idx_selected_samples <- sample(nrow(fit_multinom$L),4000)
p.structure <- structure_plot(select(fit_multinom,loadings = idx_selected_samples),
grouping = samples[idx_selected_samples, "tissue"],
n = Inf,gap = 40, perplexity = 50,
topics = 1:k,colors = colors_topics,
num_threads = 8,verbose = FALSE)
print(p.structure)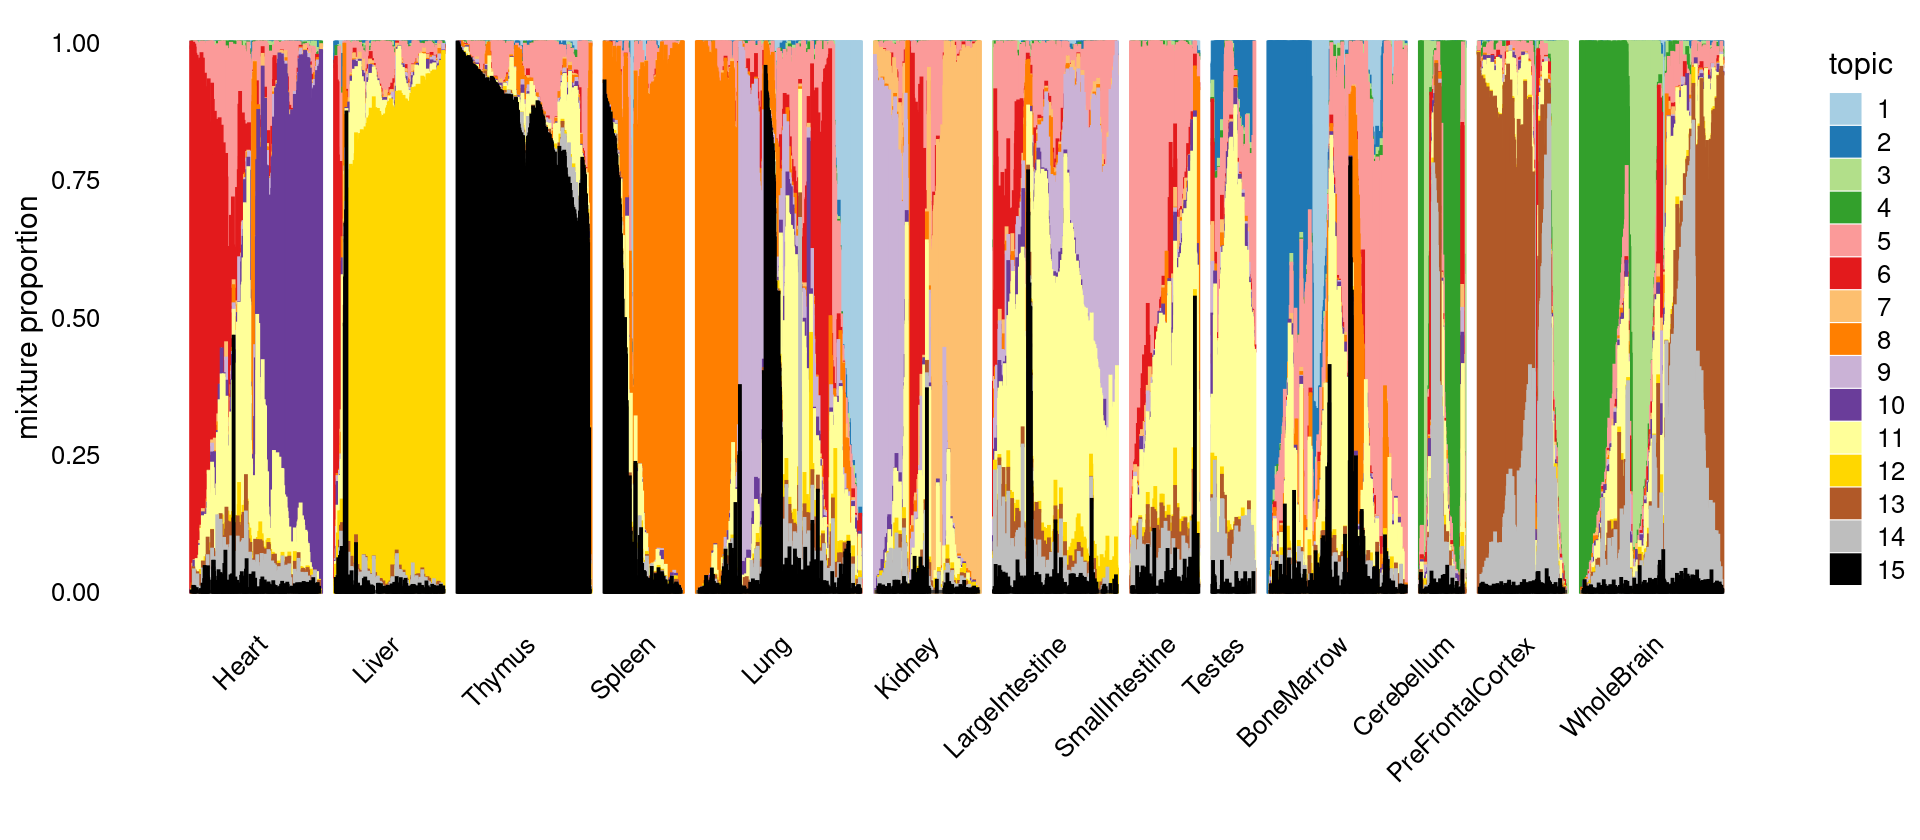
\(k = 20\)
k <- 20
fit.dir <- "/project2/mstephens/kevinluo/scATACseq-topics/output/Cusanovich_2018"
fit <- readRDS(sprintf("%s/fit-Cusanovich2018-scd-ex-k=%d.rds", fit.dir, k))$fit
fit_multinom <- poisson2multinom(fit)
set.seed(10)
colors_topics <- col_25[1:k]
idx_selected_samples <- sample(nrow(fit_multinom$L),4000)
p.structure <- structure_plot(select(fit_multinom,loadings = idx_selected_samples),
grouping = samples[idx_selected_samples, "tissue"],
n = Inf,gap = 40, perplexity = 50,
topics = 1:k,colors = colors_topics,
num_threads = 8,verbose = FALSE)
print(p.structure)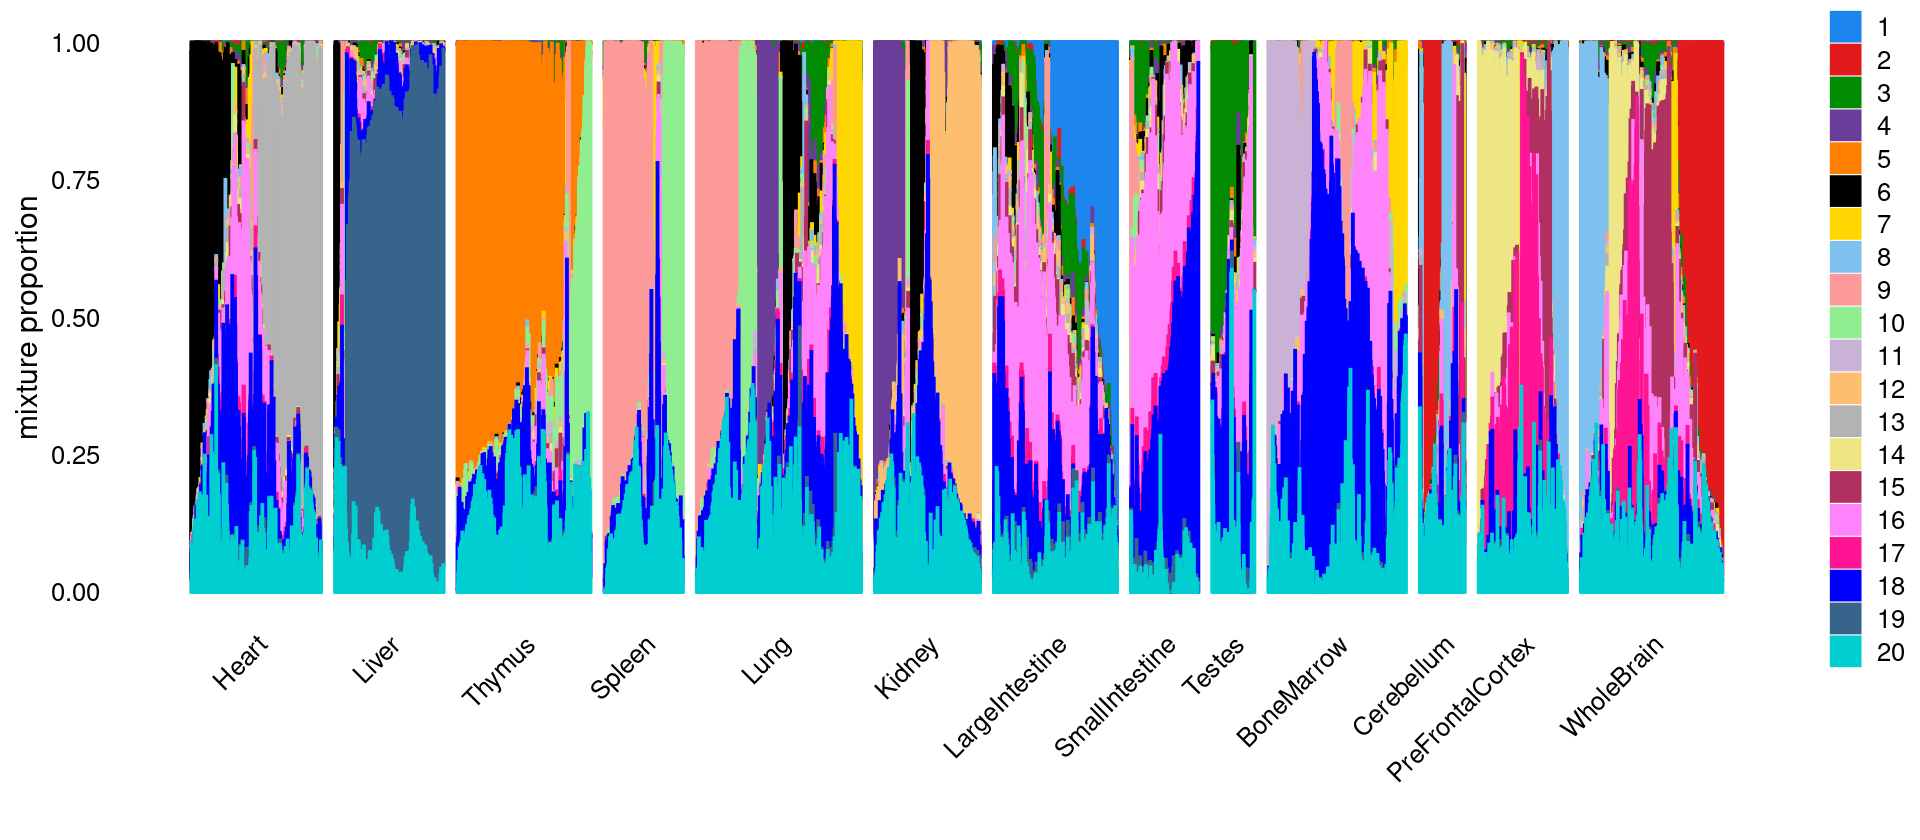
Count the number of tissues has membership > 5% in each topic
topic_proportions <- fit_multinom$L
topic_appearance <- as.matrix((fit_multinom$L > 0.05) + 0)
samples_topics <- samples[,c("cell", "tissue", "cell_label")]
samples_topics <- cbind(samples_topics, topic_appearance)
samples_topics$count_topics <- rowSums(topic_appearance)

freq_table_tissue_in_topic <- matrix(0, nrow = length(levels(samples_topics$tissue)), ncol = ncol(topic_appearance))
rownames(freq_table_tissue_in_topic) <- levels(samples_topics$tissue)
colnames(freq_table_tissue_in_topic) <- colnames(topic_appearance)

for ( k in 1:ncol(topic_appearance)) {
  freq_table_tissue_in_topic[,k] <- table(samples_topics[samples_topics[,paste0("k",k)] == 1, "tissue"])
}
print(freq_table_tissue_in_topic)
#                    k1   k2   k3   k4   k5   k6   k7   k8   k9  k10  k11  k12
# Heart              46    9 2334   89   13 3456  358   71  133  102    9   18
# Liver              11    1  854   25   11  517  347    8   62  175   25    8
# Thymus              5    0 1415   19 7309   21  205    1  173 3220   10    1
# Spleen              0    0  578    4  276   14  549    2 2858 1274   82    1
# Lung              272    9 2515 2692  248 2501 2040   25 3127 1495   64    3
# Kidney            119    0  927 2228    7 1507  152   22   85  149    4 4043
# LargeIntestine   4952   12 4545  233   47 1692  143  146  332  281    6   39
# SmallIntestine    309    7 2167   93   39 1699   94  110  356  275   10   45
# Testes              3    0 2694   49    1   69    5   16    1    4   12    9
# BoneMarrow          2    0 2229    3  416   86 3851   10 1317  717 3217    1
# Cerebellum         15 1390  229   94    2  182   39  662   13    9    0    8
# PreFrontalCortex    8  356  714   77    5  213  276 1661   64   10    0    5
# WholeBrain         25 4026 2932  191    4  401  289 2523   40   14    4    5
#                   k13  k14  k15  k16  k17  k18  k19  k20
# Heart            4305  103  436 3640  355 4831   22 4845
# Liver              10    3   23  545   15 1992 5658 3470
# Thymus              5    2  167  510    6 3484    1 6568
# Spleen              1    0   10  150   10 1252    1 3190
# Lung              102   56  278 2743  262 5657  138 7809
# Kidney             29    3  156  752   32 3164   30 4374
# LargeIntestine    258  163  765 5861  644 5012   81 2934
# SmallIntestine     67  116  532 3911  942 3916   95  603
# Testes             50   20  316 1816  240 2441   42 1646
# BoneMarrow          3    9   85 4310   26 7185    4 3499
# Cerebellum         36   56  644  594  134  621    4 1604
# PreFrontalCortex   36 3466 2731 1335 3740  920    5 3566
# WholeBrain        104 1524 3232 3594 2268 1694   11 5429
Plot the distribution of tissues in each topic
freq_table_tissue_in_topic.df <- melt(freq_table_tissue_in_topic)
colnames(freq_table_tissue_in_topic.df) <- c("tissue", "topic", "freq")

# stacked barplot for the counts of tissues by clusters
p.barplot <- ggplot(freq_table_tissue_in_topic.df, aes(fill=tissue, y=freq, x=topic)) +
  geom_bar(position="fill", stat="identity") +
  theme_classic() + xlab("Topic") + ylab("Proportion of cells") +
  scale_fill_manual(values = colors_tissues) +
  guides(fill=guide_legend(ncol=2)) +
  theme(
    legend.title = element_text(size = 10),
    legend.text = element_text(size = 8)
  )
print(p.barplot)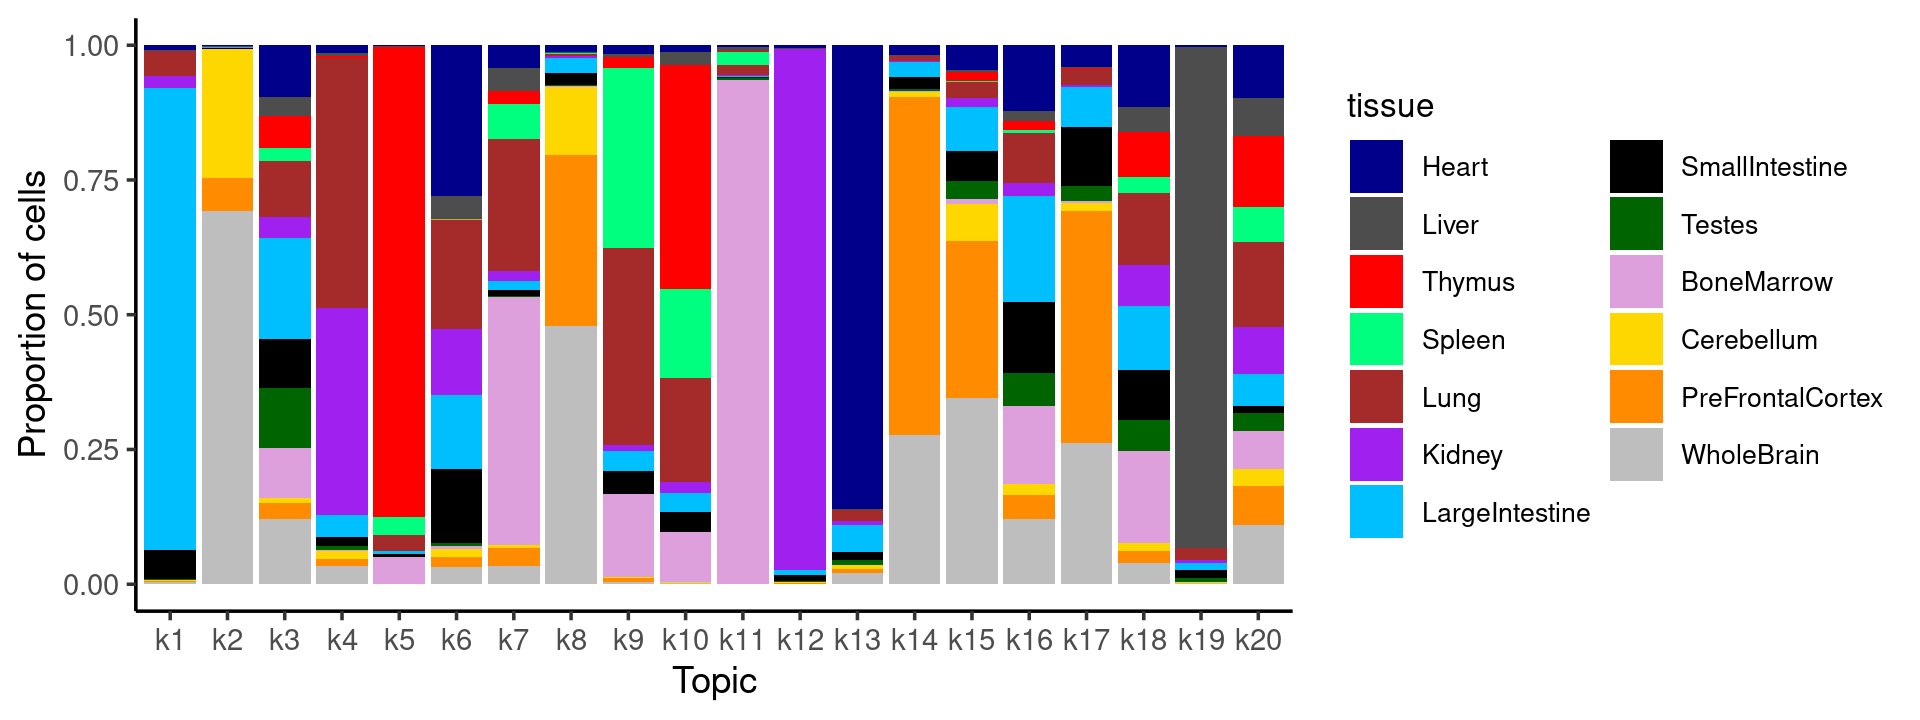
Simple heatmap of the proportions by hierarchical clustering
create_simple_heatmap(freq_table_tissue_in_topic, normalize_by = "row", title = "proportions normalized by rows (each row sums to 1)", cluster_rows = TRUE)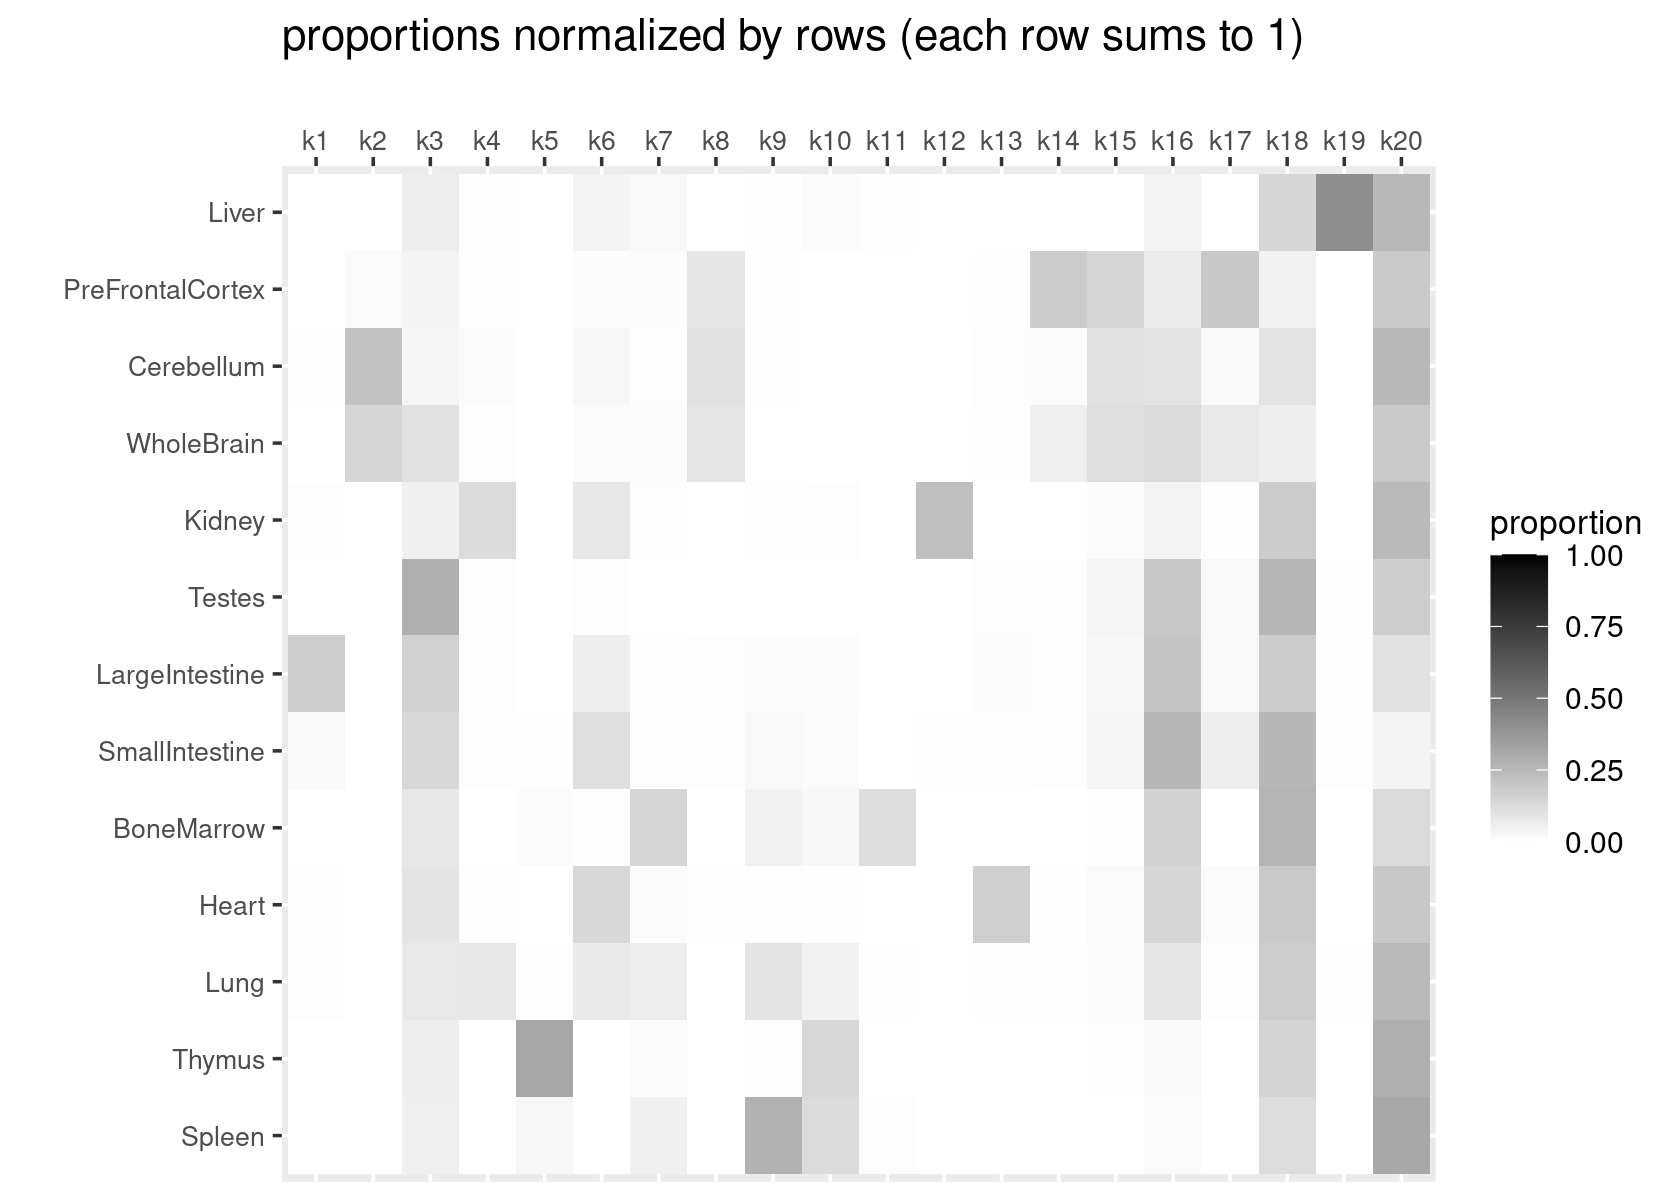
create_simple_heatmap(freq_table_tissue_in_topic, normalize_by = "column", title = "proportions normalized by columns (each column sums to 1)", cluster_rows = TRUE)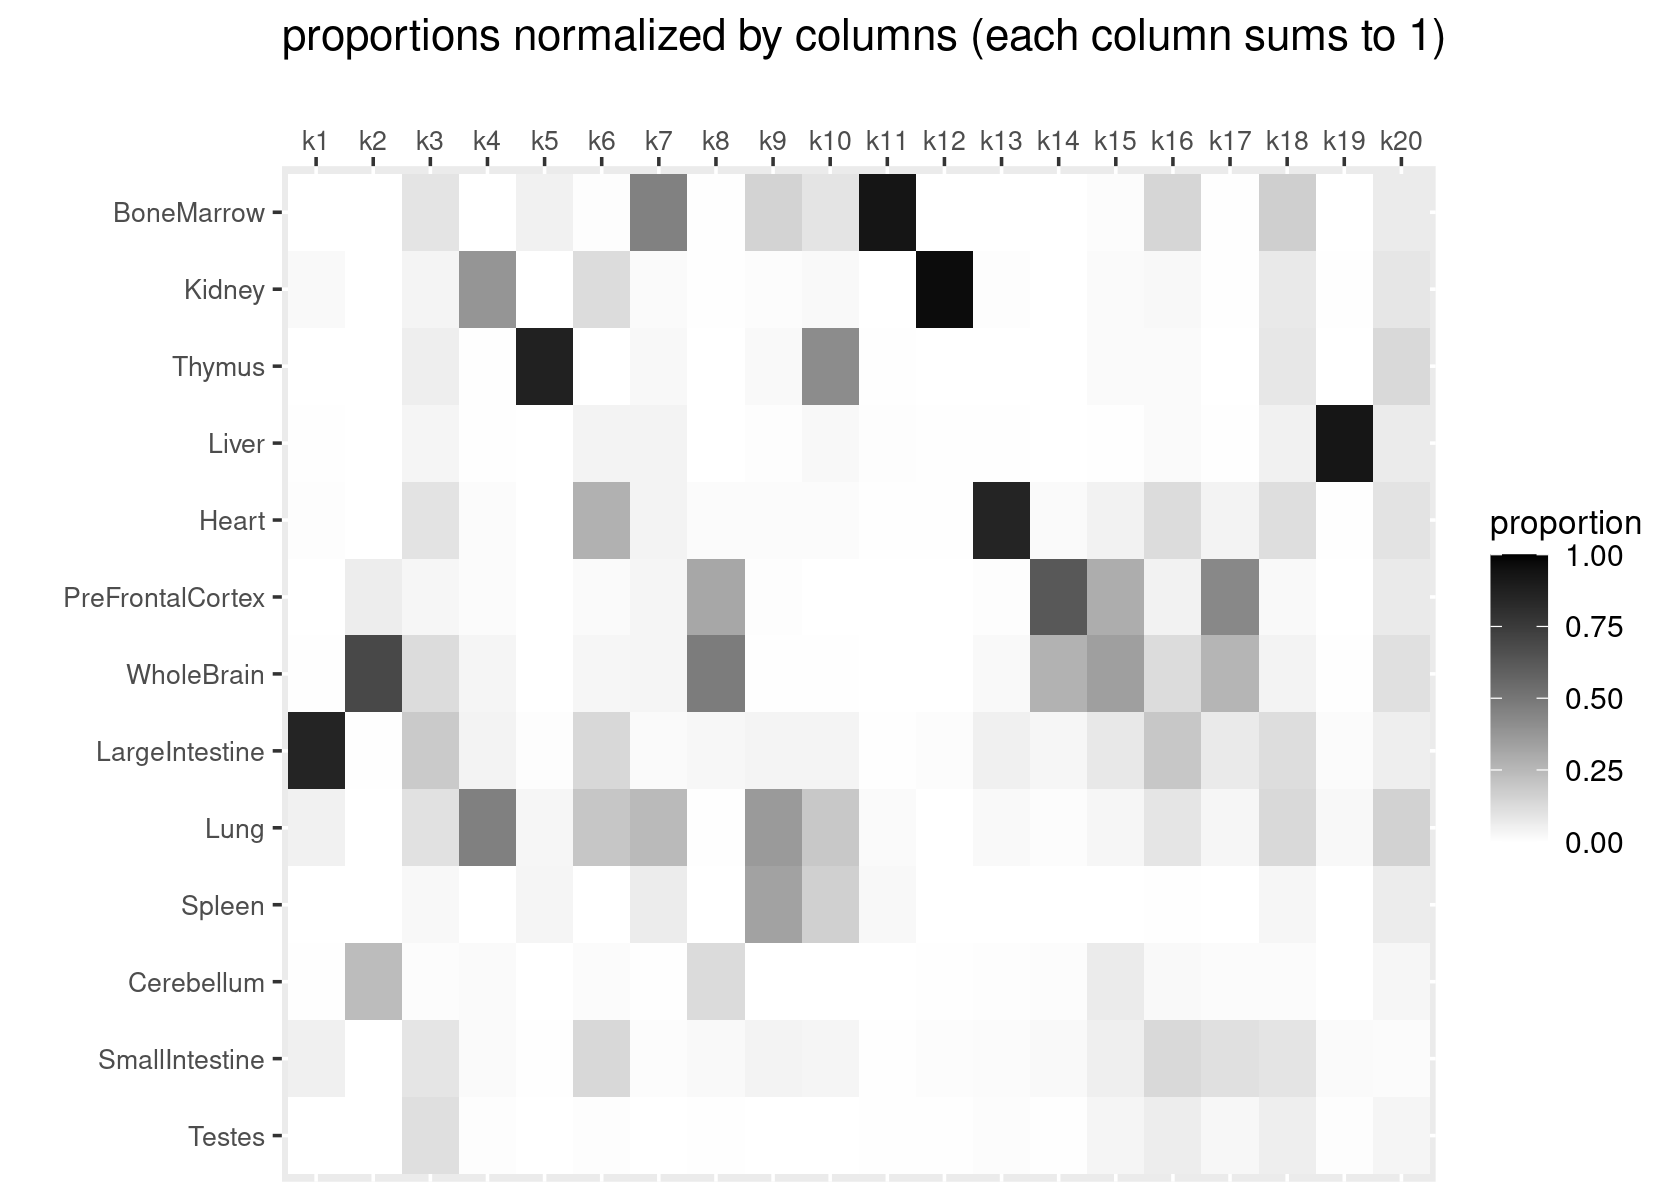
Cells with membership > 5% in topic k20
# Cells with membership > 5% in topic k20
data <- as.data.frame(table(samples_topics[samples_topics$k20 == 1, "cell_label"]))
colnames(data) <- c("cell_label", "count")
data <- data[order(data$count, decreasing = T), ]
data$cell_label <- factor(data$cell_label, levels = unique(data$cell_label))

# piechart
p_pie <- ggplot(data, aes(x="", y=count, fill=cell_label)) +
  geom_bar(stat="identity", width=1, color="white") +
  scale_fill_manual(values = col_74) +
  coord_polar("y", start=0) +
  ggtitle("Topic k20") +
  theme_void() # remove background, grid, numeric labels
print(p_pie)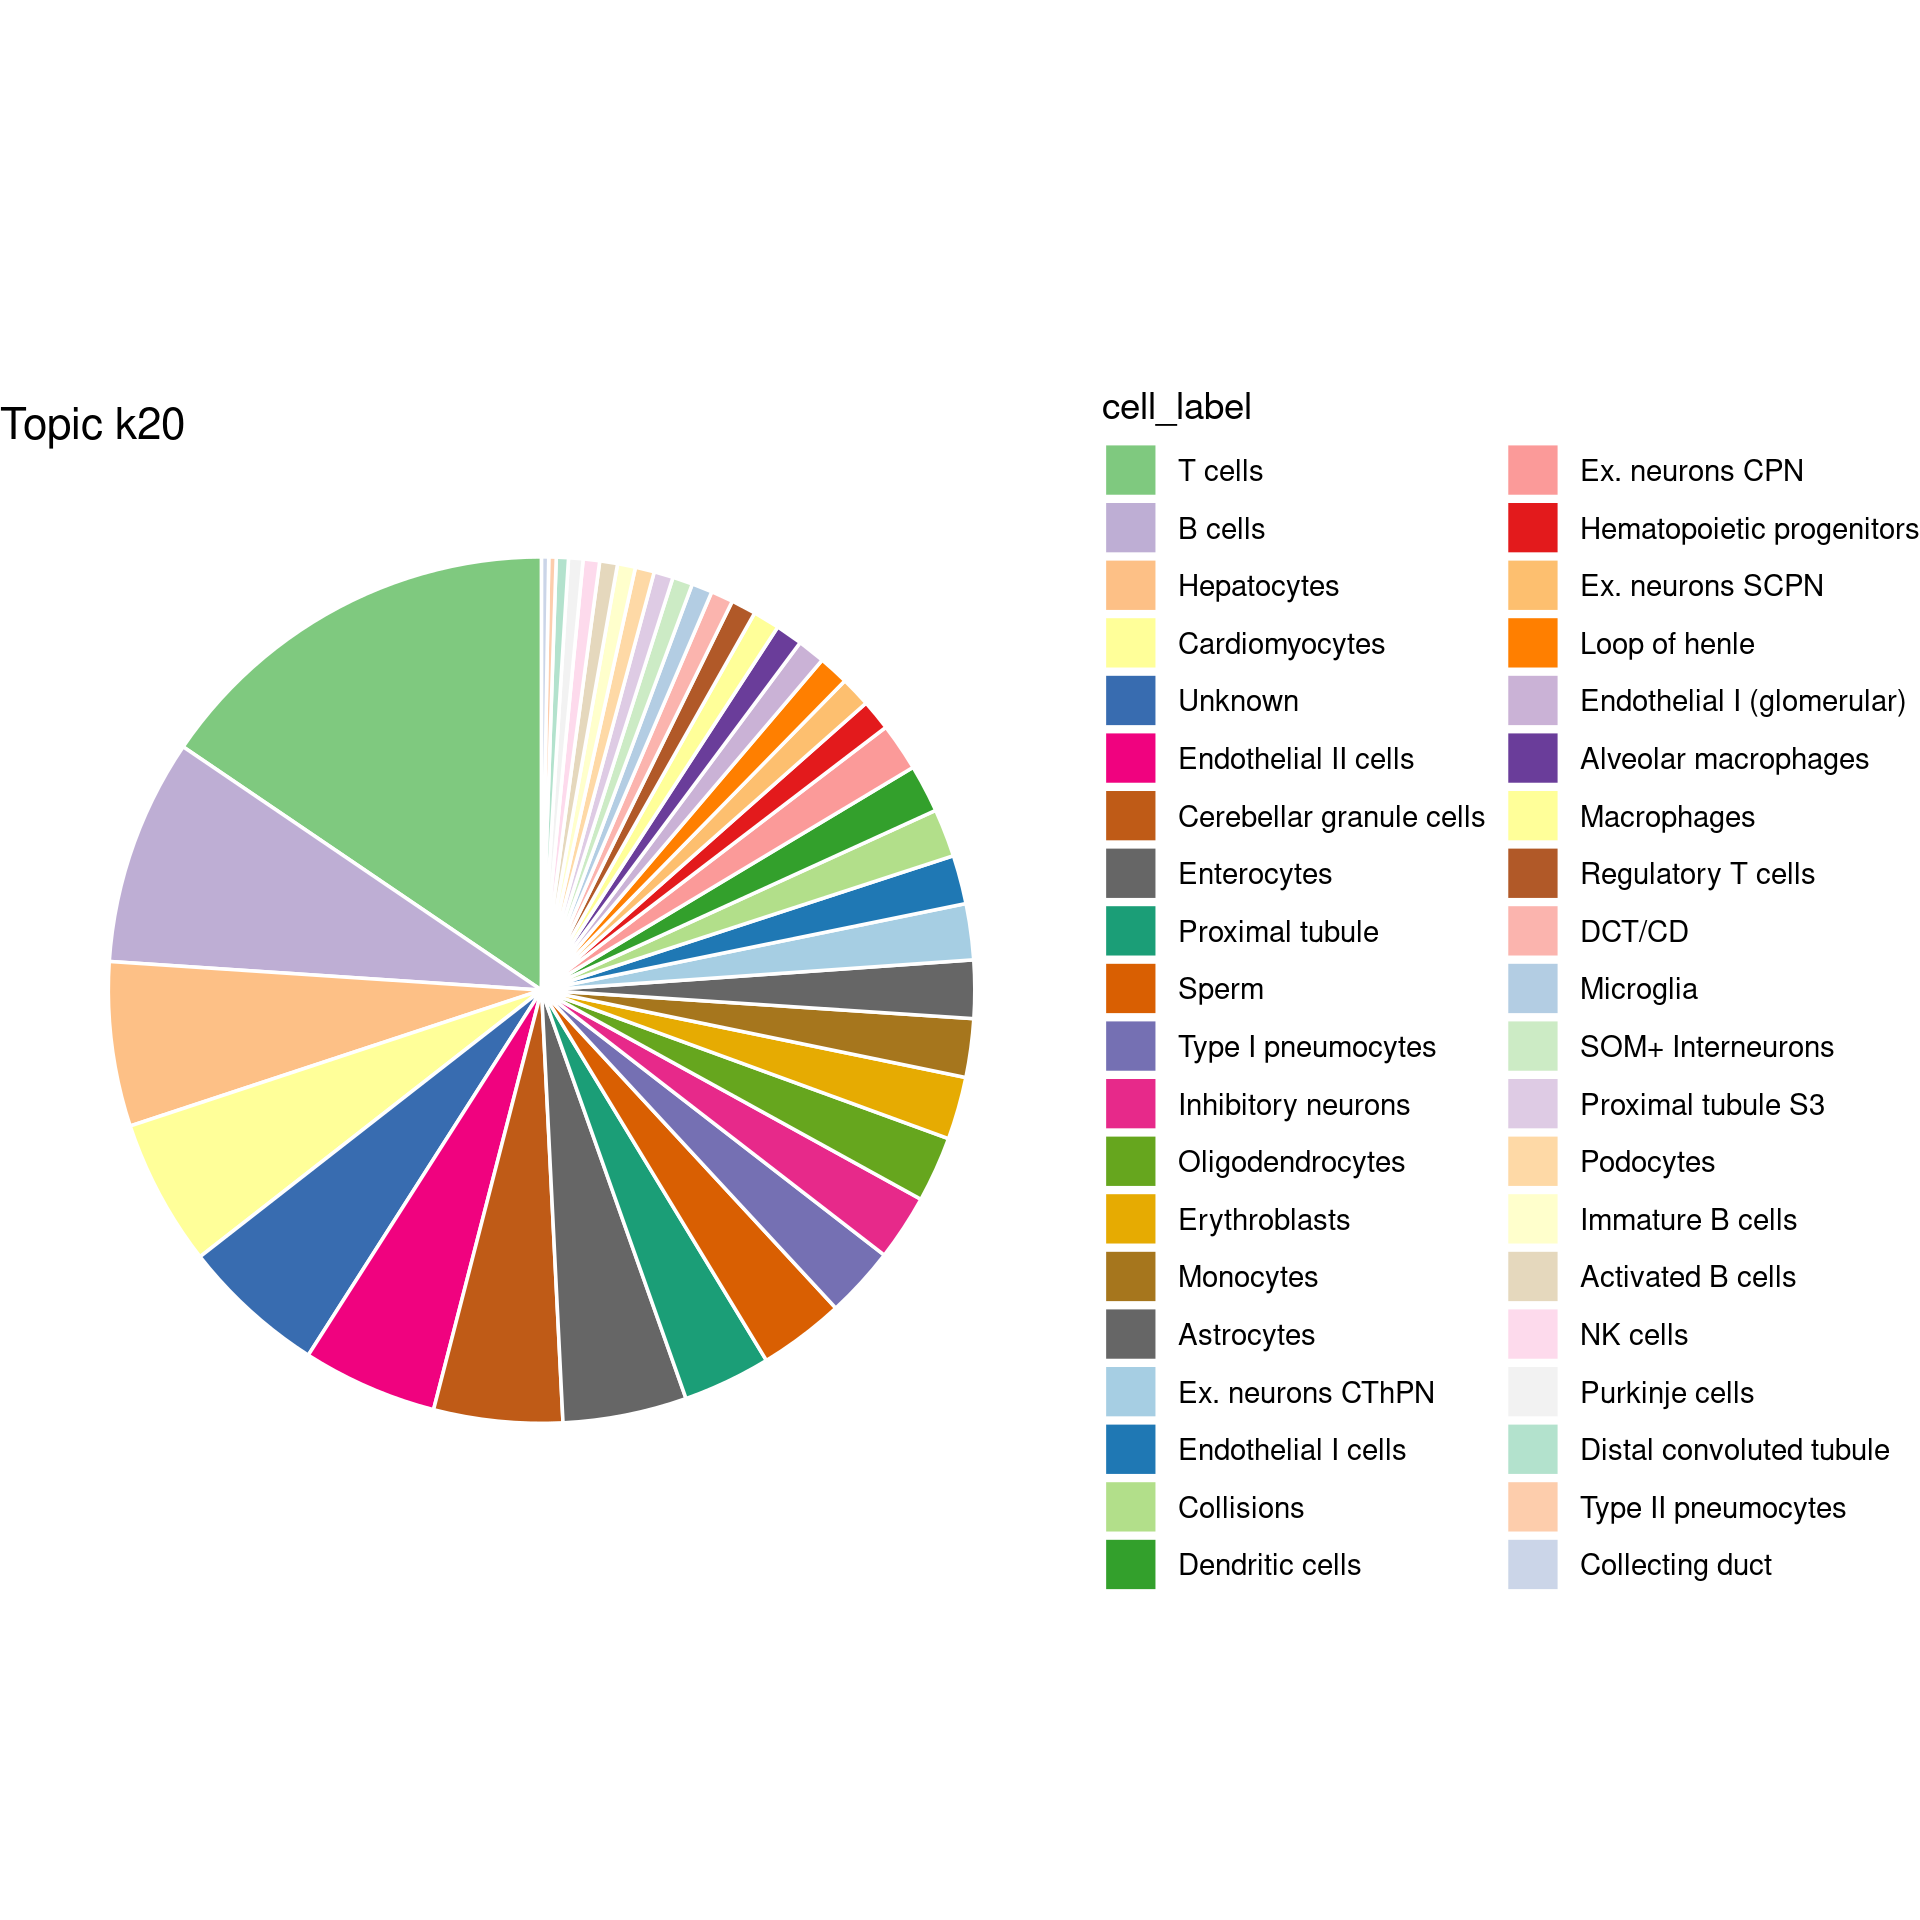
Structure plot for Cerebellum, PreFrontalCortex, WholeBrain
set.seed(10)

colors_topics <- col_25[1:20]
idx_selected_samples <- which(samples$tissue %in% c("Cerebellum", "PreFrontalCortex", "WholeBrain"))

fit_tissue <- select(fit_multinom,loadings = idx_selected_samples)
grouping_tissue <- as.factor(as.character(samples[idx_selected_samples, "tissue"]))
topic_appearance <- as.matrix((fit_tissue$L > 0.05) + 0)

cat("Number of cells appear in each topic:\n")
colSums(topic_appearance)

p.structure <- structure_plot(fit_tissue,
                              grouping = grouping_tissue,
                              n = min(3000, length(idx_selected_samples)),
                              gap = 40, perplexity = 50,
                              topics = 1:k,
                              colors = colors_topics,
                              num_threads = 8,verbose = FALSE)

print(p.structure)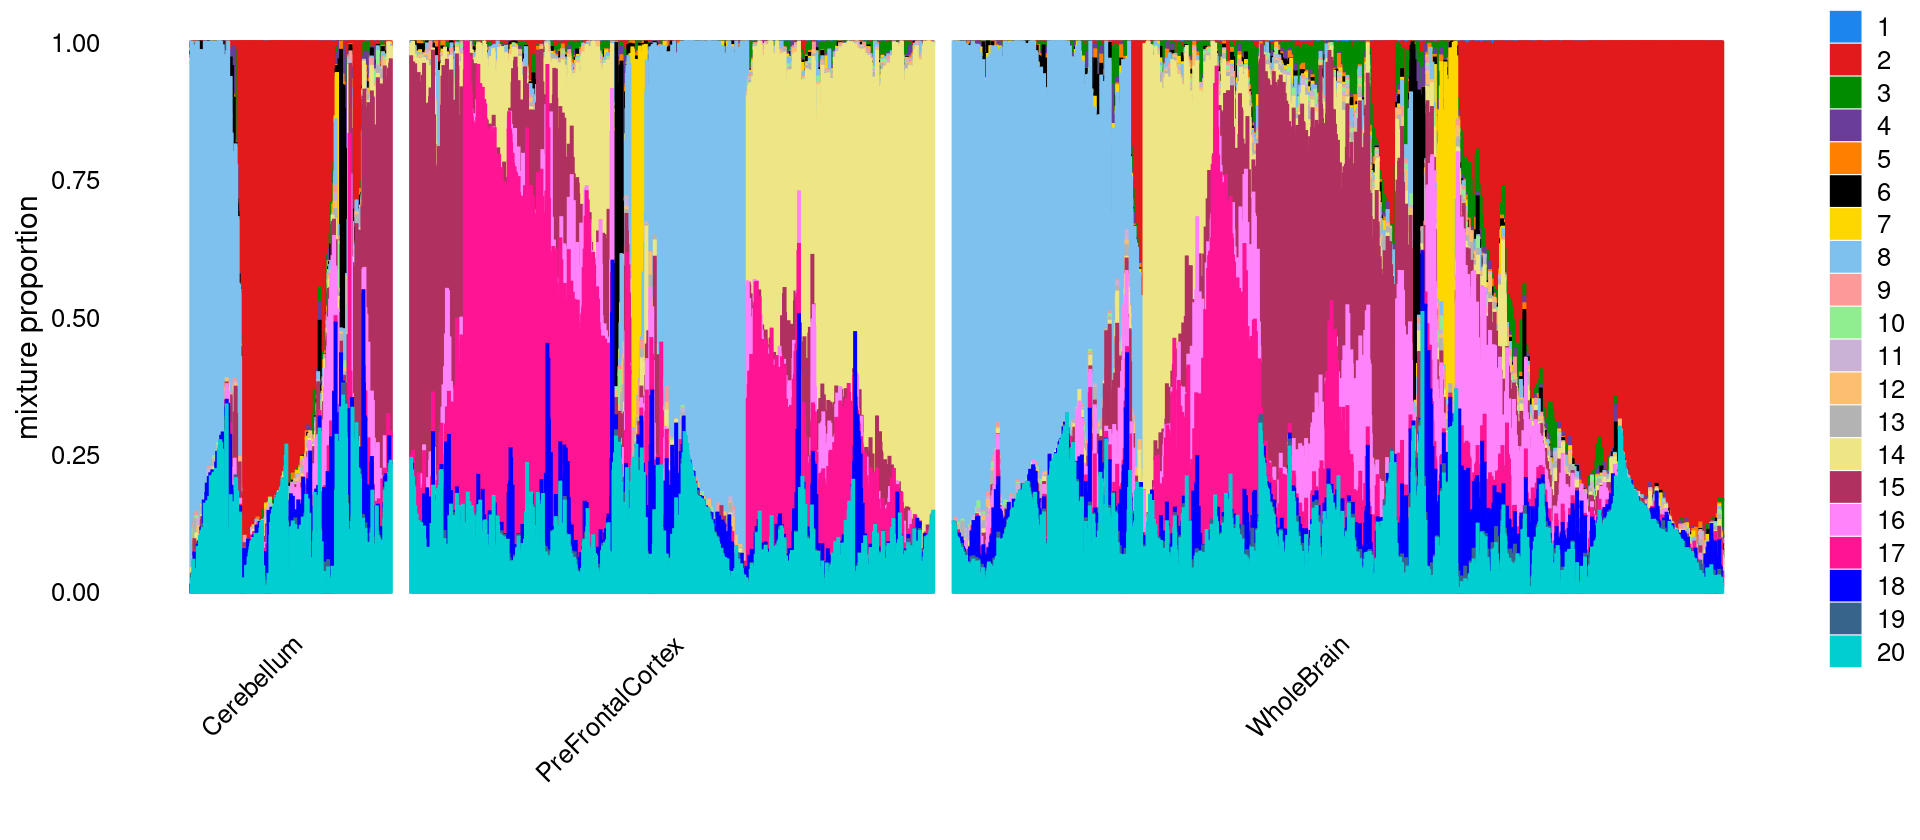
# Number of cells appear in each topic:
#    k1    k2    k3    k4    k5    k6    k7    k8    k9   k10   k11   k12   k13
#    48  5772  3875   362    11   796   604  4846   117    33     4    18   176
#   k14   k15   k16   k17   k18   k19   k20
#  5046  6607  5523  6142  3235    20 10599
Structure plot for Heart, Lung, Kidney, Spleen
set.seed(10)

colors_topics <- col_25[1:20]
idx_selected_samples <- which(samples$tissue %in% c("Heart", "Lung", "Kidney", "Spleen"))
fit_tissue <- select(fit_multinom,loadings = idx_selected_samples)
grouping_tissue <- as.factor(as.character(samples[idx_selected_samples, "tissue"]))
topic_appearance <- as.matrix((fit_tissue$L > 0.05) + 0)
cat("Number of cells appear in each topic:\n")
colSums(topic_appearance)

p.structure <- structure_plot(fit_tissue,
                              grouping = grouping_tissue,
                              n = min(3000, length(idx_selected_samples)),
                              gap = 40, perplexity = 50,
                              topics = 1:k,
                              colors = colors_topics,
                              num_threads = 8,verbose = FALSE)

print(p.structure)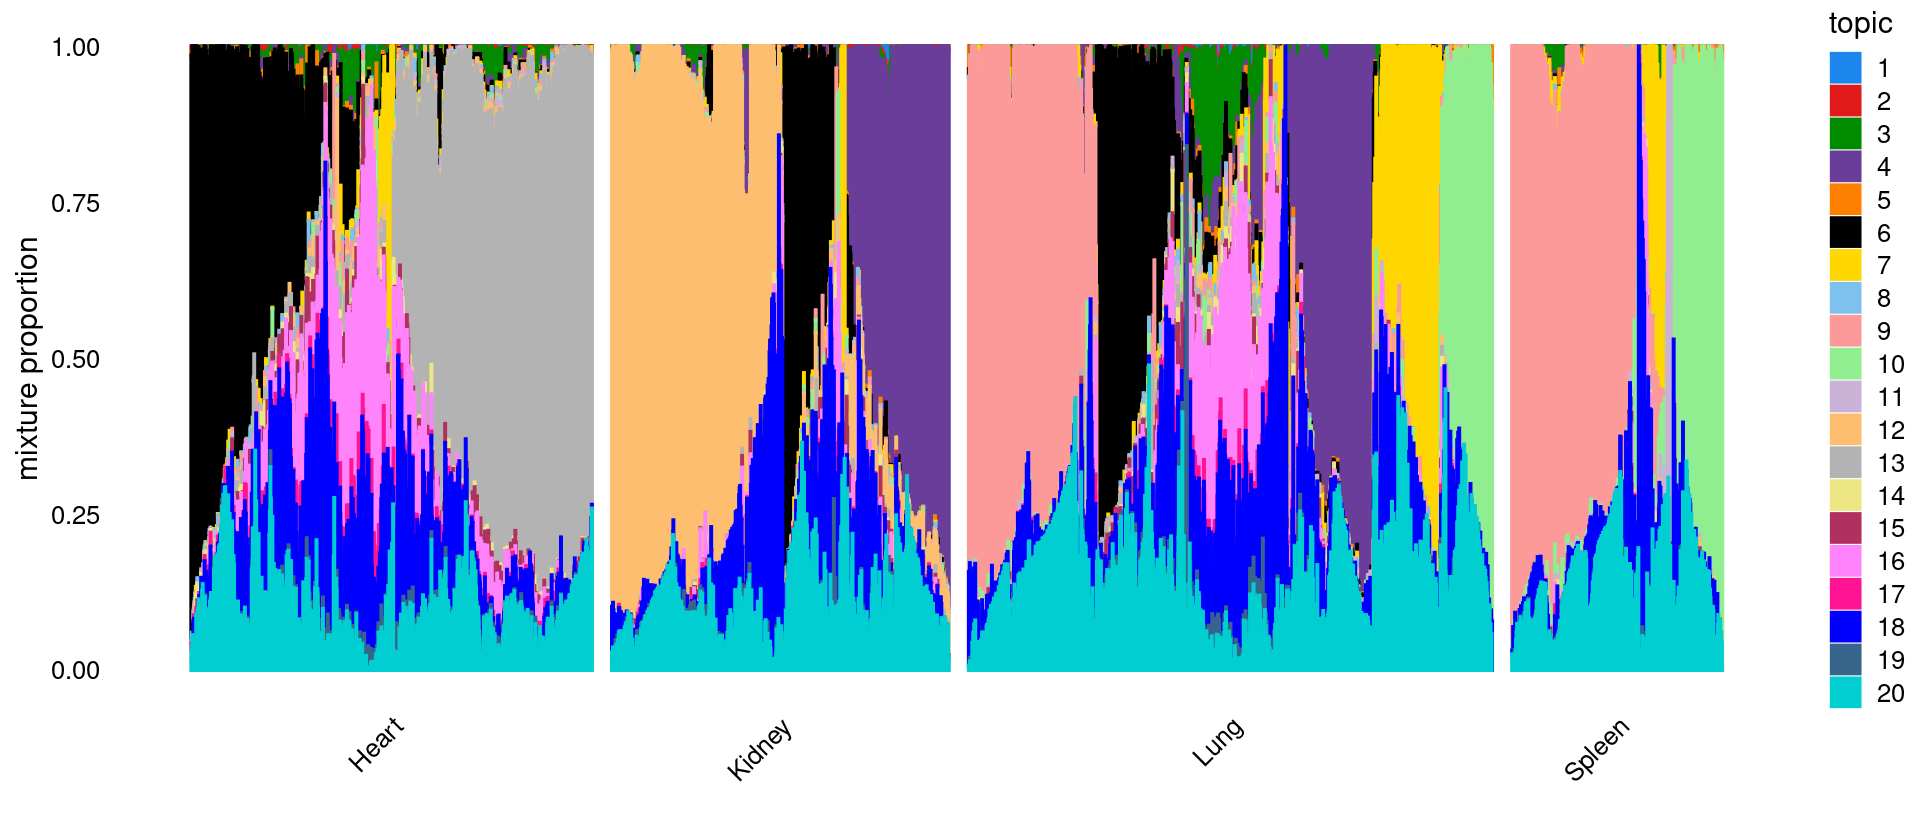
# Number of cells appear in each topic:
#    k1    k2    k3    k4    k5    k6    k7    k8    k9   k10   k11   k12   k13
#   437    18  6354  5013   544  7478  3099   120  6203  3020   159  4065  4437
#   k14   k15   k16   k17   k18   k19   k20
#   162   880  7285   659 14904   191 20218
Structure plot for Heart only
set.seed(10)

colors_topics <- col_25[1:20]
idx_selected_samples <- which(samples$tissue %in% "Heart")
fit_tissue <- select(fit_multinom,loadings = idx_selected_samples)
grouping_tissue <- as.factor(as.character(samples[idx_selected_samples, "tissue"]))
topic_appearance <- as.matrix((fit_tissue$L > 0.05) + 0)
cat("Number of cells appear in each topic:\n")
colSums(topic_appearance)

p.structure <- structure_plot(fit_tissue,
                              grouping = grouping_tissue,
                              n = min(3000, length(idx_selected_samples)),
                              gap = 40, perplexity = 50,
                              topics = 1:k,
                              colors = colors_topics,
                              num_threads = 8,verbose = FALSE)

print(p.structure)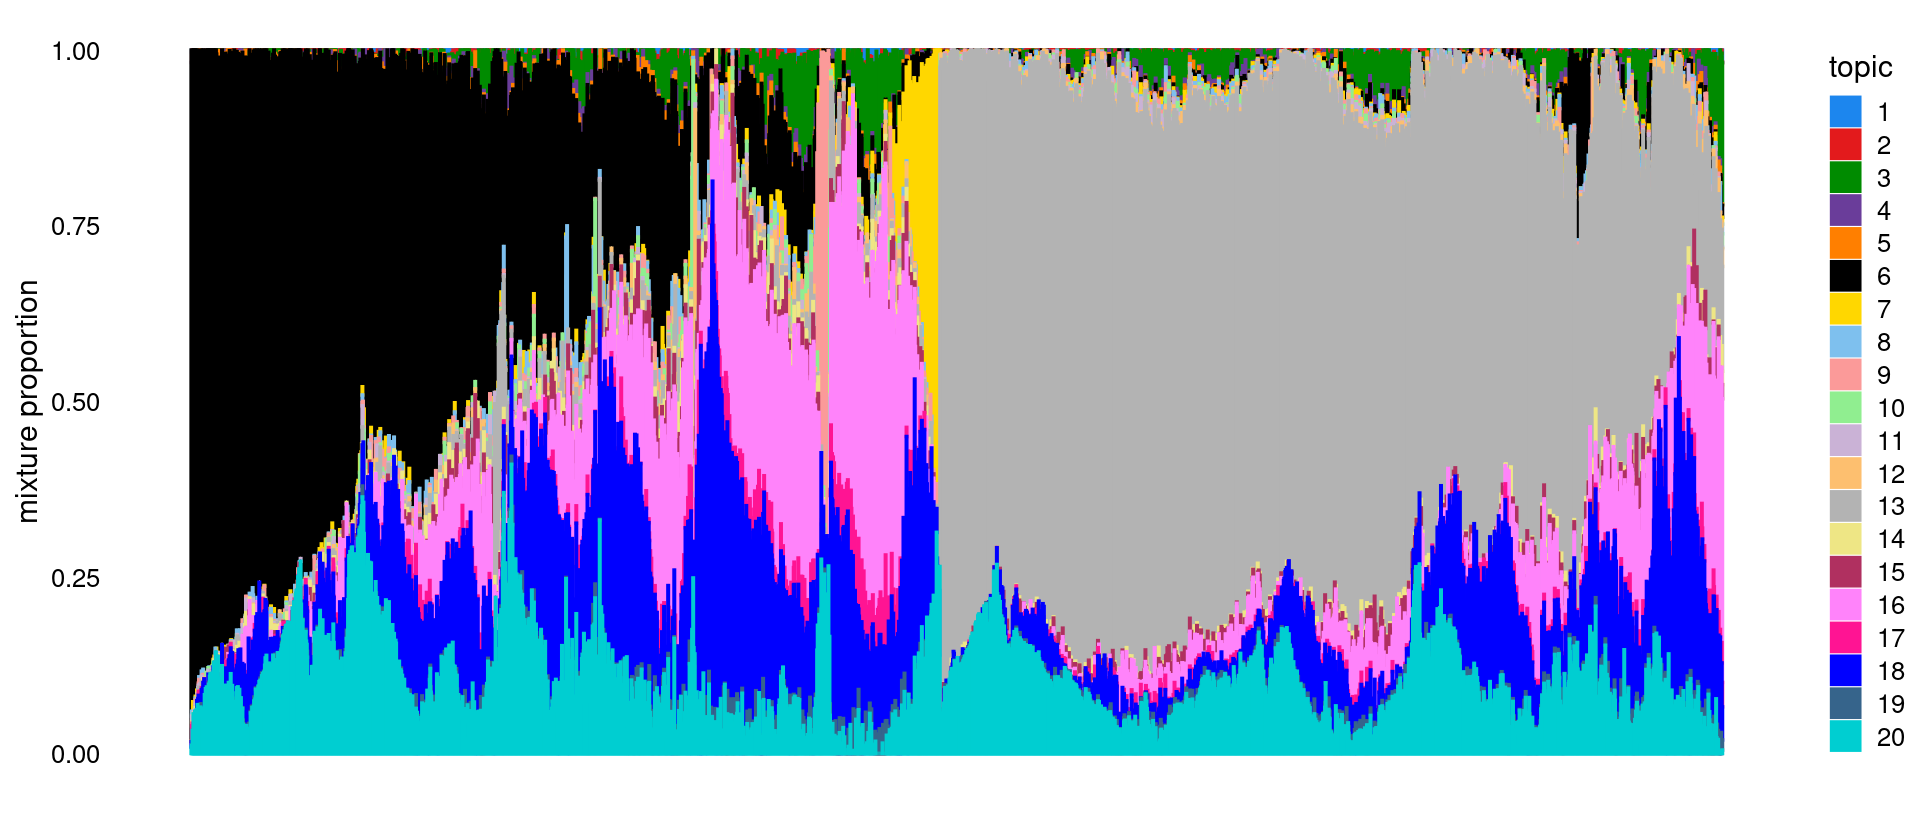
# Number of cells appear in each topic:
#   k1   k2   k3   k4   k5   k6   k7   k8   k9  k10  k11  k12  k13  k14  k15  k16
#   46    9 2334   89   13 3456  358   71  133  102    9   18 4305  103  436 3640
#  k17  k18  k19  k20
#  355 4831   22 4845
\(k = 30\)
k <- 30
fit.dir <- "/project2/mstephens/kevinluo/scATACseq-topics/output/Cusanovich_2018"
fit <- readRDS(sprintf("%s/fit-Cusanovich2018-scd-ex-k=%d.rds", fit.dir, k))$fit
fit_multinom <- poisson2multinom(fit)
set.seed(10)
colors_topics <- sample(col_74, k)
idx_selected_samples <- sample(nrow(fit$L),4000)
p.structure <- structure_plot(select(fit_multinom,loadings = idx_selected_samples),
grouping = samples[idx_selected_samples, "tissue"],
n = Inf,gap = 40, perplexity = 50,
topics = 1:k,colors = colors_topics,
num_threads = 8,verbose = FALSE)
print(p.structure)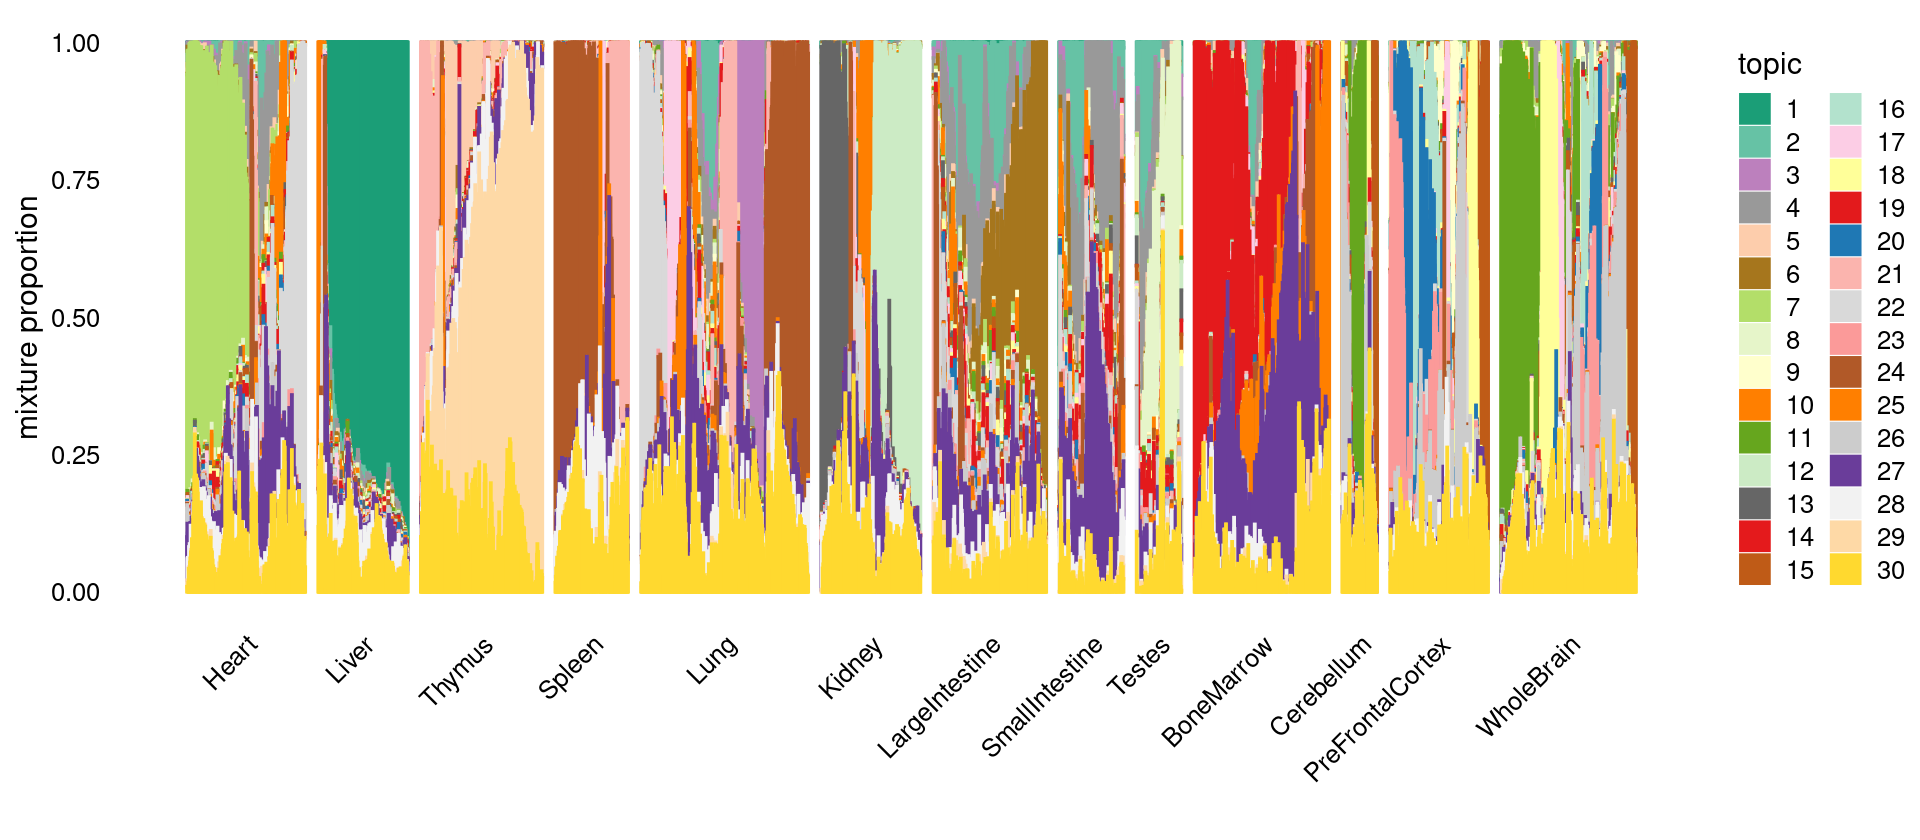
\(k = 35\)
k <- 35
fit.dir <- "/project2/mstephens/kevinluo/scATACseq-topics/output/Cusanovich_2018"
fit <- readRDS(sprintf("%s/fit-Cusanovich2018-scd-ex-k=%d.rds", fit.dir, k))$fit
fit_multinom <- poisson2multinom(fit)
set.seed(10)
colors_topics <- sample(col_74, k)
idx_selected_samples <- sample(nrow(fit$L),4000)
p.structure <- structure_plot(select(fit_multinom,loadings = idx_selected_samples),
grouping = samples[idx_selected_samples, "tissue"],
n = Inf,gap = 40, perplexity = 50,
topics = 1:k,colors = colors_topics,
num_threads = 8,verbose = FALSE)
print(p.structure)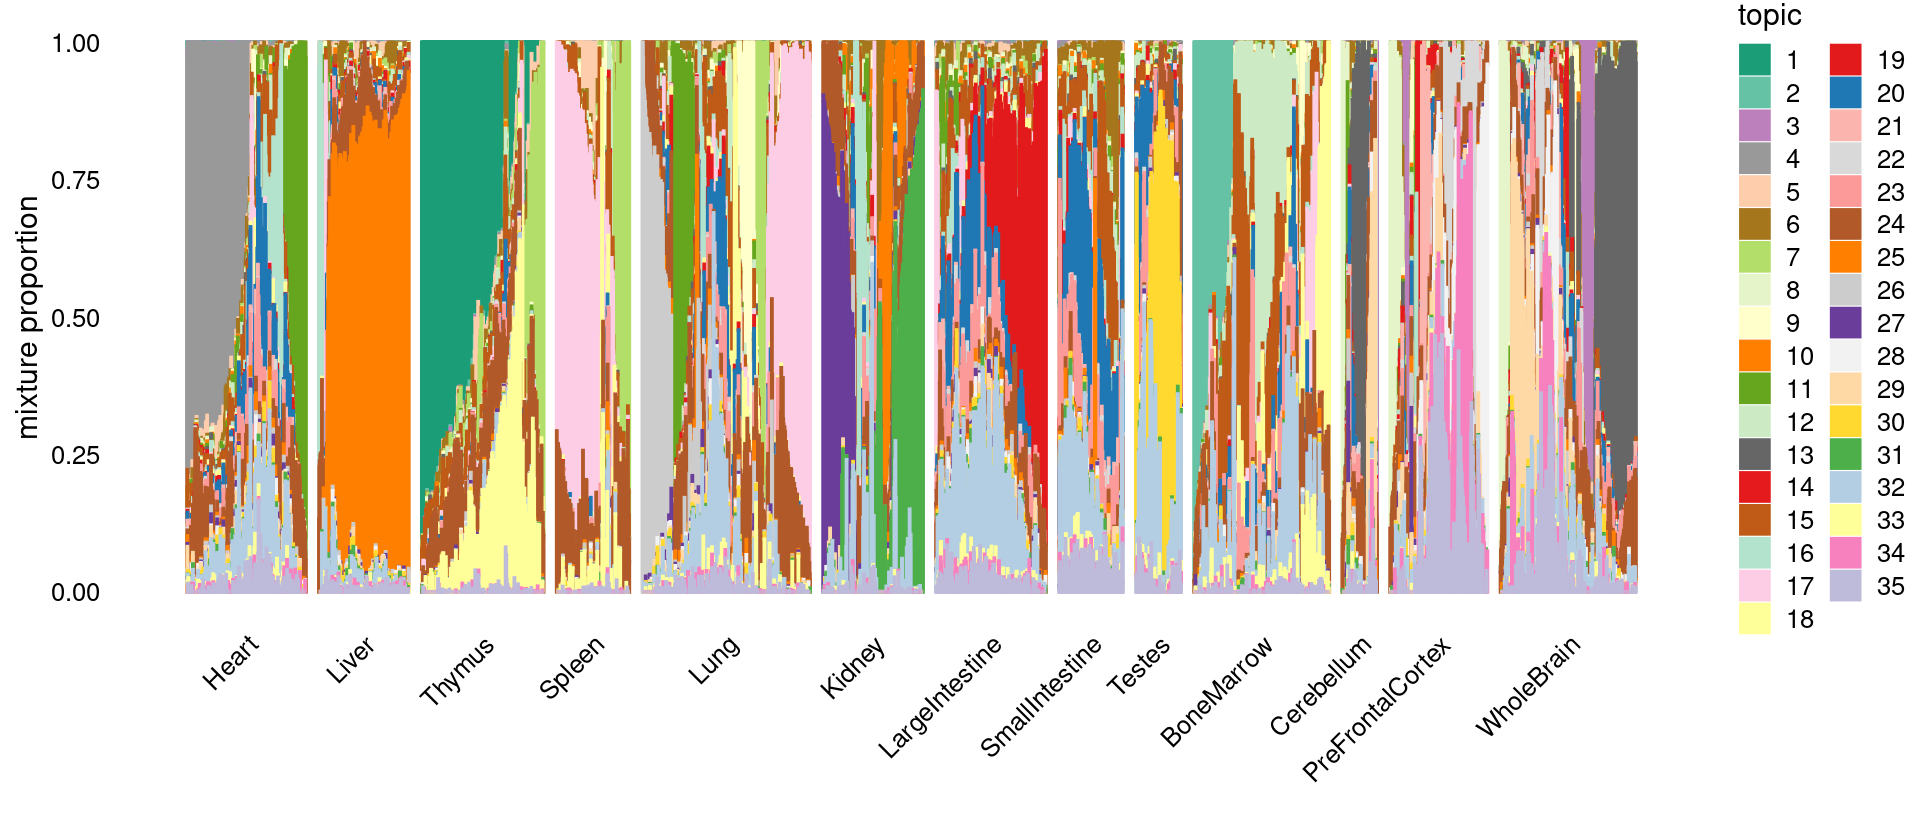
sessionInfo()
# R version 3.6.1 (2019-07-05)
# Platform: x86_64-pc-linux-gnu (64-bit)
# Running under: Scientific Linux 7.4 (Nitrogen)
#
# Matrix products: default
# BLAS/LAPACK: /software/openblas-0.2.19-el7-x86_64/lib/libopenblas_haswellp-r0.2.19.so
#
# locale:
#  [1] LC_CTYPE=en_US.UTF-8       LC_NUMERIC=C
#  [3] LC_TIME=en_US.UTF-8        LC_COLLATE=en_US.UTF-8
#  [5] LC_MONETARY=en_US.UTF-8    LC_MESSAGES=en_US.UTF-8
#  [7] LC_PAPER=en_US.UTF-8       LC_NAME=C
#  [9] LC_ADDRESS=C               LC_TELEPHONE=C
# [11] LC_MEASUREMENT=en_US.UTF-8 LC_IDENTIFICATION=C
#
# attached base packages:
# [1] tools     stats     graphics  grDevices utils     datasets  methods
# [8] base
#
# other attached packages:
# [1] RColorBrewer_1.1-2 dplyr_1.0.4        reshape2_1.4.3     Matrix_1.2-18
# [5] cowplot_1.1.1      ggplot2_3.3.3      fastTopics_0.5-18  workflowr_1.6.2
#
# loaded via a namespace (and not attached):
#  [1] httr_1.4.2         tidyr_1.1.2        jsonlite_1.7.2     viridisLite_0.3.0
#  [5] RcppParallel_5.0.2 mixsqp_0.3-43      yaml_2.2.1         progress_1.2.2
#  [9] ggrepel_0.9.1      pillar_1.5.0       lattice_0.20-41    quantreg_5.83
# [13] glue_1.4.2         quadprog_1.5-8     digest_0.6.27      promises_1.2.0.1
# [17] colorspace_2.0-0   plyr_1.8.6         htmltools_0.5.1.1  httpuv_1.5.4
# [21] conquer_1.0.2      pkgconfig_2.0.3    invgamma_1.1       SparseM_1.81
# [25] purrr_0.3.4        scales_1.1.1       whisker_0.4        later_1.1.0.1
# [29] Rtsne_0.15         MatrixModels_0.4-1 git2r_0.27.1       tibble_3.0.6
# [33] farver_2.0.3       generics_0.1.0     ellipsis_0.3.1     withr_2.4.1
# [37] ashr_2.2-47        lazyeval_0.2.2     magrittr_2.0.1     crayon_1.4.1
# [41] mcmc_0.9-7         evaluate_0.14      fs_1.3.1           fansi_0.4.2
# [45] MASS_7.3-53        truncnorm_1.0-8    data.table_1.14.0  prettyunits_1.1.1
# [49] hms_1.0.0          lifecycle_1.0.0    matrixStats_0.58.0 stringr_1.4.0
# [53] MCMCpack_1.5-0     plotly_4.9.3       munsell_0.5.0      irlba_2.3.3
# [57] compiler_3.6.1     rlang_0.4.10       debugme_1.1.0      grid_3.6.1
# [61] htmlwidgets_1.5.3  labeling_0.4.2     rmarkdown_2.6      gtable_0.3.0
# [65] DBI_1.1.0          R6_2.5.0           knitr_1.30         utf8_1.1.4
# [69] rprojroot_2.0.2    stringi_1.5.3      SQUAREM_2021.1     Rcpp_1.0.6
# [73] vctrs_0.3.6        tidyselect_1.1.0   xfun_0.19          coda_0.19-4