Divvy usage by time-of-day
Peter Carbonetto
Last updated: 2017-07-06
Code version: f86e267
Here we use the Divvy trip data to examine biking trends over the course of the day.
I begin by loading a few packages, as well as some additional functions I wrote for this project.
library(data.table)
library(ggplot2)
source("../code/functions.R")
Read the data
Following my earlier steps, I use function read.divvy.data to read the trip and station data from the CSV files.
divvy <- read.divvy.data()
# Reading station data from ../data/Divvy_Stations_2016_Q4.csv.
# Reading trip data from ../data/Divvy_Trips_2016_Q1.csv.
# Reading trip data from ../data/Divvy_Trips_2016_04.csv.
# Reading trip data from ../data/Divvy_Trips_2016_05.csv.
# Reading trip data from ../data/Divvy_Trips_2016_06.csv.
# Reading trip data from ../data/Divvy_Trips_2016_Q3.csv.
# Reading trip data from ../data/Divvy_Trips_2016_Q4.csv.
# Preparing Divvy data for analysis in R.
# Converting dates and times.
To make it easier to compile statistics by time-of-day, I convert the “start hour” column to a factor (categorical variable).
divvy$trips <- transform(divvy$trips,
                         start.hour = factor(start.hour,0:23))
Count departures
Add text here.
ggplot(divvy$trips,aes(start.hour)) +
  geom_bar(fill = "black",width = 0.6) +
  theme_minimal() +
  theme(panel.grid.major = element_blank(),
        panel.grid.minor = element_blank())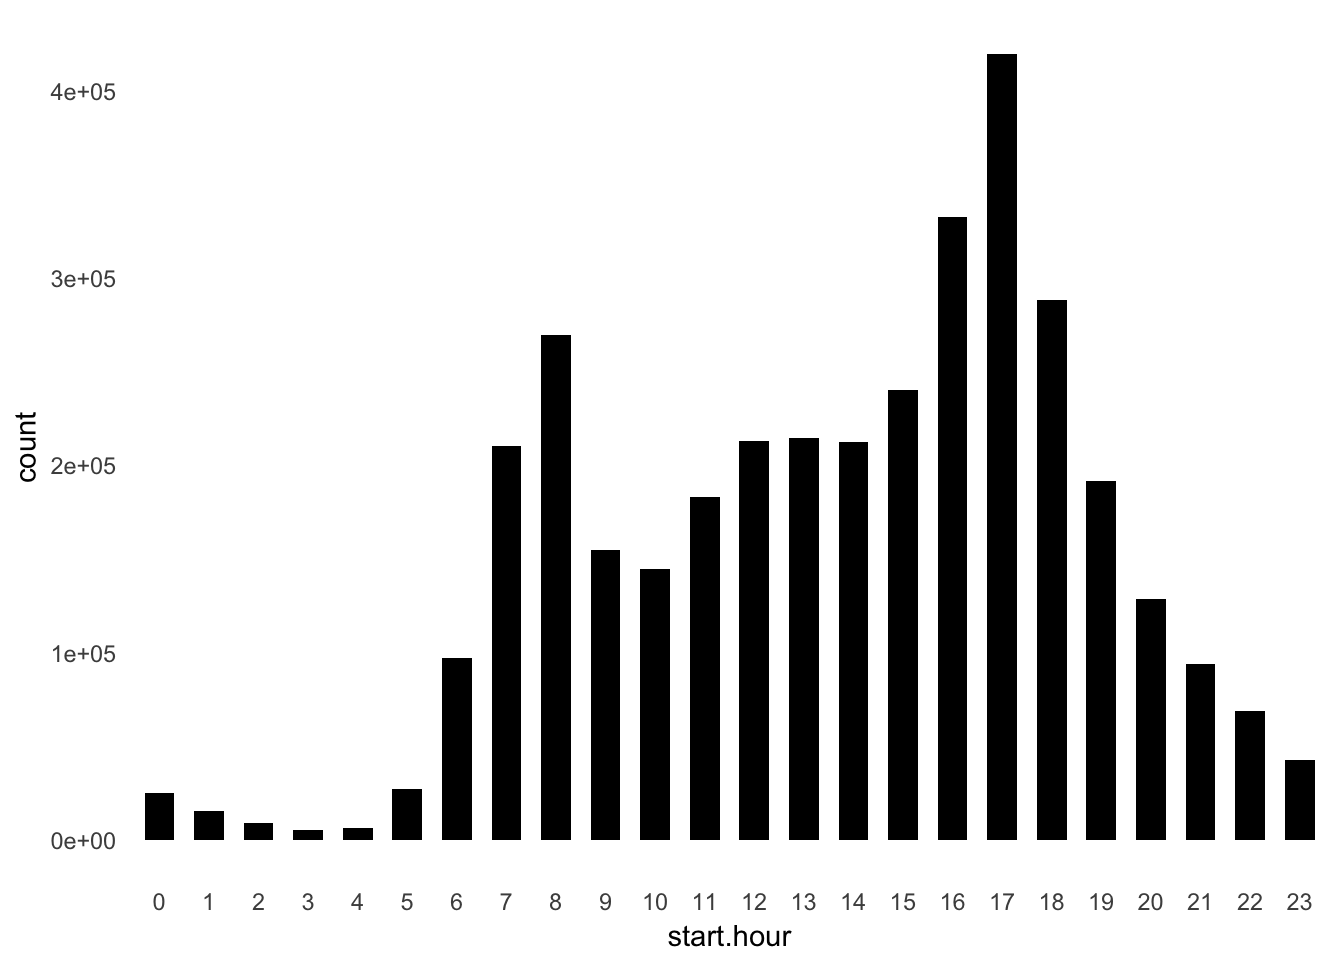
Add text here.
ggplot(divvy$trips,aes(start.hour)) +
  geom_bar(fill = "black",width = 0.6) +
  facet_wrap(~start.day,ncol = 2) +
  scale_x_discrete(breaks = seq(0,24,2)) +
  theme_minimal() +
  theme(panel.grid.major = element_blank(),
        panel.grid.minor = element_blank())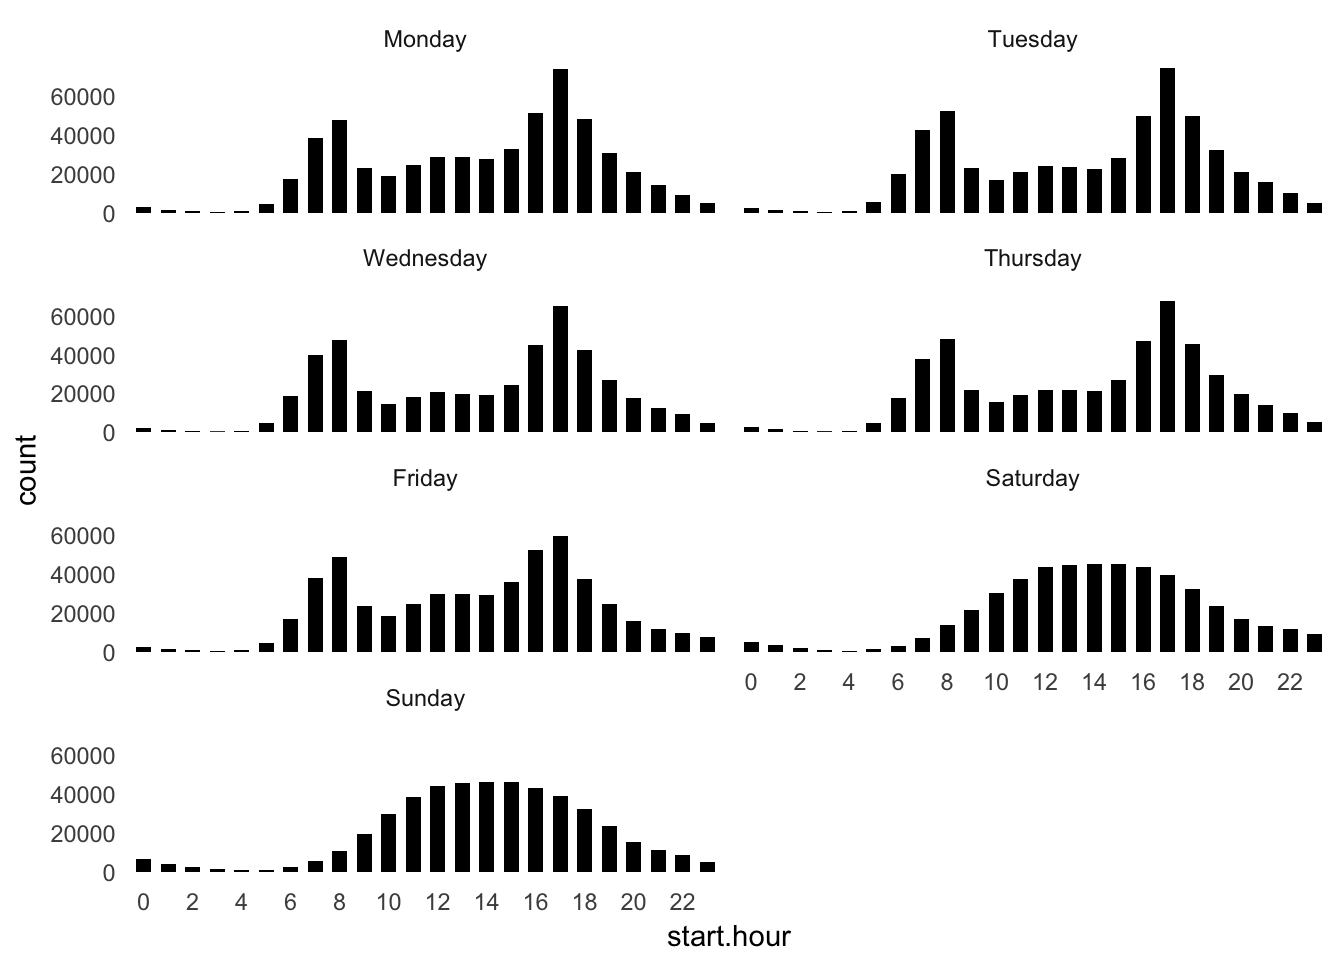
University of Chicago trends
ggplot(subset(divvy$trips,from_station_name == "University Ave & 57th St"),
       aes(start.hour)) +
  geom_bar(fill = "black",width = 0.6) +
  facet_wrap(~start.day,ncol = 2) +
  scale_x_discrete(breaks = seq(0,24,2)) +
  theme_minimal() +
  theme(panel.grid.major = element_blank(),
        panel.grid.minor = element_blank())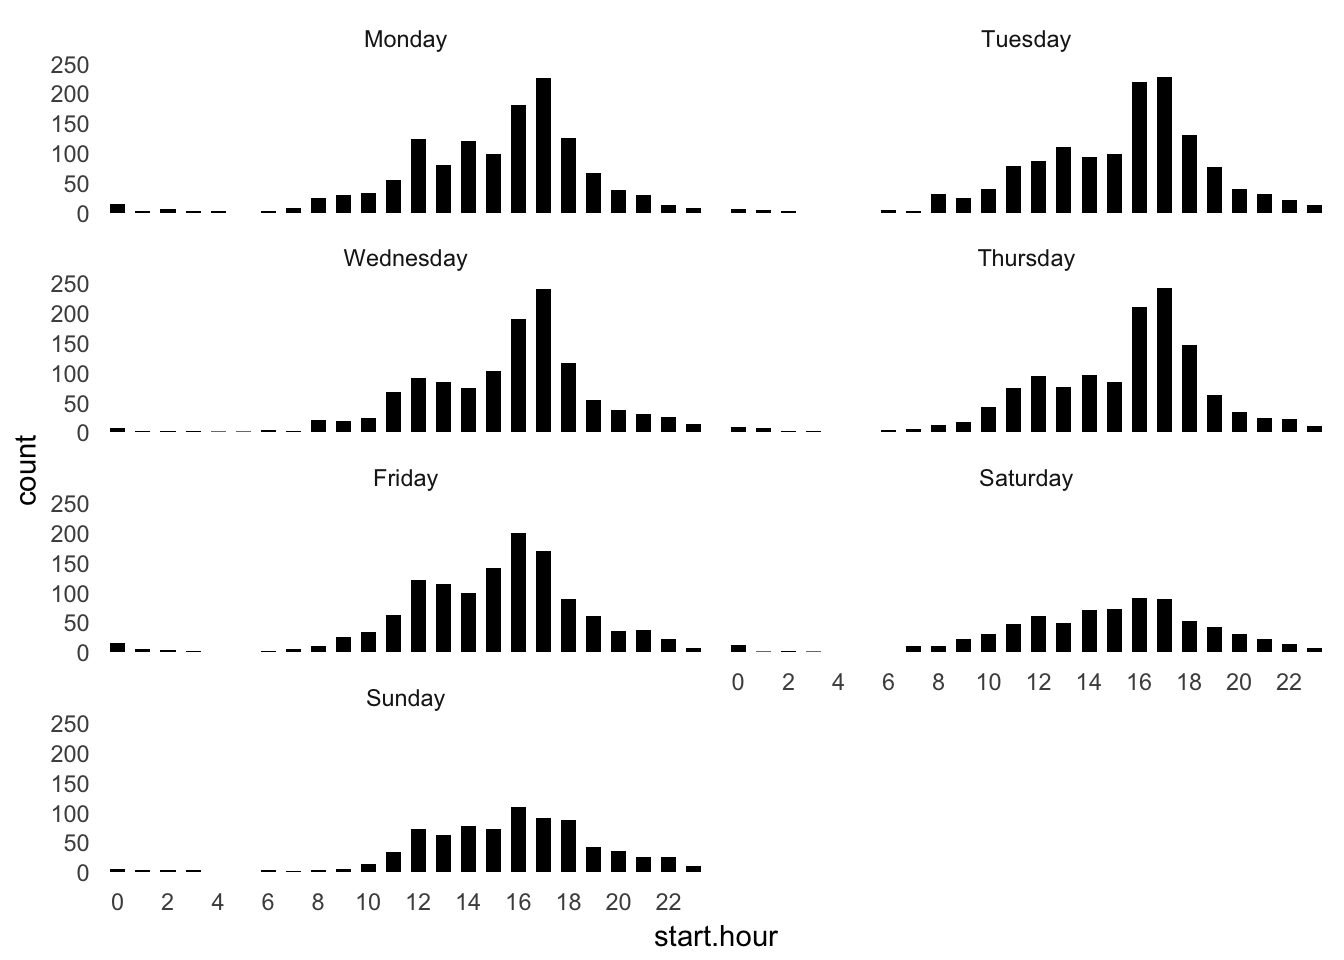
Session information
This is the version of R and the packages that were used to generate these results.
sessionInfo()
# R version 3.3.2 (2016-10-31)
# Platform: x86_64-apple-darwin13.4.0 (64-bit)
# Running under: macOS Sierra 10.12.5
#
# locale:
# [1] en_US.UTF-8/en_US.UTF-8/en_US.UTF-8/C/en_US.UTF-8/en_US.UTF-8
#
# attached base packages:
# [1] stats     graphics  grDevices utils     datasets  methods   base
#
# other attached packages:
# [1] ggplot2_2.2.1     data.table_1.10.4
#
# loaded via a namespace (and not attached):
#  [1] Rcpp_0.12.11     knitr_1.16       magrittr_1.5     munsell_0.4.3
#  [5] colorspace_1.3-2 stringr_1.2.0    plyr_1.8.4       tools_3.3.2
#  [9] grid_3.3.2       gtable_0.2.0     git2r_0.18.0     htmltools_0.3.6
# [13] yaml_2.1.14      lazyeval_0.2.0   rprojroot_1.2    digest_0.6.12
# [17] assertthat_0.2.0 tibble_1.2       codetools_0.2-15 evaluate_0.10.1
# [21] rmarkdown_1.6    labeling_0.3     stringi_1.1.2    scales_0.4.1
# [25] backports_1.0.5
This R Markdown site was created with workflowr