envGWAS_850K
Troy Rowan
2021-03-22
Last updated: 2021-06-08
Checks: 7 0
Knit directory: local_adaptation_sequence/
This reproducible R Markdown analysis was created with workflowr (version 1.6.2). The Checks tab describes the reproducibility checks that were applied when the results were created. The Past versions tab lists the development history.
Great! Since the R Markdown file has been committed to the Git repository, you know the exact version of the code that produced these results.
Great job! The global environment was empty. Objects defined in the global environment can affect the analysis in your R Markdown file in unknown ways. For reproduciblity it’s best to always run the code in an empty environment.
The command set.seed(20200709) was run prior to running the code in the R Markdown file. Setting a seed ensures that any results that rely on randomness, e.g. subsampling or permutations, are reproducible.
Great job! Recording the operating system, R version, and package versions is critical for reproducibility.
Nice! There were no cached chunks for this analysis, so you can be confident that you successfully produced the results during this run.
Great job! Using relative paths to the files within your workflowr project makes it easier to run your code on other machines.
Great! You are using Git for version control. Tracking code development and connecting the code version to the results is critical for reproducibility.
The results in this page were generated with repository version 77e94f5. See the Past versions tab to see a history of the changes made to the R Markdown and HTML files.
Note that you need to be careful to ensure that all relevant files for the analysis have been committed to Git prior to generating the results (you can use wflow_publish or wflow_git_commit). workflowr only checks the R Markdown file, but you know if there are other scripts or data files that it depends on. Below is the status of the Git repository when the results were generated:
Ignored files:
    Ignored:    .DS_Store
    Ignored:    .Rhistory
    Ignored:    .Rproj.user/
    Ignored:    data/.DS_Store
    Ignored:    data/Bos_taurus.ARS-UCD1.2.103.gtf.gz
    Ignored:    data/Bos_taurus.ARS-UCD1.2.QTL.gff.gz
    Ignored:    data/FAANG_peaks.bed.gz
    Ignored:    output/.DS_Store
    Ignored:    output/200910_RAN/.DS_Store
    Ignored:    output/200910_RAN/genes/
    Ignored:    output/200910_RAN/gwas/
    Ignored:    output/200910_RAN/seq_gwas/
    Ignored:    output/200910_RAN/sfs_selection/
    Ignored:    output/selscan_window/200907_SIM.all.nsl.out.100bins.norm.windows.txt
    Ignored:    output/selscan_window/200907_SIM.all.nsl.windows.txt
    Ignored:    output/selscan_window/200907_SIM.oldest_5000.nsl.out.100bins.norm.gz
    Ignored:    output/selscan_window/200907_SIM.purebred.nsl.out.100bins.norm.gz
    Ignored:    output/selscan_window/200907_SIM.purebred.nsl.out.100bins.norm.windows.txt
    Ignored:    output/selscan_window/200907_SIM.purebred.nsl.windows.txt
    Ignored:    output/selscan_window/200907_SIM.somesim.nsl.out.100bins.norm.gz
    Ignored:    output/selscan_window/200907_SIM.somesim.nsl.windows.txt
    Ignored:    output/selscan_window/200907_SIM.young_5000.nsl.out.100bins.norm.gz
    Ignored:    output/selscan_window/200910_RAN.all.nsl.out.100bins.norm.gz
    Ignored:    output/selscan_window/200910_RAN.all.nsl.out.100bins.norm.windows.txt
    Ignored:    output/selscan_window/200910_RAN.all.nsl.windows.txt
    Ignored:    output/selscan_window/200910_RAN.oldest_5000.nsl.out.100bins.norm.gz
    Ignored:    output/selscan_window/200910_RAN.young_5000.nsl.out.100bins.norm.gz

Untracked files:
    Untracked:  analysis/test.Rmd
    Untracked:  output/200907_SIM/
    Untracked:  output/200910_RAN/af_trajectories/
    Untracked:  output/200910_RAN/ld/
    Untracked:  output/200910_RAN/selscan/
    Untracked:  output/200910_RAN/seq_cojo/
    Untracked:  output/figures/
Note that any generated files, e.g. HTML, png, CSS, etc., are not included in this status report because it is ok for generated content to have uncommitted changes.
These are the previous versions of the repository in which changes were made to the R Markdown (analysis/envGWAS_850K.Rmd) and HTML (docs/envGWAS_850K.html) files. If you’ve configured a remote Git repository (see ?wflow_git_remote), click on the hyperlinks in the table below to view the files as they were in that past version.
| File | Version | Author | Date | Message |
|---|---|---|---|---|
| Rmd | 77e94f5 | Troy Rowan | 2021-06-08 | Updated with 850K envGWAS analysis |
| Rmd | 63f88e5 | Troy Rowan | 2021-05-13 | Added envGWAS preliminary analysis |
source("code/GCTA_functions.R")
source("code/annotation_functions.R")
Simmental
850K envGWAS
Manhattan plots with both p and q values
sim_manhattans =
  unique(sim_envgwas$variable) %>%
    purrr::map(~plot_grid(ggmanhattan2(filter(sim_envgwas, variable == .x & p < 0.1), pcol = p, value = p) + ggtitle(.x),
                          ggmanhattan2(filter(sim_envgwas, variable == .x & p < 0.1), pcol = q, value = q),
                          nrow = 2))
envGWAS Runs
AridPrairie
sim_manhattans[[1]]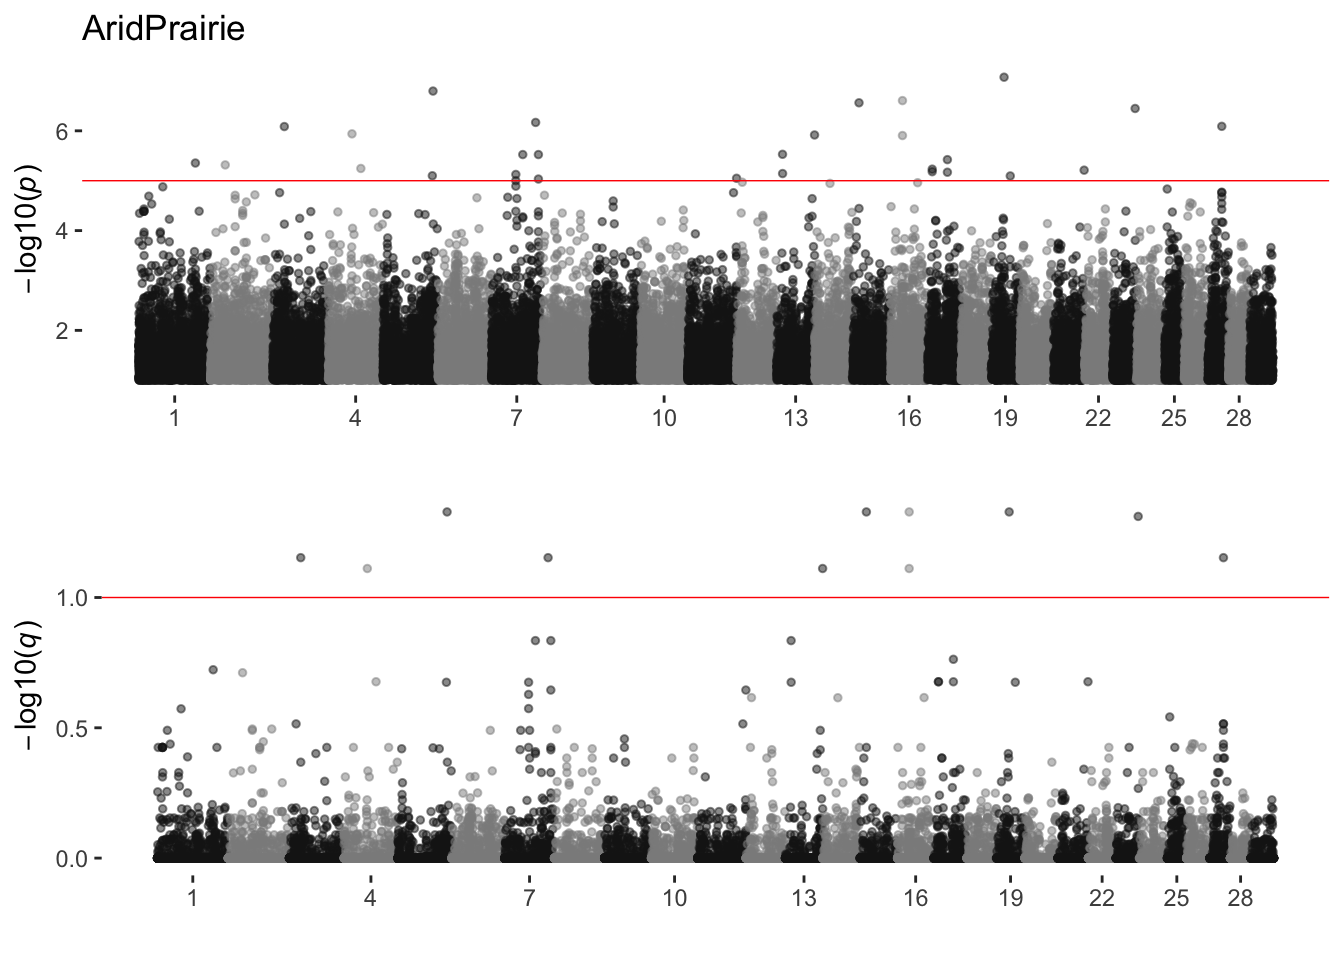
CornBelt
sim_manhattans[[2]]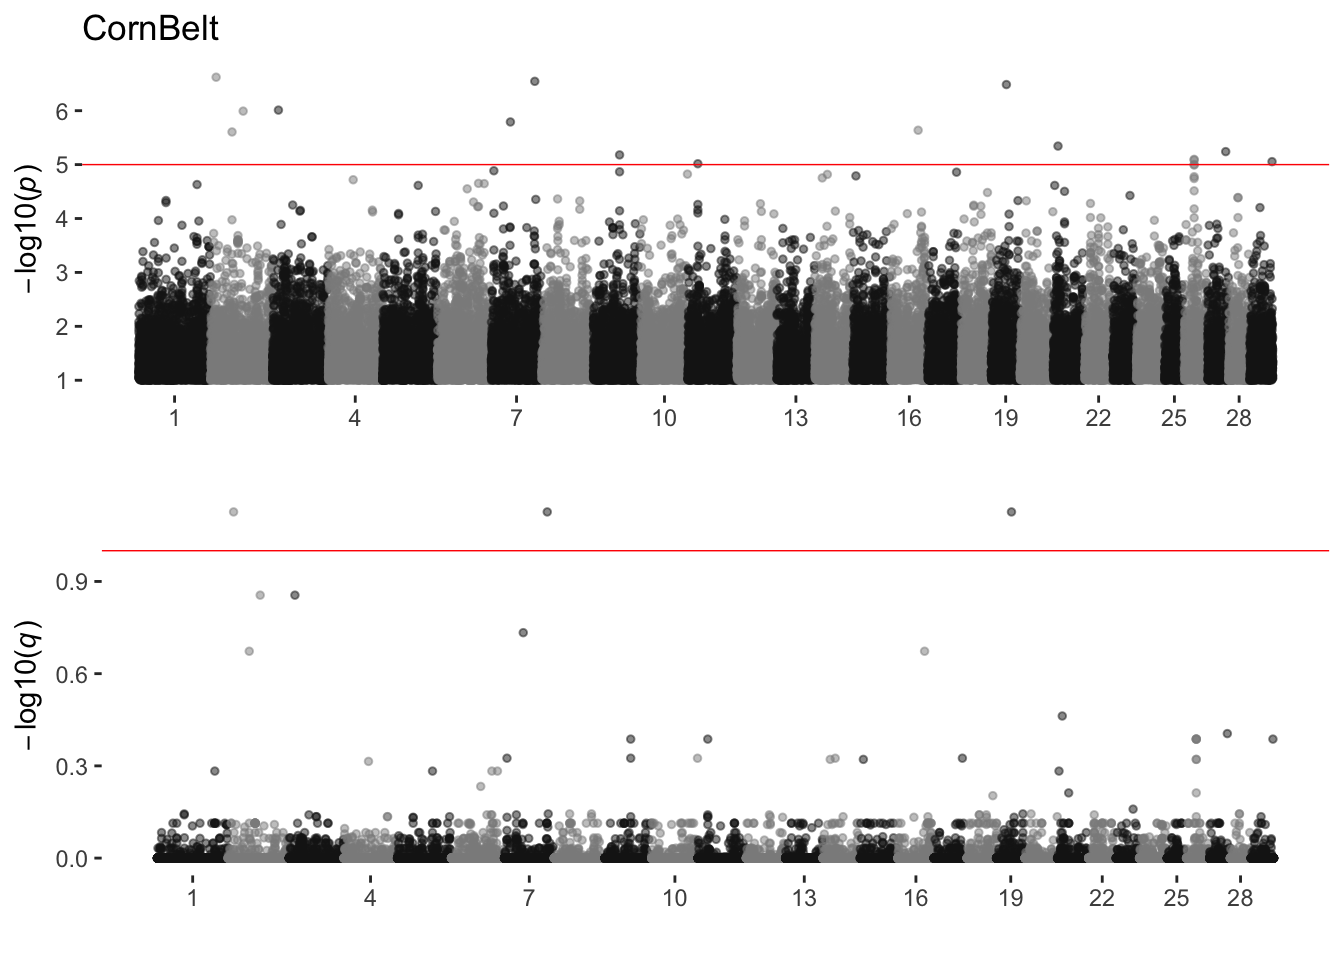
Desert
sim_manhattans[[3]]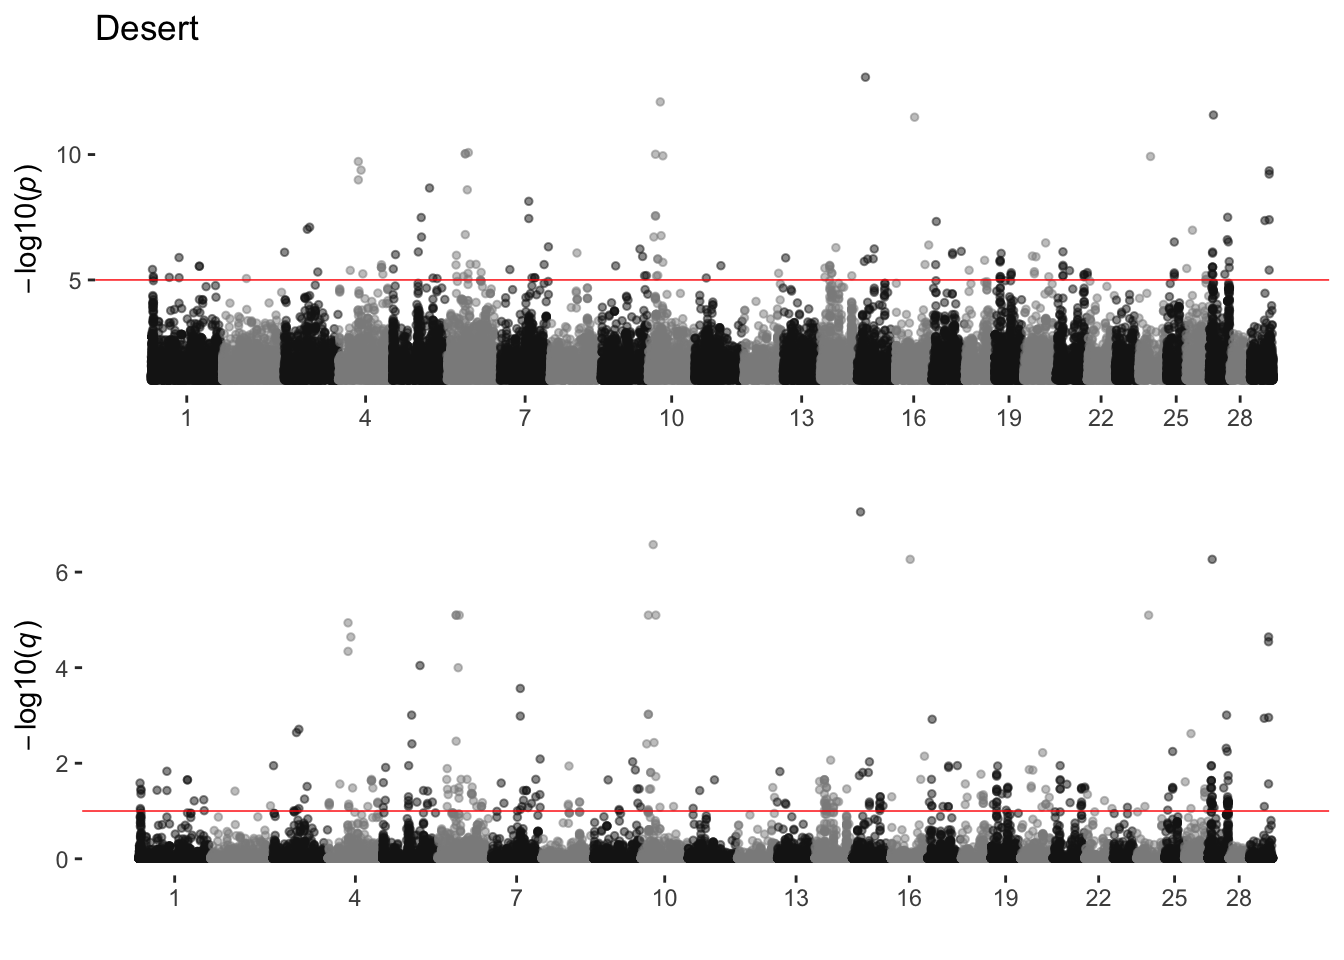
dewpoint
sim_manhattans[[4]]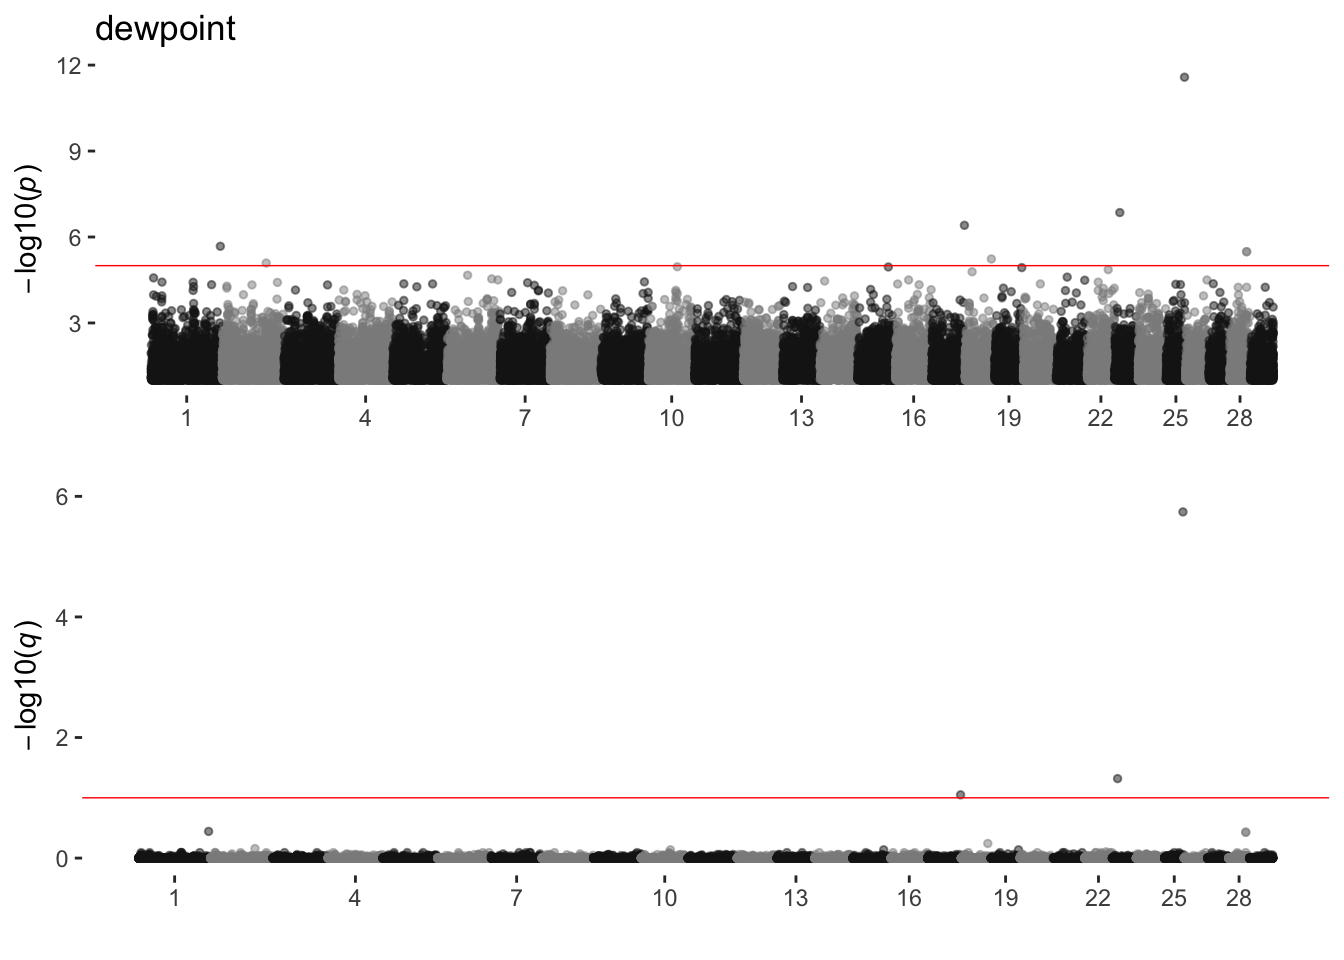
elev
sim_manhattans[[5]]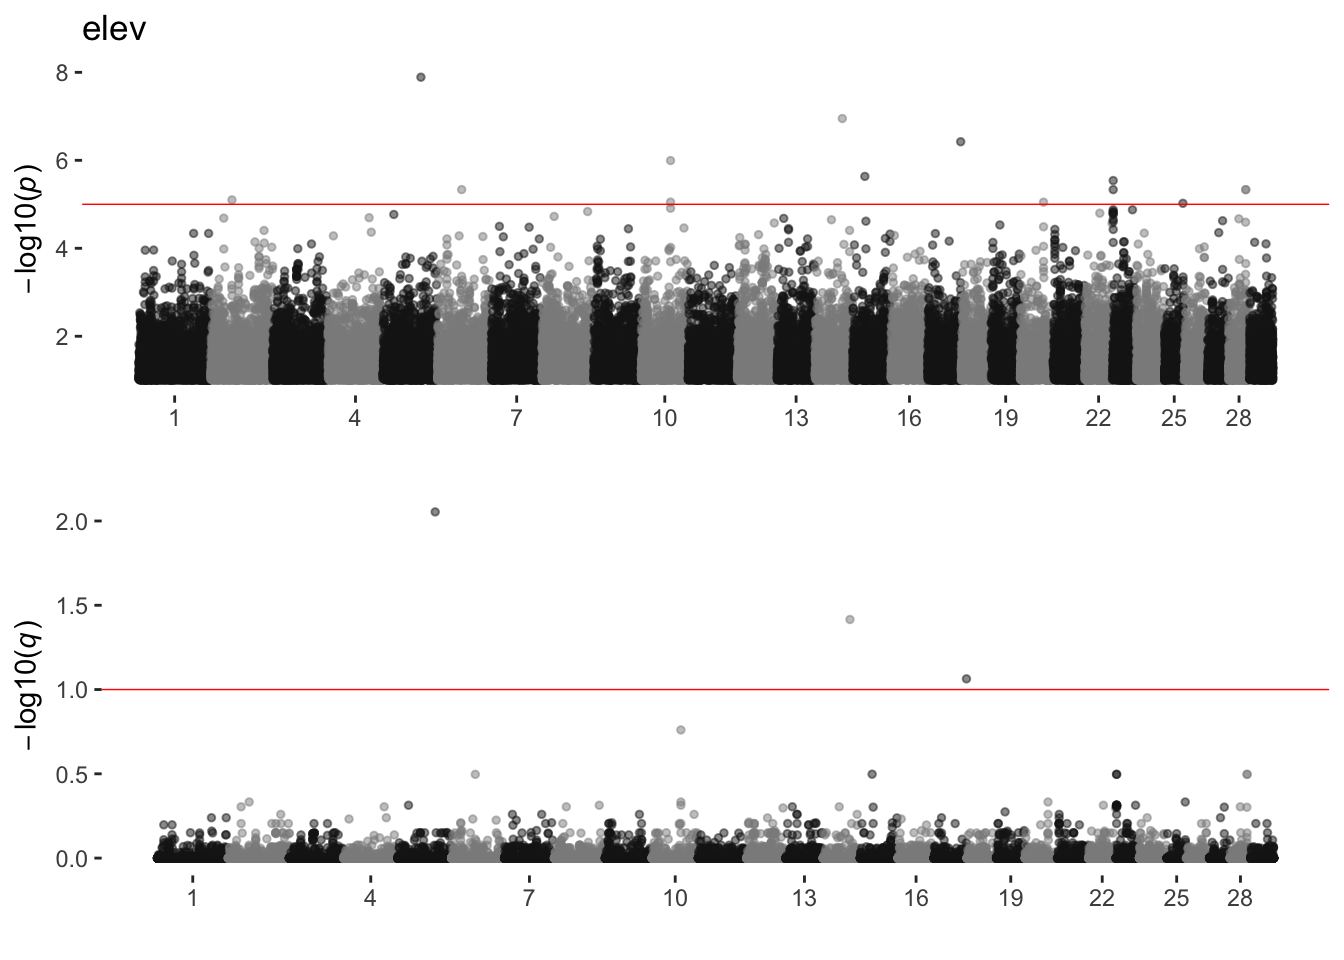
FescueBelt
sim_manhattans[[6]]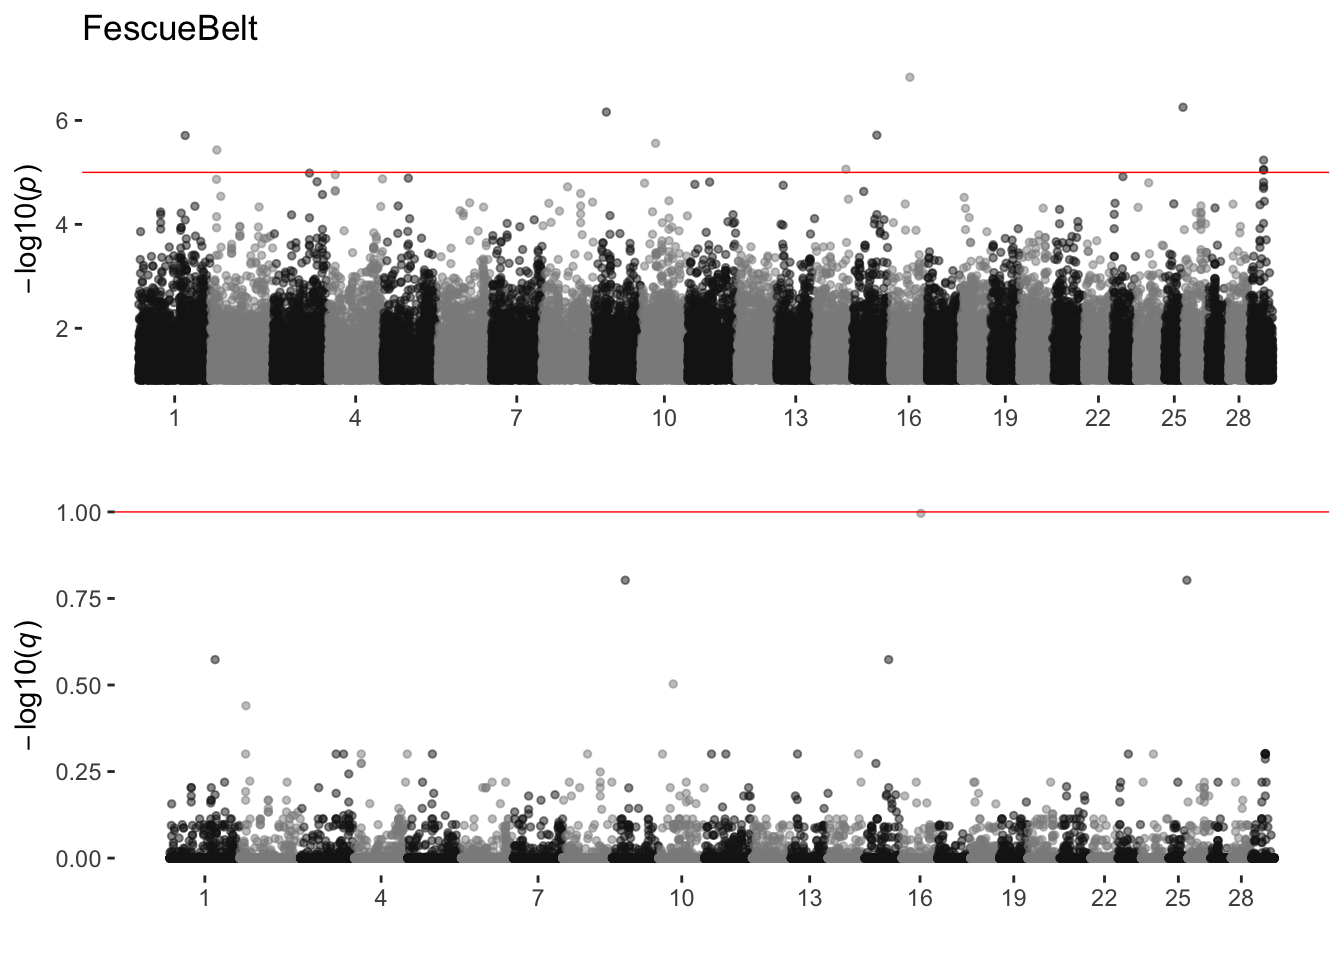
Foothills
sim_manhattans[[7]]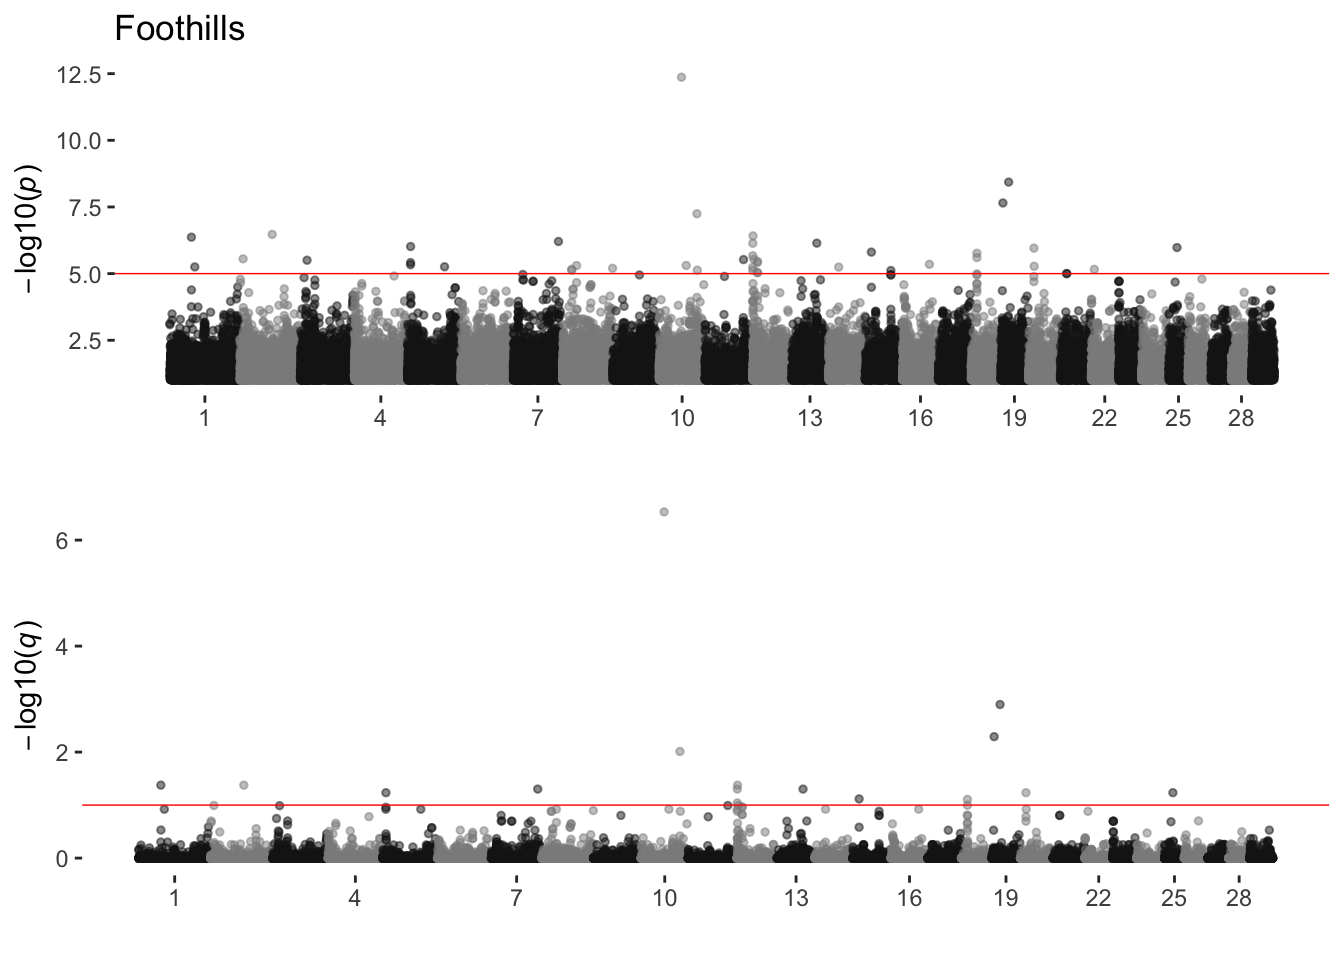
ForestedMountains
sim_manhattans[[8]]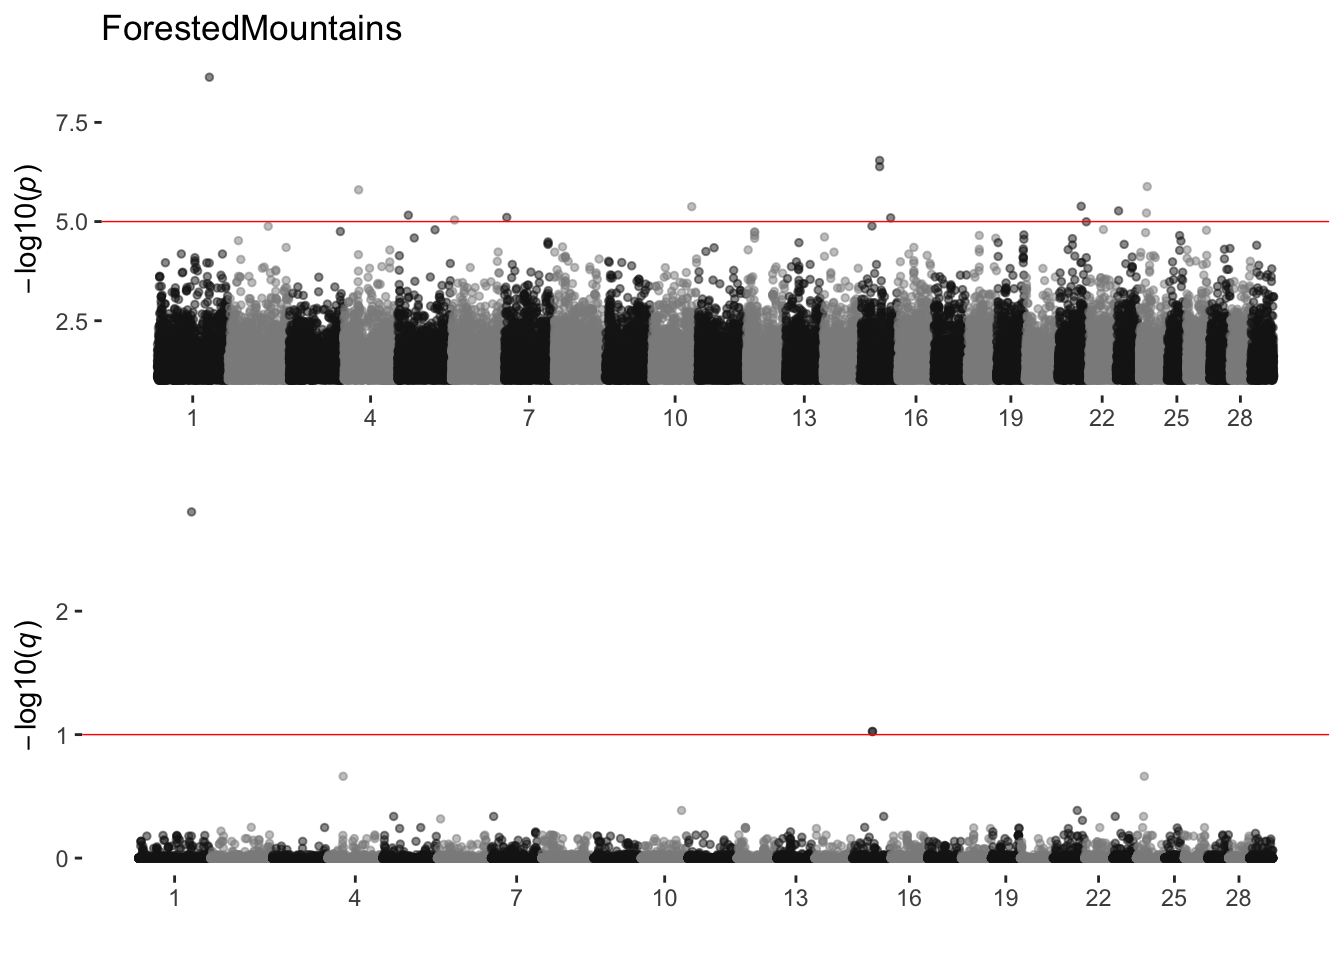
HighPlains
sim_manhattans[[9]]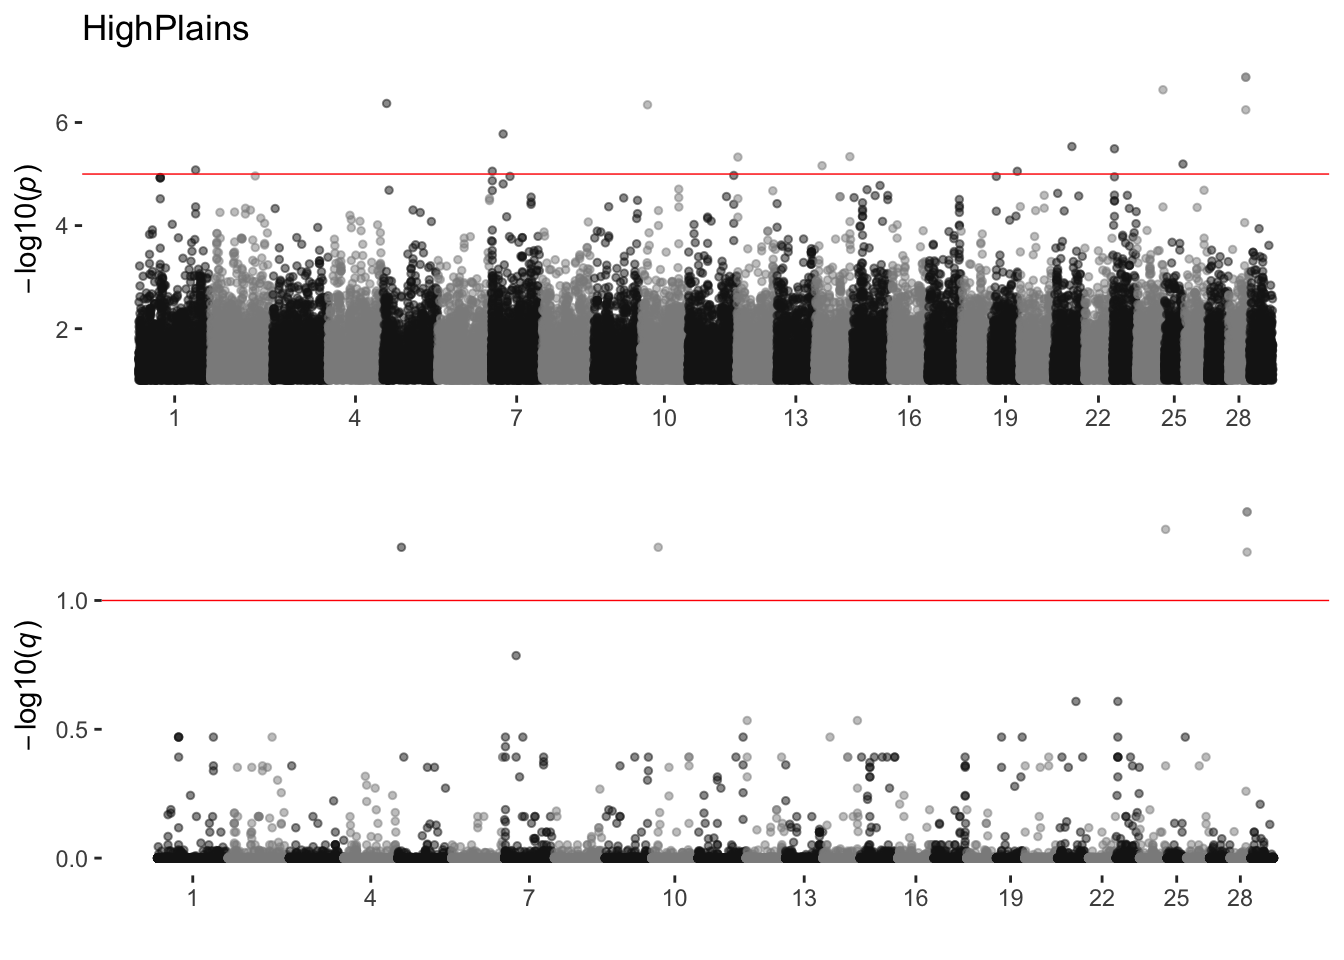
latitude
sim_manhattans[[10]]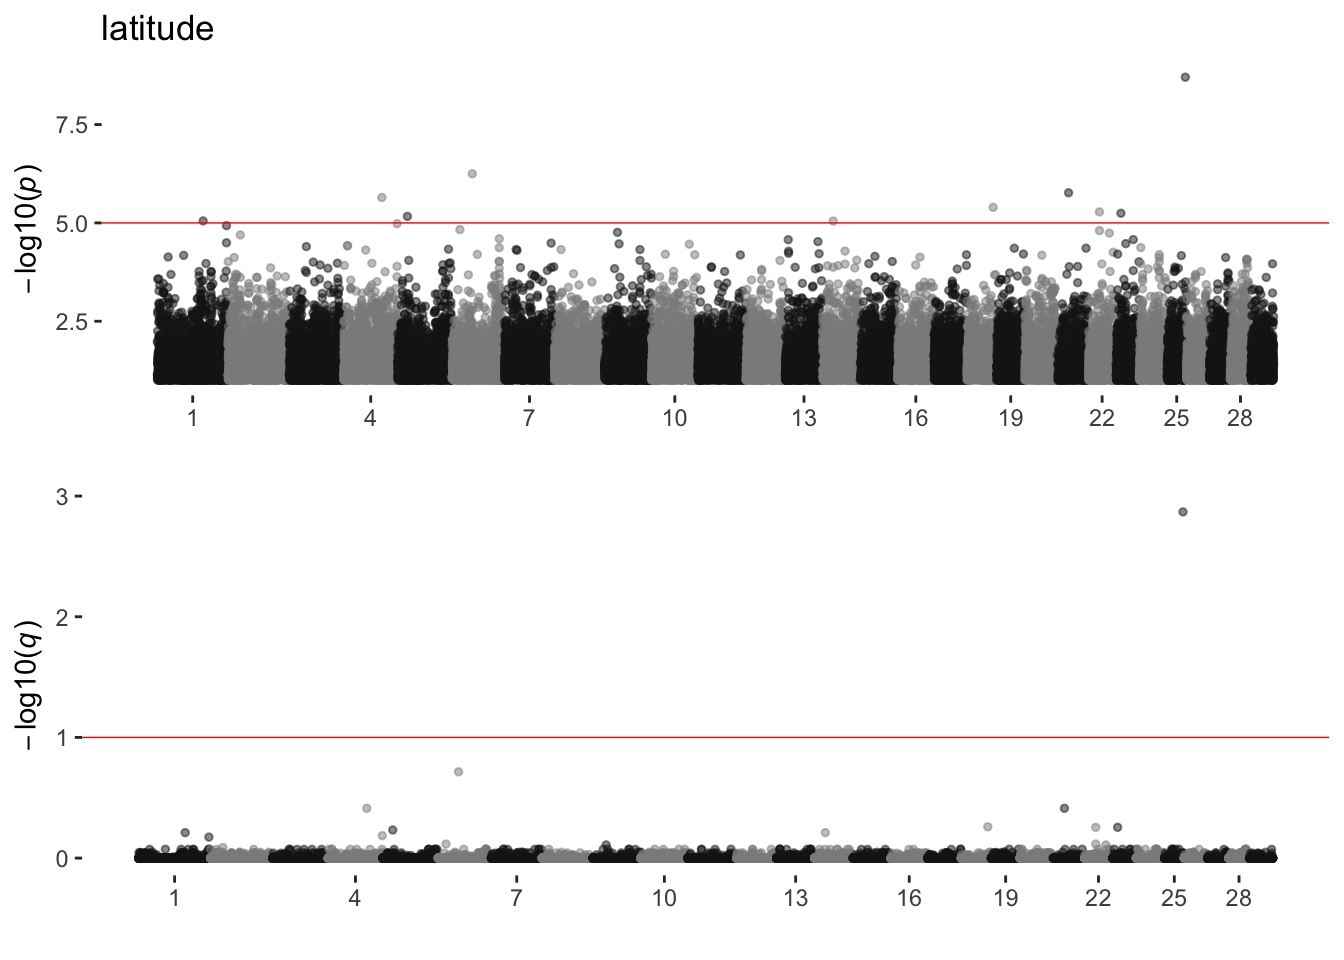
longitude
sim_manhattans[[11]]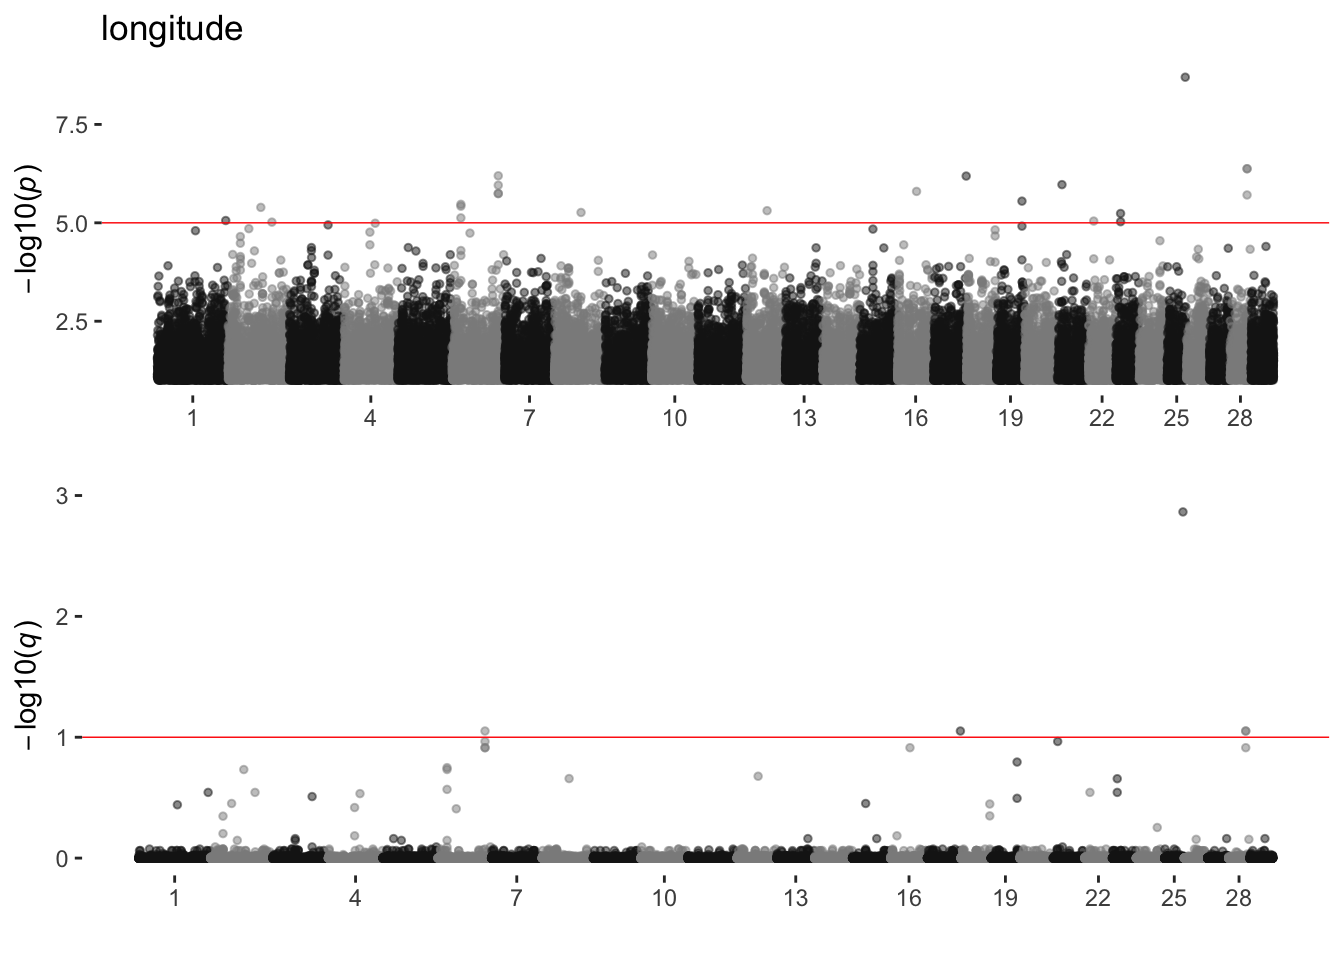
maxtemp
sim_manhattans[[12]]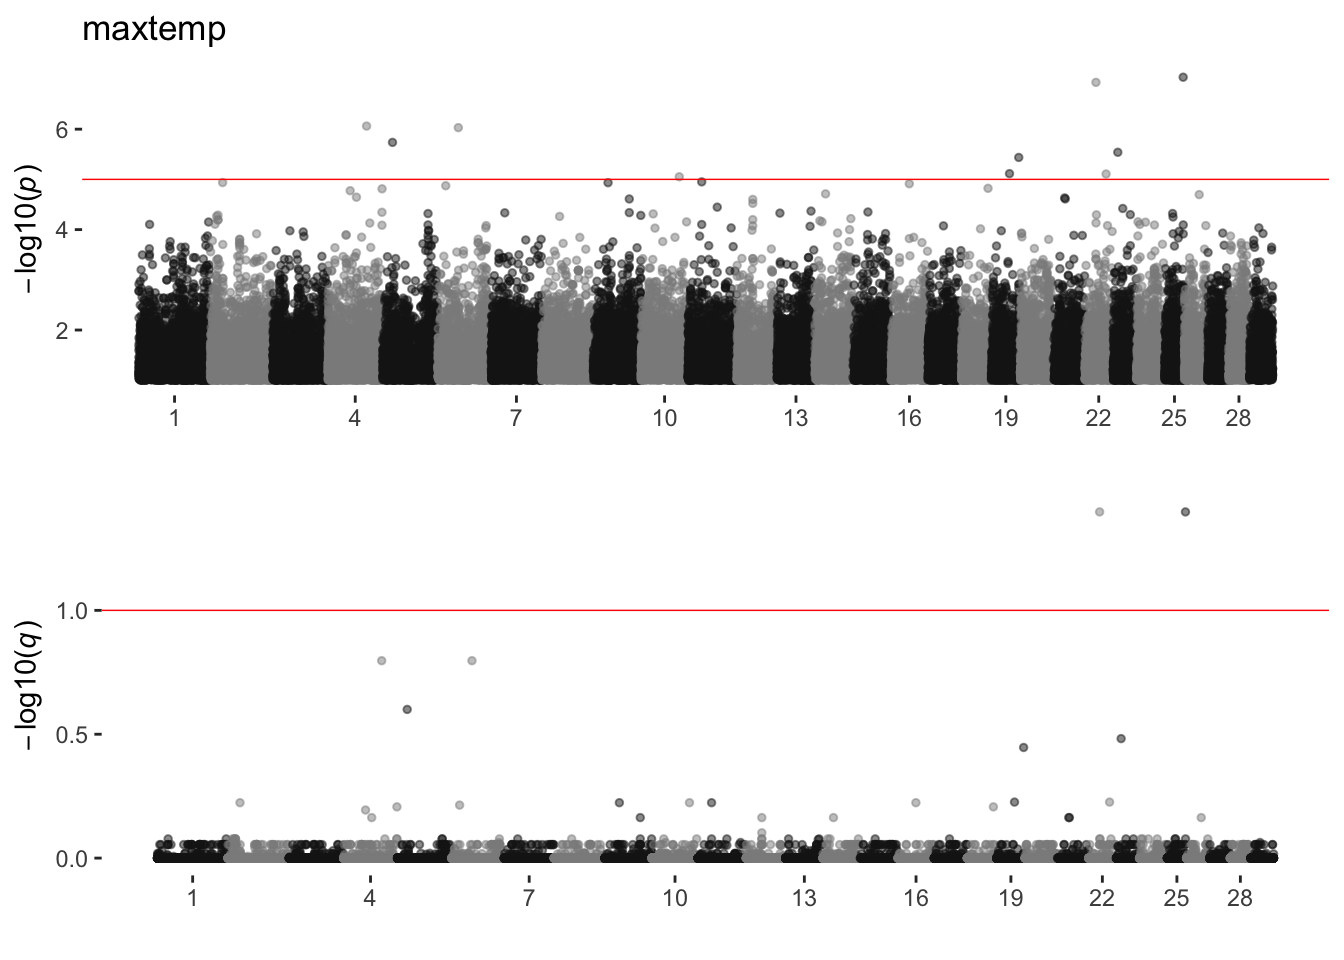
maxvap
sim_manhattans[[13]]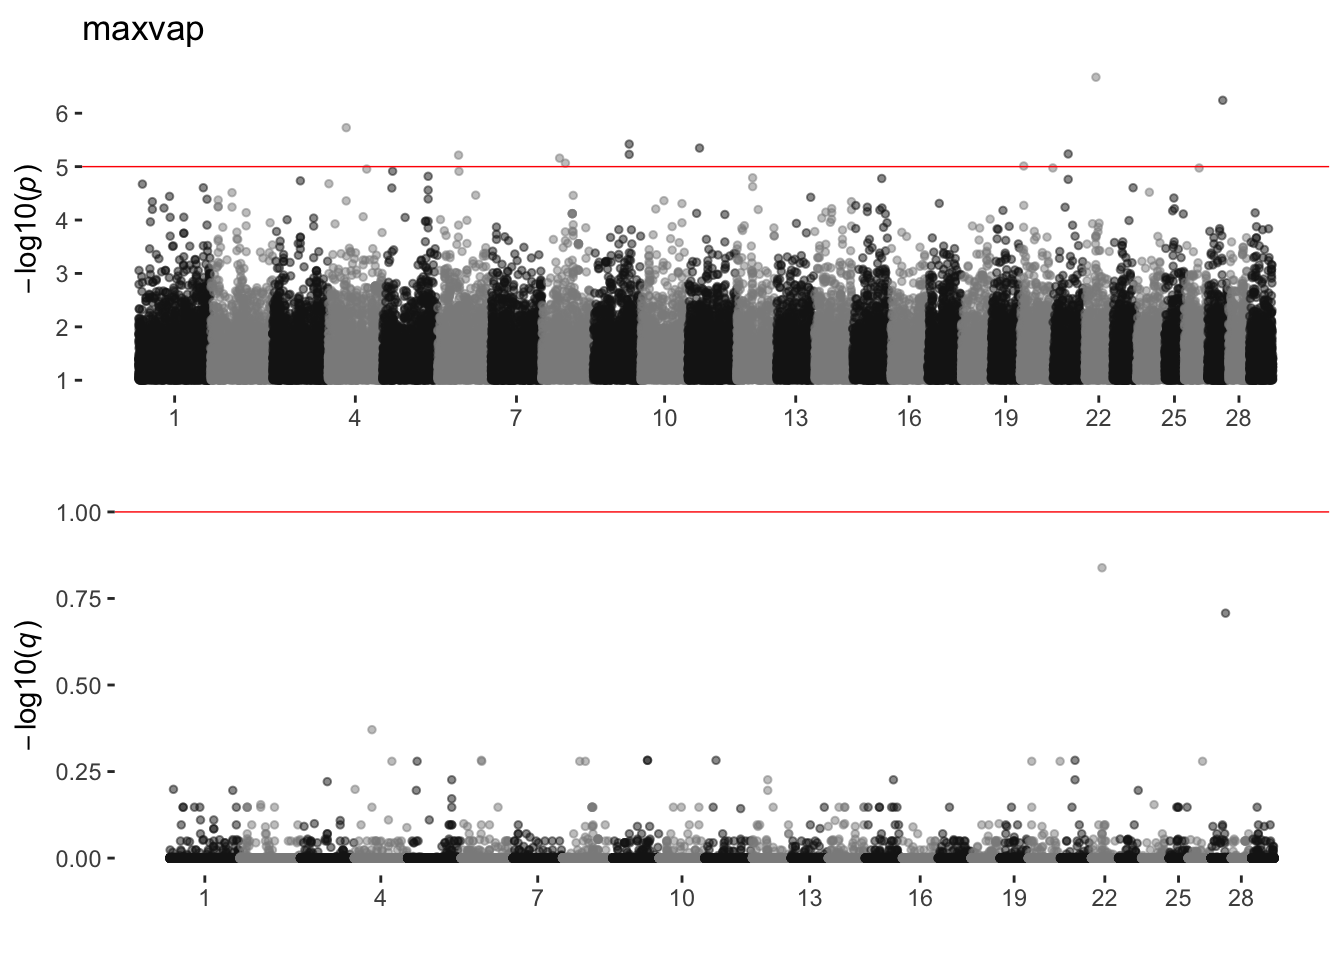
meantemp
sim_manhattans[[14]]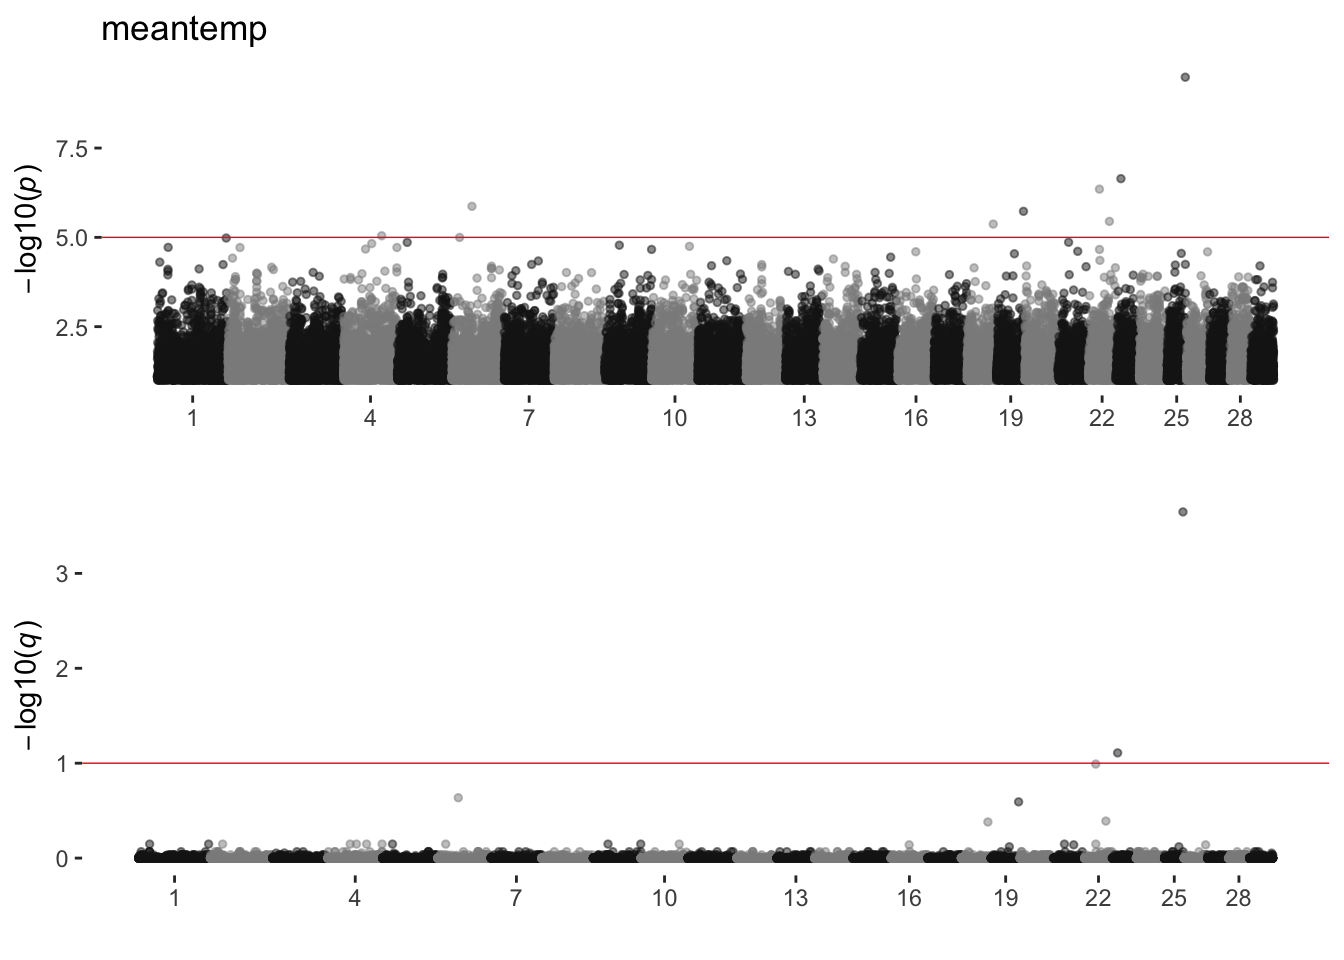
mintemp
sim_manhattans[[15]]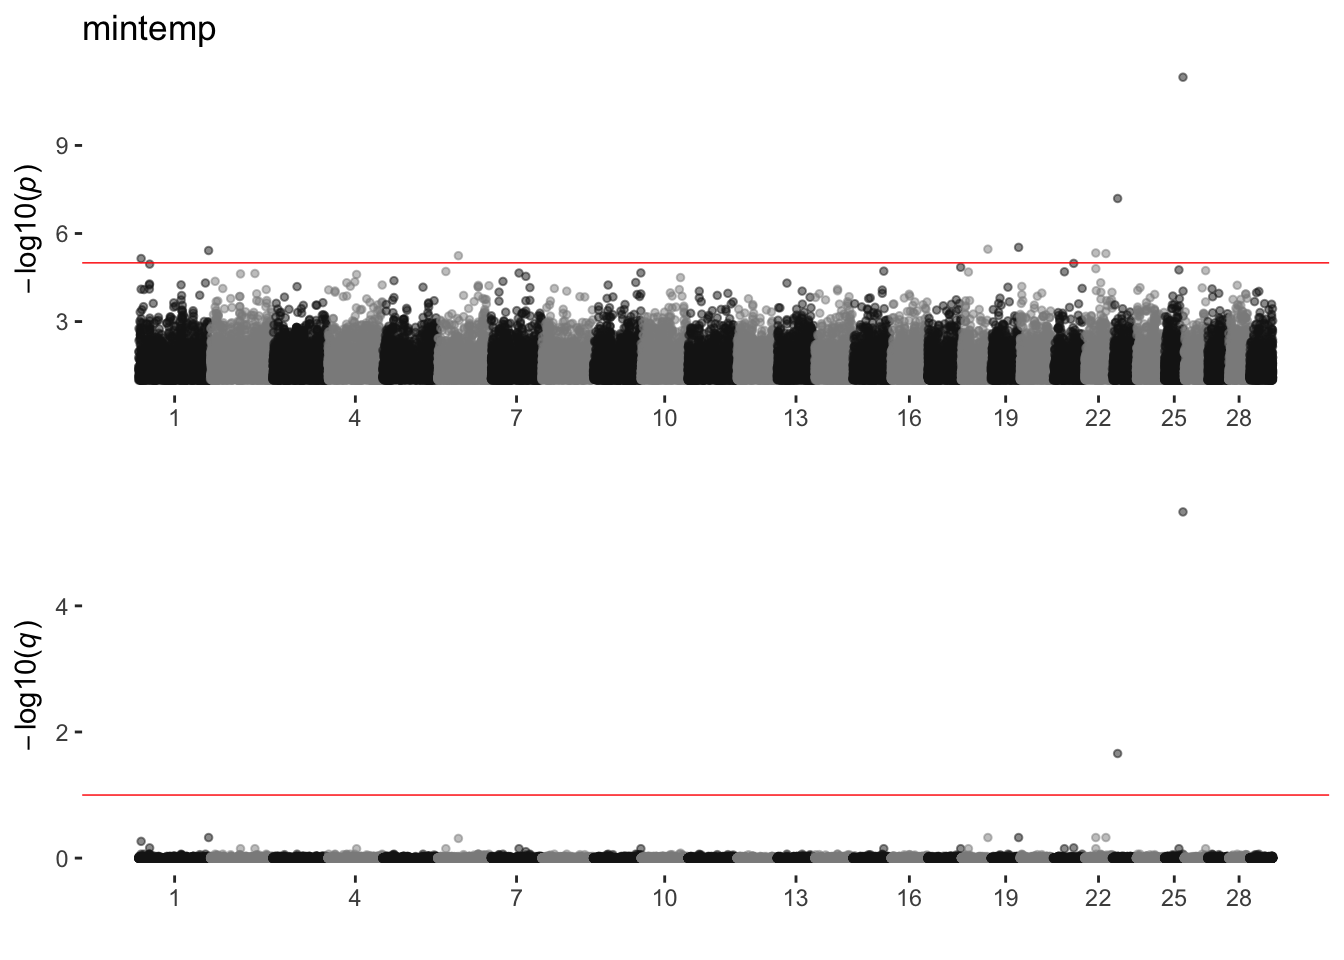
minvap
sim_manhattans[[16]]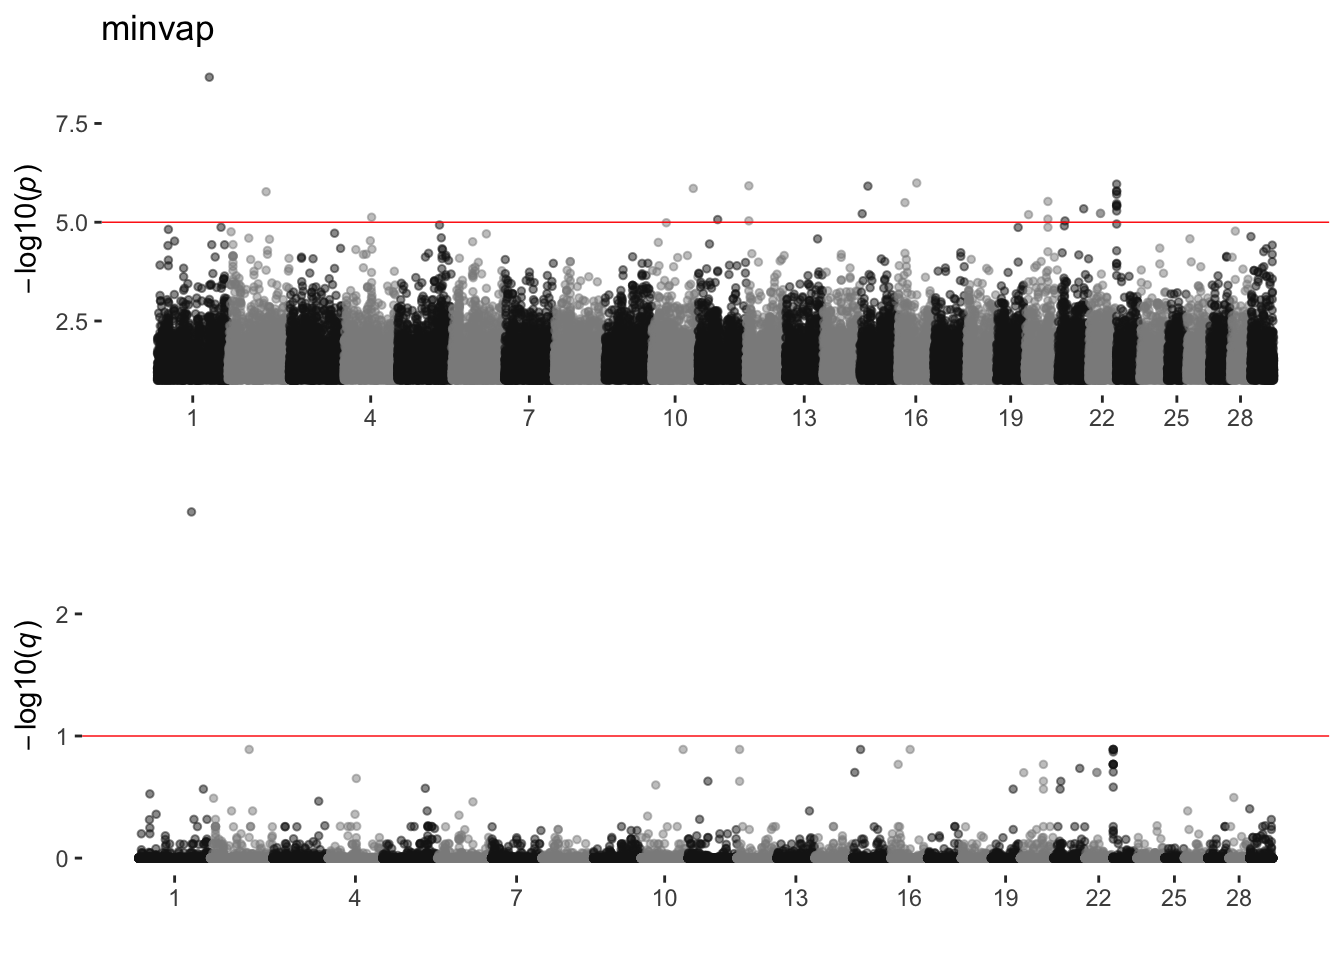
precip
sim_manhattans[[17]]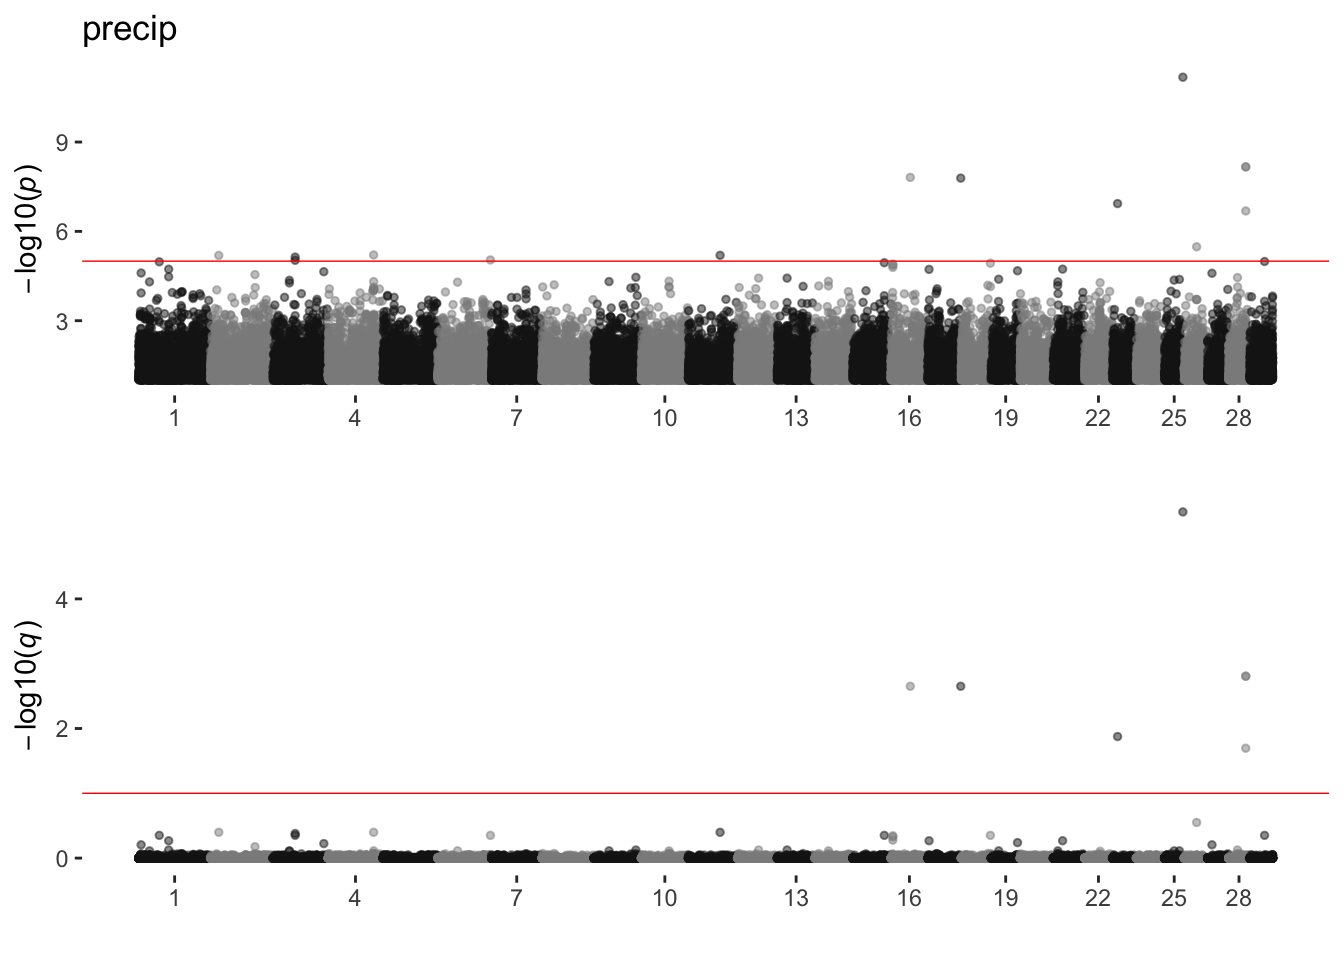
Southeast
sim_manhattans[[18]]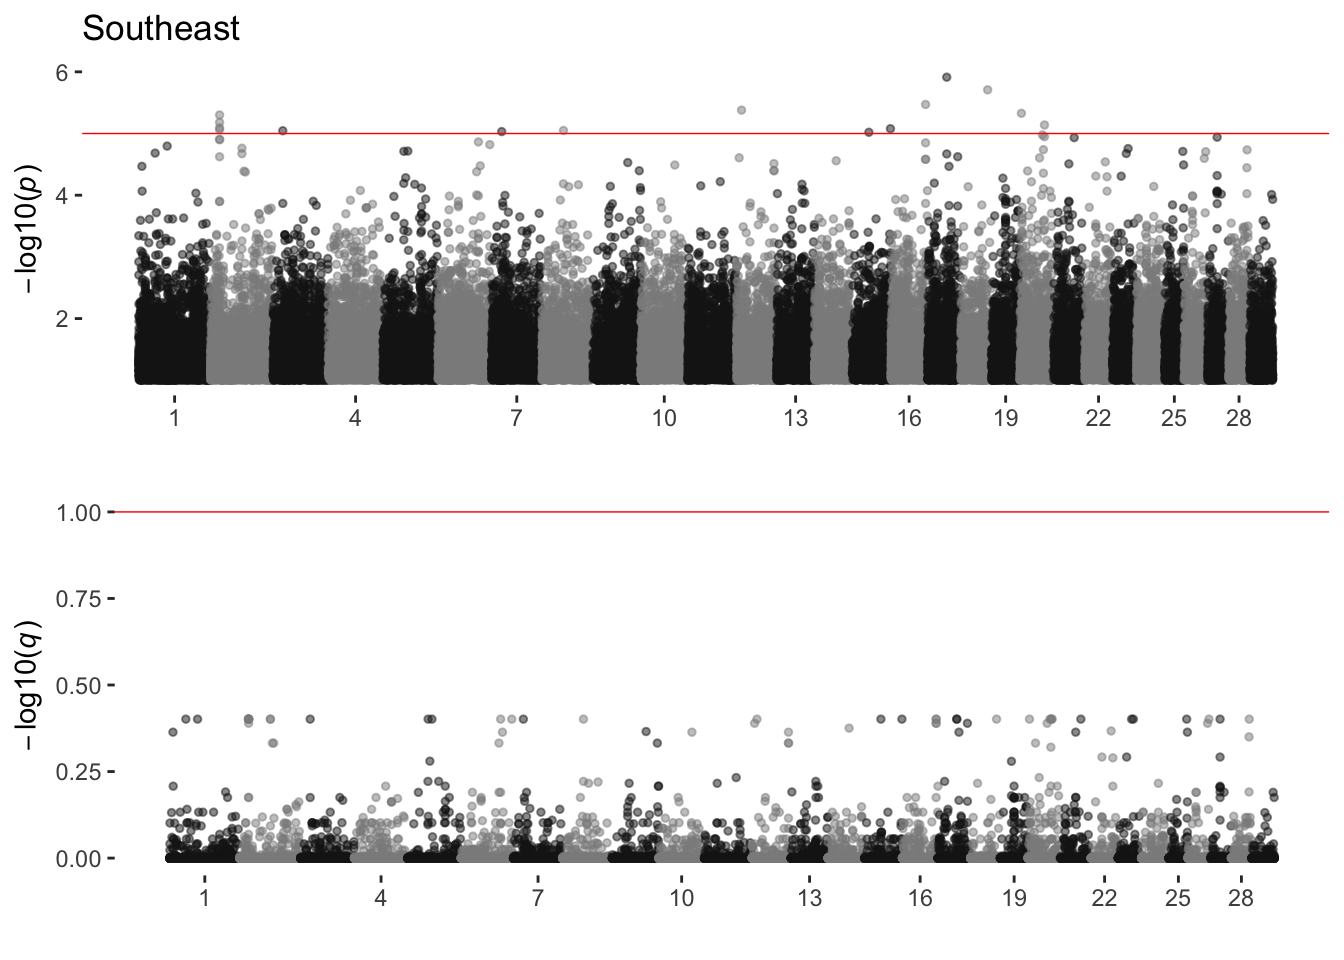
UpperMidwest
sim_manhattans[[19]]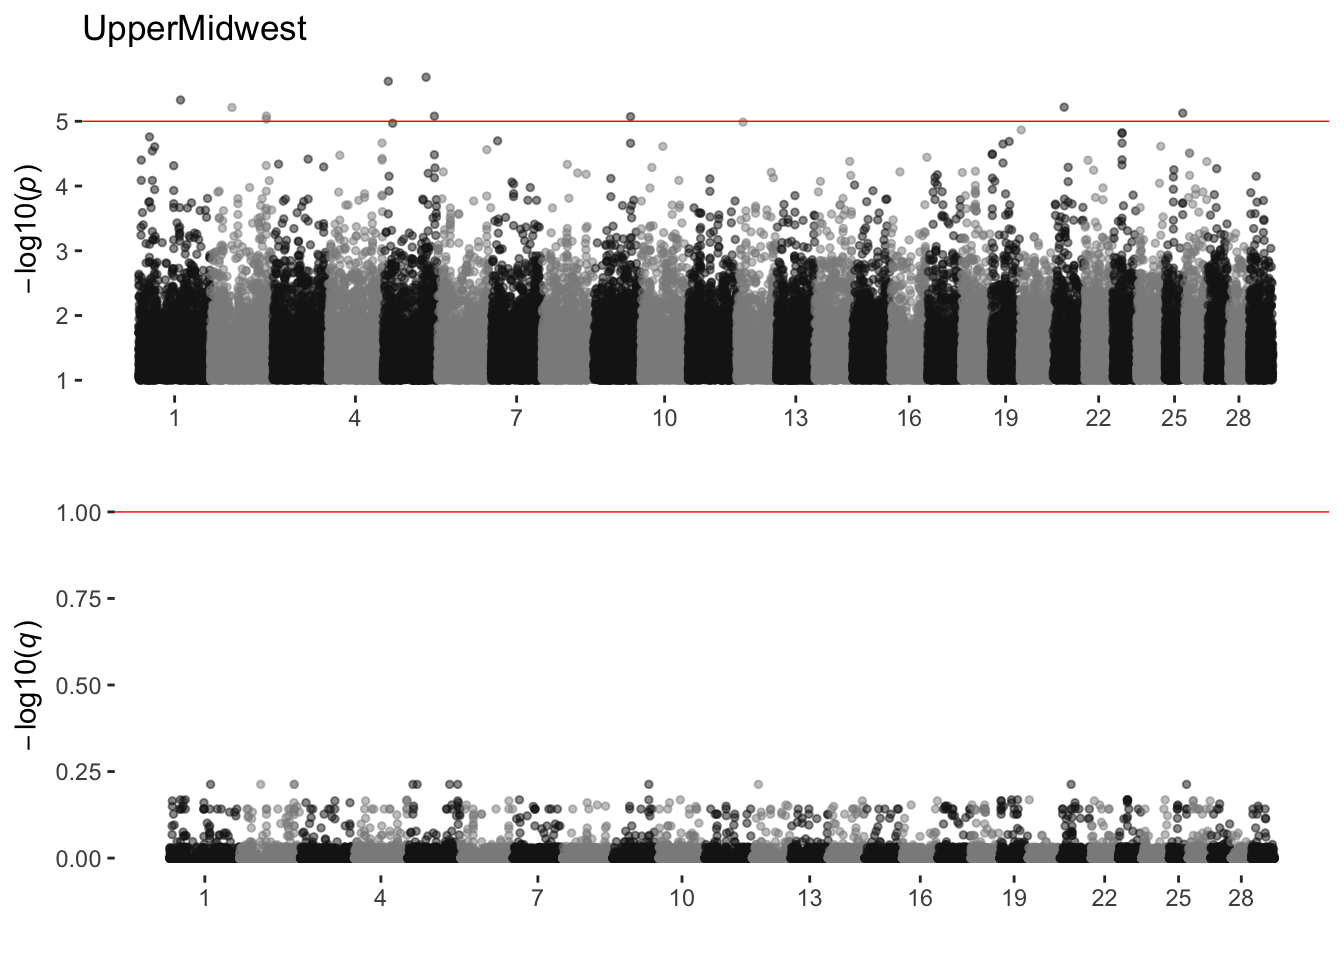
# cat('# # Simmental 850K envGWAS {.tabset}   \n')
# invisible(
#   sim_envgwas %>%
#       dplyr::group_split(variable) %>%
#       purrr::imap(.,~{
#         # create tabset for each group
#         cat('### Tab',.y,'   \n')
#         cat('\n')
#         #p <- ggmanhattan2(filter(.x, p < 0.1), sigsnps = sim_multisig)
#         p <- filter(.x, p < 0.1) %>% ggplot(aes(CHR, BP))+geom_point()
#         cat(as.character(htmltools::tagList(p)))
#       })
# )
Number of significant SNPs in each analysis at 850K level
Number of SNPs in each analysis that reaches genome-wide significance at 1) Bonferroni 2) p < 1e-5 3) q < 0.1
sim_envgwas %>%
  group_by(variable) %>%
  summarize(bonfCount = sum(p < 6e-8),
            pCount = sum(p < 1e-5),
            qCount = sum(q < 0.1))
# A tibble: 19 x 4
variable bonfCount pCount qCount
<chr> <int> <int> <int>
1 AridPrairie 0 29 11
2 CornBelt 0 16 3
3 Desert 26 158 334
4 dewpoint 1 8 3
5 elev 1 14 3
6 FescueBelt 0 11 0
7 Foothills 4 43 16
8 ForestedMountains 1 13 3
9 HighPlains 0 16 6
10 latitude 1 10 1
11 longitude 1 23 5
12 maxtemp 0 10 2
13 maxvap 0 11 0
14 meantemp 1 8 2
15 mintemp 1 9 2
16 minvap 1 27 1
17 precip 5 14 7
18 Southeast 0 15 0
19 UpperMidwest 0 10 0Red Angus
850K envGWAS
ran_envgwas =
  # list.files("output/200910_RAN/gwas") %>%
  #   map(
  #     ~read_gwas2(paste0("output/200910_RAN/gwas/", .x)) %>%
  #       mutate(variable = .x)) %>%
  #   reduce(bind_rows) %>%
  # mutate(variable = str_replace(variable, pattern = "200910_RAN.", ""),
  #        variable = str_replace(variable, pattern = ".850K.mlma.gz", ""),
  #        variable = str_replace(variable, pattern = "_noLSF", ""))

#write_csv(ran_envgwas, "output/200910_RAN/gwas/200910_RAN.AllGWAS.850K.mlma.gz")
  read_csv("output/200910_RAN/gwas/200910_RAN.AllGWAS.850K.mlma.gz",
           col_types = cols(SNP = col_character(), chrbp = col_character())) %>%
  filter(CHR < 30)

ran_multisig =
  filter(ran_envgwas, p < 1e-5) %>%
  count(SNP, sort = TRUE)%>%
  filter(n>1) %>%
  .$SNP

ran_manhattans =
  unique(ran_envgwas$variable) %>%
    purrr::map(~ggmanhattan2(filter(ran_envgwas, variable == .x & p < 0.1),pcol = p, sigsnps = ran_multisig)+
                 ggtitle(.x))
envGWAS Runs
AridPrairie
ran_manhattans[[1]]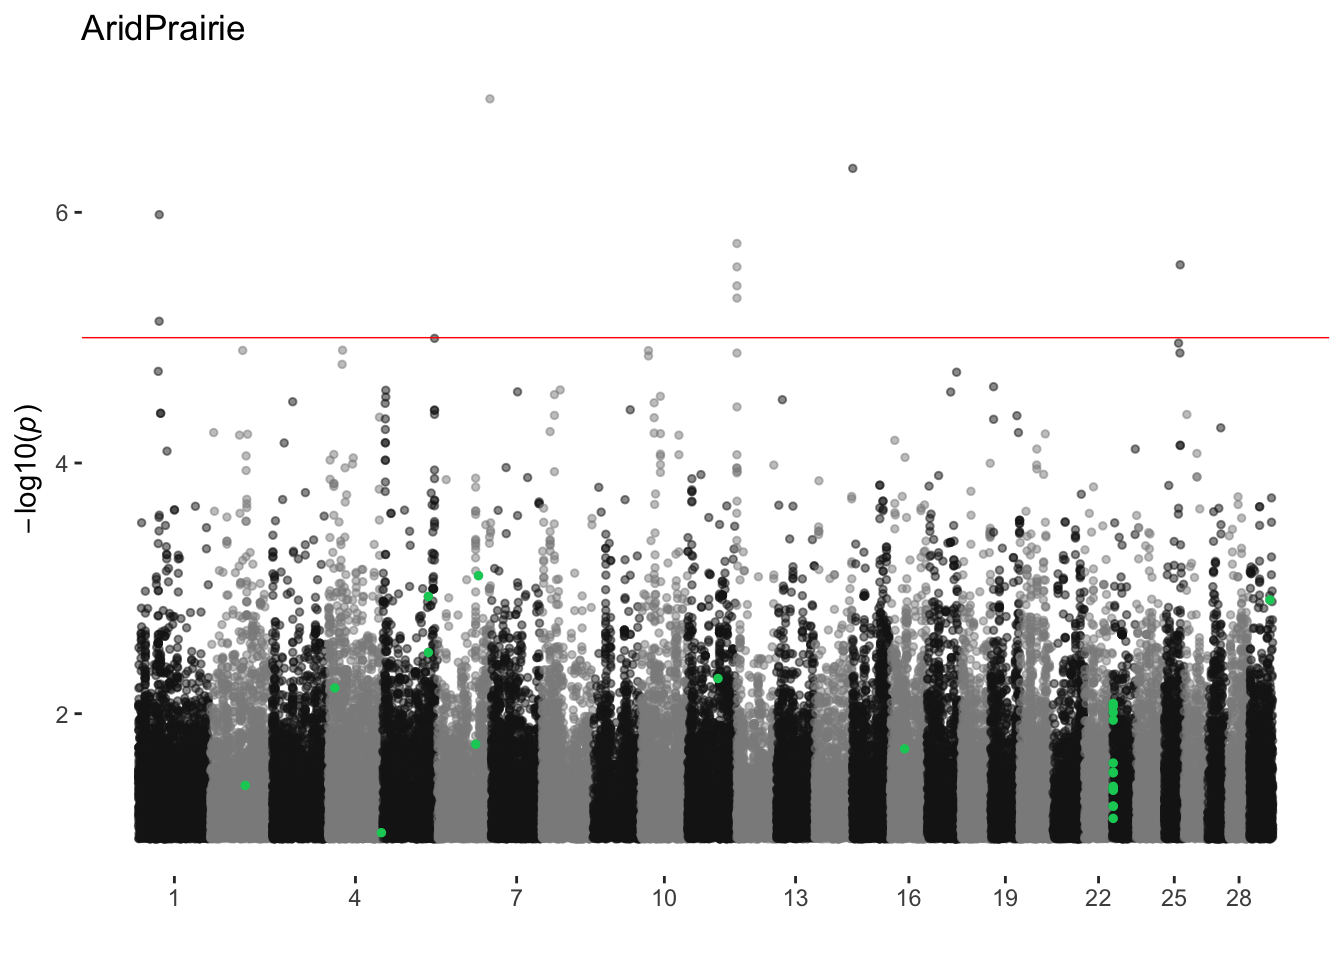
CornBelt
ran_manhattans[[2]]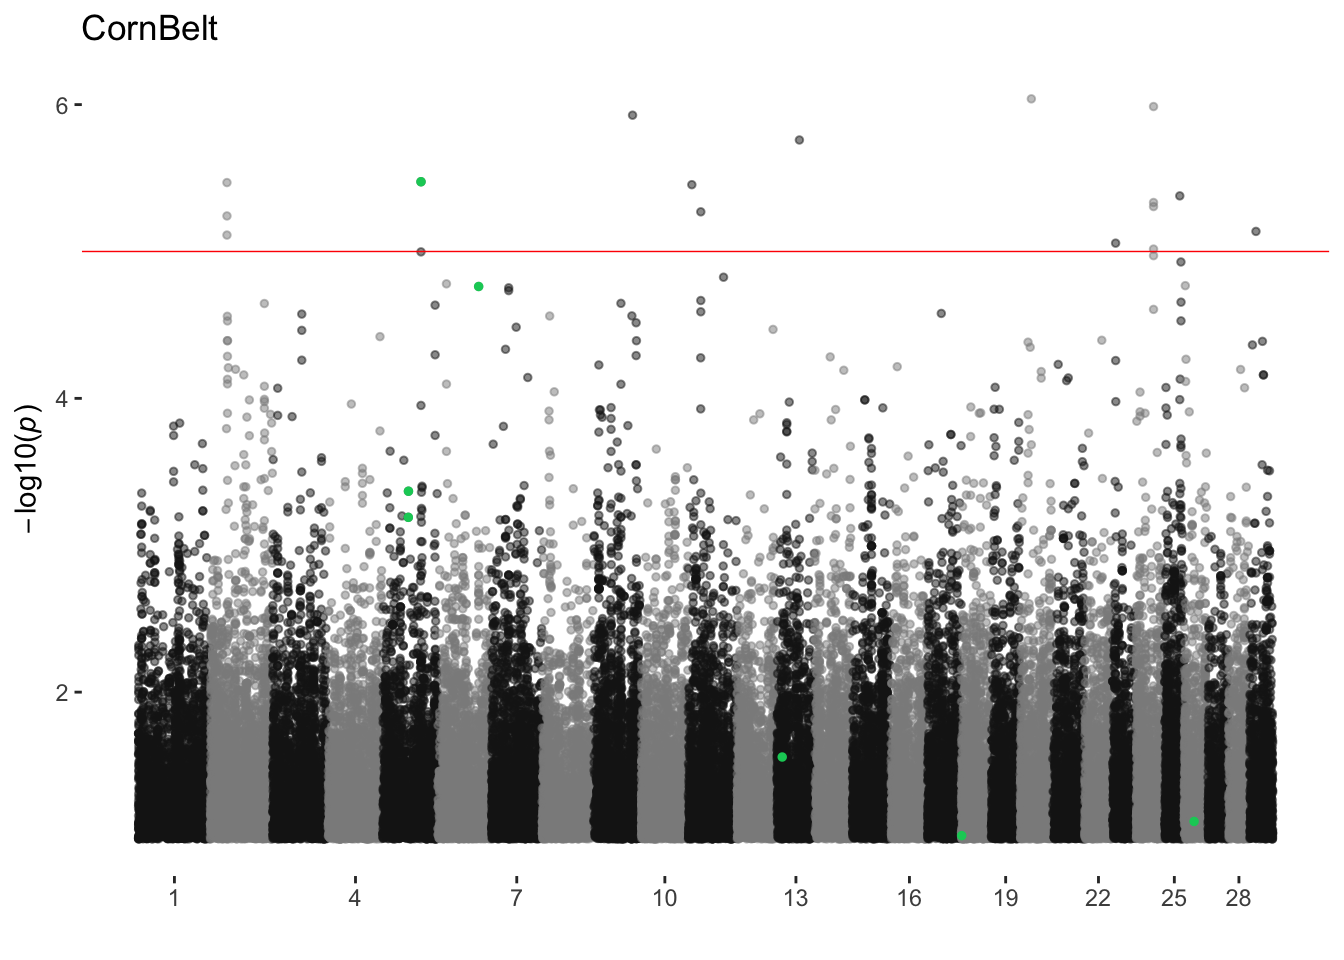
Desert
ran_manhattans[[3]]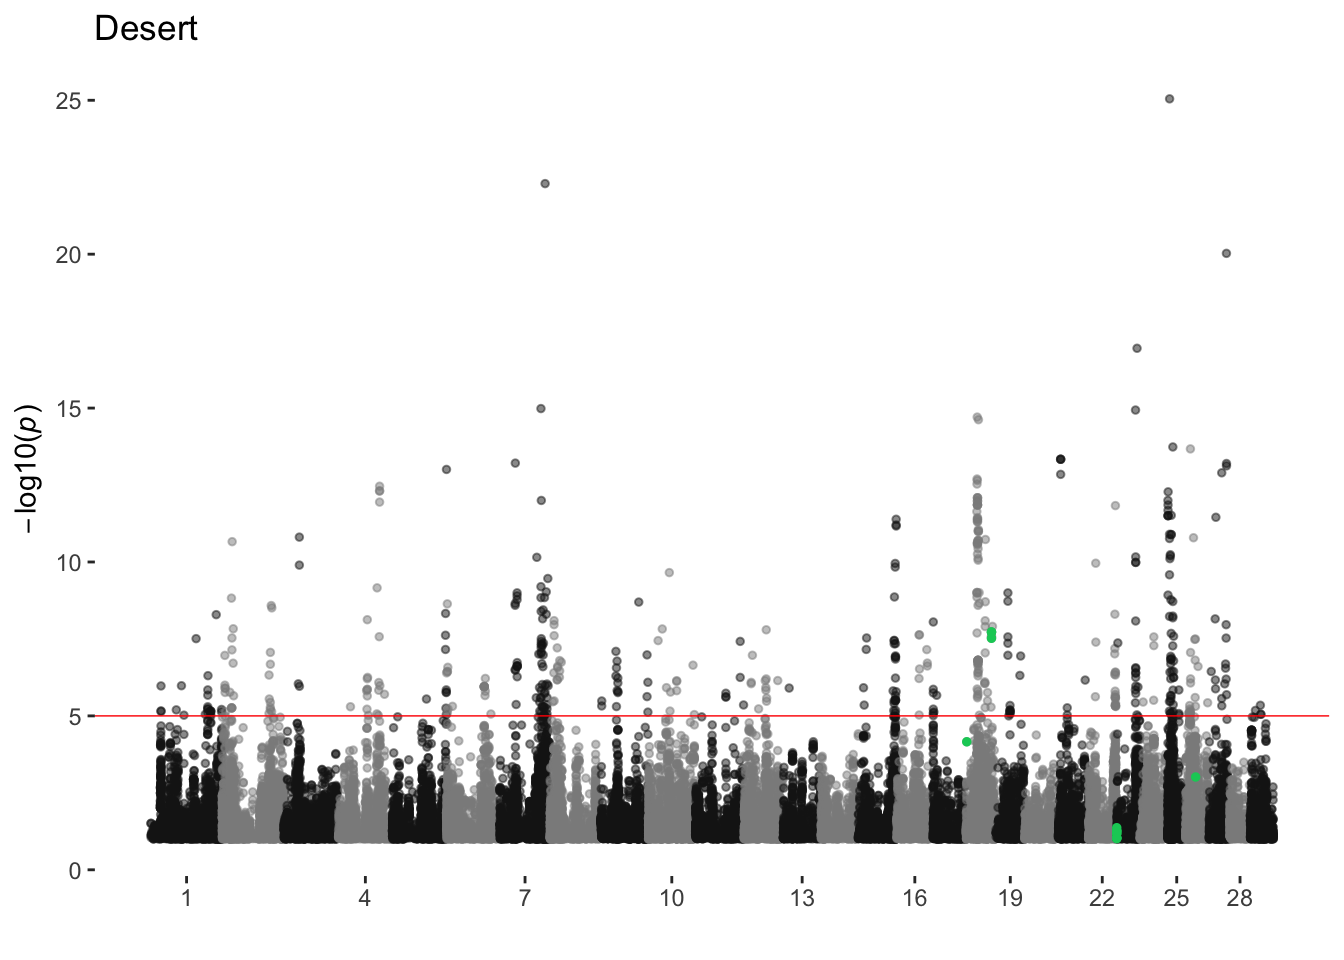
dewpoint
ran_manhattans[[4]]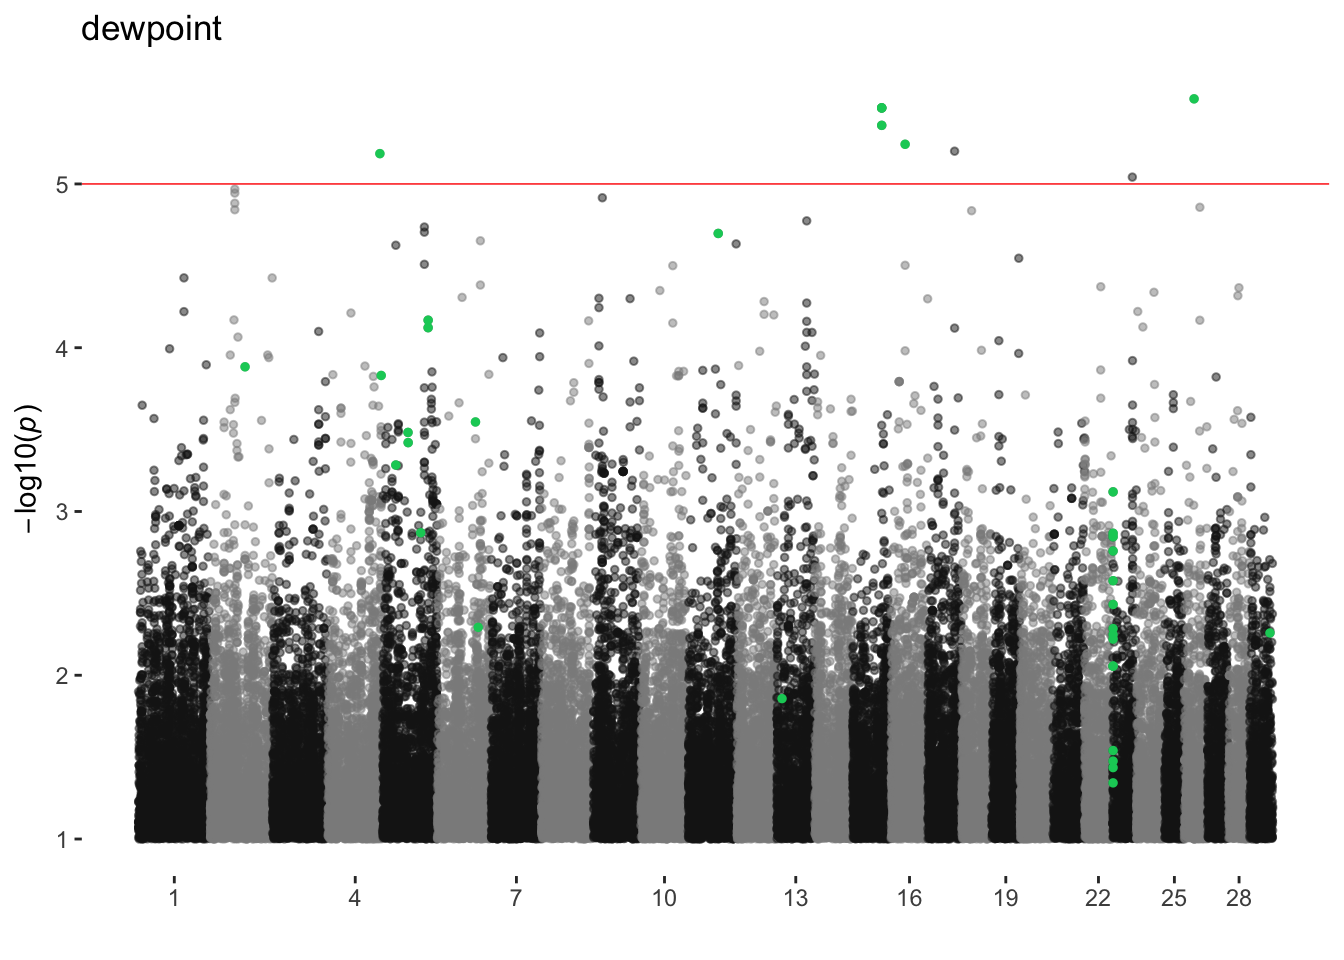
elev
ran_manhattans[[5]]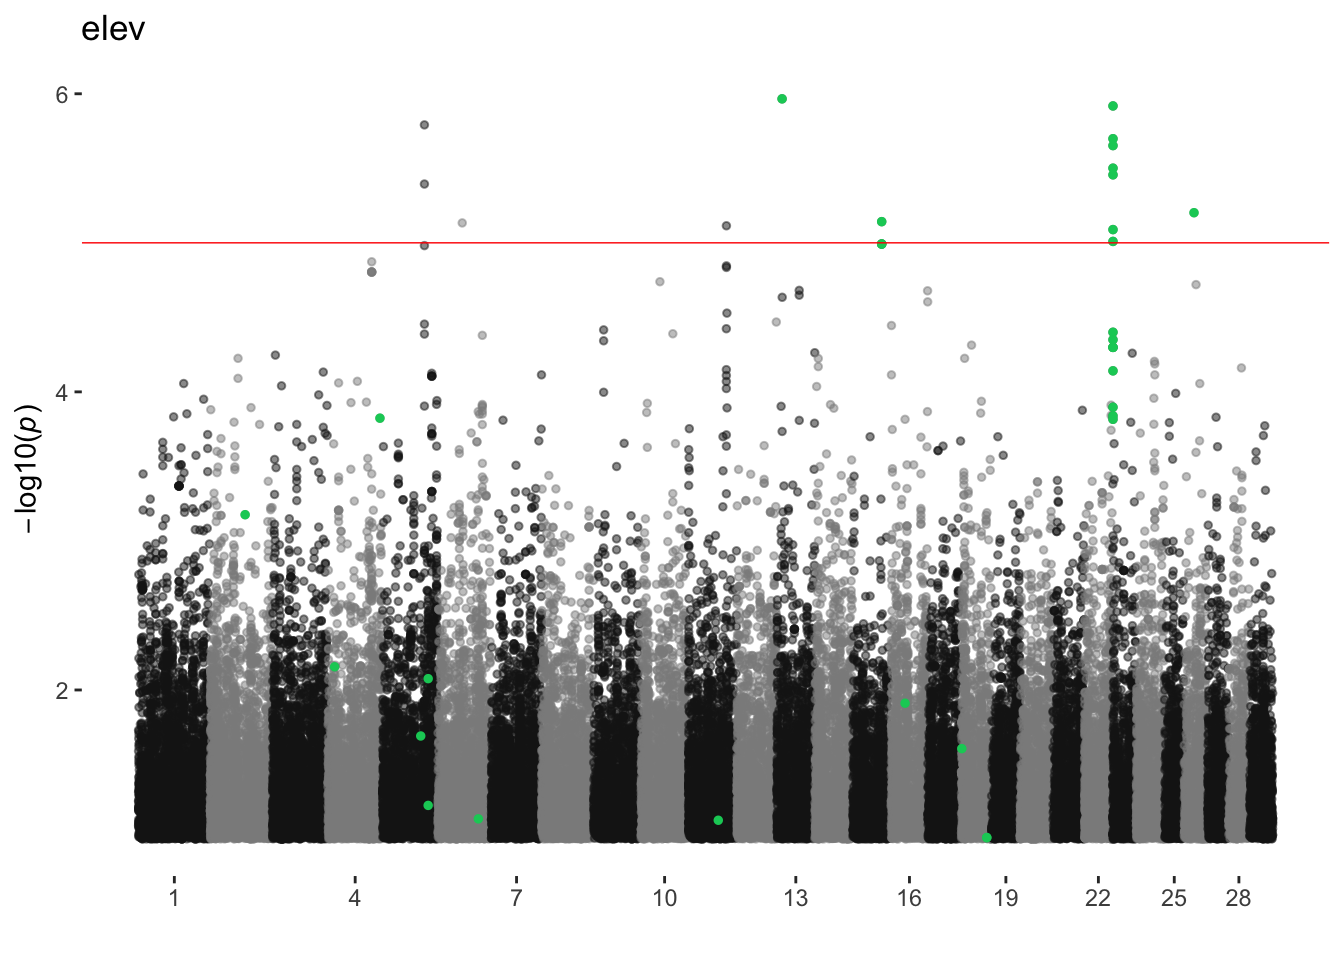
FescueBelt
ran_manhattans[[6]]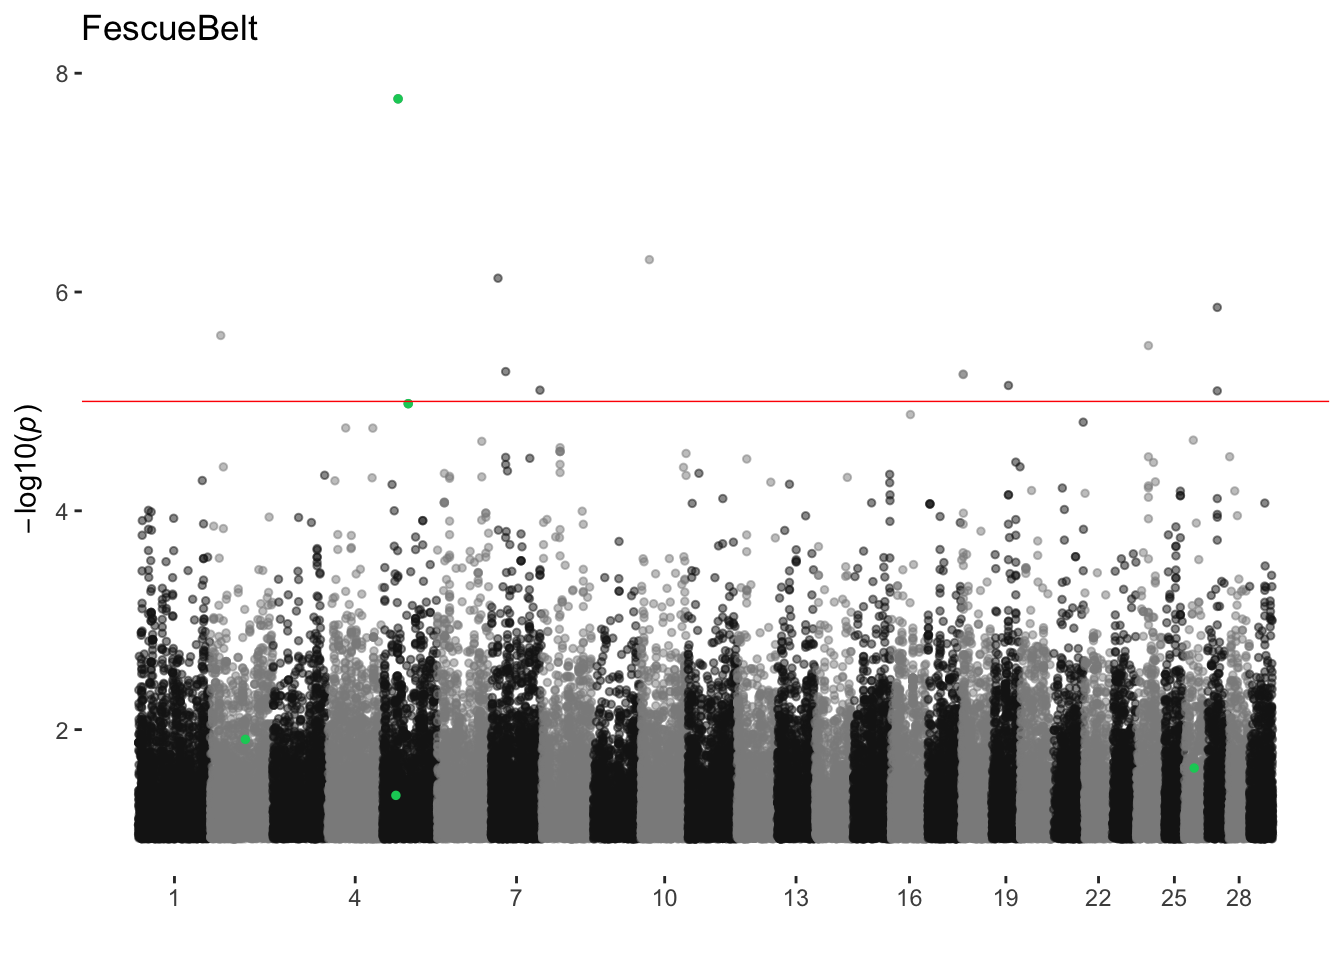
Foothills
ran_manhattans[[7]]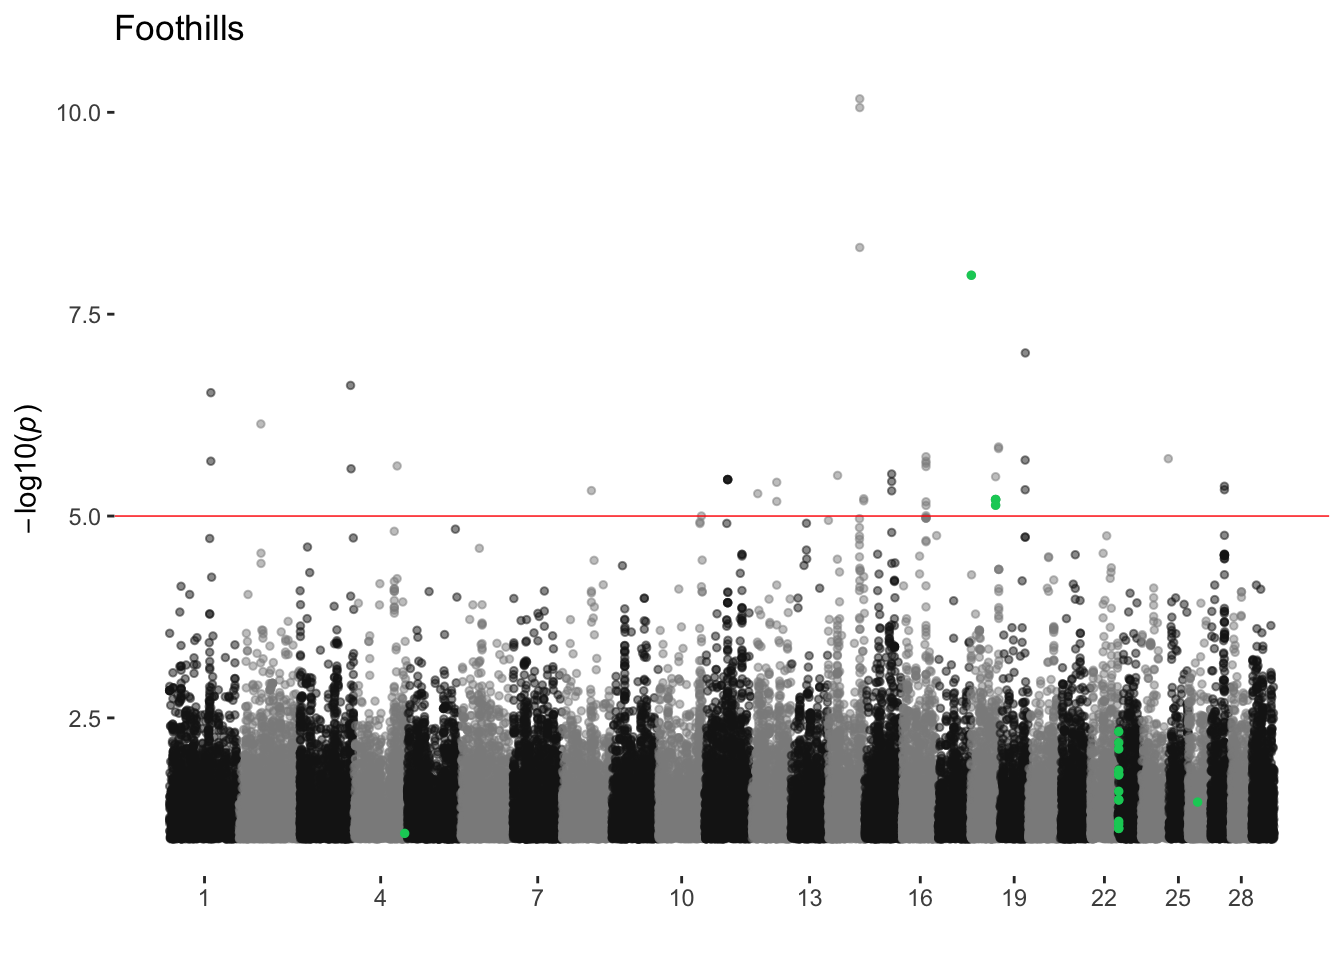
ForestedMountains
ran_manhattans[[8]]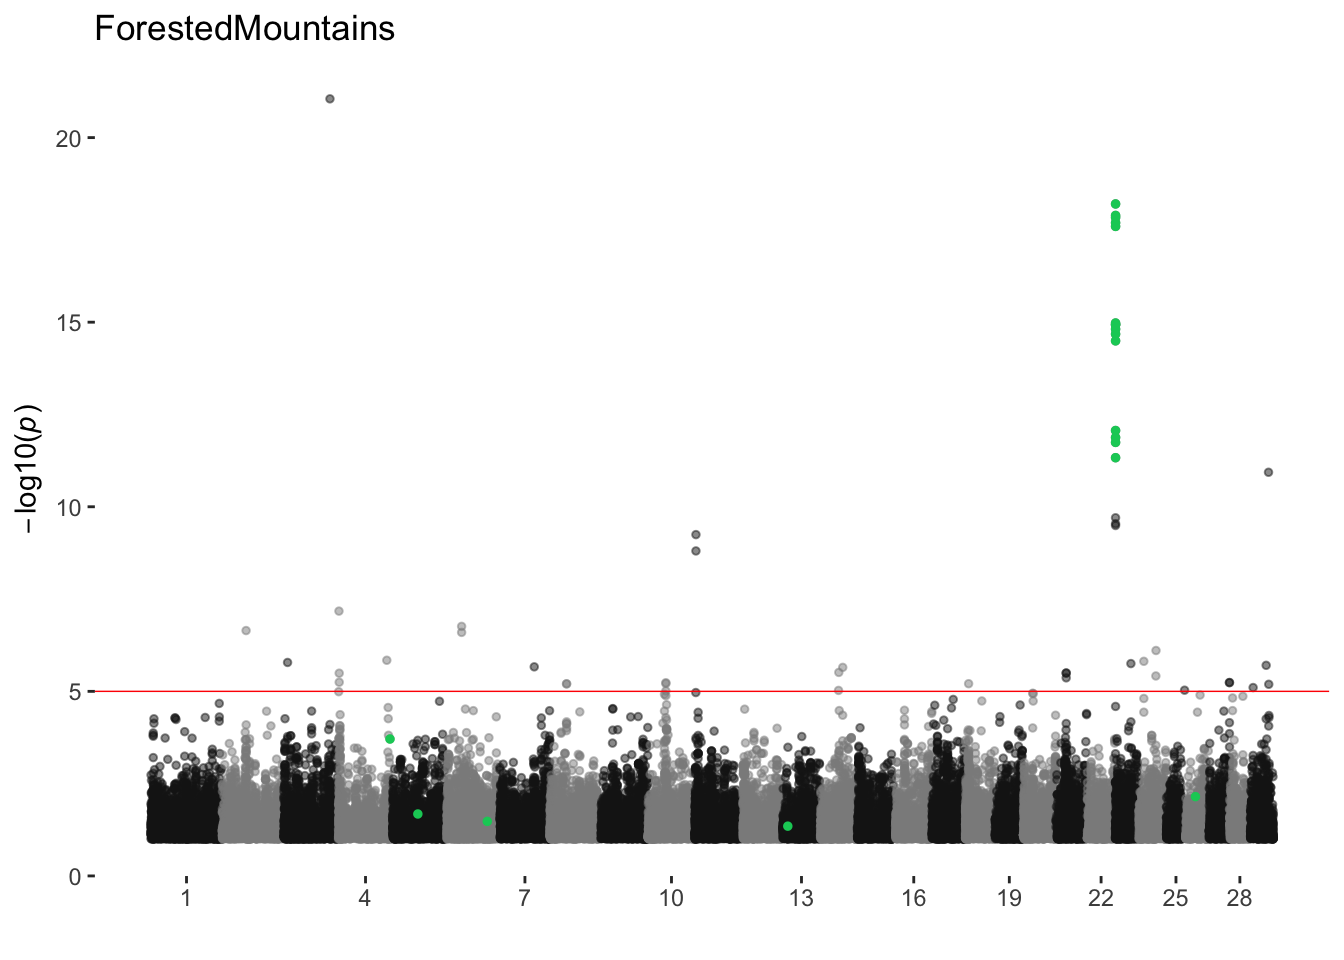
HighPlains
ran_manhattans[[9]]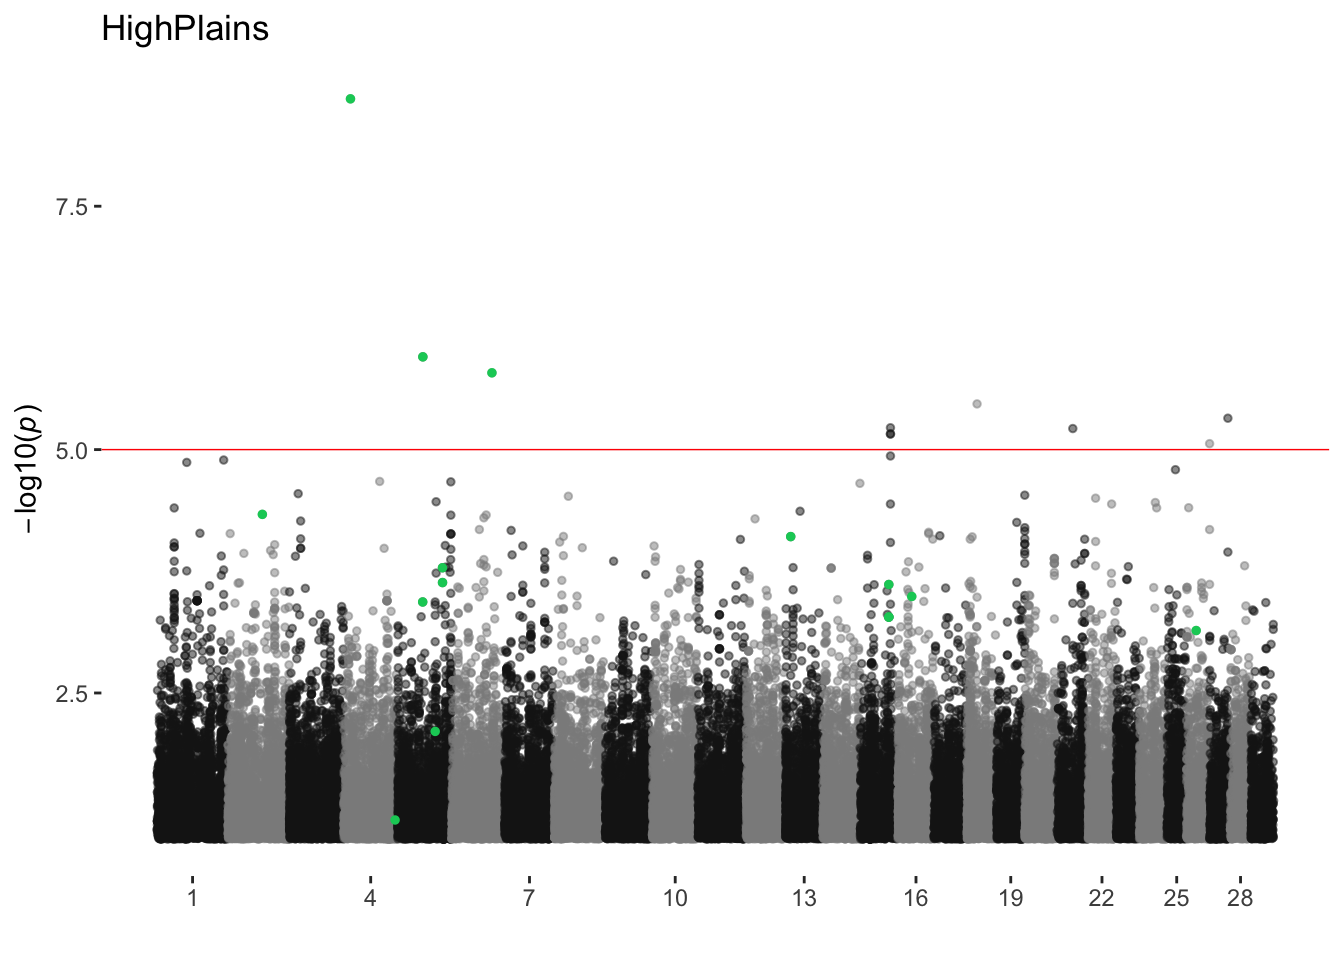
latitude
ran_manhattans[[10]]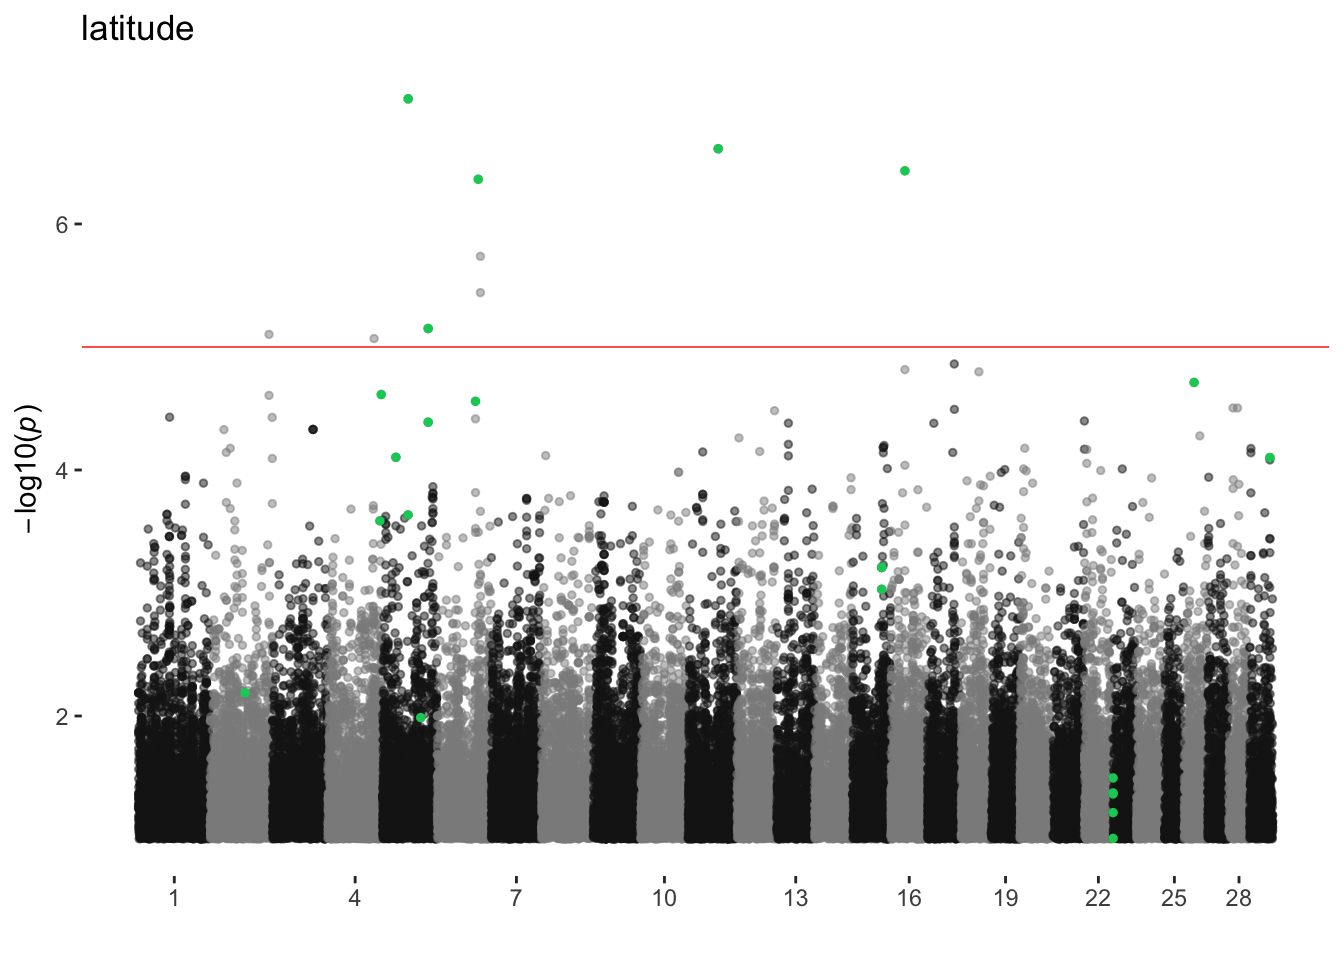
longitude
ran_manhattans[[11]]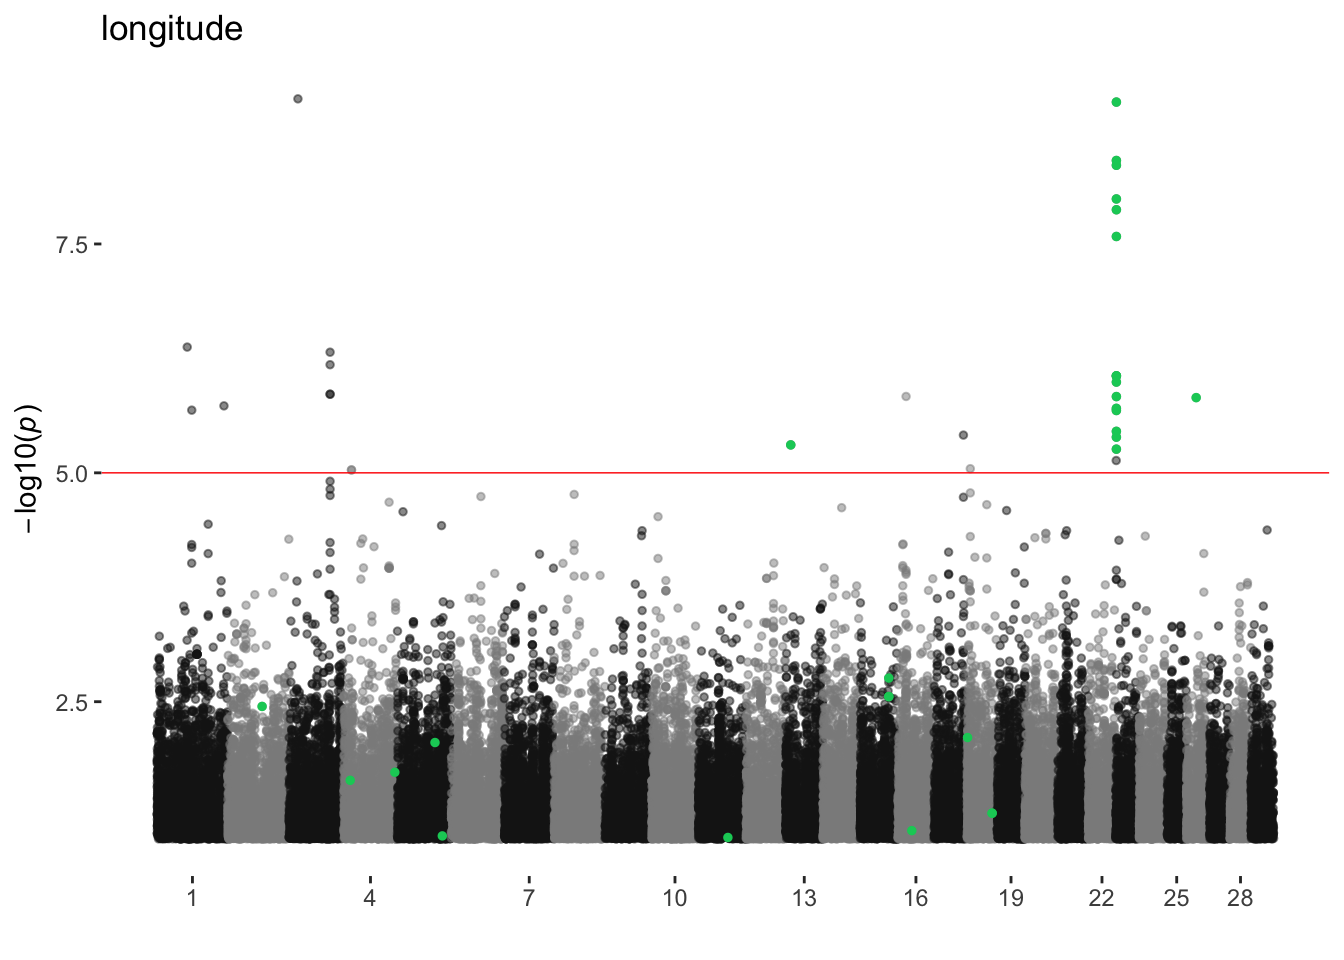
maxtemp
ran_manhattans[[12]]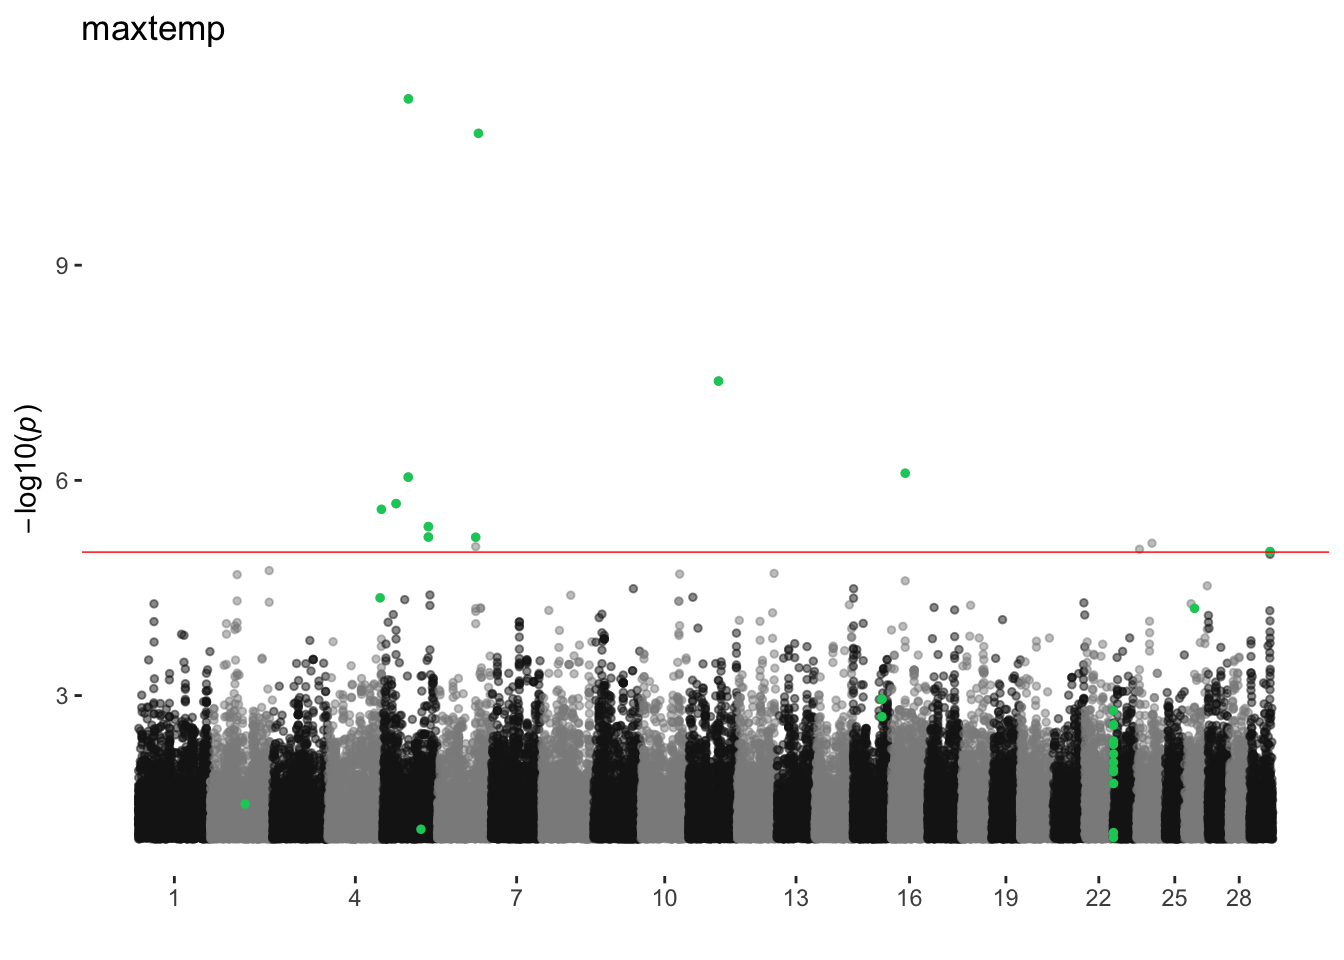
maxvap
ran_manhattans[[13]]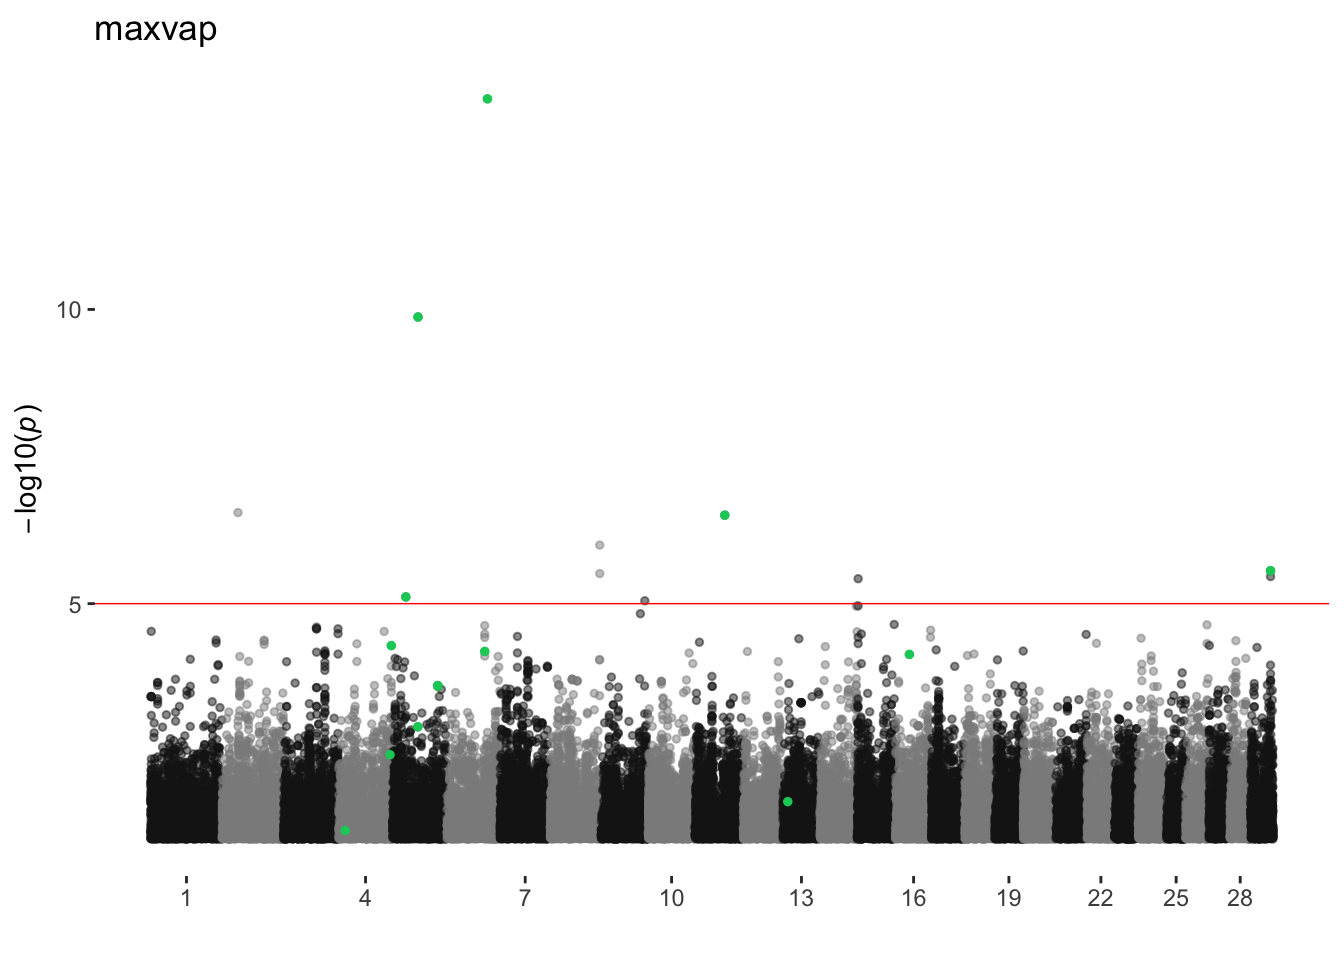
meantemp
ran_manhattans[[14]]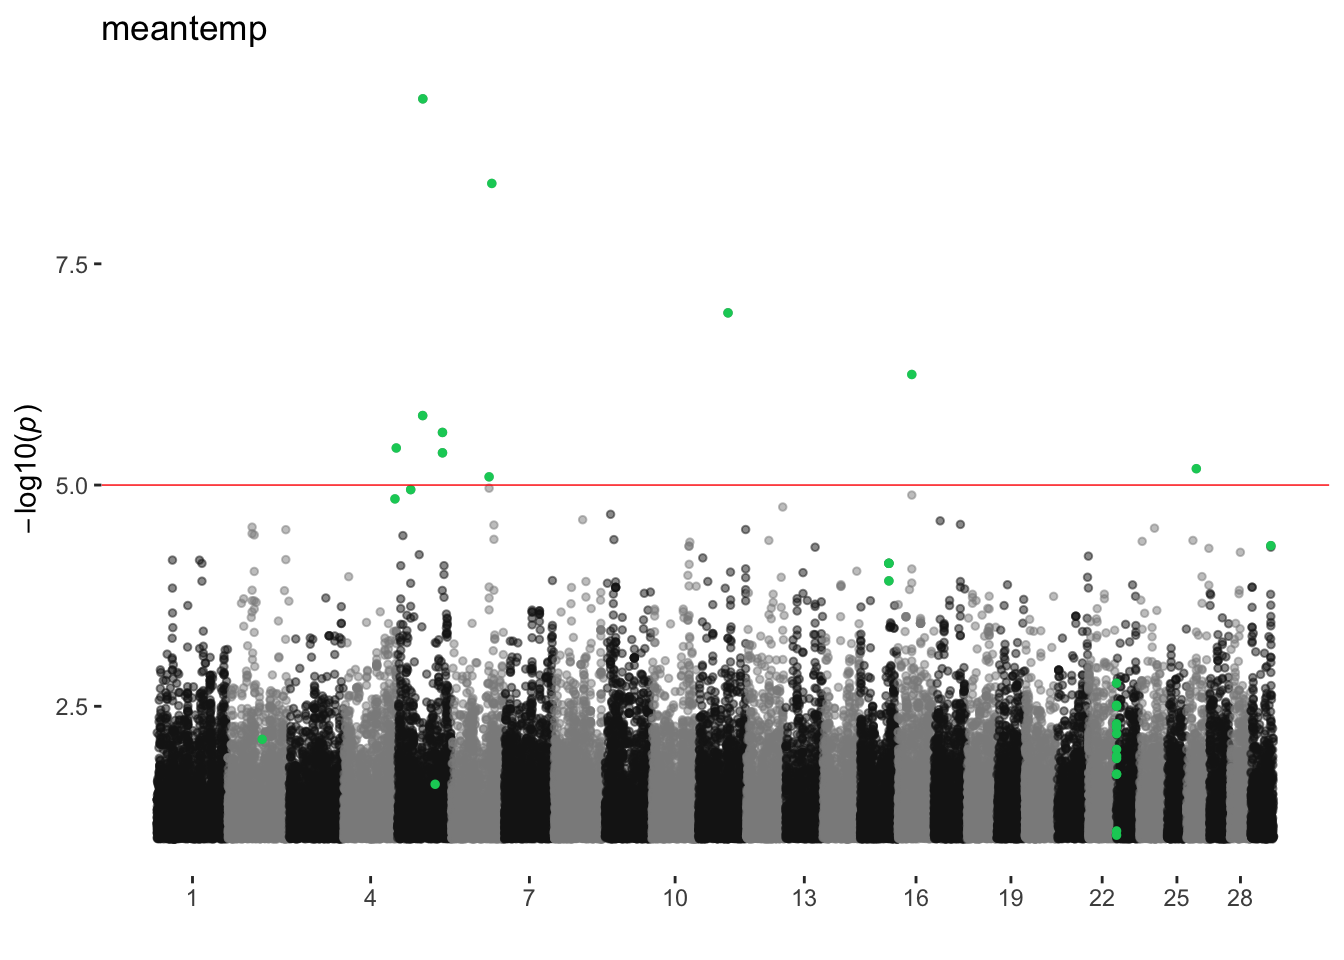
mintemp
ran_manhattans[[15]]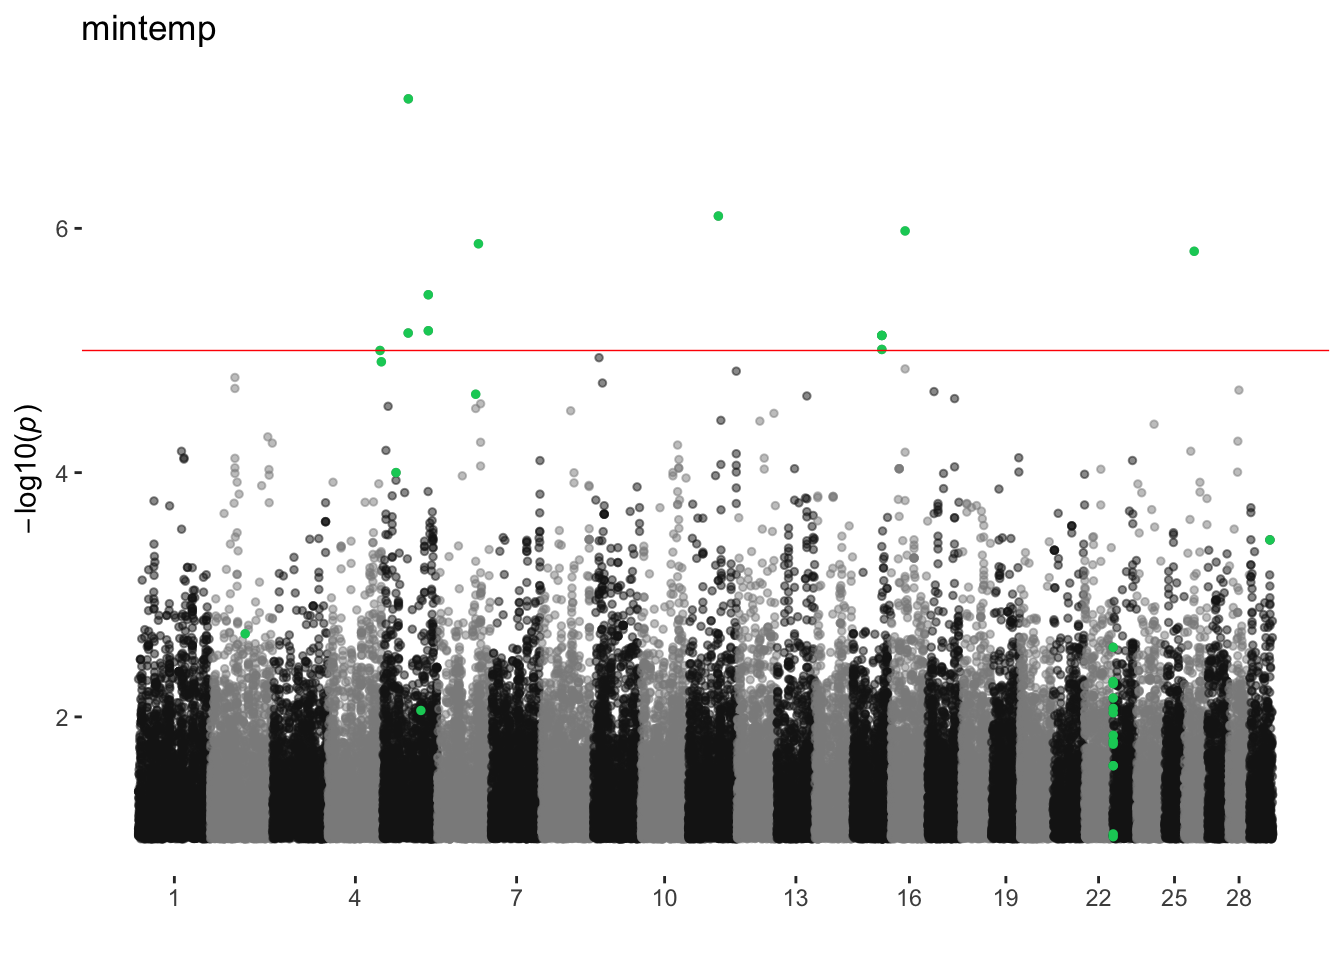
minvap
ran_manhattans[[16]]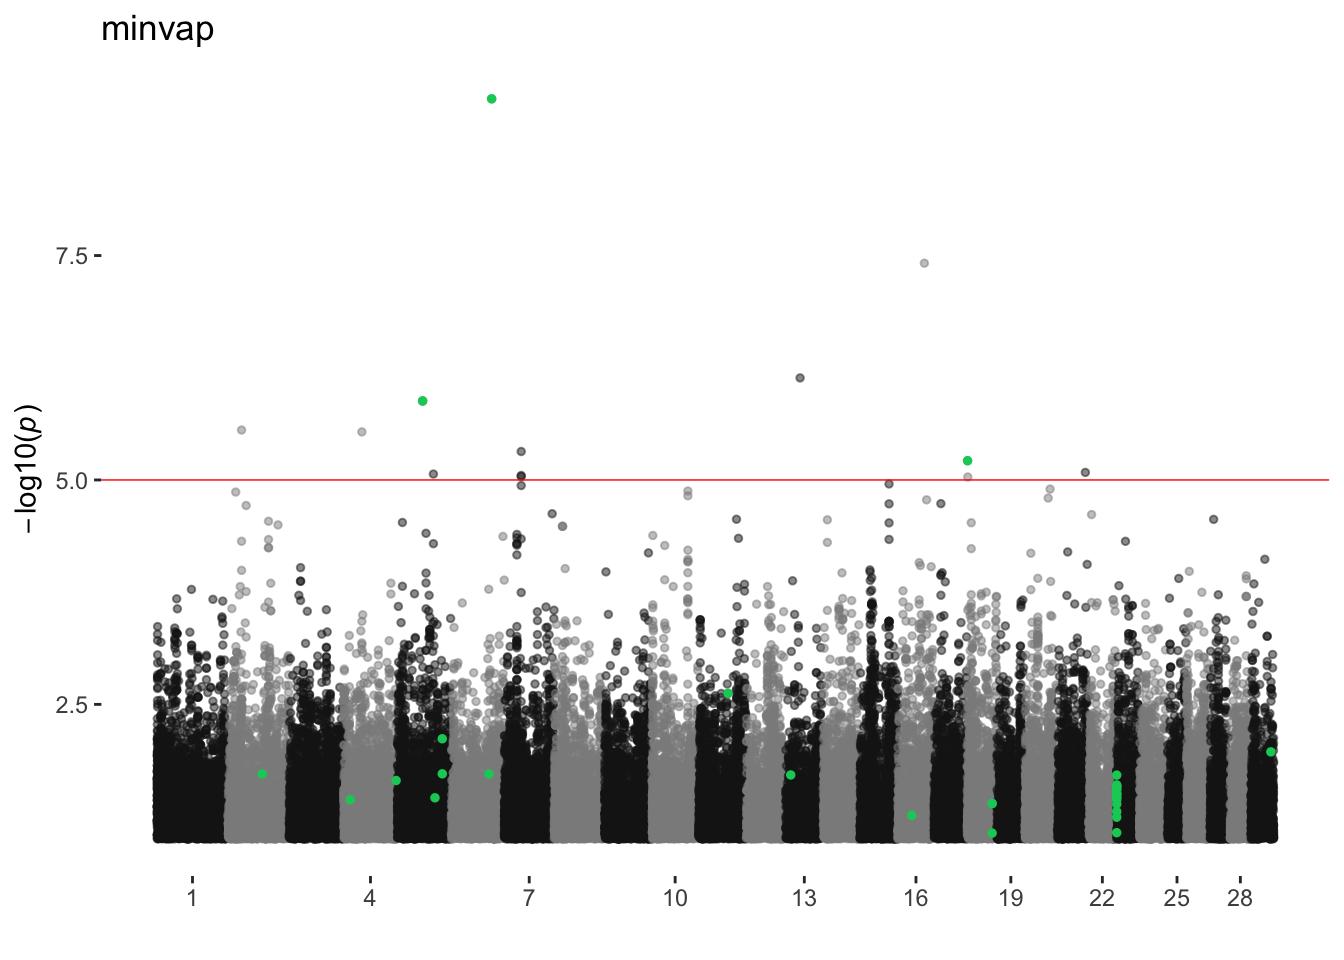
precip
ran_manhattans[[17]]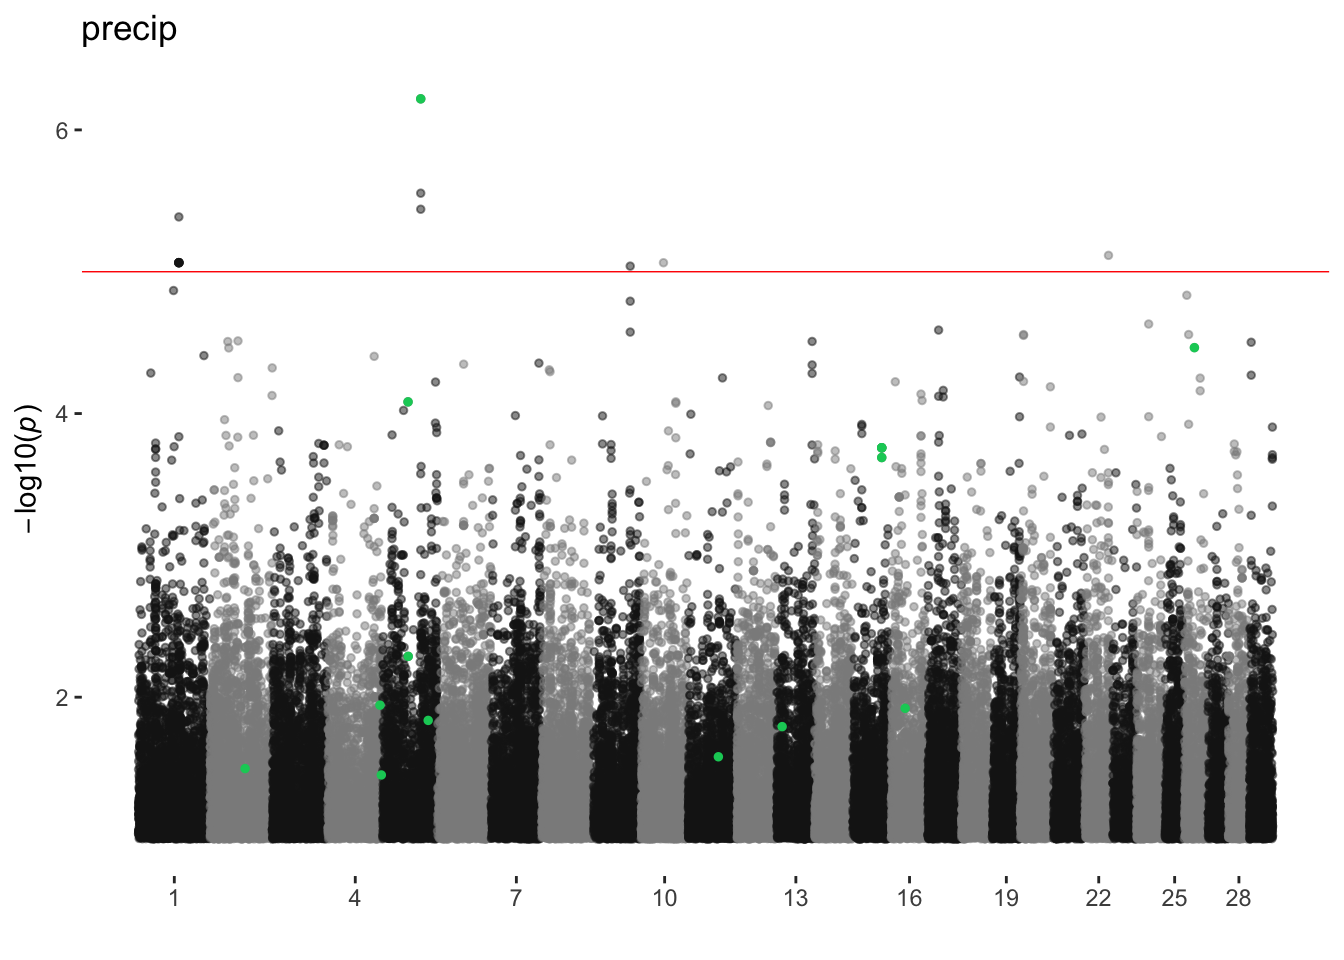
Southeast
ran_manhattans[[18]]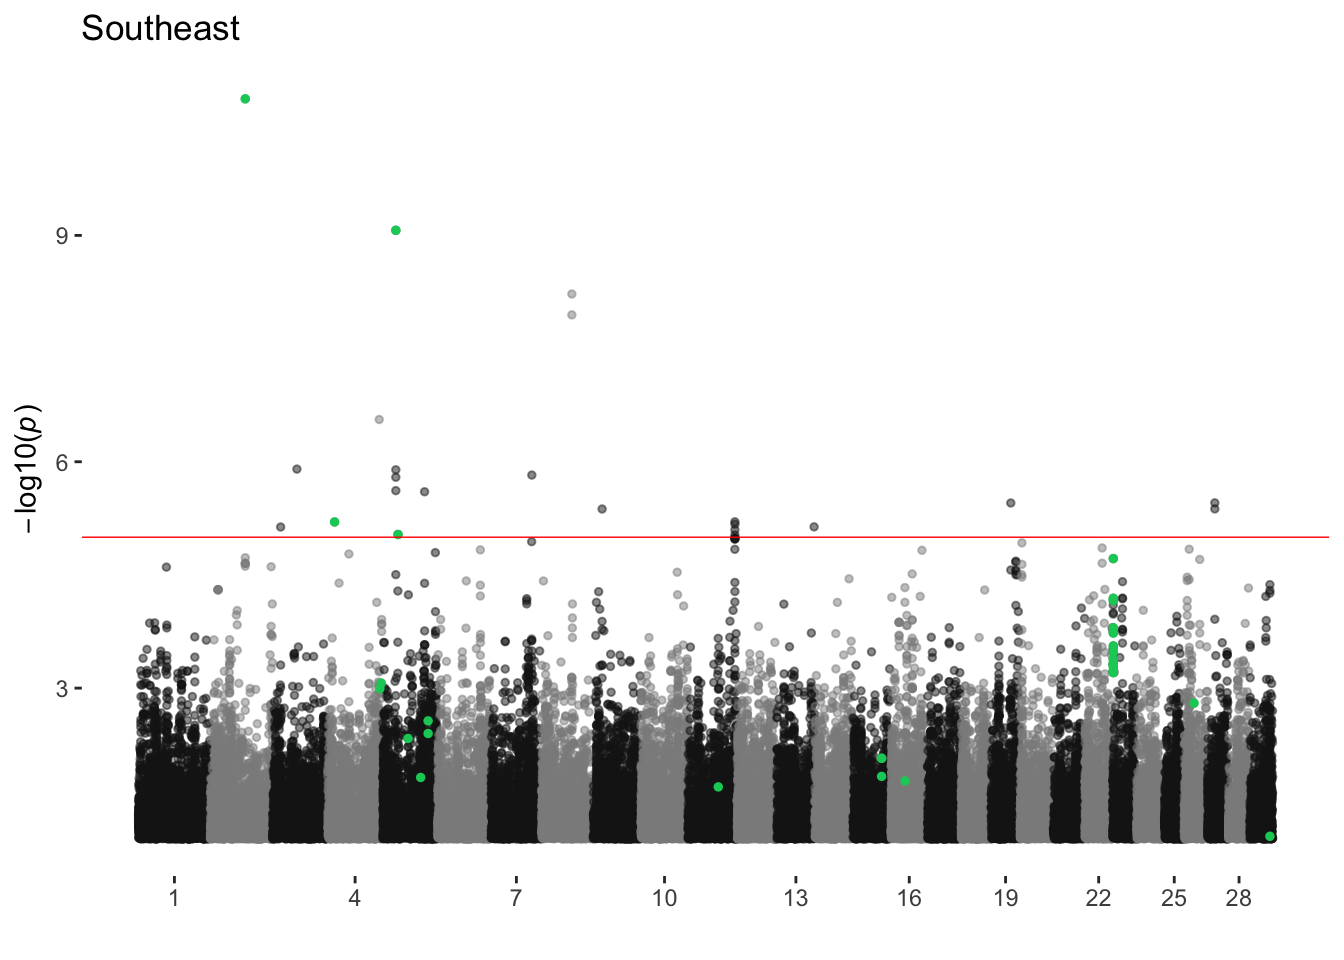
UpperMidwest
ran_manhattans[[19]]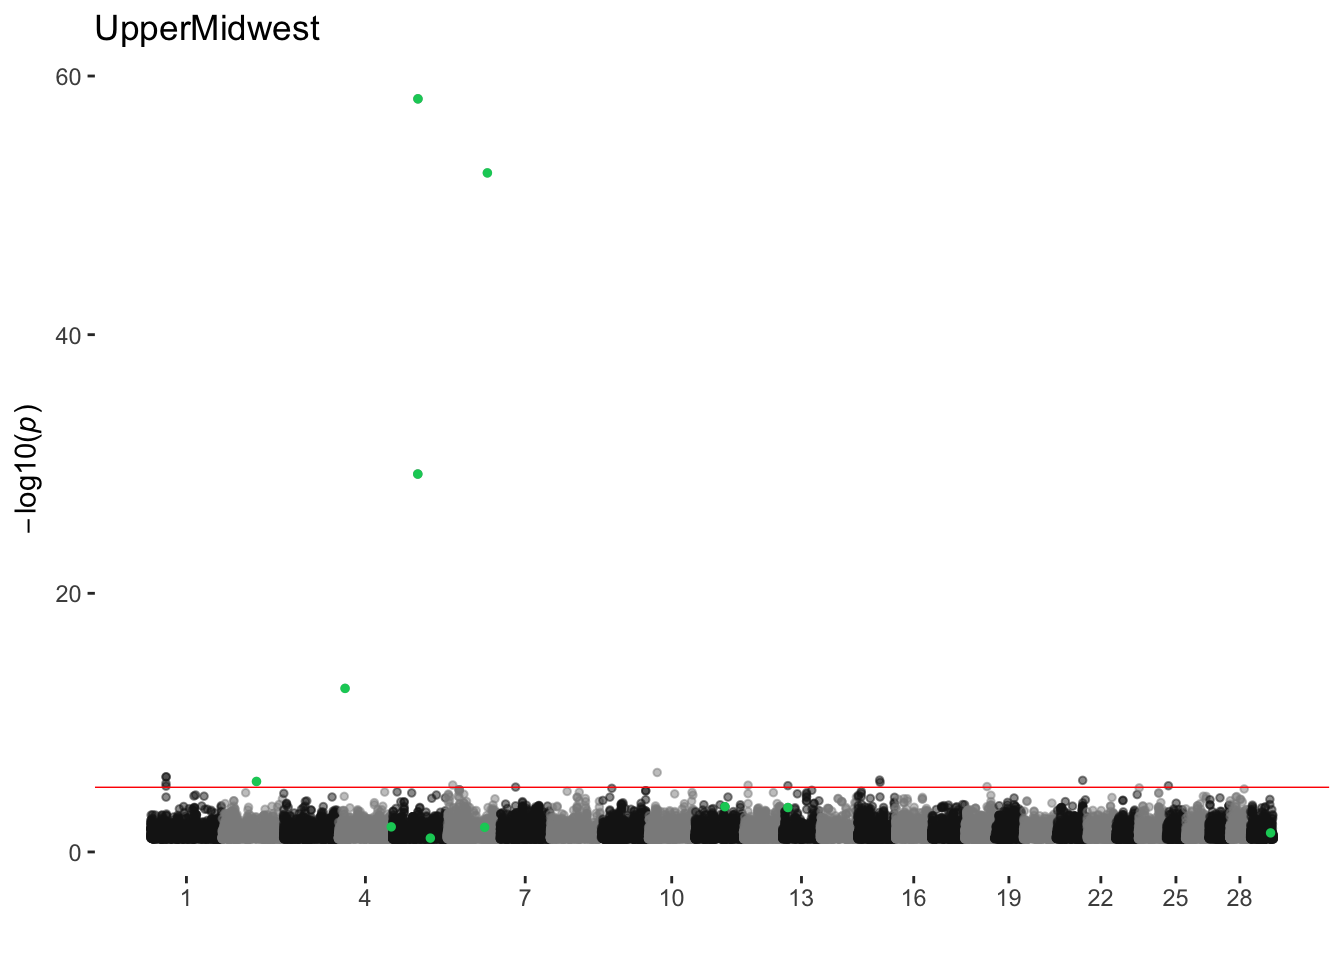
Annotating Genes
Skipping for now
Number of significant SNPs in each analysis at 850K level
Number of SNPs in each analysis that reaches genome-wide significance at 1) Bonferroni 2) p < 1e-5 3) q < 0.1
sim_envgwas %>%
  group_by(variable) %>%
  summarize(bonfCount = sum(p < 6e-8),
            pCount = sum(p < 1e-5),
            qCount = sum(q < 0.1))
# A tibble: 19 x 4
variable bonfCount pCount qCount
<chr> <int> <int> <int>
1 AridPrairie 0 29 11
2 CornBelt 0 16 3
3 Desert 26 158 334
4 dewpoint 1 8 3
5 elev 1 14 3
6 FescueBelt 0 11 0
7 Foothills 4 43 16
8 ForestedMountains 1 13 3
9 HighPlains 0 16 6
10 latitude 1 10 1
11 longitude 1 23 5
12 maxtemp 0 10 2
13 maxvap 0 11 0
14 meantemp 1 8 2
15 mintemp 1 9 2
16 minvap 1 27 1
17 precip 5 14 7
18 Southeast 0 15 0
19 UpperMidwest 0 10 0