Enichment-analysis-goseq
unawaz1996
2023-03-16
Last updated: 2023-03-17
Checks: 7 0
Knit directory: NMD-analysis/
This reproducible R Markdown analysis was created with workflowr (version 1.7.0). The Checks tab describes the reproducibility checks that were applied when the results were created. The Past versions tab lists the development history.
Great! Since the R Markdown file has been committed to the Git repository, you know the exact version of the code that produced these results.
Great job! The global environment was empty. Objects defined in the global environment can affect the analysis in your R Markdown file in unknown ways. For reproduciblity it’s best to always run the code in an empty environment.
The command set.seed(20230314) was run prior to running
the code in the R Markdown file. Setting a seed ensures that any results
that rely on randomness, e.g. subsampling or permutations, are
reproducible.
Great job! Recording the operating system, R version, and package versions is critical for reproducibility.
Nice! There were no cached chunks for this analysis, so you can be confident that you successfully produced the results during this run.
Great job! Using relative paths to the files within your workflowr project makes it easier to run your code on other machines.
Great! You are using Git for version control. Tracking code development and connecting the code version to the results is critical for reproducibility.
The results in this page were generated with repository version 84be588. See the Past versions tab to see a history of the changes made to the R Markdown and HTML files.
Note that you need to be careful to ensure that all relevant files for
the analysis have been committed to Git prior to generating the results
(you can use wflow_publish or
wflow_git_commit). workflowr only checks the R Markdown
file, but you know if there are other scripts or data files that it
depends on. Below is the status of the Git repository when the results
were generated:
Ignored files:
    Ignored:    .Rproj.user/

Untracked files:
    Untracked:  NMD-DEG-limma.xlsx
    Untracked:  analysis/Enichment-analysis-fgsea.Rmd
    Untracked:  analysis/Quality-control.Rmd
    Untracked:  data/LTK_Sample Metafile_V3.txt
    Untracked:  data/fastqc/
    Untracked:  output/DEG-limma-results.Rda
    Untracked:  output/DEG-list.Rda
    Untracked:  output/limma-matrices.Rda

Unstaged changes:
    Modified:   analysis/DEG-analysis.Rmd
    Modified:   code/libraries.R
Note that any generated files, e.g. HTML, png, CSS, etc., are not included in this status report because it is ok for generated content to have uncommitted changes.
These are the previous versions of the repository in which changes were
made to the R Markdown
(analysis/Enichment-analysis-goseq.Rmd) and HTML
(docs/Enichment-analysis-goseq.html) files. If you’ve
configured a remote Git repository (see ?wflow_git_remote),
click on the hyperlinks in the table below to view the files as they
were in that past version.
| File | Version | Author | Date | Message |
|---|---|---|---|---|
| Rmd | 84be588 | unawaz1996 | 2023-03-17 | Enrichment analysis |
Enrichment analysis using goseq
source("code/libraries.R")
source("code/functions.R")
load("output/limma-matrices.Rda")
load("output/DEG-limma-results.Rda")
load("output/DEG-list.Rda")Testing for enrichment within discrete sets of DE genes as defined in the DEG analysis
Databases used for testing
Data was sourced using the misigdbr package.
Hallmark gene sets
C2 gene set
Gene Ontology Gene set
Enrichment in the DE Gene Set
goseqis an R package that performs enrichment analysis whilst taking length bias into account. It does so by calculating a Probability Weighting Function (PWF), which gives the probability that a gene will be differentially expressed based on length alone.
The PWD is calculated by fitting a monotonic spline to the binary data series of differential expression (1 = DE, 0= Not DE) as a function of gene length. The PWF is used to weight the chance of selecting each gene when forming a null distribution for GO category membership. The fact that the PWF is calculated directly from the dataset under consideration makes this approach robust, only correcting for the length bias present in the data.
Results can be intrepreted as following:
overrpresented p-value: Over representation in this analysis means that there are more DE genes in categort than expected. P-value relates to the probability of observing this number of DE genes in category by chancenumDEinCat: number of DE genes in categoryExpected: Expected number of genes in categoryadjP: Bonferroni adjustment of over represented p-valueFDR: FDR adjustment of over represented p-value
The first step of analysis using goseq, regardless of the gene-set, is estimation of the probability weight function (PWF) which quantifies the probability of a gene being considered as DE based on a single covariate.
load("/home/neuro/Documents/NMD_analysis/Analysis/Genome/mouse_length.Rda")
comparisons = c("UPF3B_vs_Control", "UPF3A_vs_Control",
"UPF3A_OE_vs_Control", "DoubleKD_vs_Control", "UPF3A_OE_UPF3B_KD_vs_Control")- GO terms
For gene ontology analysis, we will be using the GO summaries method.
Essentially, this analysis involves creating a graph for each ontology
term, and removing the node all, as this redundant. For
each GO term, we get the ontology it belongs to, the shortest path back
to the root note, the longest path to the root node and whether it GO
term is a terminal node.
gene_ontologies = list()
for (c in comparisons){
    analysis = limma_results %>% dplyr::select(ensembl_gene_id, contains(c))
    colnames(analysis) = gsub(paste0(".", c), "", colnames(analysis))
    genes = as.integer(analysis$Res == 1  | analysis$Res == -1)
    not_na = !is.na(genes)
    names(genes) = analysis$ensembl_gene_id
    genes = genes[not_na]
    gene_ont = get_ontologies(genes = genes)
    gene_ont %<>% as.data.frame() %>%
        mutate(Comparison = c(c))
    gene_ontologies[[paste0(c)]] = gene_ont
    }
Using GO from GOseqFetching GO annotations...Calculating the p-values...'select()' returned 1:1 mapping between keys and columnsJoining with `by = join_by(id, ontology)`Warning in pcls(G): initial point very close to some inequality constraintsUsing GO from GOseq
Fetching GO annotations...
Calculating the p-values...
'select()' returned 1:1 mapping between keys and columns
Joining with `by = join_by(id, ontology)`Using GO from GOseq
Fetching GO annotations...
Calculating the p-values...
'select()' returned 1:1 mapping between keys and columns
Joining with `by = join_by(id, ontology)`Warning in pcls(G): initial point very close to some inequality constraintsUsing GO from GOseq
Fetching GO annotations...
Calculating the p-values...
'select()' returned 1:1 mapping between keys and columns
Joining with `by = join_by(id, ontology)`Using GO from GOseq
Fetching GO annotations...
Calculating the p-values...
'select()' returned 1:1 mapping between keys and columns
Joining with `by = join_by(id, ontology)`UPF3B
gene_ontologies$UPF3B_vs_Control$Genes = sapply(gene_ontologies$UPF3B_vs_Control$EnsemblID, function(x){
            tmp = strsplit(as.character(x), ",") %>% unlist()
            tmp %<>% as.data.frame() %>% mutate_if(is.character, str_trim)
            tmp = tmp[[1]]
            tmp = mapIds(org.Mm.eg.db, keys=tmp,  column="SYMBOL",keytype="ENSEMBL", multiVals="first") %>%
                unname
            return(tmp)
        })
'select()' returned 1:1 mapping between keys and columns
'select()' returned 1:1 mapping between keys and columns
'select()' returned 1:1 mapping between keys and columns
'select()' returned 1:1 mapping between keys and columns
'select()' returned 1:1 mapping between keys and columns
'select()' returned 1:1 mapping between keys and columns
'select()' returned 1:1 mapping between keys and columnsgene_ontologies$UPF3B_vs_Control$Genes = vapply(gene_ontologies$UPF3B_vs_Control$Genes, paste, collapse = ", ", character(1L))
gene_ontologies$UPF3B_vs_Control %>%
dplyr::select(-c("Comparison", contains("Sig"), EnsemblID, shortest_path, longest_path, terminal_node)) %>%
DT::datatable(filter = 'top', extensions = c('Buttons', 'FixedColumns'),
caption ="Significant gene ontology terms in UPF3B KD compared to controls",
options = list(scrollX = TRUE,
scrollCollapse = TRUE,
pageLength = 5, autoWidth = TRUE,
dom = 'Blfrtip',
buttons = c('copy', 'csv', 'excel', 'pdf', 'colvis'),
lengthMenu = list(c(10,25,50,-1),
c(10,25,50,"All"))))terms = gene_ontologies$UPF3B_vs_Control %>%
dplyr::rename(ID = id, Category = ontology, adj_pval = adjP)
genes = DEGenes$UPF3B_vs_Control %>%
dplyr::select(gene, contains("UPF3B_vs_Control")) %>%
dplyr::rename(ID = gene, logFC = Coef.UPF3B_vs_Control)
goplot_data = circle_dat(terms, genes)
processes = unique(goplot_data$term)
genes_of_interest = goplot_data %>%
dplyr::select(genes, logFC) %>% distinct(genes, logFC, .keep_all = TRUE) #%>%
#with(structure(logFC, names = genes))
chord= chord_dat(goplot_data, genes_of_interest, processes)
GOChord(chord, space = 0.02, gene.order = 'logFC', gene.space = 0.25, gene.size = 5, ribbon.col = c("red", "yellow", "orange", "blue", "green", "purple", "pink"),
border.size = 0.25)Warning: Using size for a discrete variable is not advised.Warning: Removed 7 rows containing missing values (`geom_point()`).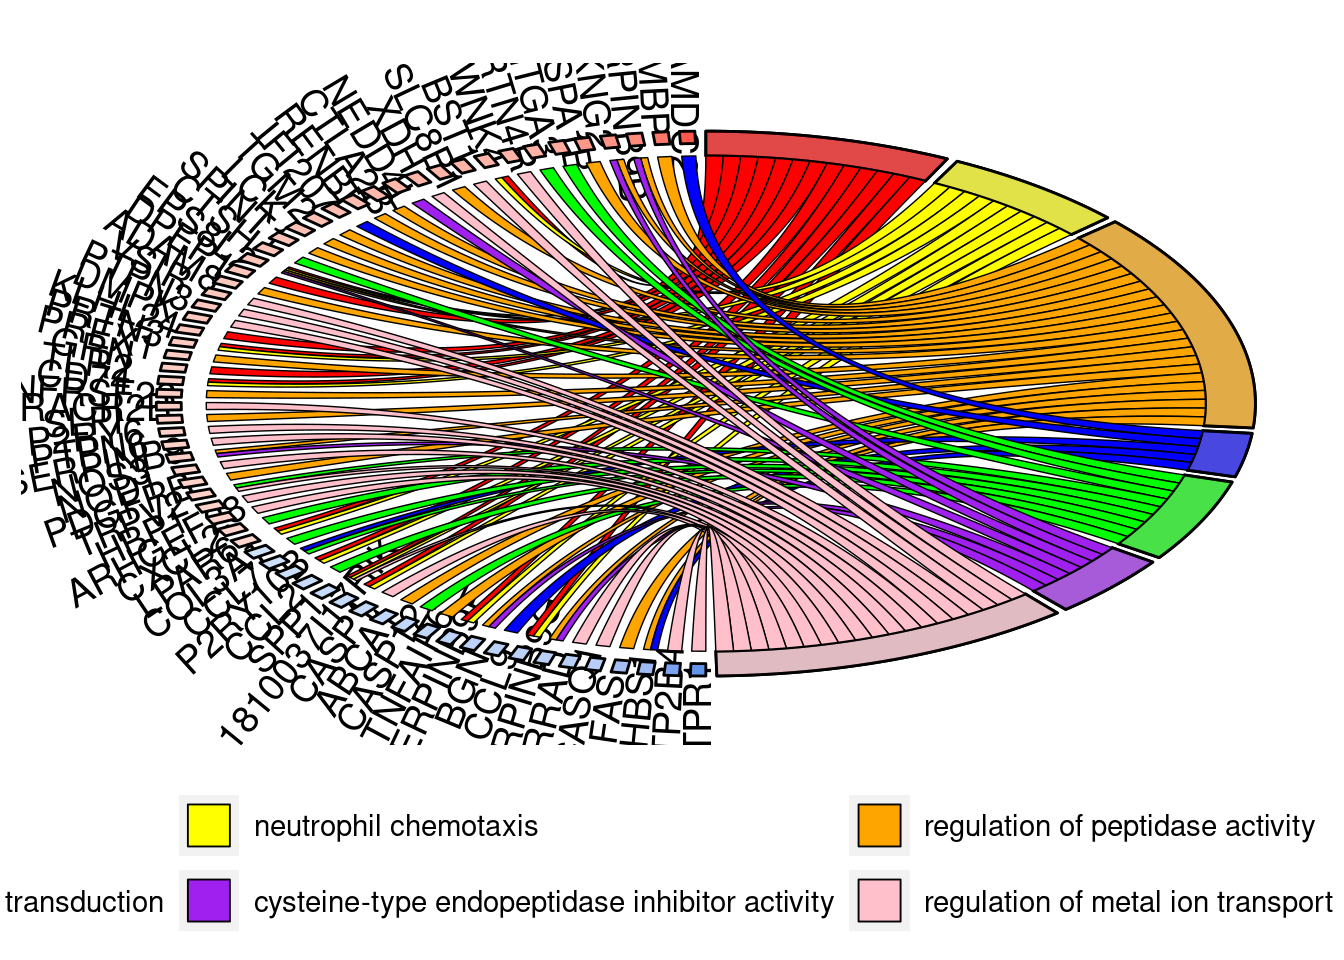
UPF3A KD
gene_ontologies$UPF3A_vs_Control$Genes = sapply(gene_ontologies$UPF3A_vs_Control$EnsemblID, function(x){
tmp = strsplit(as.character(x), ",") %>% unlist()
tmp %<>% as.data.frame() %>% mutate_if(is.character, str_trim)
tmp = tmp[[1]]
tmp = mapIds(org.Mm.eg.db, keys=tmp, column="SYMBOL",keytype="ENSEMBL", multiVals="first") %>%
unname
return(tmp)
})'select()' returned 1:1 mapping between keys and columns
'select()' returned 1:1 mapping between keys and columns
'select()' returned 1:1 mapping between keys and columns
'select()' returned 1:1 mapping between keys and columns
'select()' returned 1:1 mapping between keys and columnsgene_ontologies$UPF3A_vs_Control$Genes = vapply(gene_ontologies$UPF3A_vs_Control$Genes, paste, collapse = ", ", character(1L))
gene_ontologies$UPF3A_vs_Control %>%
dplyr::select(-c("Comparison", contains("Sig"), EnsemblID, shortest_path, longest_path, terminal_node)) %>%
DT::datatable(filter = 'top', extensions = c('Buttons', 'FixedColumns'),
caption ="Significant gene ontology terms in UPF3A KD compared to controls",
options = list(scrollX = TRUE,
scrollCollapse = TRUE,
pageLength = 5, autoWidth = TRUE,
dom = 'Blfrtip',
buttons = c('copy', 'csv', 'excel', 'pdf', 'colvis'),
lengthMenu = list(c(10,25,50,-1),
c(10,25,50,"All"))))terms = gene_ontologies$UPF3A_vs_Control %>%
dplyr::rename(ID = id, Category = ontology, adj_pval = adjP)
genes = DEGenes$UPF3A_vs_Control %>%
dplyr::select(gene, contains("UPF3A_vs_Control")) %>%
dplyr::rename(ID = gene, logFC = Coef.UPF3A_vs_Control)
goplot_data = circle_dat(terms, genes)
processes = unique(goplot_data$term)
genes_of_interest = goplot_data %>%
dplyr::select(genes, logFC) %>% distinct(genes, logFC, .keep_all = TRUE) #%>%
#with(structure(logFC, names = genes))
chord= chord_dat(goplot_data, genes_of_interest, processes)
GOChord(chord, space = 0.02, gene.order = 'logFC', gene.space = 0.25, gene.size = 5,
border.size = 0.25)Warning: Using size for a discrete variable is not advised.Warning: Removed 5 rows containing missing values (`geom_point()`).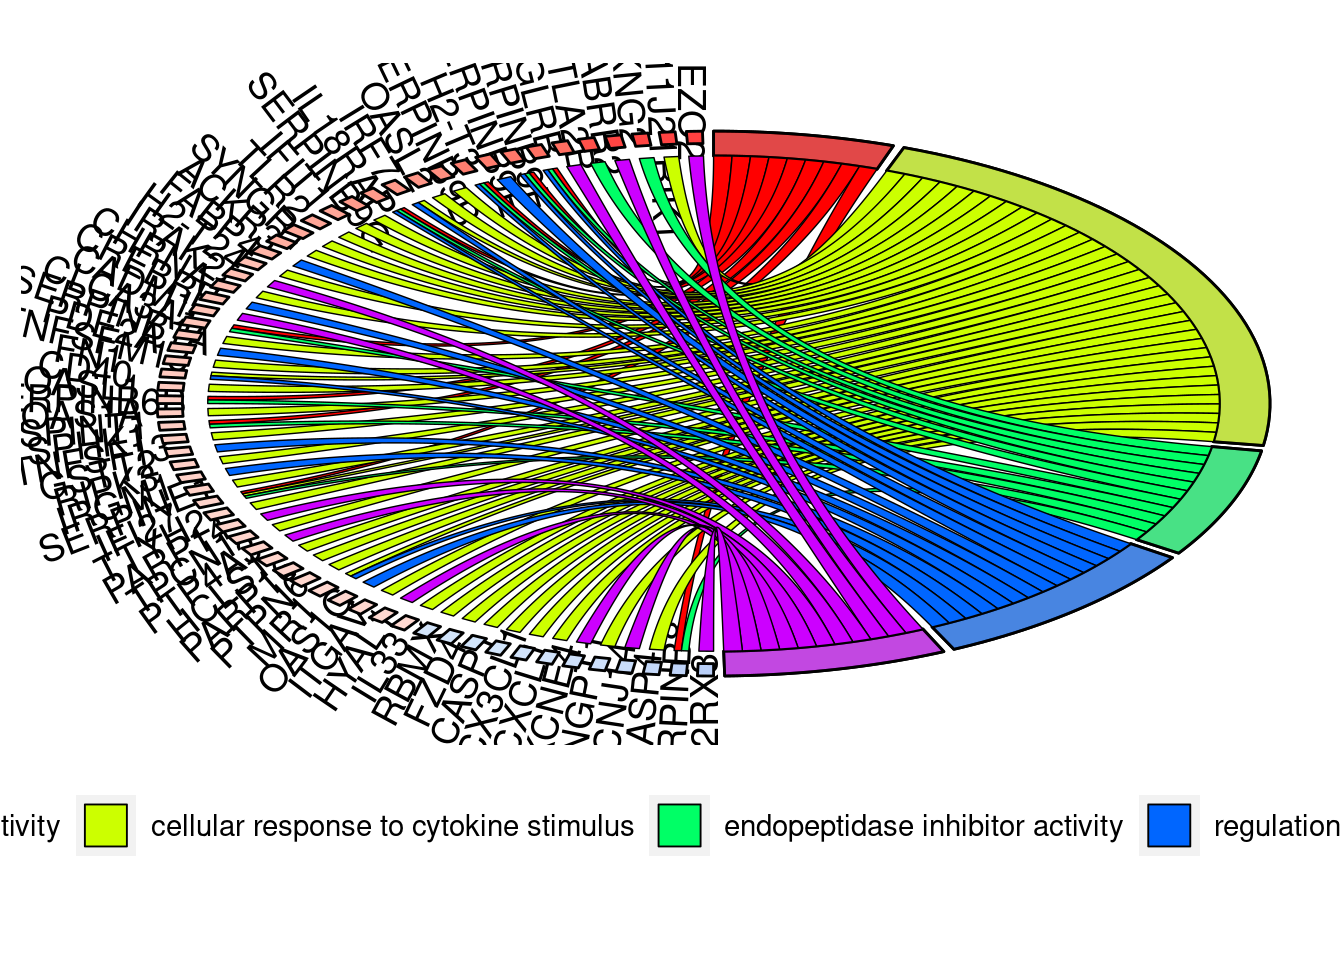
Double KD
gene_ontologies$DoubleKD_vs_Control$Genes = sapply(gene_ontologies$DoubleKD_vs_Control$EnsemblID, function(x){
tmp = strsplit(as.character(x), ",") %>% unlist()
tmp %<>% as.data.frame() %>% mutate_if(is.character, str_trim)
tmp = tmp[[1]]
tmp = mapIds(org.Mm.eg.db, keys=tmp, column="SYMBOL",keytype="ENSEMBL", multiVals="first") %>%
unname
return(tmp)
})'select()' returned 1:1 mapping between keys and columns
'select()' returned 1:1 mapping between keys and columns
'select()' returned 1:1 mapping between keys and columns
'select()' returned 1:1 mapping between keys and columns
'select()' returned 1:1 mapping between keys and columns
'select()' returned 1:1 mapping between keys and columns
'select()' returned 1:1 mapping between keys and columns
'select()' returned 1:1 mapping between keys and columns
'select()' returned 1:1 mapping between keys and columns
'select()' returned 1:1 mapping between keys and columns
'select()' returned 1:1 mapping between keys and columns
'select()' returned 1:1 mapping between keys and columns
'select()' returned 1:1 mapping between keys and columns
'select()' returned 1:1 mapping between keys and columns
'select()' returned 1:1 mapping between keys and columns
'select()' returned 1:1 mapping between keys and columns
'select()' returned 1:1 mapping between keys and columns
'select()' returned 1:1 mapping between keys and columns
'select()' returned 1:1 mapping between keys and columns
'select()' returned 1:1 mapping between keys and columns
'select()' returned 1:1 mapping between keys and columns
'select()' returned 1:1 mapping between keys and columns
'select()' returned 1:1 mapping between keys and columns
'select()' returned 1:1 mapping between keys and columns
'select()' returned 1:1 mapping between keys and columns
'select()' returned 1:1 mapping between keys and columns
'select()' returned 1:1 mapping between keys and columns
'select()' returned 1:1 mapping between keys and columns
'select()' returned 1:1 mapping between keys and columnsgene_ontologies$DoubleKD_vs_Control$Genes = vapply(gene_ontologies$DoubleKD_vs_Control$Genes, paste, collapse = ", ", character(1L))
gene_ontologies$DoubleKD_vs_Control %>%
dplyr::select(-c("Comparison", contains("Sig"), EnsemblID, shortest_path, longest_path, terminal_node)) %>%
DT::datatable(filter = 'top', extensions = c('Buttons', 'FixedColumns'),
caption ="Significant gene ontology terms in Double KD compared to controls",
options = list(scrollX = TRUE,
scrollCollapse = TRUE,
pageLength = 5, autoWidth = TRUE,
dom = 'Blfrtip',
buttons = c('copy', 'csv', 'excel', 'pdf', 'colvis'),
lengthMenu = list(c(10,25,50,-1),
c(10,25,50,"All"))))UPF3A OE
#gene_ontologies$UPF3A_OE_vs_Control$Genes = sapply(gene_ontologies$UPF3A_OE_vs_Control$EnsemblID, function(x){
#            tmp = strsplit(as.character(x), ",") %>% unlist()
#            tmp %<>% as.data.frame() %>% mutate_if(is.character, str_trim)
#            tmp = tmp[[1]]
#            tmp = mapIds(org.Mm.eg.db, keys=tmp,  column="SYMBOL",keytype="ENSEMBL", multiVals="first") %>%
#                unname
#            return(tmp)
#        })
#gene_ontologies$UPF3A_OE_vs_Control$Genes = vapply(gene_ontologies$UPF3A_OE_vs_Control$Genes, paste, collapse = ", ", character(1L))

gene_ontologies$UPF3A_OE_vs_Control  %>%
    dplyr::select(-c("Comparison",  contains("Sig"),  shortest_path, longest_path, terminal_node)) %>%
 DT::datatable(filter = 'top', extensions = c('Buttons', 'FixedColumns'),
               caption ="Significant gene ontology terms in UPF3A OE compared to controls",
            options = list(scrollX = TRUE,
                           scrollCollapse = TRUE,
                           pageLength = 5, autoWidth = TRUE,
                           dom = 'Blfrtip',
                           buttons = c('copy', 'csv', 'excel', 'pdf', 'colvis'),
                           lengthMenu = list(c(10,25,50,-1),
                                             c(10,25,50,"All"))))
UPF3A OE UPF3B KD
gene_ontologies$UPF3A_OE_UPF3B_KD_vs_Control$Genes = sapply(gene_ontologies$UPF3A_OE_UPF3B_KD_vs_Control$EnsemblID, function(x){
            tmp = strsplit(as.character(x), ",") %>% unlist()
            tmp %<>% as.data.frame() %>% mutate_if(is.character, str_trim)
            tmp = tmp[[1]]
            tmp = mapIds(org.Mm.eg.db, keys=tmp,  column="SYMBOL",keytype="ENSEMBL", multiVals="first") %>%
                unname
            return(tmp)
        })
'select()' returned 1:1 mapping between keys and columns
'select()' returned 1:1 mapping between keys and columns
'select()' returned 1:1 mapping between keys and columns
'select()' returned 1:1 mapping between keys and columns
'select()' returned 1:1 mapping between keys and columns
'select()' returned 1:1 mapping between keys and columns
'select()' returned 1:1 mapping between keys and columns
'select()' returned 1:1 mapping between keys and columns
'select()' returned 1:1 mapping between keys and columnsgene_ontologies$UPF3A_OE_UPF3B_KD_vs_Control$Genes = vapply(gene_ontologies$UPF3A_OE_UPF3B_KD_vs_Control$Genes, paste, collapse = ", ", character(1L))
gene_ontologies$UPF3A_OE_UPF3B_KD_vs_Control %>%
dplyr::select(-c("Comparison", contains("Sig"), EnsemblID, shortest_path, longest_path, terminal_node)) %>%
DT::datatable(filter = 'top', extensions = c('Buttons', 'FixedColumns'),
caption ="Significant gene ontology terms in UPF3A OE, UPF3B KD compared to controls",
options = list(scrollX = TRUE,
scrollCollapse = TRUE,
pageLength = 5, autoWidth = TRUE,
dom = 'Blfrtip',
buttons = c('copy', 'csv', 'excel', 'pdf', 'colvis'),
lengthMenu = list(c(10,25,50,-1),
c(10,25,50,"All"))))
sessionInfo()R version 4.2.2 Patched (2022-11-10 r83330)
Platform: x86_64-pc-linux-gnu (64-bit)
Running under: Ubuntu 22.04.2 LTS
Matrix products: default
BLAS: /usr/lib/x86_64-linux-gnu/blas/libblas.so.3.10.0
LAPACK: /usr/lib/x86_64-linux-gnu/lapack/liblapack.so.3.10.0
locale:
[1] LC_CTYPE=en_AU.UTF-8 LC_NUMERIC=C
[3] LC_TIME=en_AU.UTF-8 LC_COLLATE=en_AU.UTF-8
[5] LC_MONETARY=en_AU.UTF-8 LC_MESSAGES=en_AU.UTF-8
[7] LC_PAPER=en_AU.UTF-8 LC_NAME=C
[9] LC_ADDRESS=C LC_TELEPHONE=C
[11] LC_MEASUREMENT=en_AU.UTF-8 LC_IDENTIFICATION=C
attached base packages:
[1] grid stats4 tools stats graphics grDevices utils
[8] datasets methods base
other attached packages:
[1] cowplot_1.1.1 ngsReports_2.0.3
[3] patchwork_1.1.2 VennDiagram_1.7.3
[5] futile.logger_1.4.3 UpSetR_1.4.0
[7] fgsea_1.24.0 GOplot_1.0.2
[9] RColorBrewer_1.1-3 gridExtra_2.3
[11] ggdendro_0.1.23 AnnotationHub_3.6.0
[13] BiocFileCache_2.6.1 dbplyr_2.3.1
[15] openxlsx_4.2.5.2 ggiraph_0.8.6
[17] wasabi_1.0.1 sleuth_0.30.1
[19] DT_0.27 VennDetail_1.14.0
[21] msigdb_1.6.0 GSEABase_1.60.0
[23] graph_1.76.0 annotate_1.76.0
[25] XML_3.99-0.13 pheatmap_1.0.12
[27] ggvenn_0.1.9 MetBrewer_0.2.0
[29] ggpubr_0.6.0 venn_1.11
[31] viridis_0.6.2 viridisLite_0.4.1
[33] tximeta_1.16.1 tximport_1.26.1
[35] goseq_1.50.0 geneLenDataBase_1.34.0
[37] BiasedUrn_2.0.9 org.Mm.eg.db_3.16.0
[39] EnsDb.Mmusculus.v79_2.99.0 ensembldb_2.22.0
[41] AnnotationFilter_1.22.0 GenomicFeatures_1.50.4
[43] AnnotationDbi_1.60.0 biomaRt_2.54.0
[45] edgeR_3.40.2 limma_3.54.1
[47] DESeq2_1.38.3 SummarizedExperiment_1.28.0
[49] Biobase_2.58.0 MatrixGenerics_1.10.0
[51] matrixStats_0.63.0 GenomicRanges_1.50.2
[53] GenomeInfoDb_1.34.9 IRanges_2.32.0
[55] S4Vectors_0.36.1 BiocGenerics_0.44.0
[57] corrplot_0.92 lubridate_1.9.2
[59] forcats_1.0.0 purrr_1.0.1
[61] readr_2.1.4 tidyverse_2.0.0
[63] stringr_1.5.0 tidyr_1.3.0
[65] scales_1.2.1 data.table_1.14.8
[67] readxl_1.4.2 tibble_3.1.8
[69] magrittr_2.0.3 reshape2_1.4.4
[71] ggplot2_3.4.1 dplyr_1.1.0.9000
[73] workflowr_1.7.0
loaded via a namespace (and not attached):
[1] rappdirs_0.3.3 rtracklayer_1.58.0
[3] bit64_4.0.5 knitr_1.42
[5] DelayedArray_0.24.0 KEGGREST_1.38.0
[7] RCurl_1.98-1.10 generics_0.1.3
[9] callr_3.7.3 lambda.r_1.2.4
[11] RSQLite_2.3.0 bit_4.0.5
[13] tzdb_0.3.0 xml2_1.3.3
[15] httpuv_1.6.9 xfun_0.37
[17] hms_1.1.2 jquerylib_0.1.4
[19] evaluate_0.20 promises_1.2.0.1
[21] fansi_1.0.4 restfulr_0.0.15
[23] progress_1.2.2 DBI_1.1.3
[25] geneplotter_1.76.0 htmlwidgets_1.6.1
[27] ellipsis_0.3.2 crosstalk_1.2.0
[29] backports_1.4.1 vctrs_0.5.2.9000
[31] abind_1.4-5 cachem_1.0.7
[33] withr_2.5.0 GenomicAlignments_1.34.0
[35] prettyunits_1.1.1 lazyeval_0.2.2
[37] crayon_1.5.2 pkgconfig_2.0.3
[39] labeling_0.4.2 nlme_3.1-162
[41] ProtGenerics_1.30.0 rlang_1.0.6.9000
[43] lifecycle_1.0.3 filelock_1.0.2
[45] cellranger_1.1.0 rprojroot_2.0.3
[47] Matrix_1.5-3 carData_3.0-5
[49] Rhdf5lib_1.20.0 zoo_1.8-11
[51] whisker_0.4.1 processx_3.8.0
[53] png_0.1-8 rjson_0.2.21
[55] bitops_1.0-7 getPass_0.2-2
[57] rhdf5filters_1.10.0 pander_0.6.5
[59] Biostrings_2.66.0 blob_1.2.3
[61] rstatix_0.7.2 ggsignif_0.6.4
[63] memoise_2.0.1 plyr_1.8.8
[65] zlibbioc_1.44.0 compiler_4.2.2
[67] BiocIO_1.8.0 Rsamtools_2.14.0
[69] cli_3.6.0 XVector_0.38.0
[71] ps_1.7.2 formatR_1.14
[73] MASS_7.3-58.2 mgcv_1.8-41
[75] tidyselect_1.2.0 stringi_1.7.12
[77] highr_0.10 yaml_2.3.7
[79] locfit_1.5-9.7 sass_0.4.5
[81] fastmatch_1.1-3 timechange_0.2.0
[83] parallel_4.2.2 rstudioapi_0.14
[85] uuid_1.1-0 git2r_0.31.0
[87] farver_2.1.1 digest_0.6.31
[89] BiocManager_1.30.20 shiny_1.7.4
[91] Rcpp_1.0.10 car_3.1-1
[93] broom_1.0.3 BiocVersion_3.16.0
[95] later_1.3.0 httr_1.4.5
[97] colorspace_2.1-0 fs_1.6.1
[99] splines_4.2.2 plotly_4.10.1
[101] systemfonts_1.0.4 xtable_1.8-4
[103] jsonlite_1.8.4 futile.options_1.0.1
[105] R6_2.5.1 pillar_1.8.1
[107] htmltools_0.5.4 mime_0.12
[109] glue_1.6.2 fastmap_1.1.1
[111] BiocParallel_1.32.5 interactiveDisplayBase_1.36.0
[113] codetools_0.2-19 utf8_1.2.3
[115] lattice_0.20-45 bslib_0.4.2
[117] curl_5.0.0 zip_2.2.2
[119] GO.db_3.16.0 admisc_0.30
[121] rmarkdown_2.20 munsell_0.5.0
[123] rhdf5_2.42.0 GenomeInfoDbData_1.2.9
[125] gtable_0.3.1