Randomizing the order of backfits
Jason Willwerscheid
8/19/2018
Last updated: 2018-08-22
workflowr checks: (Click a bullet for more information)-
✔ R Markdown file: up-to-date
Great! Since the R Markdown file has been committed to the Git repository, you know the exact version of the code that produced these results.
-
✔ Environment: empty
Great job! The global environment was empty. Objects defined in the global environment can affect the analysis in your R Markdown file in unknown ways. For reproduciblity it’s best to always run the code in an empty environment.
-
✔ Seed:
set.seed(20180714)The command
set.seed(20180714)was run prior to running the code in the R Markdown file. Setting a seed ensures that any results that rely on randomness, e.g. subsampling or permutations, are reproducible. -
✔ Session information: recorded
Great job! Recording the operating system, R version, and package versions is critical for reproducibility.
-
Great! You are using Git for version control. Tracking code development and connecting the code version to the results is critical for reproducibility. The version displayed above was the version of the Git repository at the time these results were generated.✔ Repository version: 81d3467
Note that you need to be careful to ensure that all relevant files for the analysis have been committed to Git prior to generating the results (you can usewflow_publishorwflow_git_commit). workflowr only checks the R Markdown file, but you know if there are other scripts or data files that it depends on. Below is the status of the Git repository when the results were generated:
Note that any generated files, e.g. HTML, png, CSS, etc., are not included in this status report because it is ok for generated content to have uncommitted changes.Ignored files: Ignored: .DS_Store Ignored: .Rhistory Ignored: .Rproj.user/ Ignored: docs/.DS_Store Ignored: docs/figure/.DS_Store Untracked files: Untracked: code/random.R Untracked: data/greedy19.rds Untracked: data/random/ Unstaged changes: Modified: analysis/index.Rmd
Expand here to see past versions:
| File | Version | Author | Date | Message |
|---|---|---|---|---|
| Rmd | 81d3467 | Jason Willwerscheid | 2018-08-22 | wflow_publish(“analysis/random.Rmd”) |
Introduction
When trying to coax sparse nonnegative factors out of the “strong” GTEx dataset (see here), I noticed that later-added factor/loading pairs are in general much sparser than earlier-added pairs. Here I’d like to determine whether the order of backfitting makes any difference to the factors obtained (and the final objective).
Experiment
I begin with the 34 factor/loading pairs that are added via a single call to flash_add_greedy and backfit using three methods: 1. updating factor/loading pairs sequentially from #1 to #34; 2. updating sequentially in backwards order (from #34 to #1); and 3. updating in a random order.
Results
I pre-run the code below and load the results from file.
devtools::load_all("/Users/willwerscheid/GitHub/flashr/")Loading flashrgtex <- readRDS(gzcon(url("https://github.com/stephenslab/gtexresults/blob/master/data/MatrixEQTLSumStats.Portable.Z.rds?raw=TRUE")))
strong <- t(gtex$strong.z)
strong_data <- flash_set_data(strong, S = 1)
fl_seq <- readRDS("./data/random/fl1.rds")
fl_rev <- readRDS("./data/random/fl2.rds")
fl_rand <- readRDS("./data/random/fl3.rds")The final objective for each method is:
c(sequential = flash_get_objective(strong_data, fl_seq),
  reverse = flash_get_objective(strong_data, fl_rev),
  random = flash_get_objective(strong_data, fl_rand))
sequential reverse random
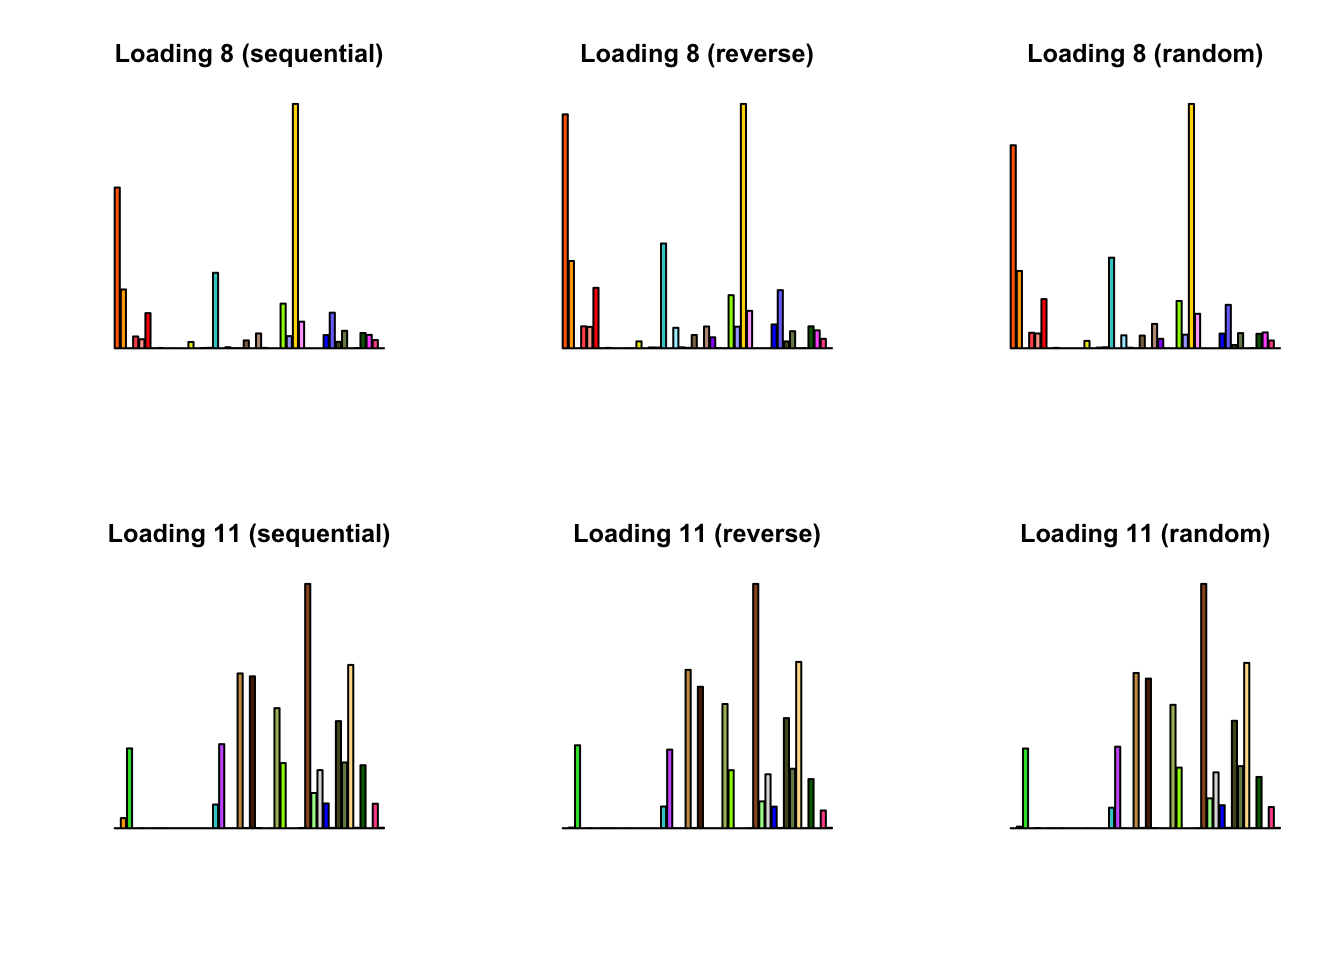
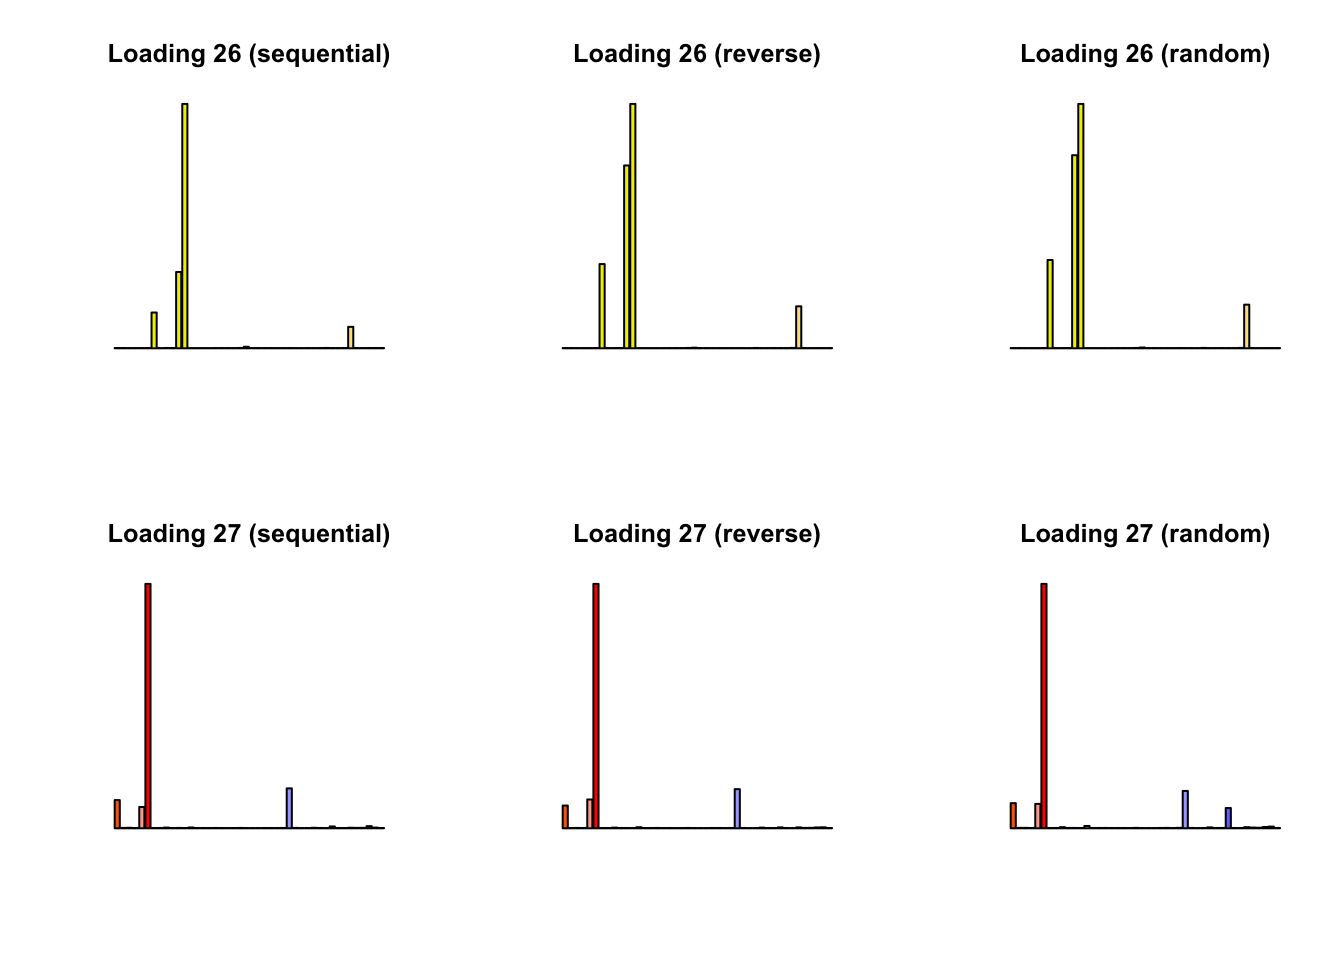
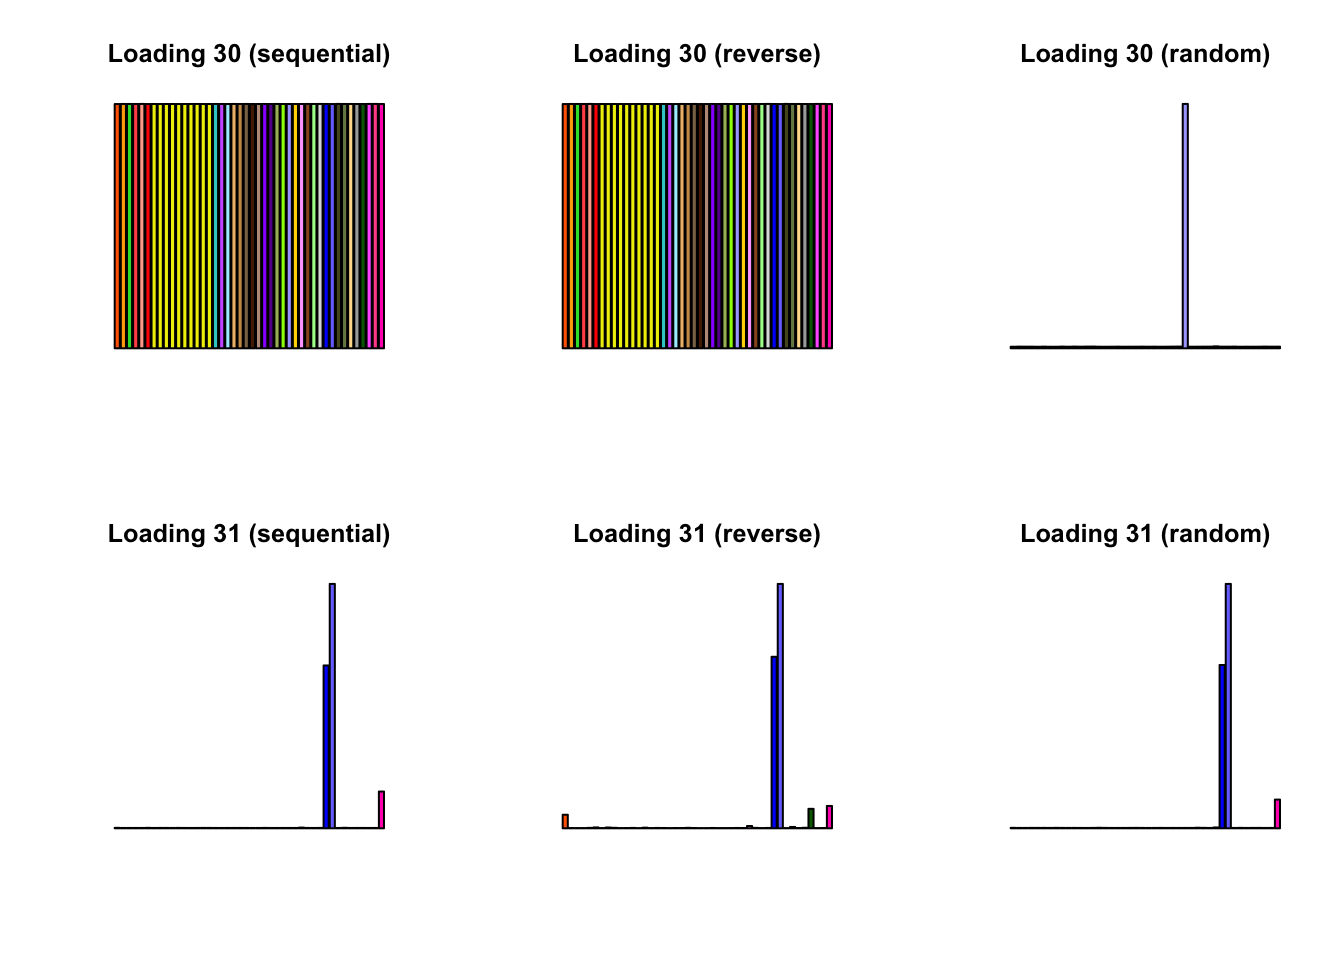
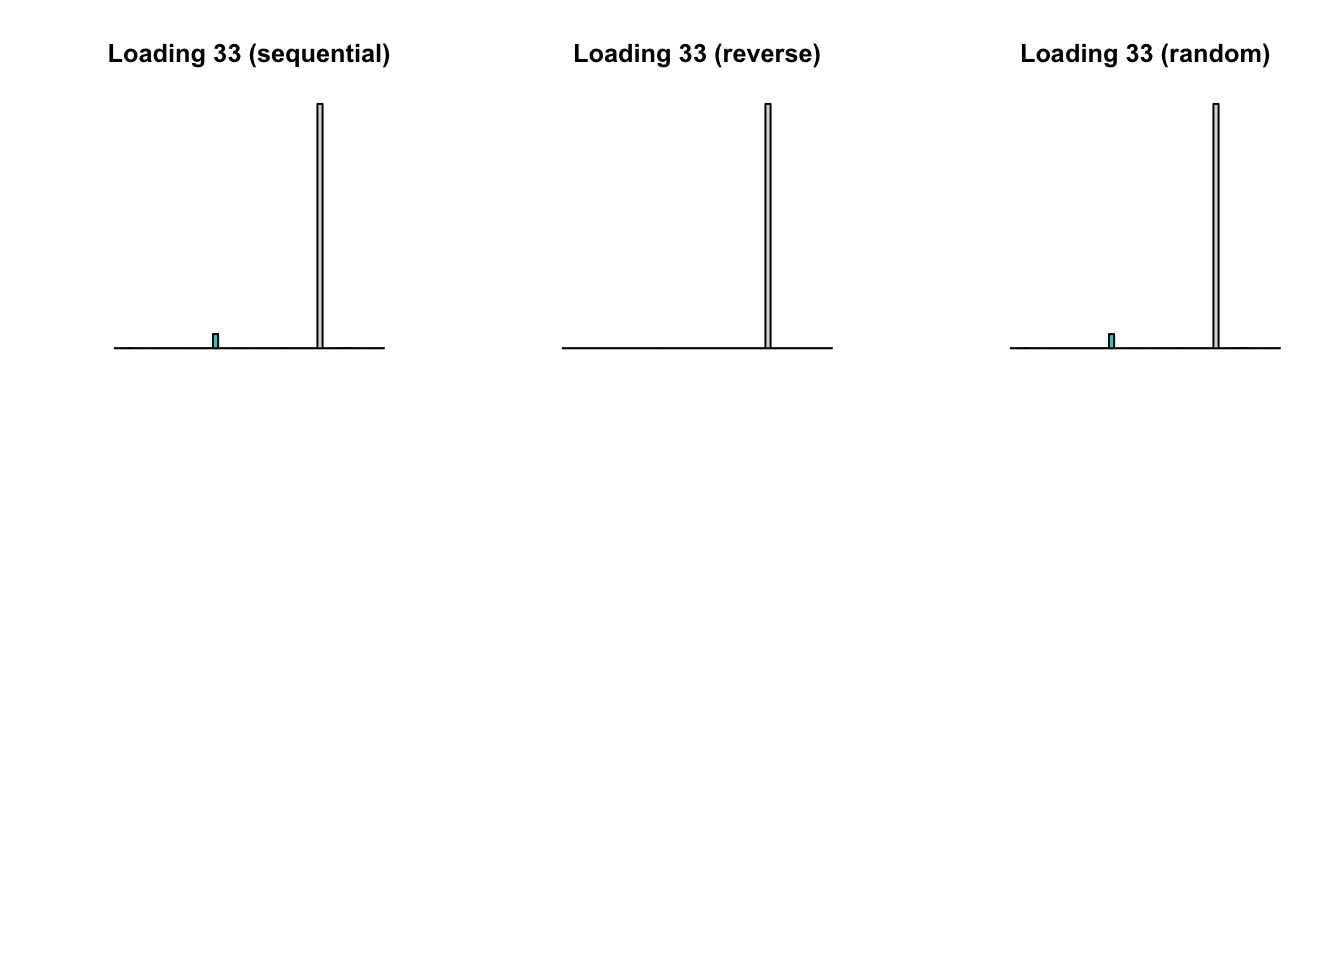
-1257537 -1257237 -1257406 Most of the factor/loading pairs are nearly indistinguishable to the eye. Below I plot the seven factor/loadings with the largest differences:
normalize_EL <- function(fl) {
  norms <- apply(abs(fl$EL), 2, max)
  return(sweep(fl$EL, 2, norms, `/`))
}

norm_EL_seq <- normalize_EL(fl_seq)
norm_EL_rev <- normalize_EL(fl_rev)
norm_EL_rand <- normalize_EL(fl_rand)

# Find factor/loading pairs with largest differences
max_diff <- pmax(abs(norm_EL_seq - norm_EL_rev),
                 abs(norm_EL_seq - norm_EL_rand),
                 abs(norm_EL_rev - norm_EL_rand))
factors_to_show <- which(apply(max_diff, 2, max) > .05)

missing.tissues <- c(7, 8, 19, 20, 24, 25, 31, 34, 37)
gtex.colors <- read.table("https://github.com/stephenslab/gtexresults/blob/master/data/GTExColors.txt?raw=TRUE", sep = '\t', comment.char = '')[-missing.tissues, 2]

par(mfrow = c(2, 3))
for (i in factors_to_show) {
  barplot(fl_seq$EL[, i], main=paste0('Loading ', i, ' (sequential)'),
          las=2, cex.names=0.4, yaxt='n', col=as.character(gtex.colors),
          names="")
  barplot(fl_rev$EL[, i], main=paste0('Loading ', i, ' (reverse)'),
          las=2, cex.names=0.4, yaxt='n', col=as.character(gtex.colors),
          names="")
  barplot(fl_rand$EL[, i], main=paste0('Loading ', i, ' (random)'),
          las=2, cex.names=0.4, yaxt='n', col=as.character(gtex.colors),
          names="")
}


Conclusions
Results are somewhat inconclusive. There are clearly some differences, but even the largest differences seem to be relatively minor (in a qualitative sense). On the other hand, a difference in objective of 300 is perhaps not to be sneered at.
It might be worthwhile to investigate more systematically with simulated data. Here, the usual sequential method is both slowest and attains the worst final objective. It would be interesting to determine whether this is regularly the case.
Code
Click “Code” to view the code used to obtain the above results.
devtools::load_all("/Users/willwerscheid/GitHub/flashr/") # use "dev" branch
devtools::load_all("/Users/willwerscheid/GitHub/ebnm/")

gtex <- readRDS(gzcon(url("https://github.com/stephenslab/gtexresults/blob/master/data/MatrixEQTLSumStats.Portable.Z.rds?raw=TRUE")))
strong <- t(gtex$strong.z)
strong_data <- flash_set_data(strong, S = 1)

fl_init <- readRDS("/Users/willwerscheid/GitHub/MASHvFLASH/output/MASHvFLASHnn/fl_g.rds")


# Sequential backfit (from factor/loading 1 to factor/loading 34) -------
#
ebnm_param = list(f = list(), l = list(mixcompdist="+uniform"))
fl1 <- flash_backfit_workhorse(strong_data,
                               fl_init,
                               kset = 1:34,
                               var_type = "zero",
                               ebnm_fn = "ebnm_ash",
                               ebnm_param = ebnm_param,
                               verbose_output = "odLn",
                               nullcheck = FALSE)

# Use warmstarts to clamp it down:
ebnm_param = list(f = list(warmstart = TRUE),
                  l = list(mixcompdist = "+uniform", warmstart = TRUE))
fl1 <- flash_backfit_workhorse(strong_data,
                               fl1,
                               kset = 1:34,
                               var_type = "zero",
                               ebnm_fn = "ebnm_ash",
                               ebnm_param = ebnm_param,
                               verbose_output = "odLn",
                               nullcheck = FALSE)
## 77 + 375 iterations; -1257537
saveRDS(fl1, "./data/random/fl1.rds")


# Sequential backfit in reverse order (from 34 to 1) --------------------
#
ebnm_param = list(f = list(), l = list(mixcompdist="+uniform"))
fl2 <- flash_backfit_workhorse(strong_data,
                               fl_init,
                               kset = 34:1,
                               var_type = "zero",
                               ebnm_fn = "ebnm_ash",
                               ebnm_param = ebnm_param,
                               verbose_output = "odLn",
                               nullcheck = FALSE)

ebnm_param = list(f = list(warmstart = TRUE),
                  l = list(mixcompdist = "+uniform", warmstart = TRUE))
fl2 <- flash_backfit_workhorse(strong_data,
                               fl2,
                               kset = 34:1,
                               var_type = "zero",
                               ebnm_fn = "ebnm_ash",
                               ebnm_param = ebnm_param,
                               verbose_output = "odLn",
                               nullcheck = FALSE)
## 77 + 125 iterations; objective: -1257237
saveRDS(fl2, "./data/random/fl2.rds")


# Backfit the factor/loadings in a random order -------------------------
#
set.seed(666)
ebnm_param = list(f = list(), l = list(mixcompdist="+uniform"))
fl3 <- fl_init
old_obj <- flash_get_objective(strong_data, fl3)
diff <- Inf
iter <- 0
while (diff > .01) {
  iter <- iter + 1
  fl3 <- flash_backfit_workhorse(strong_data,
                                 fl3,
                                 kset=sample(1:34, 34),
                                 var_type = "zero",
                                 ebnm_fn = "ebnm_ash",
                                 ebnm_param = ebnm_param,
                                 verbose_output = "",
                                 maxiter = 1,
                                 nullcheck = FALSE)
  obj <- flash_get_objective(strong_data, fl3)
  message("Iteration ", iter, ": ", obj)
  diff <- obj - old_obj
  old_obj <- obj
}

ebnm_param = list(f = list(warmstart = TRUE),
                  l = list(mixcompdist = "+uniform", warmstart = TRUE))
old_obj <- flash_get_objective(strong_data, fl3)
diff <- Inf
iter <- 0
while (diff > .01) {
  iter <- iter + 1
  fl3 <- flash_backfit_workhorse(strong_data,
                                 fl3,
                                 kset=sample(1:34, 34),
                                 var_type = "zero",
                                 ebnm_fn = "ebnm_ash",
                                 ebnm_param = ebnm_param,
                                 verbose_output = "",
                                 maxiter = 1,
                                 nullcheck = FALSE)
  obj <- flash_get_objective(strong_data, fl3)
  message("Iteration ", iter, ": ", obj)
  diff <- obj - old_obj
  old_obj <- obj
}
# 52 + 231 iterations; final obj: -1257408
saveRDS(fl3, "./data/random/fl3.rds")
Session information
sessionInfo()R version 3.4.3 (2017-11-30)
Platform: x86_64-apple-darwin15.6.0 (64-bit)
Running under: macOS High Sierra 10.13.6
Matrix products: default
BLAS: /Library/Frameworks/R.framework/Versions/3.4/Resources/lib/libRblas.0.dylib
LAPACK: /Library/Frameworks/R.framework/Versions/3.4/Resources/lib/libRlapack.dylib
locale:
[1] en_US.UTF-8/en_US.UTF-8/en_US.UTF-8/C/en_US.UTF-8/en_US.UTF-8
attached base packages:
[1] stats graphics grDevices utils datasets methods base
other attached packages:
[1] flashr_0.5-14
loaded via a namespace (and not attached):
[1] Rcpp_0.12.17 pillar_1.2.1 plyr_1.8.4
[4] compiler_3.4.3 git2r_0.21.0 workflowr_1.0.1
[7] R.methodsS3_1.7.1 R.utils_2.6.0 iterators_1.0.9
[10] tools_3.4.3 testthat_2.0.0 digest_0.6.15
[13] tibble_1.4.2 evaluate_0.10.1 memoise_1.1.0
[16] gtable_0.2.0 lattice_0.20-35 rlang_0.2.0
[19] Matrix_1.2-12 foreach_1.4.4 commonmark_1.4
[22] yaml_2.1.17 parallel_3.4.3 ebnm_0.1-12
[25] withr_2.1.1.9000 stringr_1.3.0 roxygen2_6.0.1.9000
[28] xml2_1.2.0 knitr_1.20 devtools_1.13.4
[31] rprojroot_1.3-2 grid_3.4.3 R6_2.2.2
[34] rmarkdown_1.8 ggplot2_2.2.1 ashr_2.2-10
[37] magrittr_1.5 whisker_0.3-2 backports_1.1.2
[40] scales_0.5.0 codetools_0.2-15 htmltools_0.3.6
[43] MASS_7.3-48 assertthat_0.2.0 softImpute_1.4
[46] colorspace_1.3-2 stringi_1.1.6 lazyeval_0.2.1
[49] munsell_0.4.3 doParallel_1.0.11 pscl_1.5.2
[52] truncnorm_1.0-8 SQUAREM_2017.10-1 R.oo_1.21.0 This reproducible R Markdown analysis was created with workflowr 1.0.1