Deng et al. dataset
Jason Willwerscheid
3/2/2022
Last updated: 2022-03-02
Checks: 7 0
Knit directory: scFLASH/
This reproducible R Markdown analysis was created with workflowr (version 1.6.2). The Checks tab describes the reproducibility checks that were applied when the results were created. The Past versions tab lists the development history.
Great! Since the R Markdown file has been committed to the Git repository, you know the exact version of the code that produced these results.
Great job! The global environment was empty. Objects defined in the global environment can affect the analysis in your R Markdown file in unknown ways. For reproduciblity it’s best to always run the code in an empty environment.
The command set.seed(20181103) was run prior to running the code in the R Markdown file. Setting a seed ensures that any results that rely on randomness, e.g. subsampling or permutations, are reproducible.
Great job! Recording the operating system, R version, and package versions is critical for reproducibility.
Nice! There were no cached chunks for this analysis, so you can be confident that you successfully produced the results during this run.
Great job! Using relative paths to the files within your workflowr project makes it easier to run your code on other machines.
Great! You are using Git for version control. Tracking code development and connecting the code version to the results is critical for reproducibility.
The results in this page were generated with repository version b788456. See the Past versions tab to see a history of the changes made to the R Markdown and HTML files.
Note that you need to be careful to ensure that all relevant files for the analysis have been committed to Git prior to generating the results (you can use wflow_publish or wflow_git_commit). workflowr only checks the R Markdown file, but you know if there are other scripts or data files that it depends on. Below is the status of the Git repository when the results were generated:
Ignored files:
    Ignored:    .DS_Store
    Ignored:    .Rhistory
    Ignored:    .Rproj.user/
    Ignored:    code/initialization/
    Ignored:    data-raw/10x_assigned_cell_types.R
    Ignored:    data/.DS_Store
    Ignored:    data/10x/
    Ignored:    data/Ensembl2Reactome.txt
    Ignored:    data/droplet.rds
    Ignored:    data/mus_pathways.rds
    Ignored:    output/backfit/
    Ignored:    output/final_montoro/
    Ignored:    output/lowrank/
    Ignored:    output/prior_type/
    Ignored:    output/pseudocount/
    Ignored:    output/pseudocount_redux/
    Ignored:    output/size_factors/
    Ignored:    output/var_reg/
    Ignored:    output/var_type/

Untracked files:
    Untracked:  analysis/NBapprox.Rmd
    Untracked:  analysis/final_pbmc.Rmd
    Untracked:  analysis/trachea4.Rmd
    Untracked:  code/alt_montoro/
    Untracked:  code/deng/
    Untracked:  code/final_pbmc/
    Untracked:  code/missing_data.R
    Untracked:  code/prior_type/priortype_fits_pbmc.R
    Untracked:  code/pseudocount_redux/pseudocount_fits_pbmc.R
    Untracked:  code/pulseseq/
    Untracked:  code/size_factors/sizefactor_fits_pbmc.R
    Untracked:  code/trachea4.R
    Untracked:  data/deng_fl.rds
    Untracked:  mixsqp_fail.rds
    Untracked:  output/alt_montoro/
    Untracked:  output/final_pbmc/
    Untracked:  output/pulseseq_fit.rds

Unstaged changes:
    Modified:   code/utils.R
    Modified:   data-raw/pbmc.R
Note that any generated files, e.g. HTML, png, CSS, etc., are not included in this status report because it is ok for generated content to have uncommitted changes.
These are the previous versions of the repository in which changes were made to the R Markdown (analysis/deng.Rmd) and HTML (docs/deng.html) files. If you’ve configured a remote Git repository (see ?wflow_git_remote), click on the hyperlinks in the table below to view the files as they were in that past version.
| File | Version | Author | Date | Message |
|---|---|---|---|---|
| Rmd | b788456 | Jason Willwerscheid | 2022-03-02 | wflow_publish(“analysis/deng.Rmd”) |
Overview
library(tidyverse)
#> ── Attaching packages ─────────────────────────────────────── tidyverse 1.3.1 ──
#> ✓ ggplot2 3.3.5     ✓ purrr   0.3.4
#> ✓ tibble  3.1.6     ✓ dplyr   1.0.8
#> ✓ tidyr   1.1.4     ✓ stringr 1.4.0
#> ✓ readr   2.0.0     ✓ forcats 0.5.1
#> ── Conflicts ────────────────────────────────────────── tidyverse_conflicts() ──
#> x dplyr::filter() masks stats::filter()
#> x dplyr::lag()    masks stats::lag()
library(flashier)
#> Loading required package: magrittr
#>
#> Attaching package: 'magrittr'
#> The following object is masked from 'package:purrr':
#>
#>     set_names
#> The following object is masked from 'package:tidyr':
#>
#>     extract
library(ggrepel)
library(singleCellRNASeqMouseDeng2014)
#> Loading required package: Biobase
#> Loading required package: BiocGenerics
#> Loading required package: parallel
#>
#> Attaching package: 'BiocGenerics'
#> The following objects are masked from 'package:parallel':
#>
#>     clusterApply, clusterApplyLB, clusterCall, clusterEvalQ,
#>     clusterExport, clusterMap, parApply, parCapply, parLapply,
#>     parLapplyLB, parRapply, parSapply, parSapplyLB
#> The following objects are masked from 'package:dplyr':
#>
#>     combine, intersect, setdiff, union
#> The following objects are masked from 'package:stats':
#>
#>     IQR, mad, sd, var, xtabs
#> The following objects are masked from 'package:base':
#>
#>     anyDuplicated, append, as.data.frame, basename, cbind, colMeans,
#>     colnames, colSums, dirname, do.call, duplicated, eval, evalq,
#>     Filter, Find, get, grep, grepl, intersect, is.unsorted, lapply,
#>     lengths, Map, mapply, match, mget, order, paste, pmax, pmax.int,
#>     pmin, pmin.int, Position, rank, rbind, Reduce, rowMeans, rownames,
#>     rowSums, sapply, setdiff, sort, table, tapply, union, unique,
#>     unsplit, which, which.max, which.min
#> Welcome to Bioconductor
#>
#>     Vignettes contain introductory material; view with
#>     'browseVignettes()'. To cite Bioconductor, see
#>     'citation("Biobase")', and for packages 'citation("pkgname")'.

counts <- exprs(Deng2014MouseESC)
meta_data <- pData(Deng2014MouseESC)
gene_names <- rownames(counts)

preprocess <- function(dat, min.nzcts = 10) {
  size.factors <- colSums(dat)
  size.factors <- size.factors / mean(size.factors)
  gene_cts <- rowSums(dat > 0)
  dat <- dat[gene_cts >= min.nzcts, ]

  lunpc <- max(1 / min(size.factors) - 1 / max(size.factors), 1)
  fl.dat <- log1p(t(t(dat) / size.factors) / lunpc)

  return(list(
    dat = dat,
    fl.dat = fl.dat,
    size.factors = size.factors,
    excluded.genes = gene_cts < min.nzcts)
  )
}
Deng <- preprocess(counts)
The dataset, from Deng et al., is made available by kkdey’s R package singleCellRNASeqMouseDeng2014, which I installed using command remotes::install_github("kkdey/singleCellRNASeqMouseDeng2014").
After removing genes with nonzero counts in fewer than 10 cells, there remain counts for 17176 genes and 259 cells. Each cell has been labelled as one of 10 cell types (or rather, one of 10 embryonic stages ranging from zygote to late blastocyte).
I fit 25 semi-nonnegative EBMF factors using flashier:
fl <- readRDS("./data/deng_fl.rds")

tib <- as_tibble(ldf(fl, type = "I")$F) %>%
  mutate(Cell.type = meta_data$cell_type) %>%
  mutate(Cell.type = fct_relevel(Cell.type, c(
    "zy",
    "early2cell", "mid2cell", "late2cell",
    "4cell", "8cell", "16cell",
    "earlyblast", "midblast", "lateblast"
  )))
#> Warning: The `x` argument of `as_tibble.matrix()` must have unique column names if `.name_repair` is omitted as of tibble 2.0.0.
#> Using compatibility `.name_repair`.
tib <- tib %>%
  pivot_longer(
    -Cell.type,
    names_to = "Factor",
    values_to = "Loading",
    values_drop_na = TRUE
  ) %>%
  mutate(Factor = as.numeric(str_remove_all(Factor, "V")))

# Make the size of the point depend on how many of that type there are.
celltype.tib <- tib %>%
  filter(Factor == tib$Factor[1]) %>%
  group_by(Cell.type) %>%
  summarize(n = n())
celltype.tib <- celltype.tib %>%
  mutate(Pt.size = 2 / sqrt(n / min(n)))
tib <- tib %>%
  left_join(celltype.tib %>% select(Cell.type, Pt.size), by = "Cell.type")

tib <- tib %>%
  mutate(Cell.type.lvl = as.numeric(Cell.type))

plt <- ggplot(tib, aes(x = Factor, y = Loading, color = Cell.type)) +
  geom_jitter(position = position_jitter(width = 0.4, height = 0),
              size = tib$Pt.size) +
  scale_x_continuous(breaks = seq(from = 2, to = max(tib$Factor), by = 2)) +
  #scale_color_brewer(palette = "Set3") +
  labs(x = "factor index", y = "factor loading", color = "Cell Type") +
  theme_minimal()
plt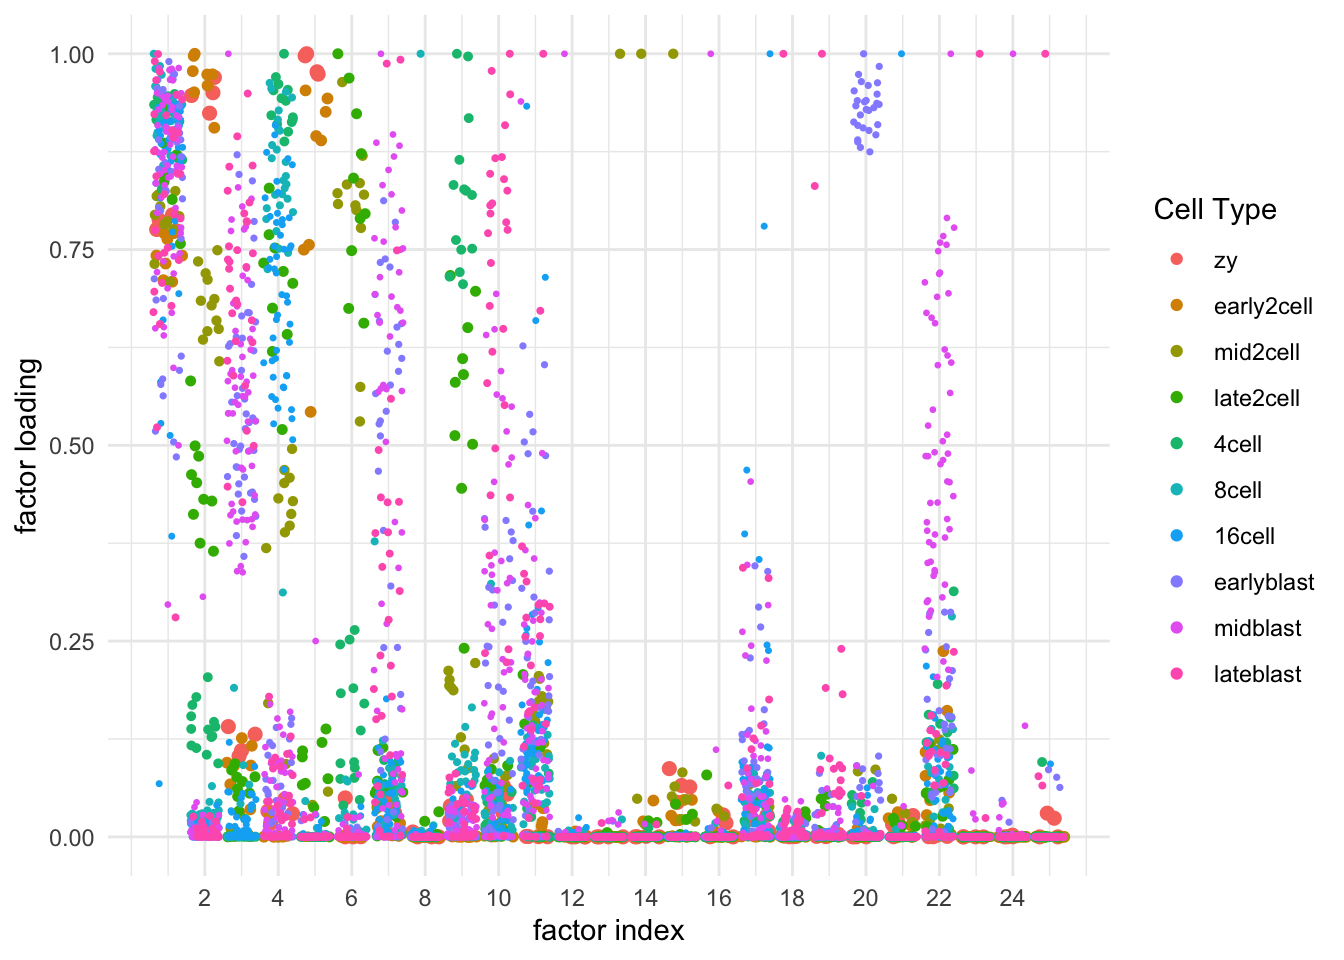
Many of these factors seem to primarily capture noise in individual cells (8, 12 through 16, 18, etc.). I show volcano plots for the more interesting factors, which I’ve arranged in rough ontogenetic order. I label the top 30 genes by (absolute) z-score (defined as posterior mean / posterior SD) as well as the top 30 by (absolute) posterior mean.
do.volcano.plot <- function(fl, k) {
  tib <- tibble(
    pm = fl$L.pm[, k],
    z = abs(fl$L.pm[, k]) / pmax(sqrt(.Machine$double.eps), fl$L.psd[, k]),
    exprmean = log10(rowMeans(Deng$dat)),
    SYMBOL = rownames(fl$L.pm)
  ) %>%
    mutate(SYMBOL = ifelse(
      z > sort(z, decreasing = TRUE)[31] |
        abs(pm) > sort(abs(pm), decreasing = TRUE)[31], SYMBOL, ""))

  plt <- ggplot(tib, aes(x = pm, y = z, color = exprmean, label = SYMBOL)) +
    geom_point() +
    scale_color_gradient2(low = "deepskyblue", mid = "gold", high = "orangered",
                          na.value = "gainsboro",
                          midpoint = mean(range(tib$exprmean))) +
    scale_y_sqrt() +
    geom_text_repel(color = "darkgray",size = 2.25, fontface = "italic",
                    segment.color = "darkgray", segment.size = 0.25,
                    min.segment.length = 0, na.rm = TRUE) +
    theme_minimal() +
    labs(
      x = "Factor Loading (posterior mean)",
      y = "|z-score|",
      color = "Mean Expression (log10)"
    ) +
    theme(legend.position = "bottom")

  return(plt)
}
Factor 5: zygote to early 2-cell
do.volcano.plot(fl, 5)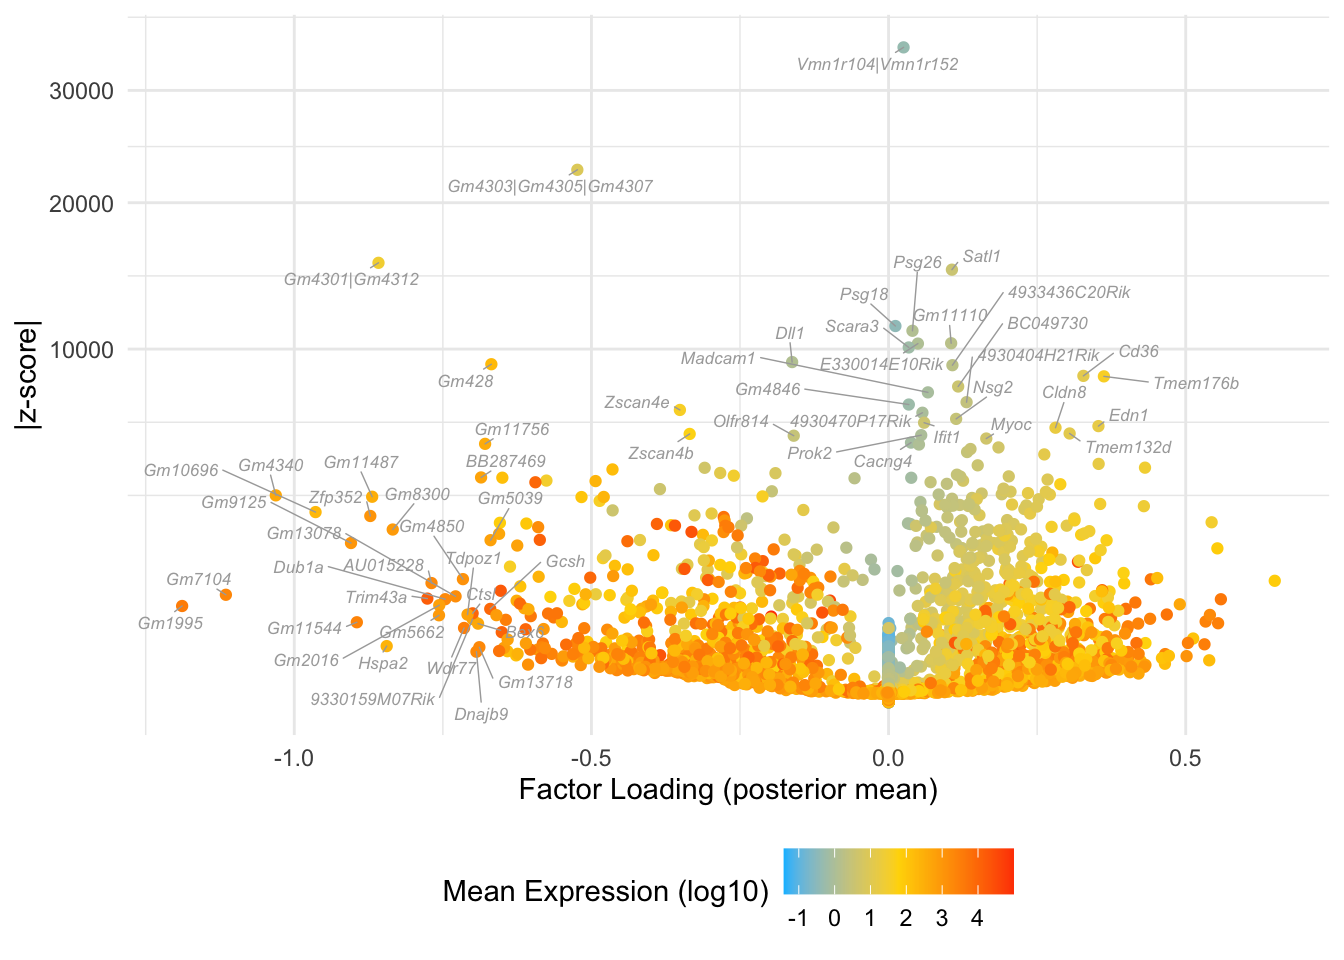
Factor 2: zygote to late 2-cell
do.volcano.plot(fl, 2)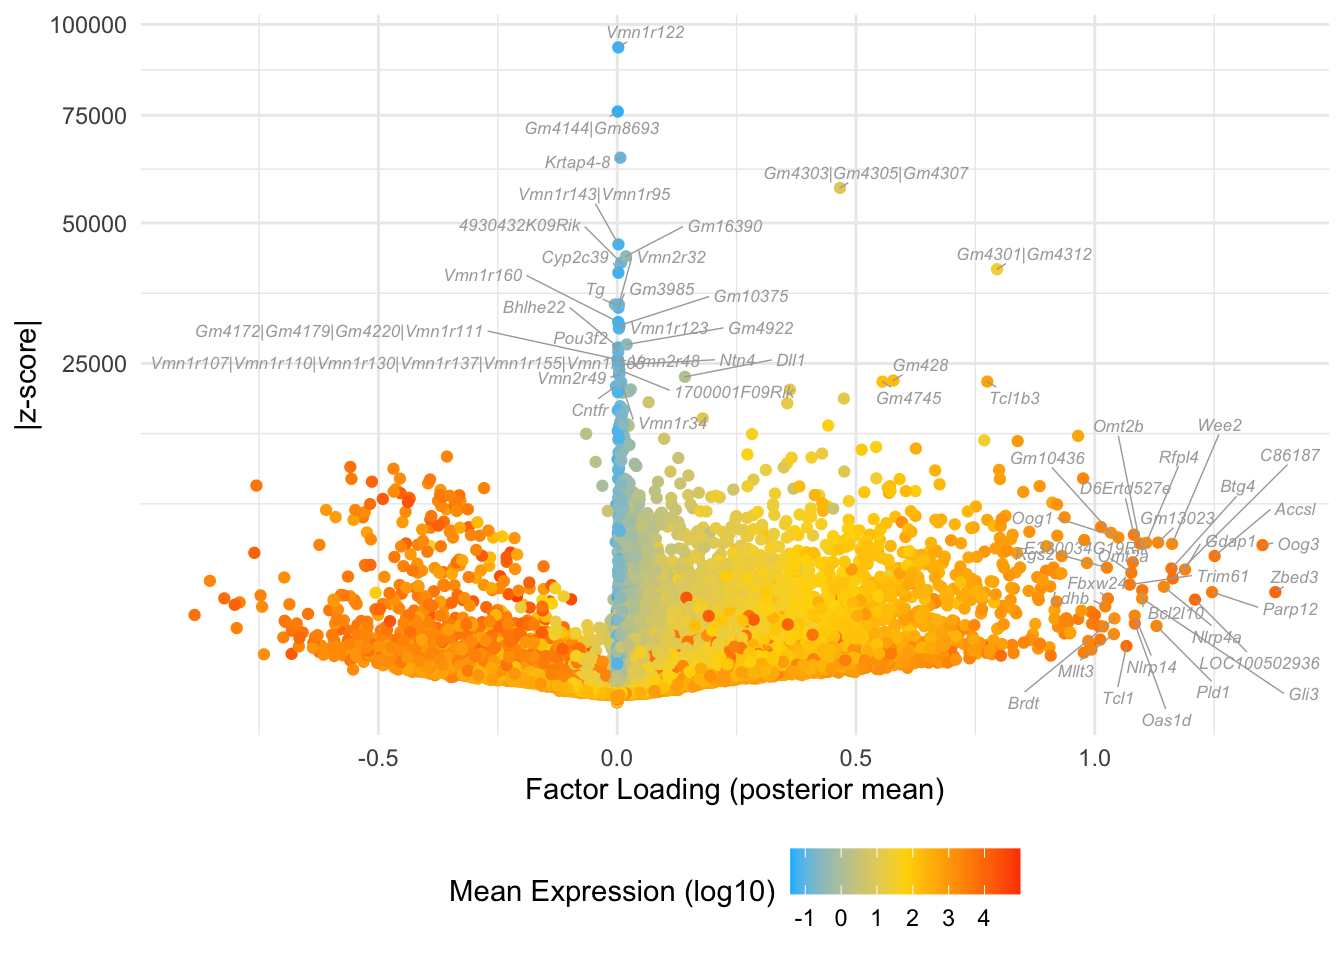
Factor 6: mid to late 2-cell
do.volcano.plot(fl, 6)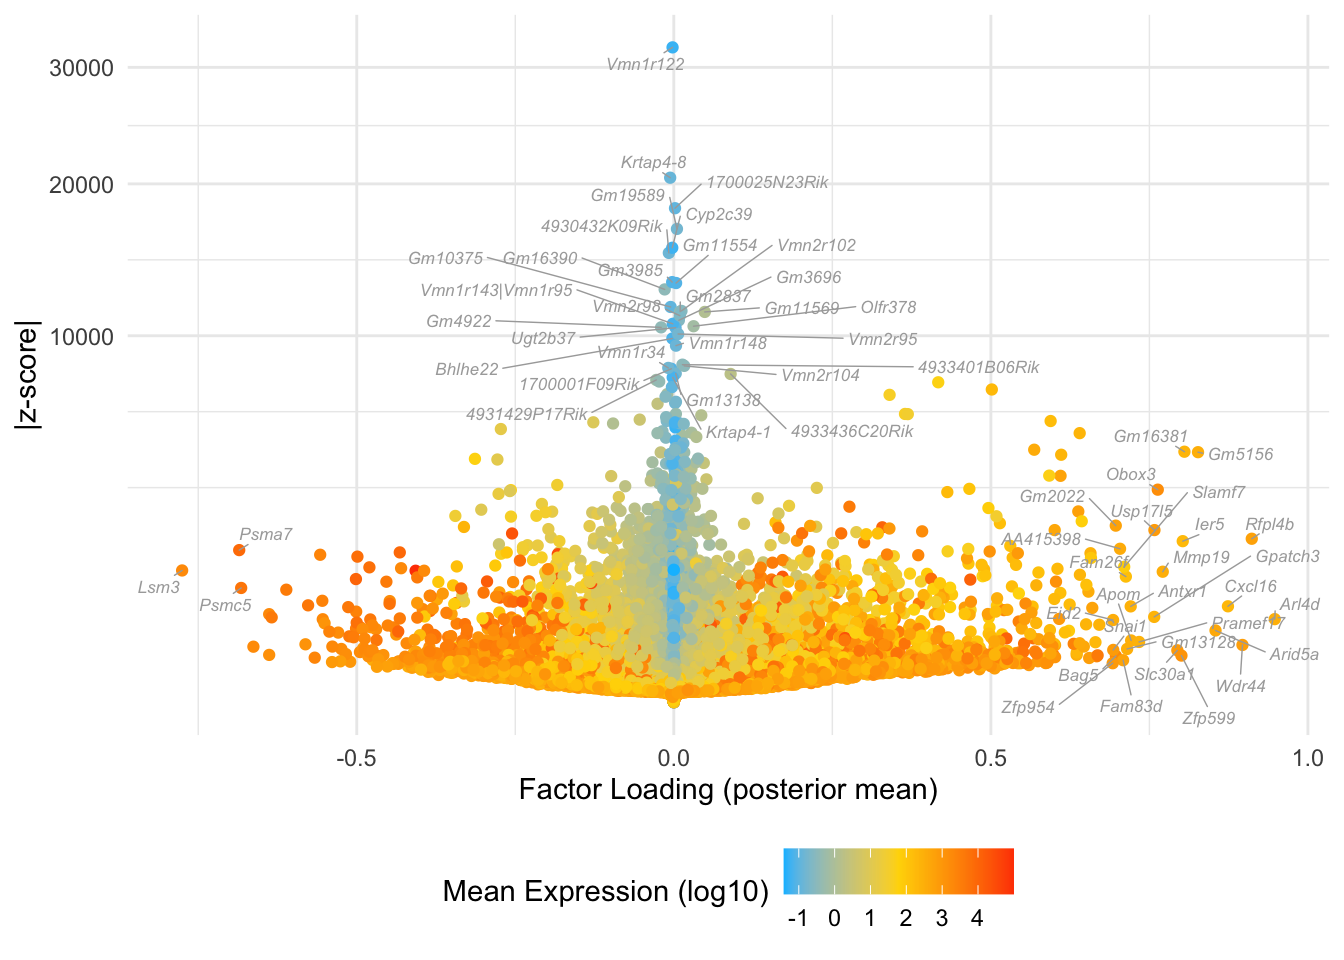
Factor 9: late 2-cell to 4-cell
do.volcano.plot(fl, 9)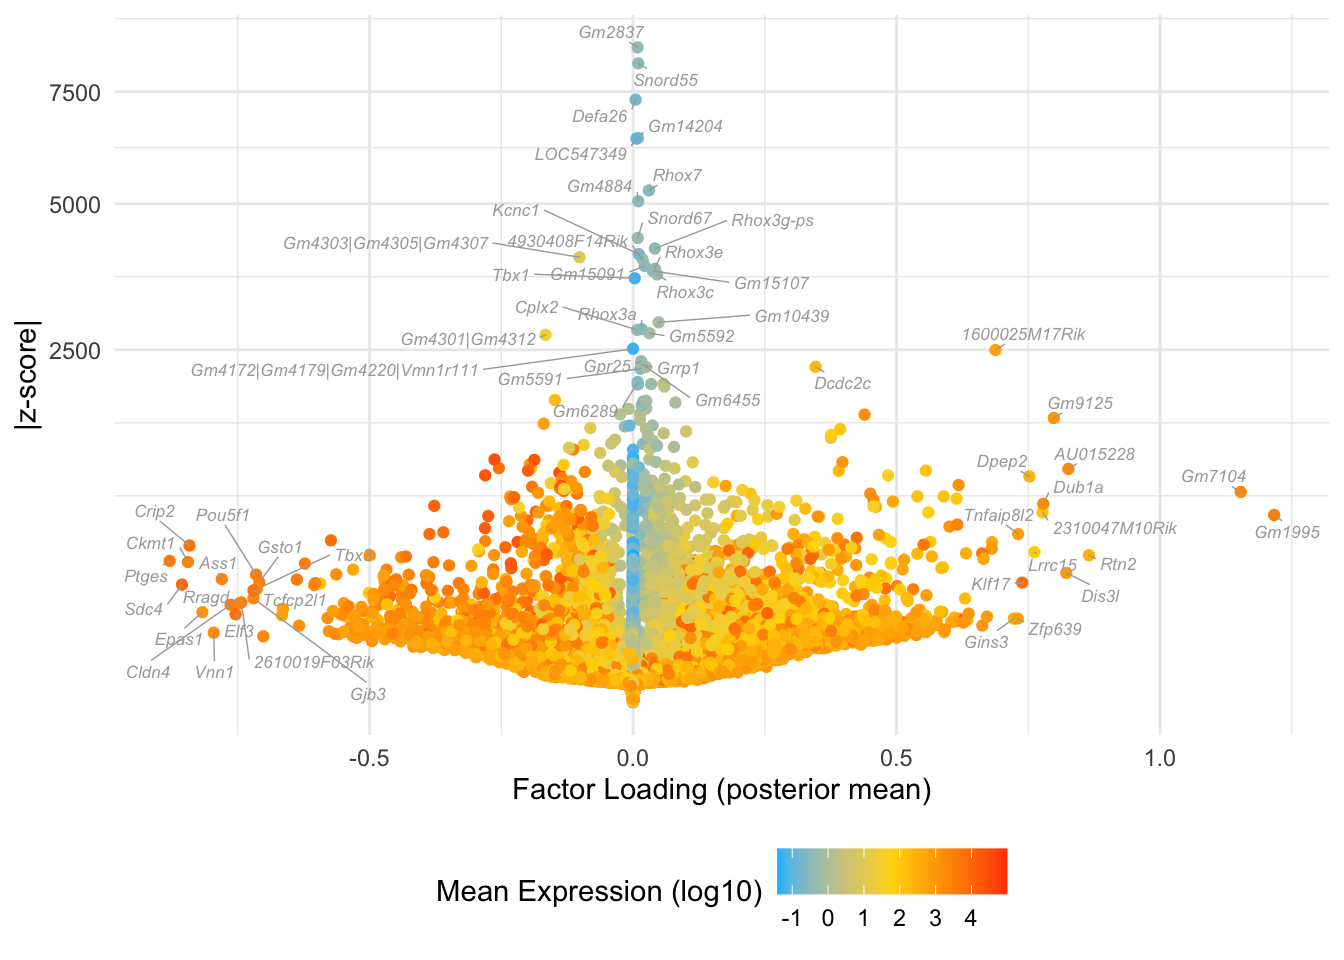
Factor 4: late 2-cell to 16-cell
do.volcano.plot(fl, 4)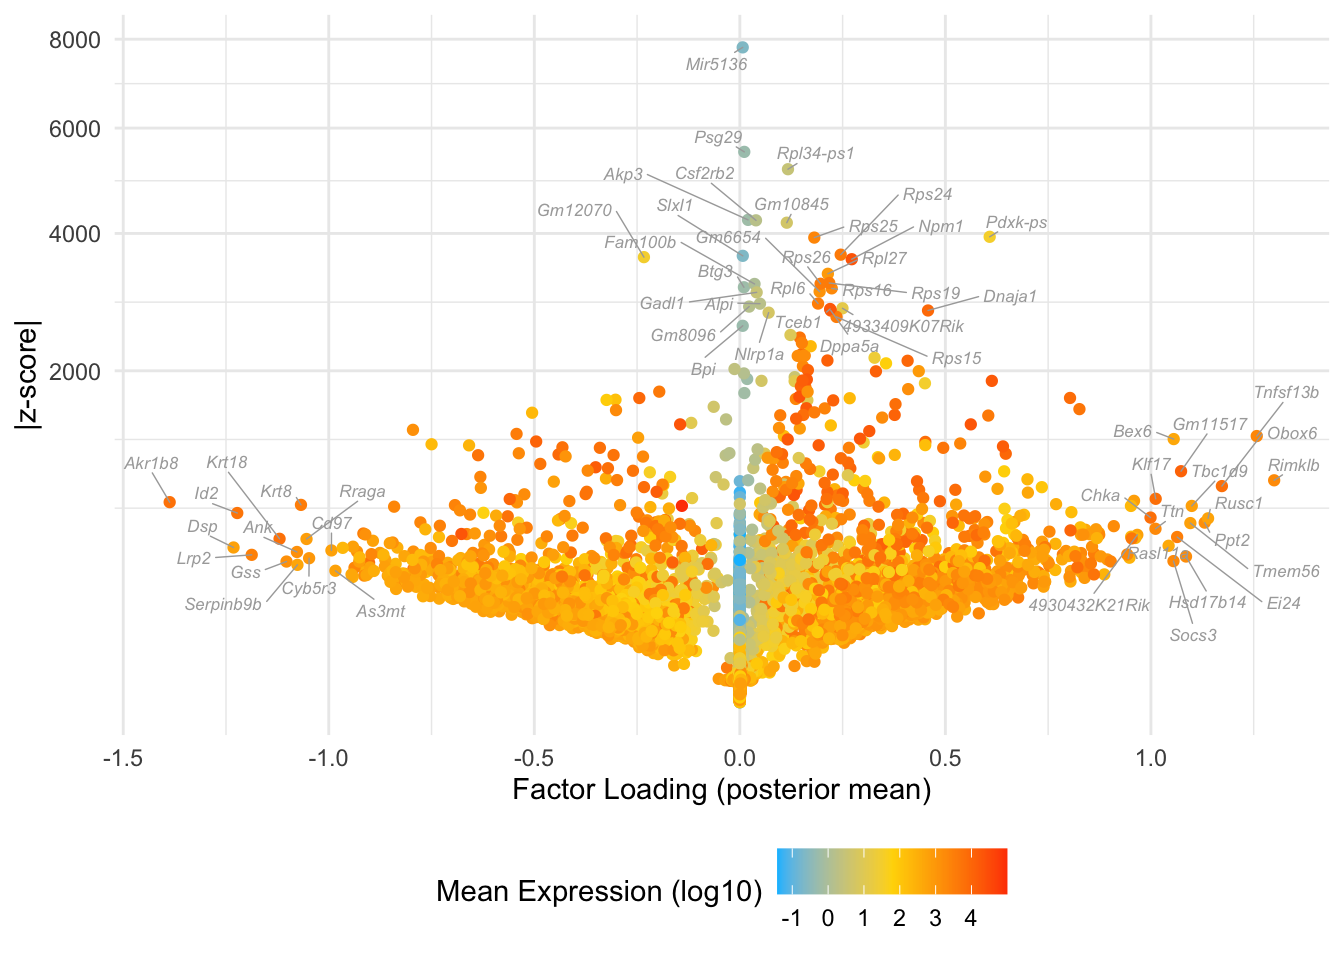
Factor 11: 16-cell to late blastocyte
do.volcano.plot(fl, 11)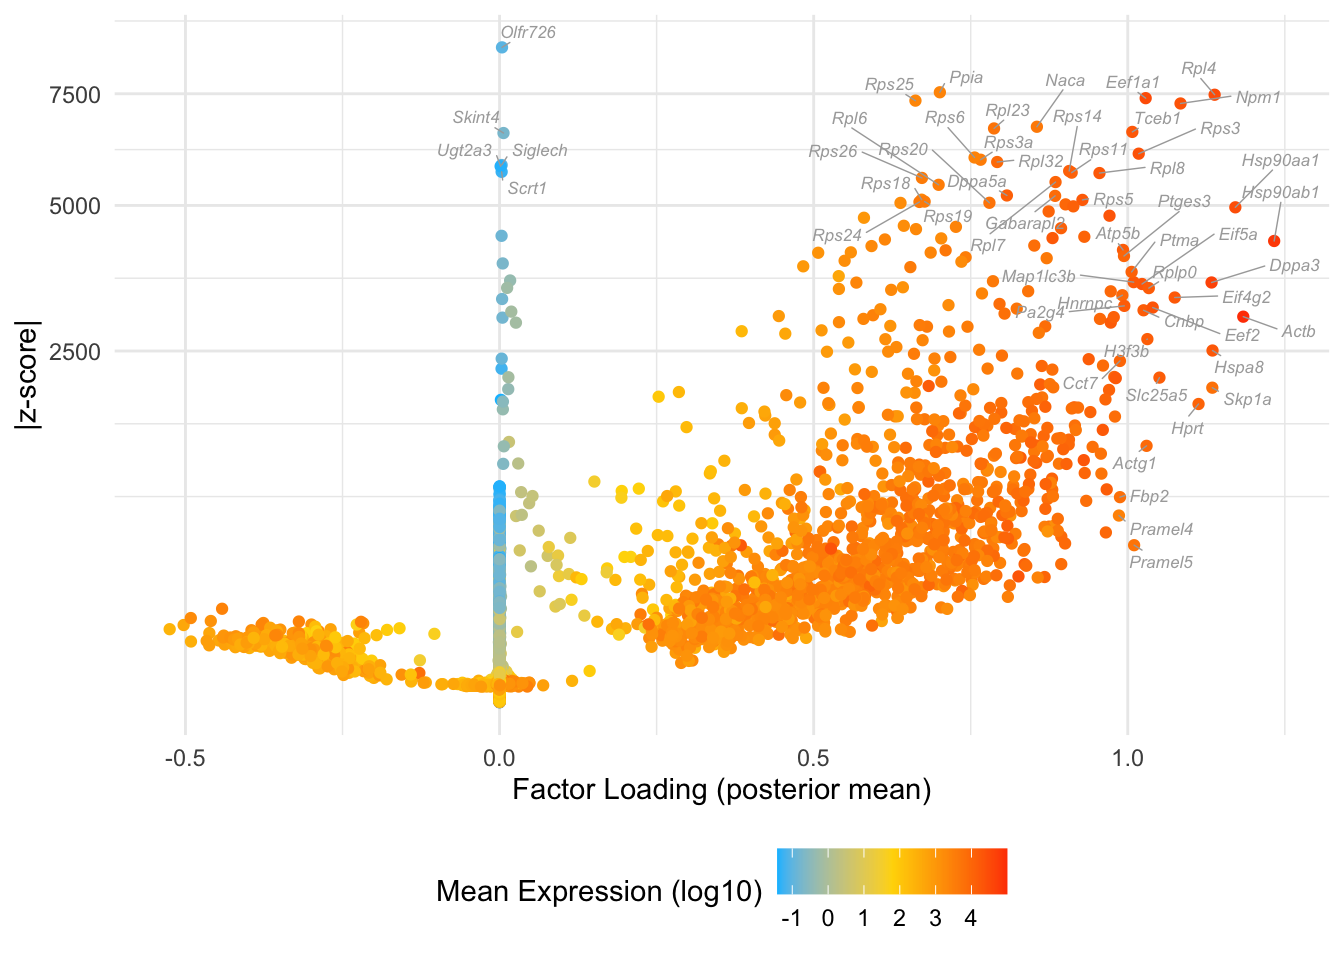
Factor 17: 16-cell to late blastocyte
do.volcano.plot(fl, 17)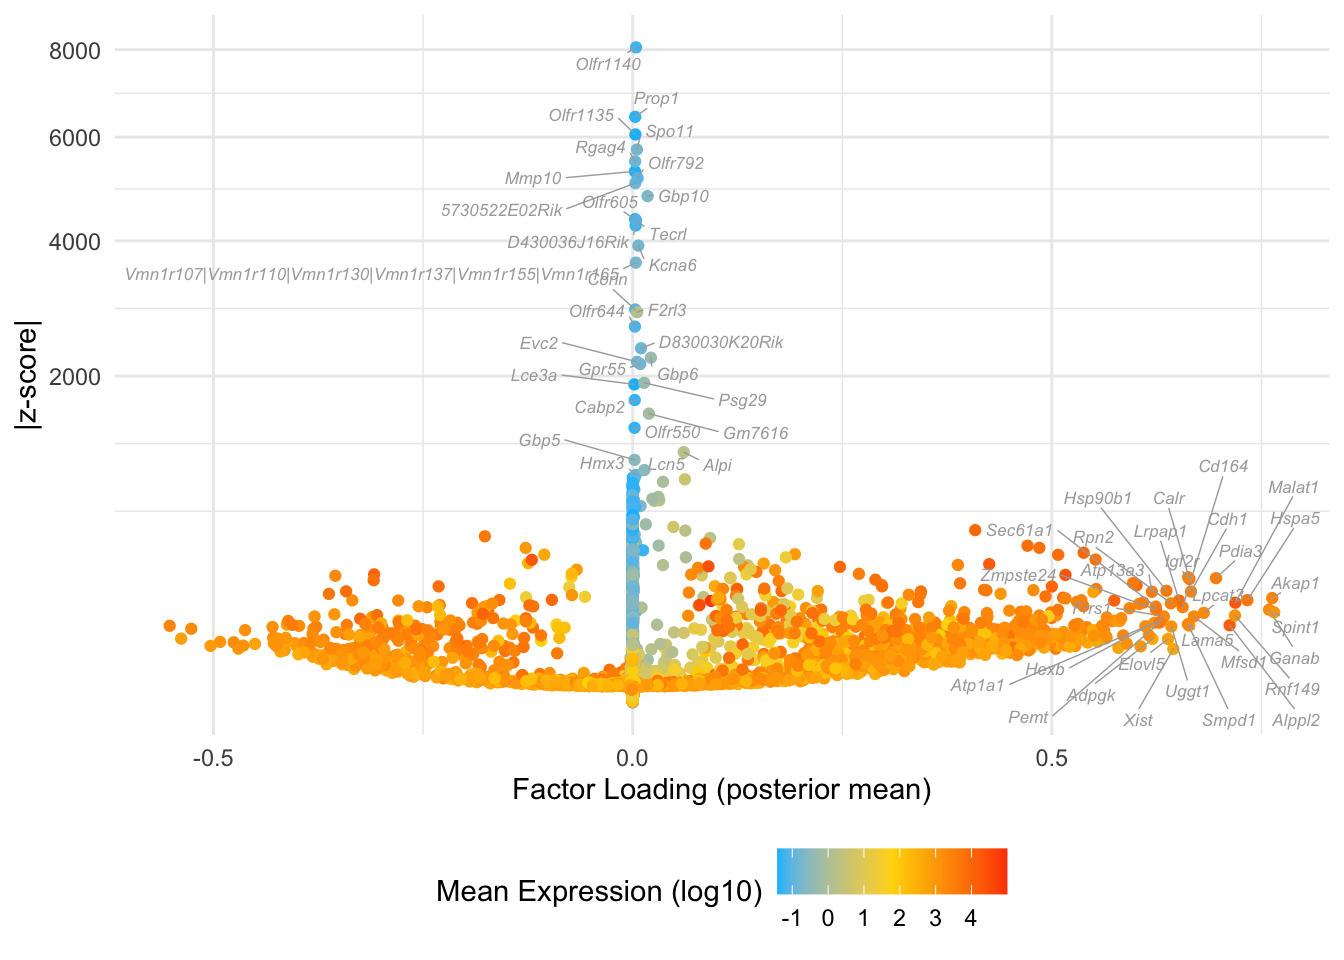
Factor 20: early blastocyte
do.volcano.plot(fl, 20)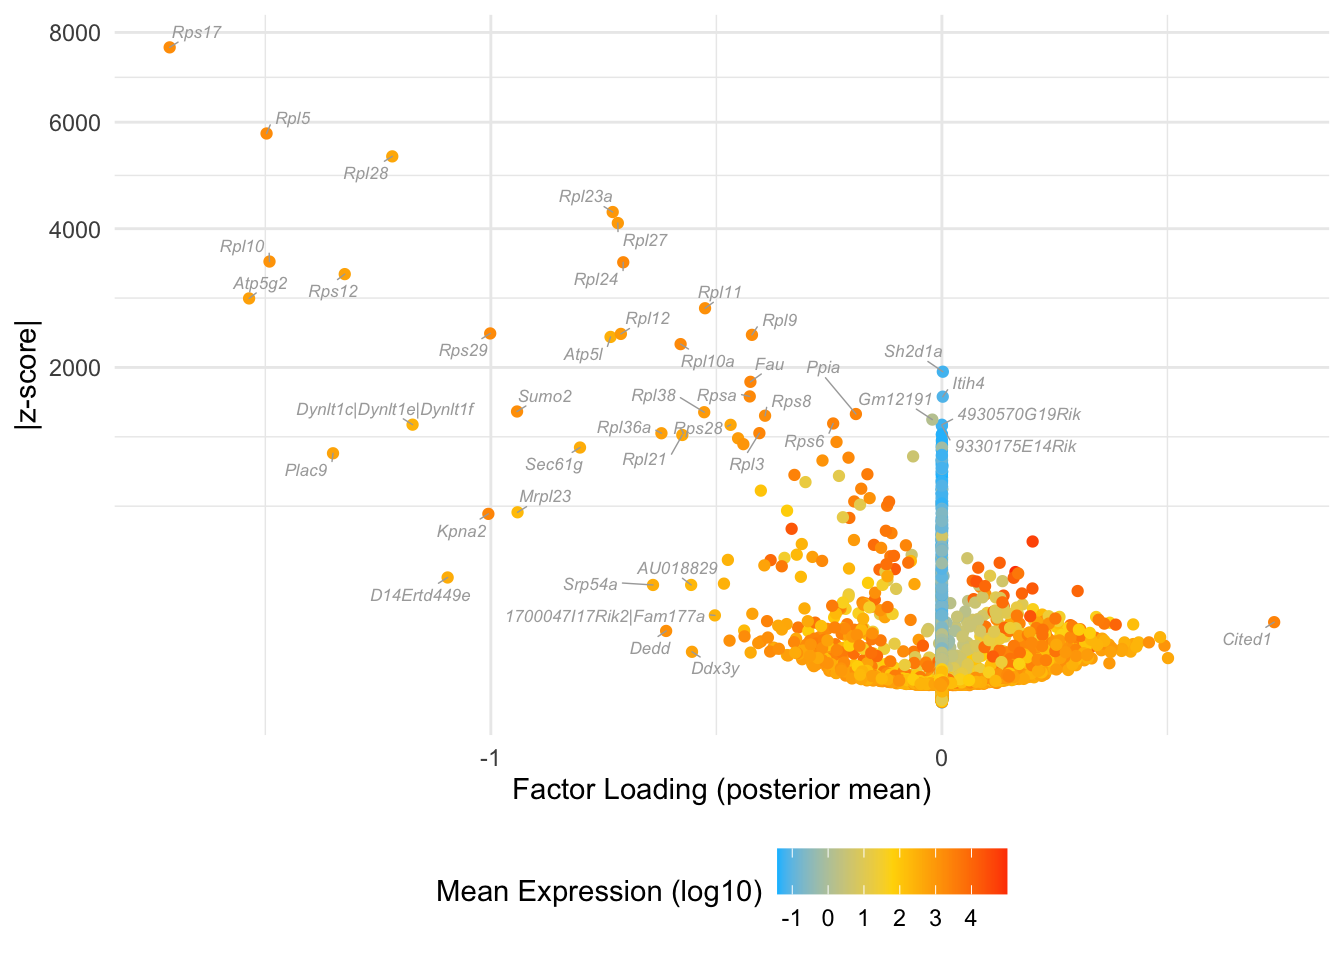
Factor 3: early to late blastocyte
do.volcano.plot(fl, 3)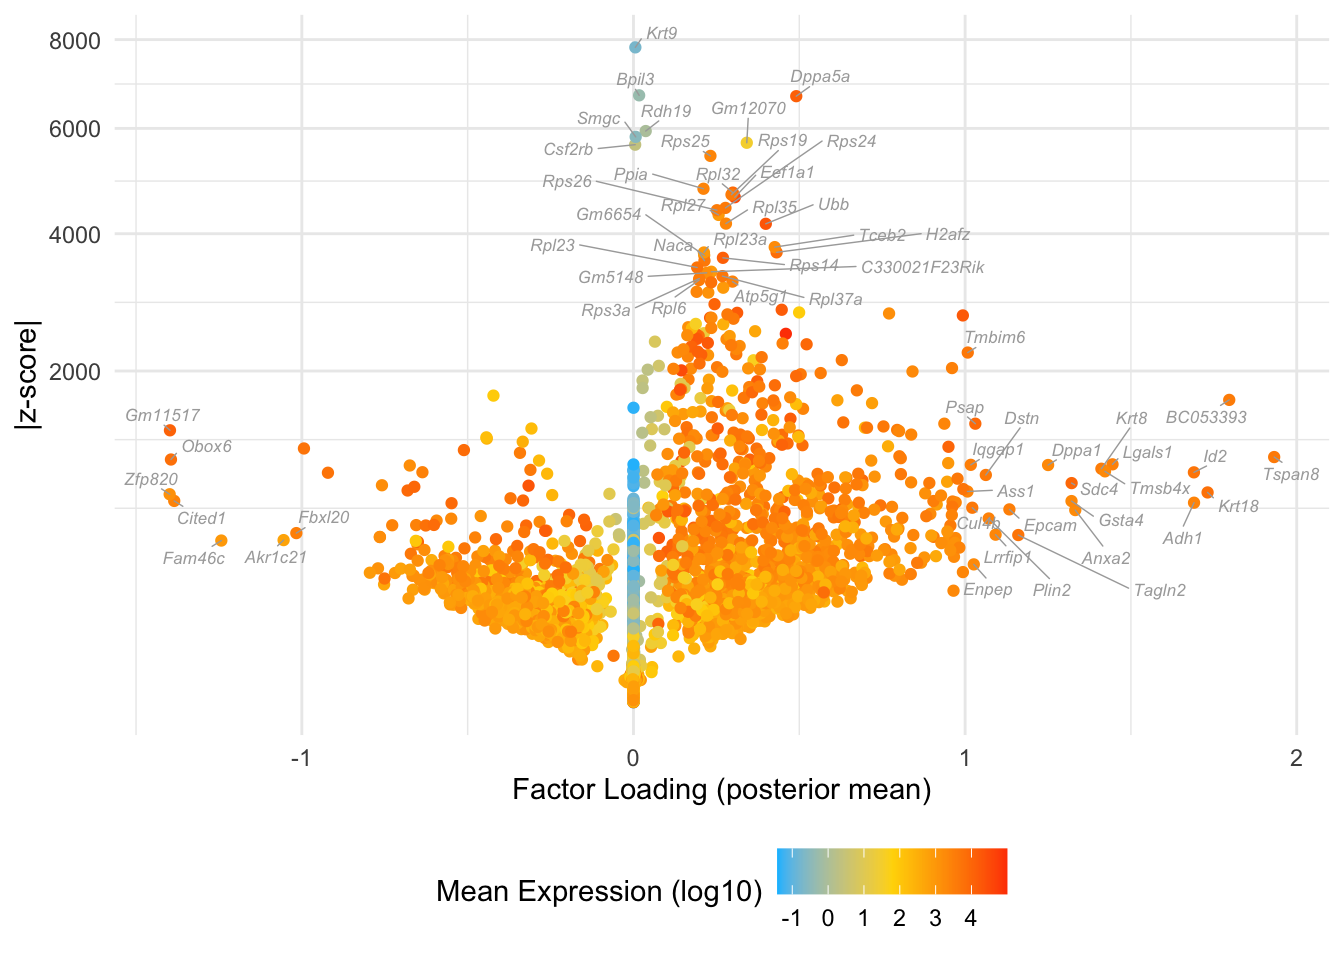
Factor 7: early to late blastocyte
do.volcano.plot(fl, 7)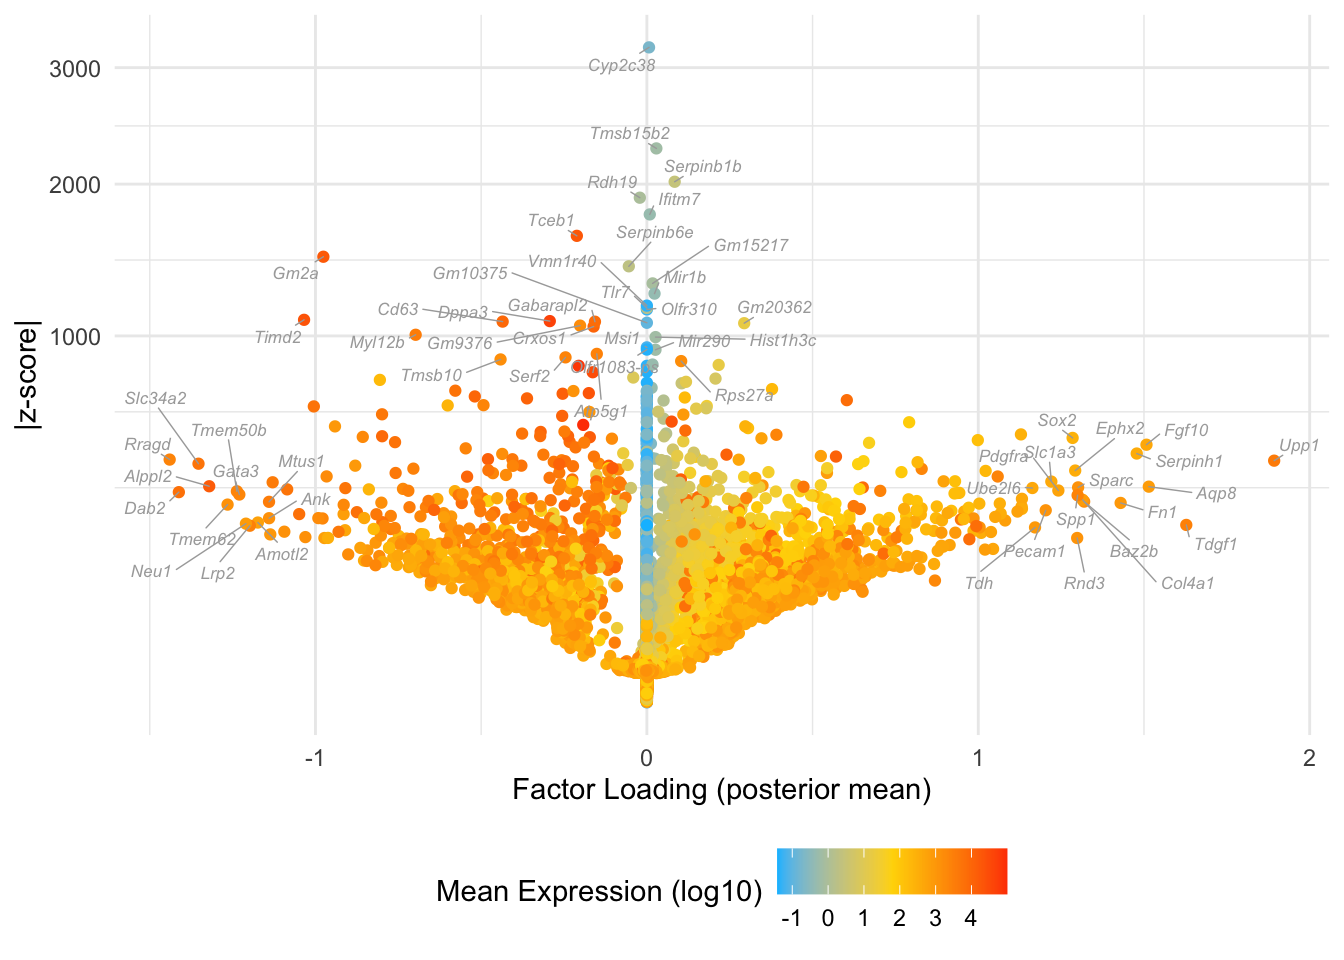
Factor 22: mid blastocyte
do.volcano.plot(fl, 22)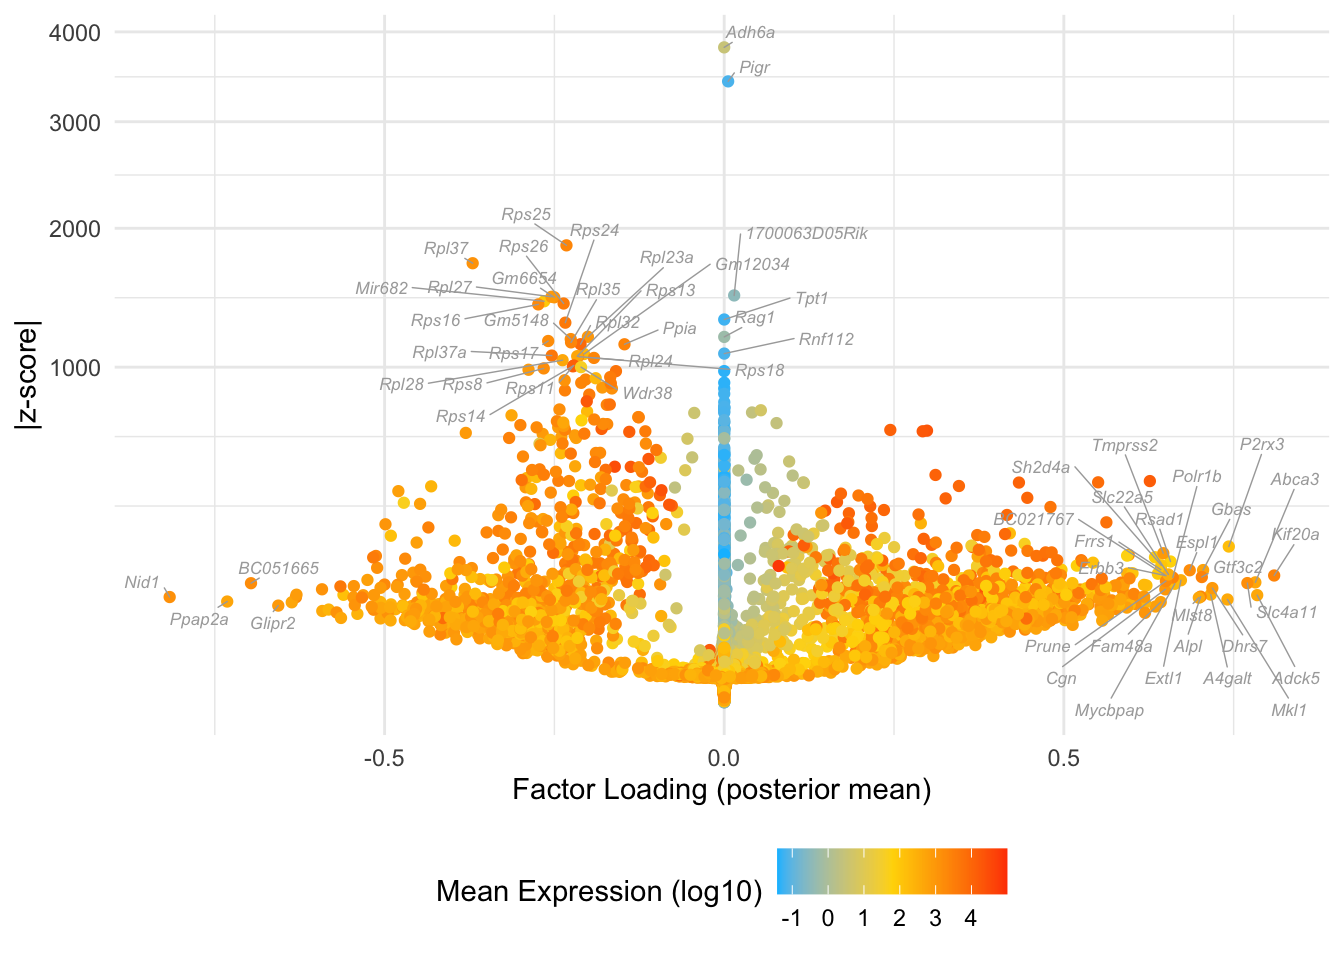
Factor 10: mid to late blastocyte
do.volcano.plot(fl, 10)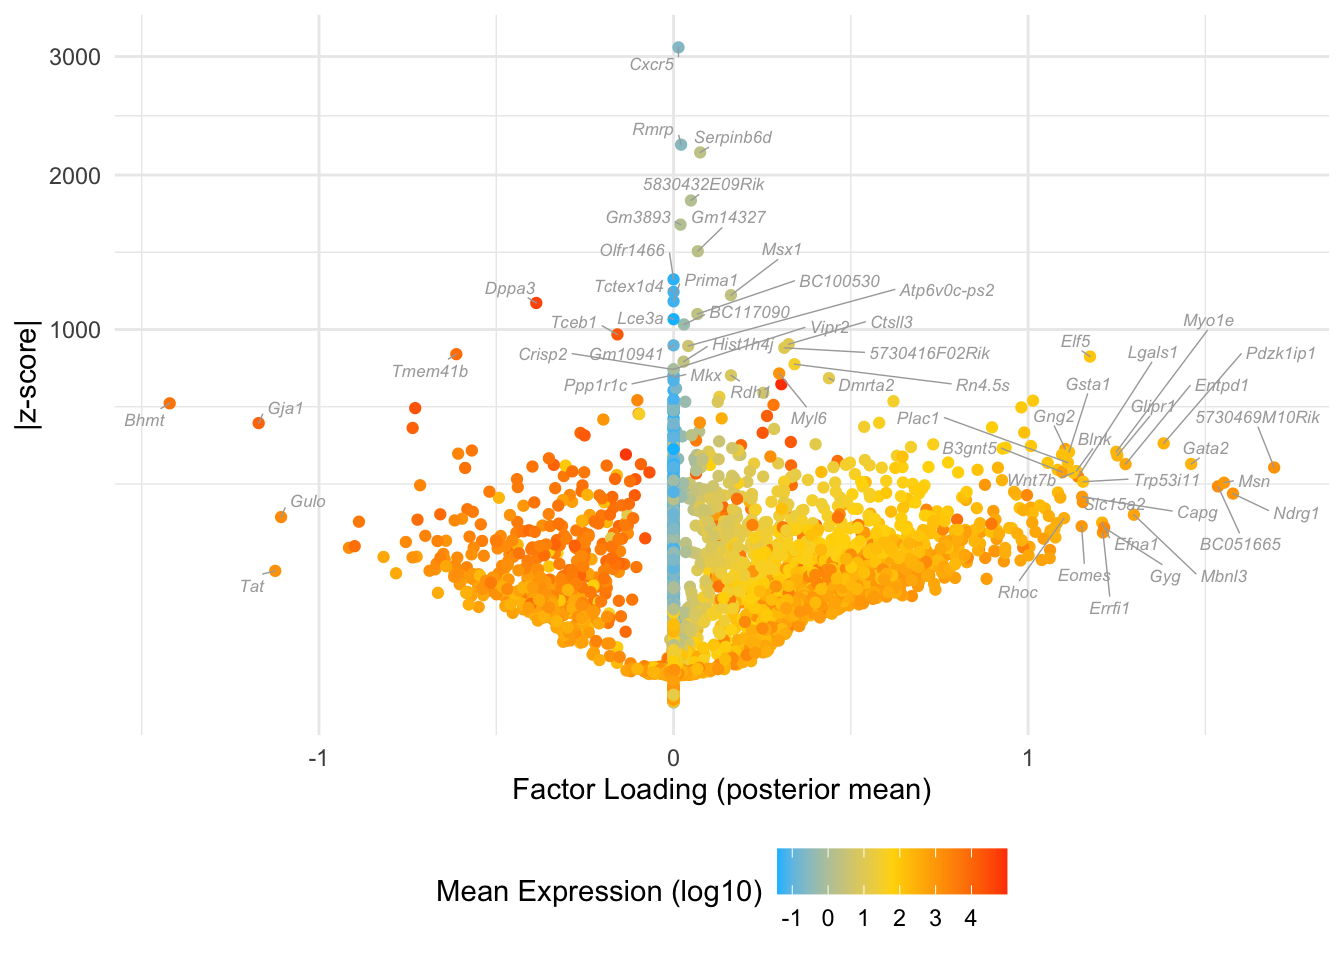
Factor 19: late blastocyte
do.volcano.plot(fl, 19)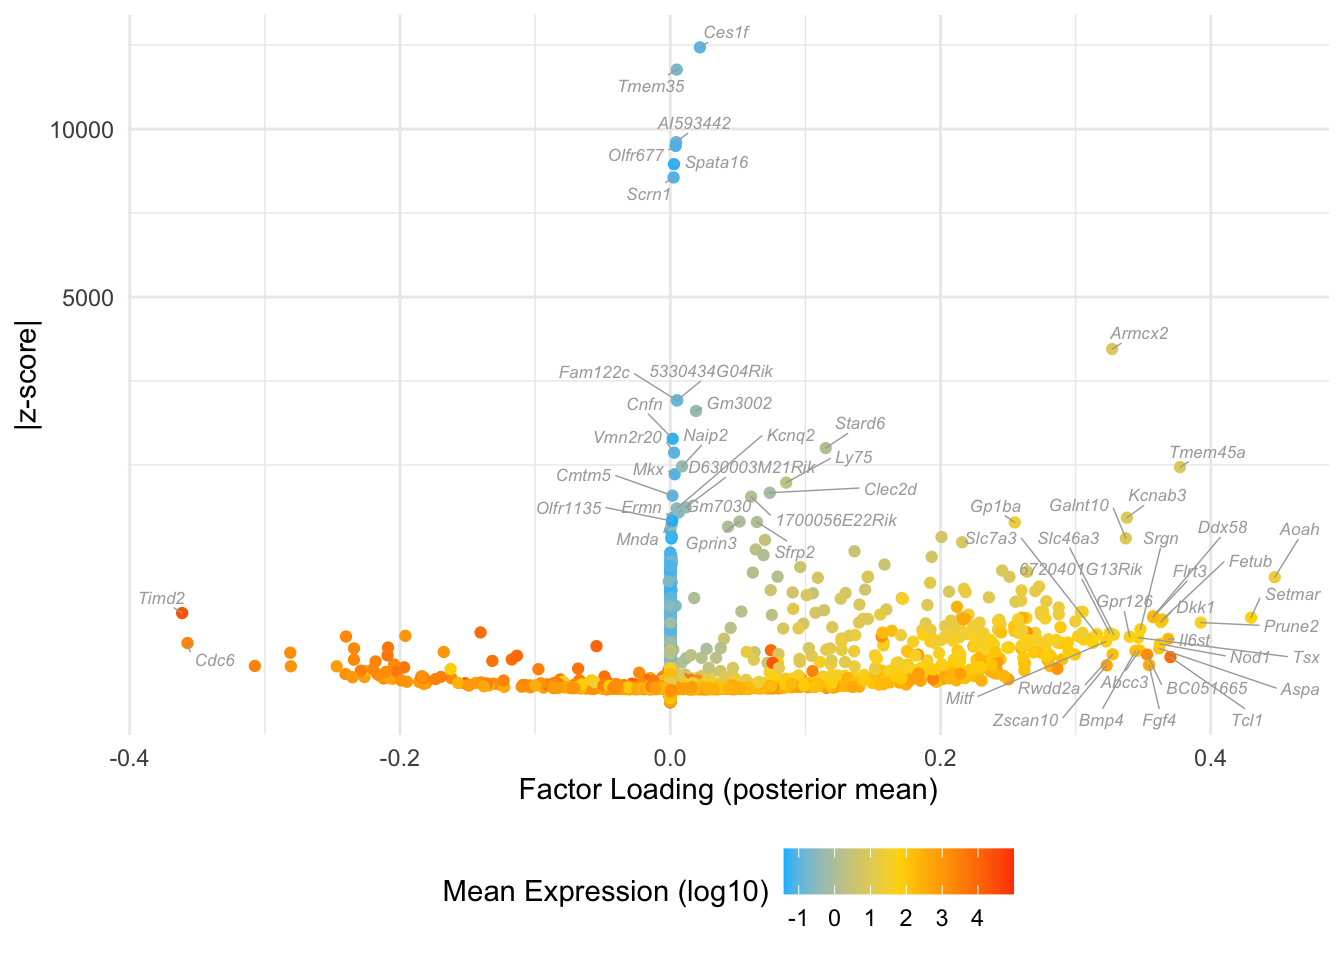
sessionInfo()
#> R version 3.5.3 (2019-03-11)
#> Platform: x86_64-apple-darwin15.6.0 (64-bit)
#> Running under: macOS Mojave 10.14.6
#>
#> Matrix products: default
#> BLAS: /Library/Frameworks/R.framework/Versions/3.5/Resources/lib/libRblas.0.dylib
#> LAPACK: /Library/Frameworks/R.framework/Versions/3.5/Resources/lib/libRlapack.dylib
#>
#> locale:
#> [1] en_US.UTF-8/en_US.UTF-8/en_US.UTF-8/C/en_US.UTF-8/en_US.UTF-8
#>
#> attached base packages:
#> [1] parallel  stats     graphics  grDevices utils     datasets  methods
#> [8] base
#>
#> other attached packages:
#>  [1] singleCellRNASeqMouseDeng2014_0.99.0 Biobase_2.42.0
#>  [3] BiocGenerics_0.28.0                  ggrepel_0.8.2
#>  [5] flashier_0.2.27                      magrittr_2.0.2
#>  [7] forcats_0.5.1                        stringr_1.4.0
#>  [9] dplyr_1.0.8                          purrr_0.3.4
#> [11] readr_2.0.0                          tidyr_1.1.4
#> [13] tibble_3.1.6                         ggplot2_3.3.5
#> [15] tidyverse_1.3.1                      workflowr_1.6.2
#>
#> loaded via a namespace (and not attached):
#>  [1] fs_1.5.0          lubridate_1.7.10  httr_1.4.2        rprojroot_2.0.2
#>  [5] tools_3.5.3       backports_1.1.3   bslib_0.3.1       utf8_1.2.2
#>  [9] R6_2.5.1          irlba_2.3.3       DBI_1.0.0         colorspace_2.0-3
#> [13] withr_2.4.3       tidyselect_1.1.2  compiler_3.5.3    git2r_0.28.0
#> [17] cli_3.2.0         rvest_1.0.0       xml2_1.3.2        labeling_0.4.2
#> [21] horseshoe_0.2.0   sass_0.4.0        scales_1.1.1      SQUAREM_2021.1
#> [25] mixsqp_0.3-43     digest_0.6.29     rmarkdown_2.11    deconvolveR_1.2-1
#> [29] pkgconfig_2.0.3   htmltools_0.5.2   highr_0.9         dbplyr_2.1.1
#> [33] fastmap_1.1.0     invgamma_1.1      rlang_1.0.1       readxl_1.3.1
#> [37] rstudioapi_0.13   farver_2.1.0      jquerylib_0.1.4   generics_0.1.2
#> [41] jsonlite_1.7.2    REBayes_2.50      Matrix_1.3-4      Rcpp_1.0.8
#> [45] munsell_0.5.0     fansi_1.0.2       lifecycle_1.0.1   stringi_1.4.6
#> [49] whisker_0.3-2     yaml_2.2.1        grid_3.5.3        promises_1.1.0
#> [53] crayon_1.5.0      lattice_0.20-38   haven_2.3.1       splines_3.5.3
#> [57] hms_1.1.0         knitr_1.33        pillar_1.7.0      softImpute_1.4-1
#> [61] reprex_2.0.0      glue_1.6.1        evaluate_0.14     trust_0.1-8
#> [65] modelr_0.1.8      vctrs_0.3.8       tzdb_0.1.1        httpuv_1.5.2
#> [69] cellranger_1.1.0  gtable_0.3.0      ebnm_0.1-65       assertthat_0.2.1
#> [73] ashr_2.2-54       xfun_0.29         broom_0.7.6       later_1.0.0
#> [77] truncnorm_1.0-8   ellipsis_0.3.2