Deng et al. dataset
Jason Willwerscheid
3/2/2022
Last updated: 2022-03-06
Checks: 7 0
Knit directory: scFLASH/
This reproducible R Markdown analysis was created with workflowr (version 1.6.2). The Checks tab describes the reproducibility checks that were applied when the results were created. The Past versions tab lists the development history.
Great! Since the R Markdown file has been committed to the Git repository, you know the exact version of the code that produced these results.
Great job! The global environment was empty. Objects defined in the global environment can affect the analysis in your R Markdown file in unknown ways. For reproduciblity it’s best to always run the code in an empty environment.
The command set.seed(20181103) was run prior to running the code in the R Markdown file. Setting a seed ensures that any results that rely on randomness, e.g. subsampling or permutations, are reproducible.
Great job! Recording the operating system, R version, and package versions is critical for reproducibility.
Nice! There were no cached chunks for this analysis, so you can be confident that you successfully produced the results during this run.
Great job! Using relative paths to the files within your workflowr project makes it easier to run your code on other machines.
Great! You are using Git for version control. Tracking code development and connecting the code version to the results is critical for reproducibility.
The results in this page were generated with repository version 09e9cc2. See the Past versions tab to see a history of the changes made to the R Markdown and HTML files.
Note that you need to be careful to ensure that all relevant files for the analysis have been committed to Git prior to generating the results (you can use wflow_publish or wflow_git_commit). workflowr only checks the R Markdown file, but you know if there are other scripts or data files that it depends on. Below is the status of the Git repository when the results were generated:
Ignored files:
    Ignored:    .DS_Store
    Ignored:    .Rhistory
    Ignored:    .Rproj.user/
    Ignored:    code/initialization/
    Ignored:    data-raw/10x_assigned_cell_types.R
    Ignored:    data/.DS_Store
    Ignored:    data/10x/
    Ignored:    data/Ensembl2Reactome.txt
    Ignored:    data/droplet.rds
    Ignored:    data/mus_pathways.rds
    Ignored:    output/backfit/
    Ignored:    output/final_montoro/
    Ignored:    output/lowrank/
    Ignored:    output/prior_type/
    Ignored:    output/pseudocount/
    Ignored:    output/pseudocount_redux/
    Ignored:    output/size_factors/
    Ignored:    output/var_reg/
    Ignored:    output/var_type/

Untracked files:
    Untracked:  analysis/NBapprox.Rmd
    Untracked:  analysis/final_pbmc.Rmd
    Untracked:  analysis/trachea4.Rmd
    Untracked:  code/alt_montoro/
    Untracked:  code/final_pbmc/
    Untracked:  code/missing_data.R
    Untracked:  code/prior_type/priortype_fits_pbmc.R
    Untracked:  code/pseudocount_redux/pseudocount_fits_pbmc.R
    Untracked:  code/pulseseq/
    Untracked:  code/size_factors/sizefactor_fits_pbmc.R
    Untracked:  code/trachea4.R
    Untracked:  mixsqp_fail.rds
    Untracked:  output/alt_montoro/
    Untracked:  output/deng/
    Untracked:  output/final_pbmc/
    Untracked:  output/pulseseq_fit.rds

Unstaged changes:
    Modified:   code/deng/deng.R
    Modified:   code/utils.R
    Modified:   data-raw/pbmc.R
Note that any generated files, e.g. HTML, png, CSS, etc., are not included in this status report because it is ok for generated content to have uncommitted changes.
These are the previous versions of the repository in which changes were made to the R Markdown (analysis/deng.Rmd) and HTML (docs/deng.html) files. If you’ve configured a remote Git repository (see ?wflow_git_remote), click on the hyperlinks in the table below to view the files as they were in that past version.
| File | Version | Author | Date | Message |
|---|---|---|---|---|
| Rmd | 09e9cc2 | Jason Willwerscheid | 2022-03-06 | wflow_publish(“analysis/deng.Rmd”) |
| html | 801dec2 | Jason Willwerscheid | 2022-03-04 | Build site. |
| Rmd | 2a6903b | Jason Willwerscheid | 2022-03-04 | wflow_publish(“./analysis/deng.Rmd”) |
| html | a9459a1 | Jason Willwerscheid | 2022-03-03 | Build site. |
| Rmd | 6928fd7 | Jason Willwerscheid | 2022-03-03 | wflow_publish(“analysis/deng.Rmd”) |
| html | f7e7249 | Jason Willwerscheid | 2022-03-02 | Build site. |
| Rmd | b788456 | Jason Willwerscheid | 2022-03-02 | wflow_publish(“analysis/deng.Rmd”) |
Overview
library(tidyverse)
#> ── Attaching packages ─────────────────────────────────────── tidyverse 1.3.1 ──
#> ✓ ggplot2 3.3.5     ✓ purrr   0.3.4
#> ✓ tibble  3.1.6     ✓ dplyr   1.0.8
#> ✓ tidyr   1.2.0     ✓ stringr 1.4.0
#> ✓ readr   2.0.0     ✓ forcats 0.5.1
#> ── Conflicts ────────────────────────────────────────── tidyverse_conflicts() ──
#> x dplyr::filter() masks stats::filter()
#> x dplyr::lag()    masks stats::lag()
library(flashier)
#> Loading required package: magrittr
#>
#> Attaching package: 'magrittr'
#> The following object is masked from 'package:purrr':
#>
#>     set_names
#> The following object is masked from 'package:tidyr':
#>
#>     extract
library(ggrepel)
library(singleCellRNASeqMouseDeng2014)
#> Loading required package: Biobase
#> Loading required package: BiocGenerics
#> Loading required package: parallel
#>
#> Attaching package: 'BiocGenerics'
#> The following objects are masked from 'package:parallel':
#>
#>     clusterApply, clusterApplyLB, clusterCall, clusterEvalQ,
#>     clusterExport, clusterMap, parApply, parCapply, parLapply,
#>     parLapplyLB, parRapply, parSapply, parSapplyLB
#> The following objects are masked from 'package:dplyr':
#>
#>     combine, intersect, setdiff, union
#> The following objects are masked from 'package:stats':
#>
#>     IQR, mad, sd, var, xtabs
#> The following objects are masked from 'package:base':
#>
#>     anyDuplicated, append, as.data.frame, basename, cbind, colMeans,
#>     colnames, colSums, dirname, do.call, duplicated, eval, evalq,
#>     Filter, Find, get, grep, grepl, intersect, is.unsorted, lapply,
#>     lengths, Map, mapply, match, mget, order, paste, pmax, pmax.int,
#>     pmin, pmin.int, Position, rank, rbind, Reduce, rowMeans, rownames,
#>     rowSums, sapply, setdiff, sort, table, tapply, union, unique,
#>     unsplit, which, which.max, which.min
#> Welcome to Bioconductor
#>
#>     Vignettes contain introductory material; view with
#>     'browseVignettes()'. To cite Bioconductor, see
#>     'citation("Biobase")', and for packages 'citation("pkgname")'.
library(Rtsne)
library(fastTopics)

counts <- exprs(Deng2014MouseESC)
meta_data <- pData(Deng2014MouseESC)
gene_names <- rownames(counts)

preprocess <- function(dat, min.nzcts = 10) {
  size.factors <- colSums(dat)
  size.factors <- size.factors / mean(size.factors)
  gene_cts <- rowSums(dat > 0)
  dat <- dat[gene_cts >= min.nzcts, ]

  lunpc <- max(1 / min(size.factors) - 1 / max(size.factors), 1)
  fl.dat <- log1p(t(t(dat) / size.factors) / lunpc)

  return(list(
    dat = dat,
    fl.dat = fl.dat,
    size.factors = size.factors,
    excluded.genes = gene_cts < min.nzcts)
  )
}
Deng <- preprocess(counts)
The dataset, from Deng et al., is made available by kkdey’s R package singleCellRNASeqMouseDeng2014, which I installed using command remotes::install_github("kkdey/singleCellRNASeqMouseDeng2014").
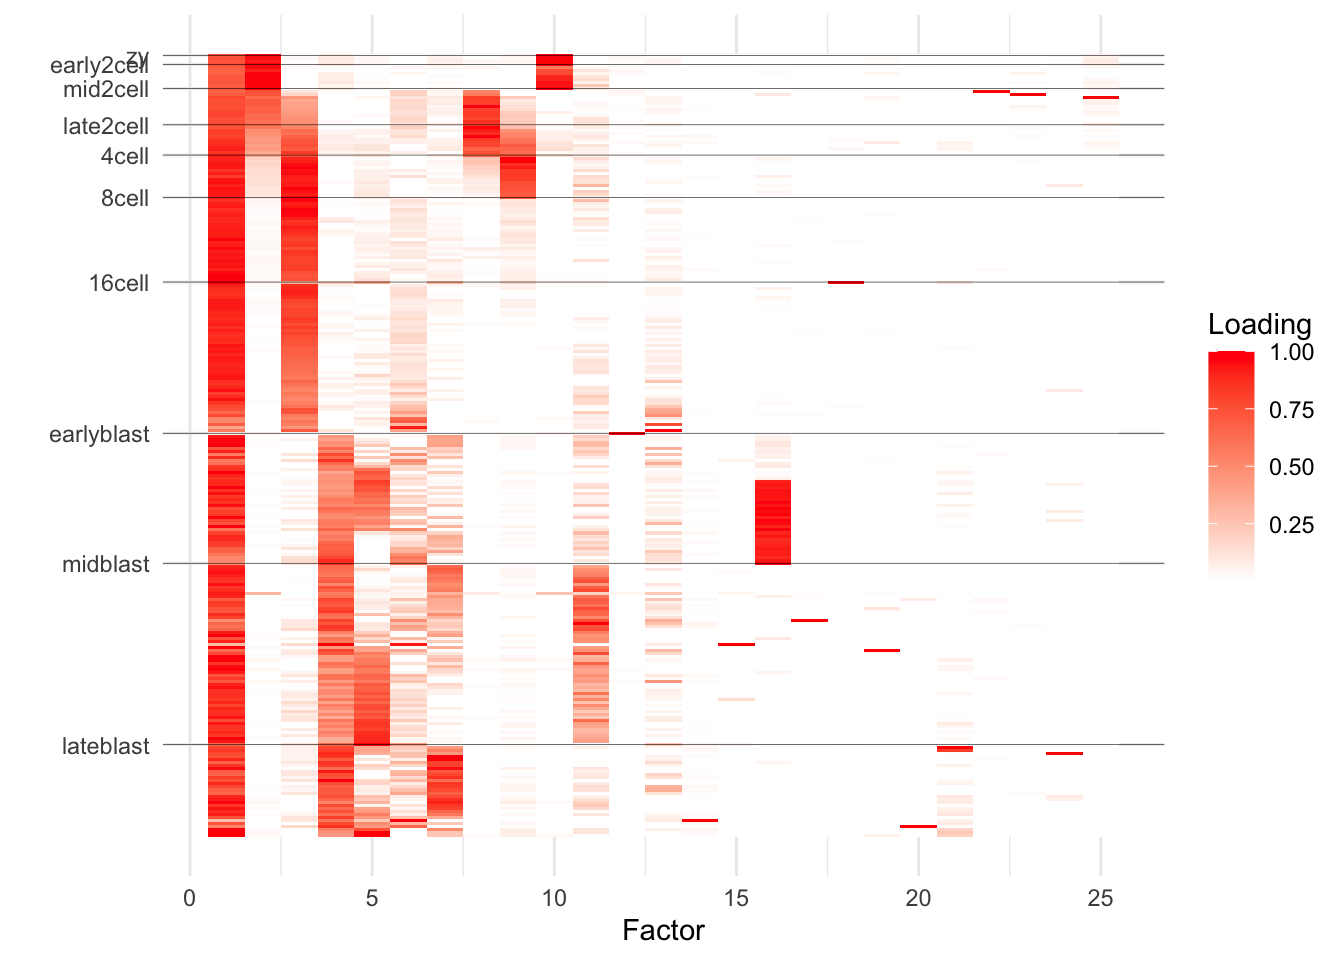
After removing genes with nonzero counts in fewer than 10 cells, there remain counts for 17176 genes and 259 cells. Each cell has been labelled as one of 10 cell types (or rather, one of 10 embryonic stages ranging from zygote to late blastocyte).
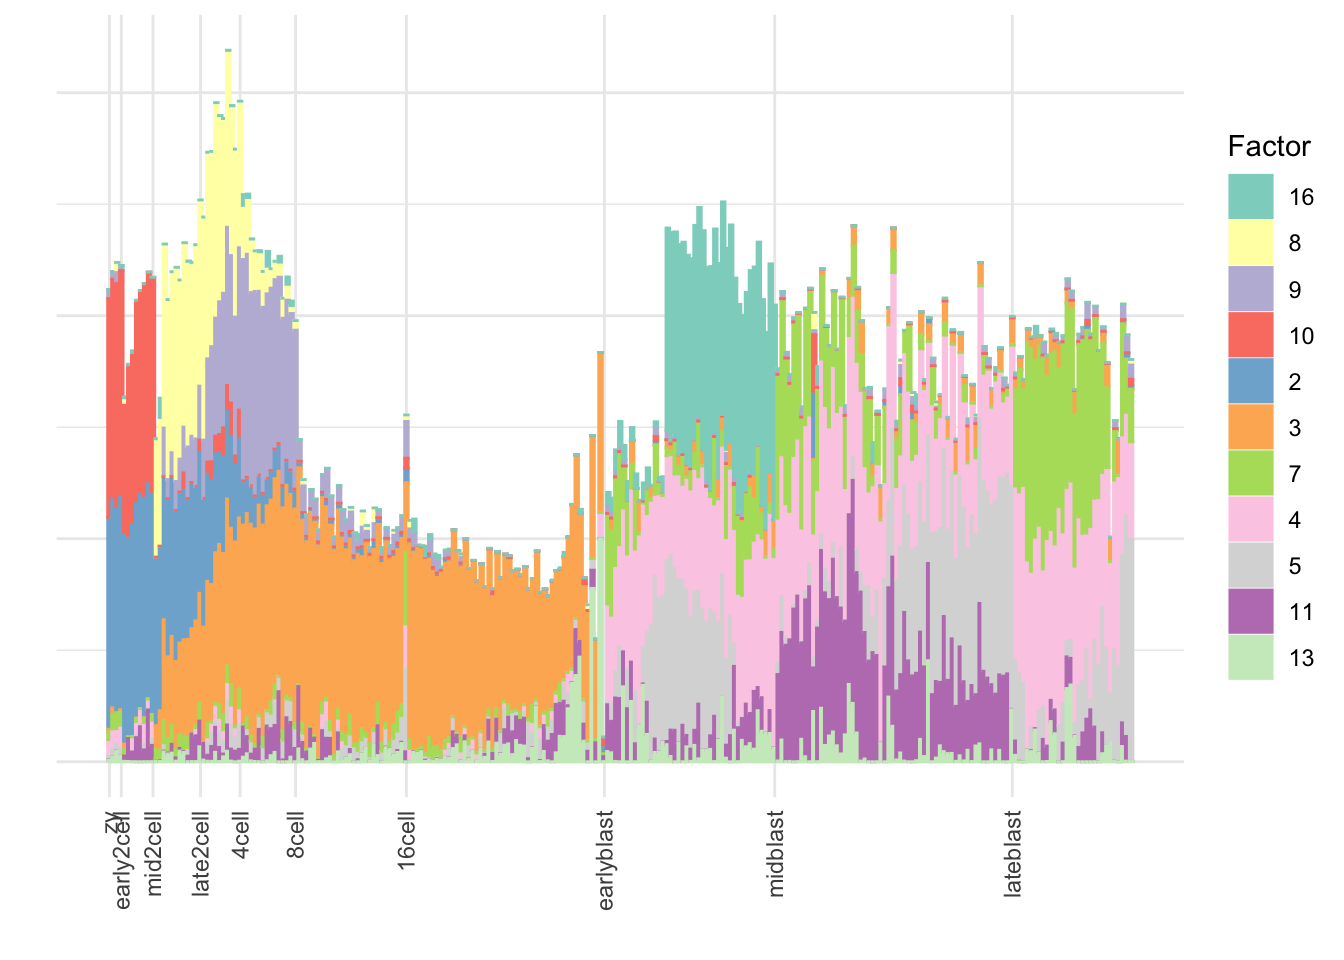
I fit 6, 10, and 25 semi-nonnegative EBMF factors using flashier. Code is here. In the heatmaps below, rows correspond to individual cells, and factors (columns) are arranged in order of decreasing proportion of variance explained. I also show stacked bar plots for purposes of comparison with STRUCTURE plots.
do.plots <- function(fl, fct_order) {
  FF <- ldf(fl, type = "I")$F
  FF <- FF[, order(fl$pve, decreasing = TRUE)]
  colnames(FF) <- 1:ncol(FF)

  cell_type <- meta_data$cell_type

  tib <- as_tibble(FF) %>%
    mutate(Cell.type = cell_type) %>%
    mutate(Cell.type = fct_relevel(Cell.type, c(
      "zy",
      "early2cell", "mid2cell", "late2cell",
      "4cell", "8cell", "16cell",
      "earlyblast", "midblast", "lateblast"
    )))

  tsne_res <- Rtsne(
    as.matrix(tib %>% select(-`1`, -Cell.type)),
    dims = 1,
    perplexity = pmax(1, floor((nrow(tib) - 1) / 3) - 1),
    pca = FALSE,
    normalize = FALSE,
    theta = 0.1,
    check_duplicates = FALSE,
    verbose = FALSE
  )$Y[, 1]
  tib <- tib %>%
    mutate(tsne_res = unlist(tsne_res)) %>%
    arrange(Cell.type, tsne_res) %>%
    mutate(Cell.idx = row_number()) %>%
    select(-tsne_res)

  tib <- tib %>%
    pivot_longer(
      -c(Cell.idx, Cell.type),
      names_to = "Factor",
      values_to = "Loading",
      values_drop_na = TRUE
    ) %>%
    mutate(Factor = as.numeric(Factor))

  cell_type_breaks <- c(1, which(cell_type[2:nrow(tib)] != cell_type[1:(nrow(tib) - 1)]))
  heatmap <- ggplot(tib, aes(x = Factor, y = -Cell.idx, fill = Loading)) +
    geom_tile() +
    scale_fill_gradient(low = "white", high = "red") +
    labs(y = "") +
    scale_y_continuous(breaks = -cell_type_breaks,
                       minor_breaks = NULL,
                       labels = levels(tib$Cell.type)) +
    theme_minimal() +
    geom_hline(yintercept = -cell_type_breaks, size = 0.1)

  tib <- tib %>%
    filter(Factor %in% fct_order) %>%
    mutate(Factor = factor(Factor, levels = fct_order))
  stkbar <- ggplot(tib, aes(x = Cell.idx, y = Loading, fill = Factor, color = Factor)) +
    geom_bar(position = "stack", stat = "identity") +
    scale_fill_brewer(palette = "Set3") +
    scale_color_brewer(palette = "Set3") +
    theme_minimal() +
    labs(x = "", y = "") +
    scale_x_continuous(breaks = cell_type_breaks,
                       minor_breaks = NULL,
                       labels = levels(tib$Cell.type)) +
    theme(axis.text.x = element_text(angle = 90, vjust = 0.5, hjust=1),
          axis.text.y = element_blank())

  return(list(heatmap = heatmap, stkbar = stkbar))
}
6-factor fit
fl6 <- readRDS("./output/deng/deng_fl6.rds")
plt6 <- do.plots(fl6, rev(c(6, 4, 2, 3, 5)))
plt6$heatmap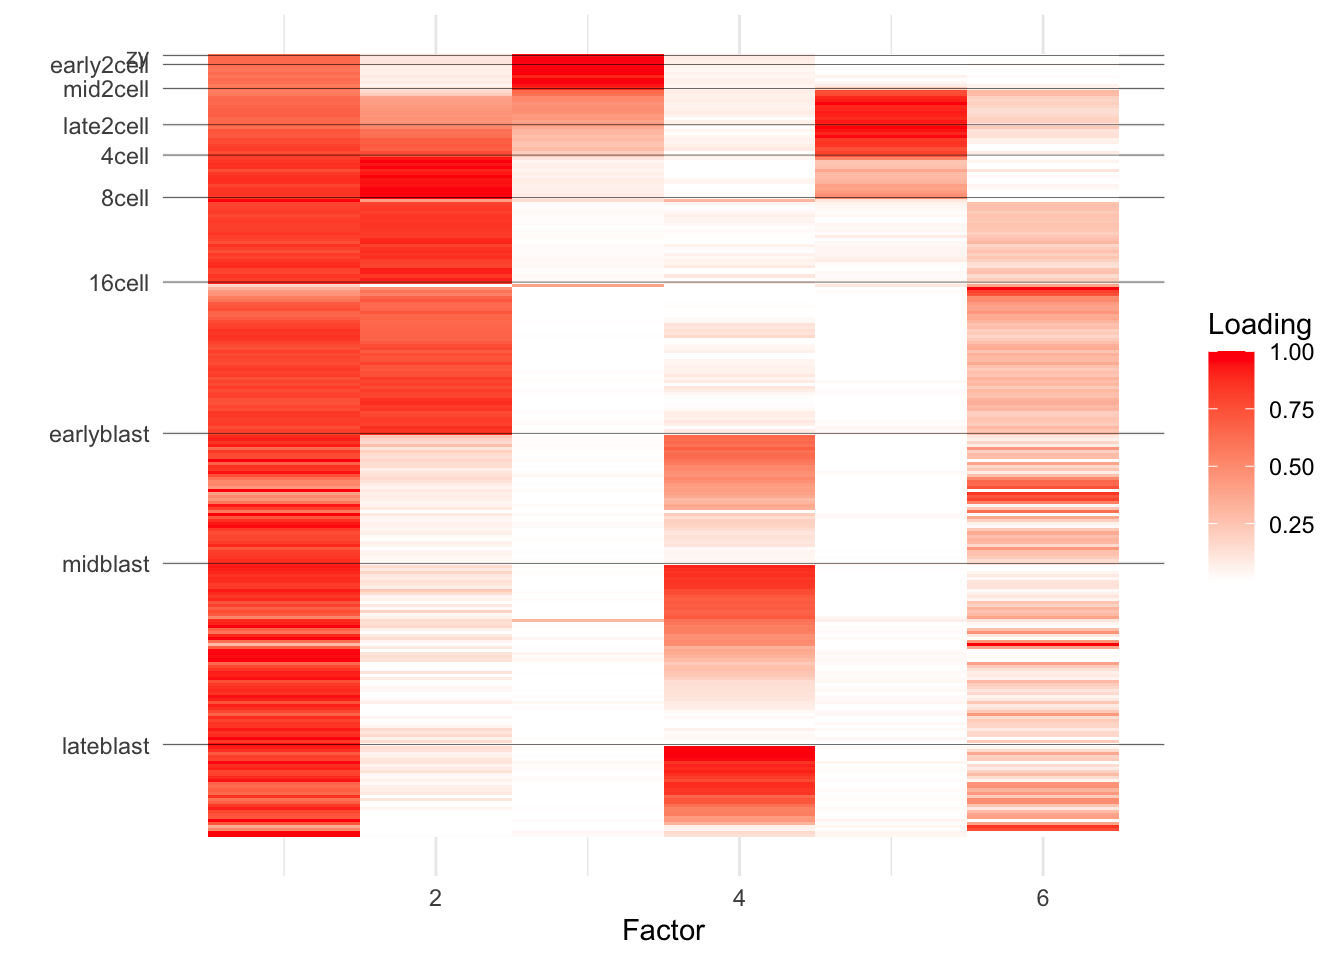
plt6$stkbar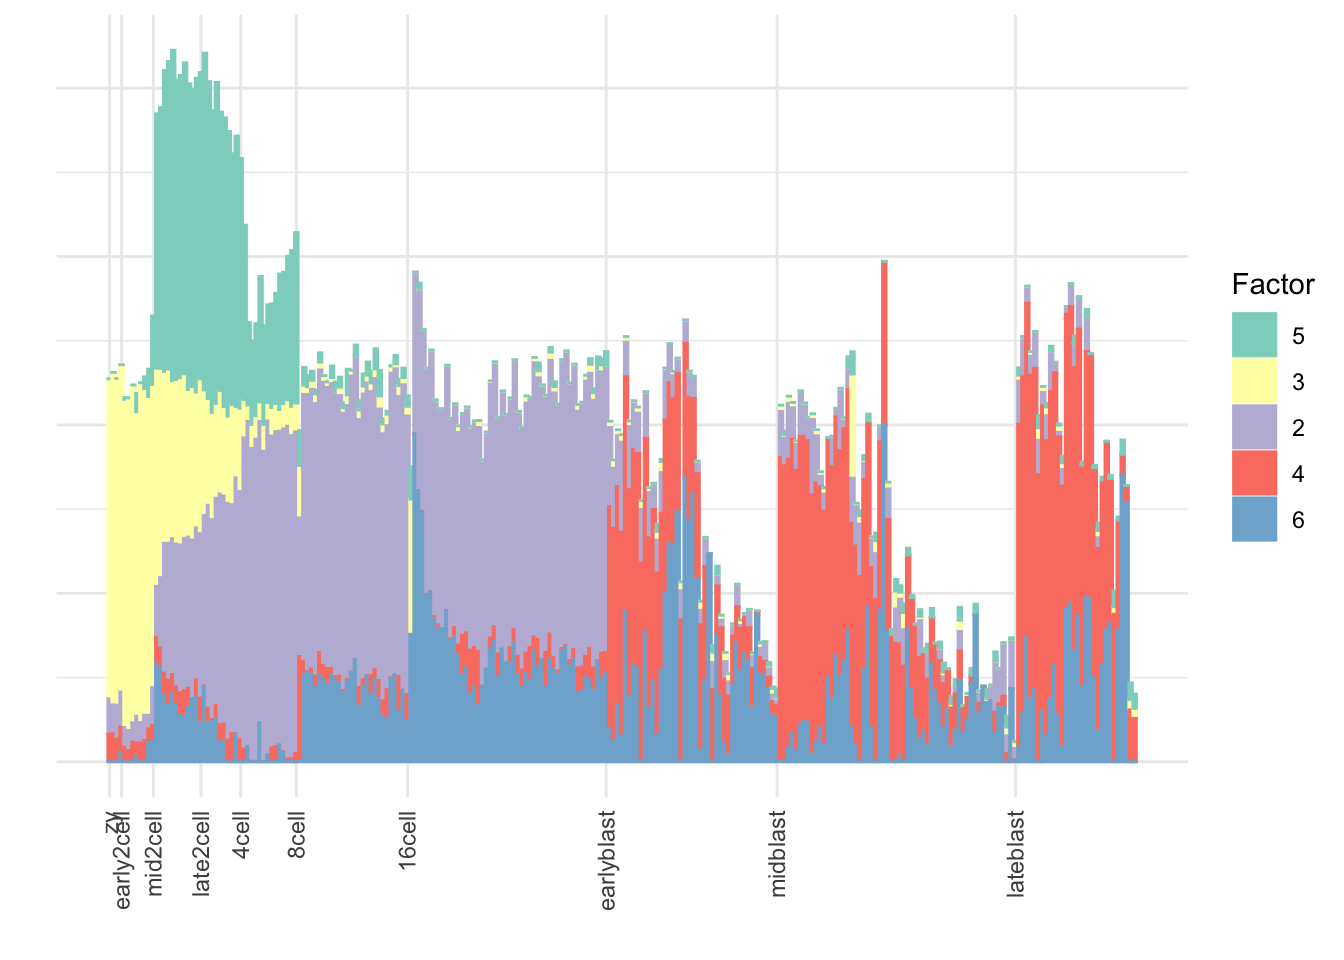
10-factor fit
fl10 <- readRDS("./output/deng/deng_fl10.rds")
plt10 <- do.plots(fl10, rev(c(6, 4, 5, 3, 2, 7, 9, 8)))
plt10$heatmap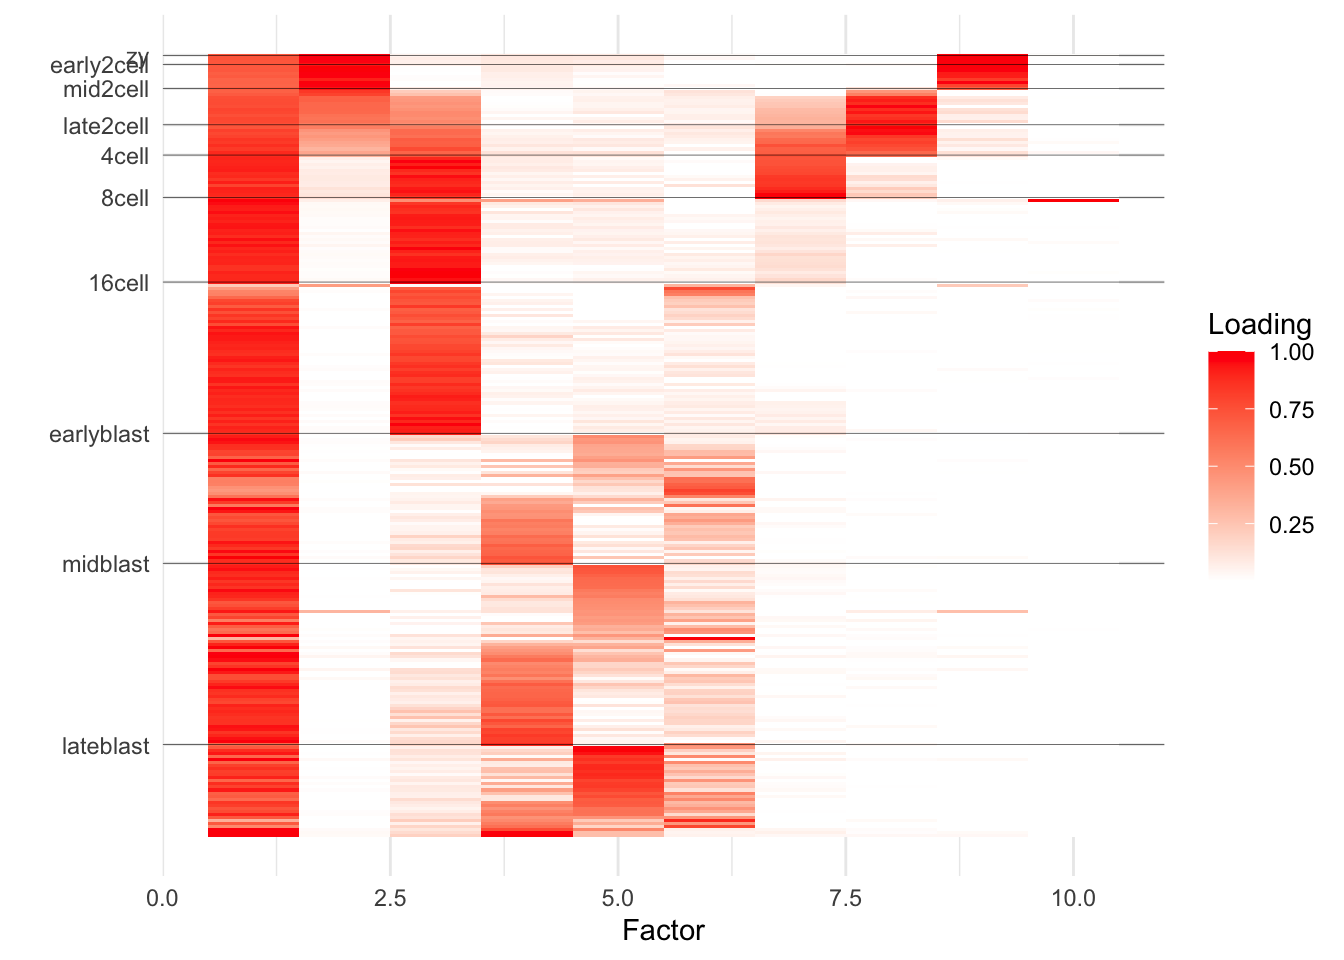
plt10$stkbar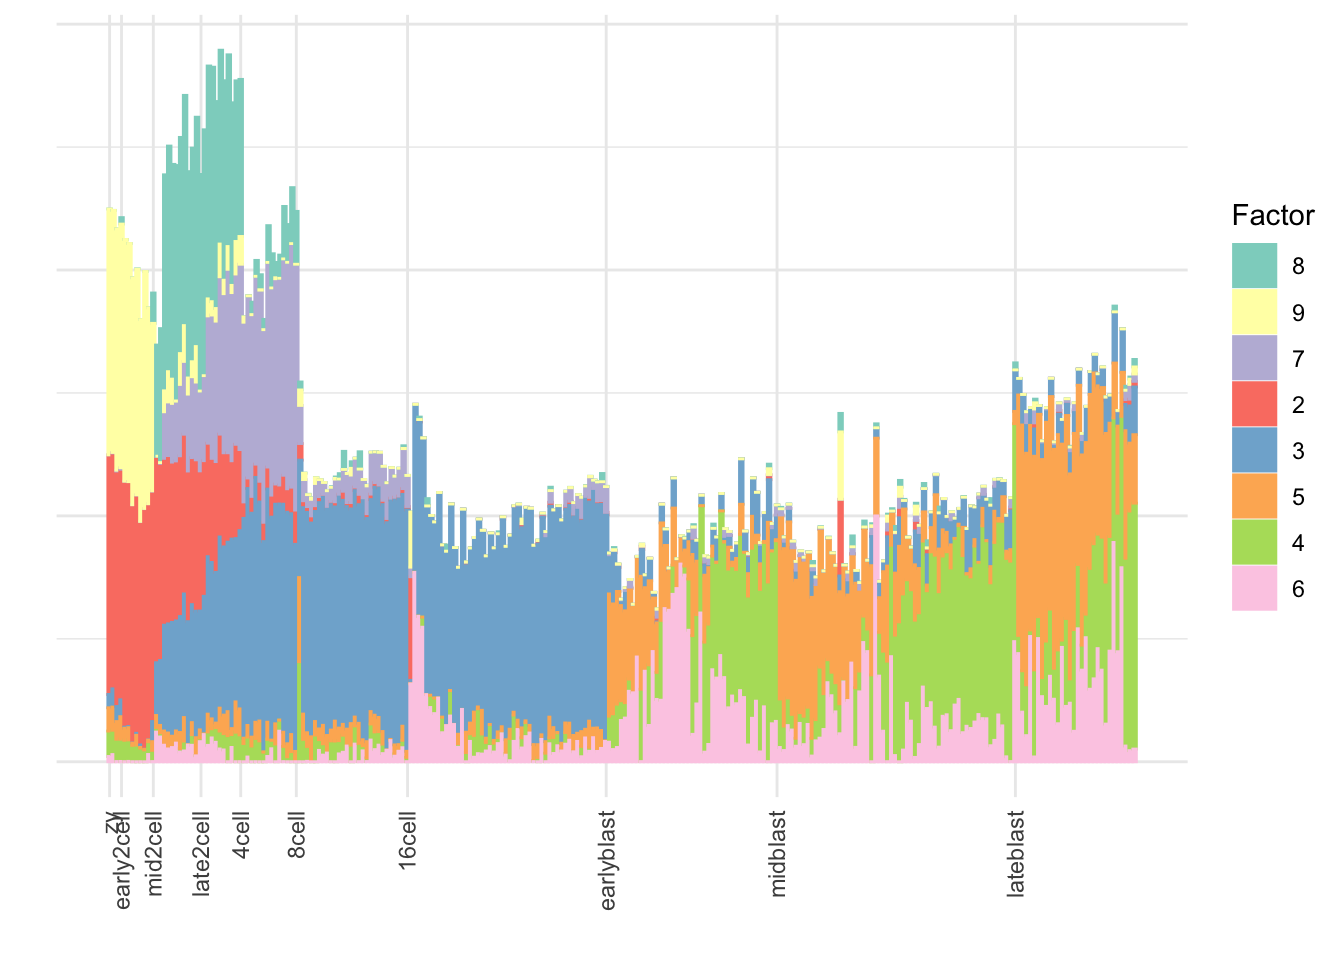
Top genes
Many of the factors in the 25-factor fit seem to primarily capture noise in individual cells. I show volcano plots for the more interesting factors, which I’ve grouped (major factors 2-4; “sub-factors” 5-10; and then interestingly localized minor factors 11 and 16) and arranged in rough ontogenetic order. I label the top 20 genes by (absolute) z-score (defined as posterior mean / posterior SD) as well as the top 20 by (absolute) posterior mean.
do.volcano.plot <- function(fl, k) {
  k <- order(fl$pve, decreasing = TRUE)[k]
  tib <- tibble(
    pm = fl$L.pm[, k],
    z = abs(fl$L.pm[, k]) / pmax(sqrt(.Machine$double.eps), fl$L.psd[, k]),
    exprmean = log10(rowMeans(Deng$dat)),
    SYMBOL = rownames(fl$L.pm)
  ) %>%
    mutate(SYMBOL = ifelse(
      z > sort(z, decreasing = TRUE)[21] |
        abs(pm) > sort(abs(pm), decreasing = TRUE)[21], SYMBOL, ""))

  plt <- ggplot(tib, aes(x = pm, y = z, color = exprmean, label = SYMBOL)) +
    geom_point() +
    scale_color_gradient2(low = "deepskyblue", mid = "gold", high = "orangered",
                          na.value = "gainsboro",
                          midpoint = mean(range(tib$exprmean))) +
    scale_y_sqrt() +
    geom_text_repel(color = "darkgray",size = 2.25, fontface = "italic",
                    segment.color = "darkgray", segment.size = 0.25,
                    min.segment.length = 0, na.rm = TRUE) +
    theme_minimal() +
    labs(
      x = "Factor Loading (posterior mean)",
      y = "|z-score|",
      color = "Mean Expression (log10)"
    ) +
    theme(legend.position = "bottom")

  return(plt)
}
Factor 2: zygote to 4-cell
Overlaps with the blue cluster in Dey et al.:
do.volcano.plot(fl25, 2)
#> Warning: ggrepel: 22 unlabeled data points (too many overlaps). Consider
#> increasing max.overlaps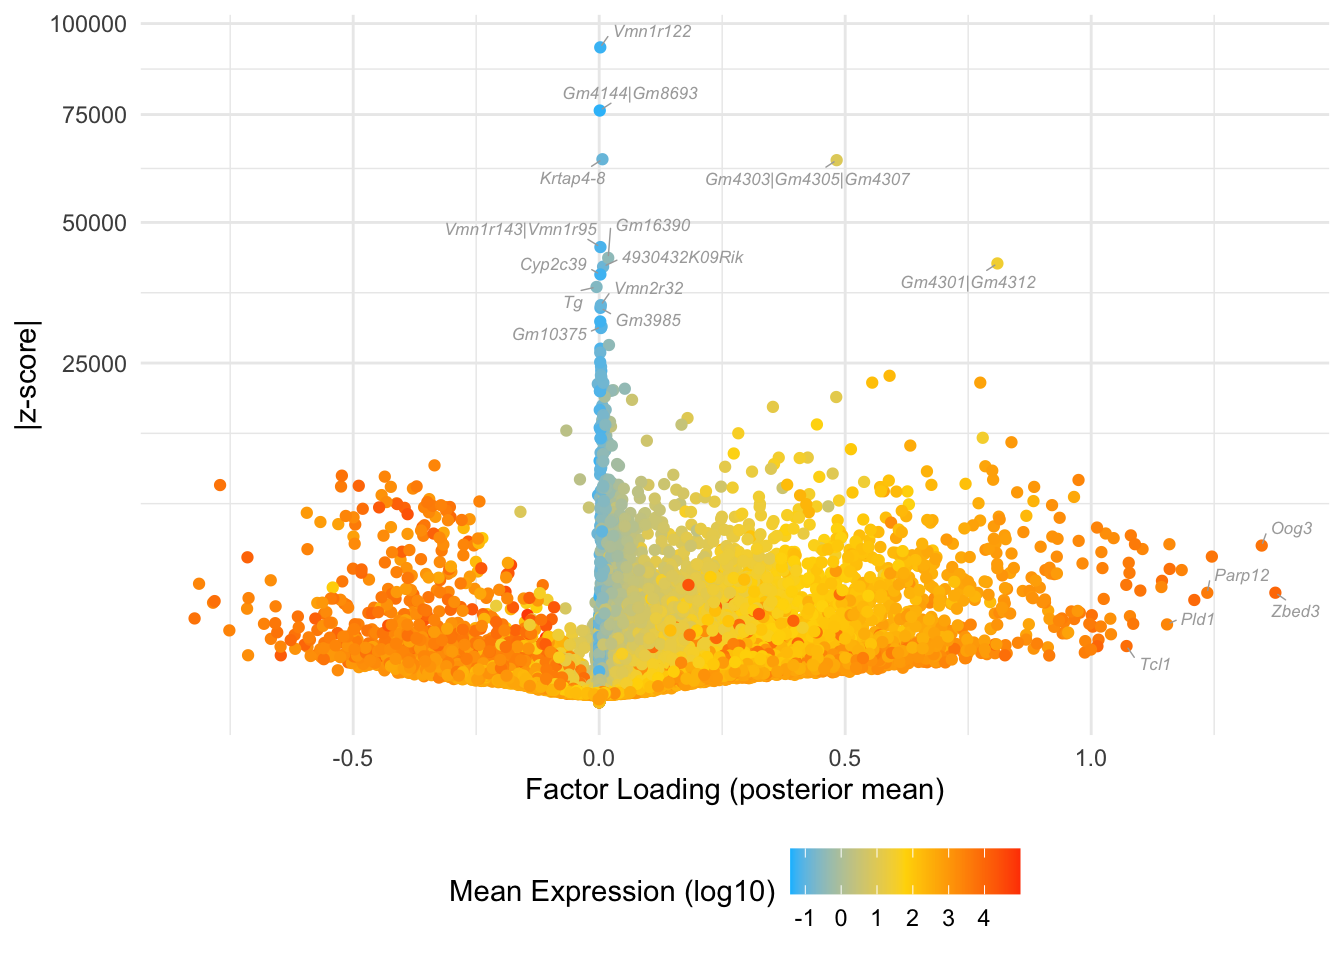
Factor 3: mid 2-cell to 16-cell
Some overlap with the yellow cluster in Dey et al.:
do.volcano.plot(fl25, 3)
#> Warning: ggrepel: 9 unlabeled data points (too many overlaps). Consider
#> increasing max.overlaps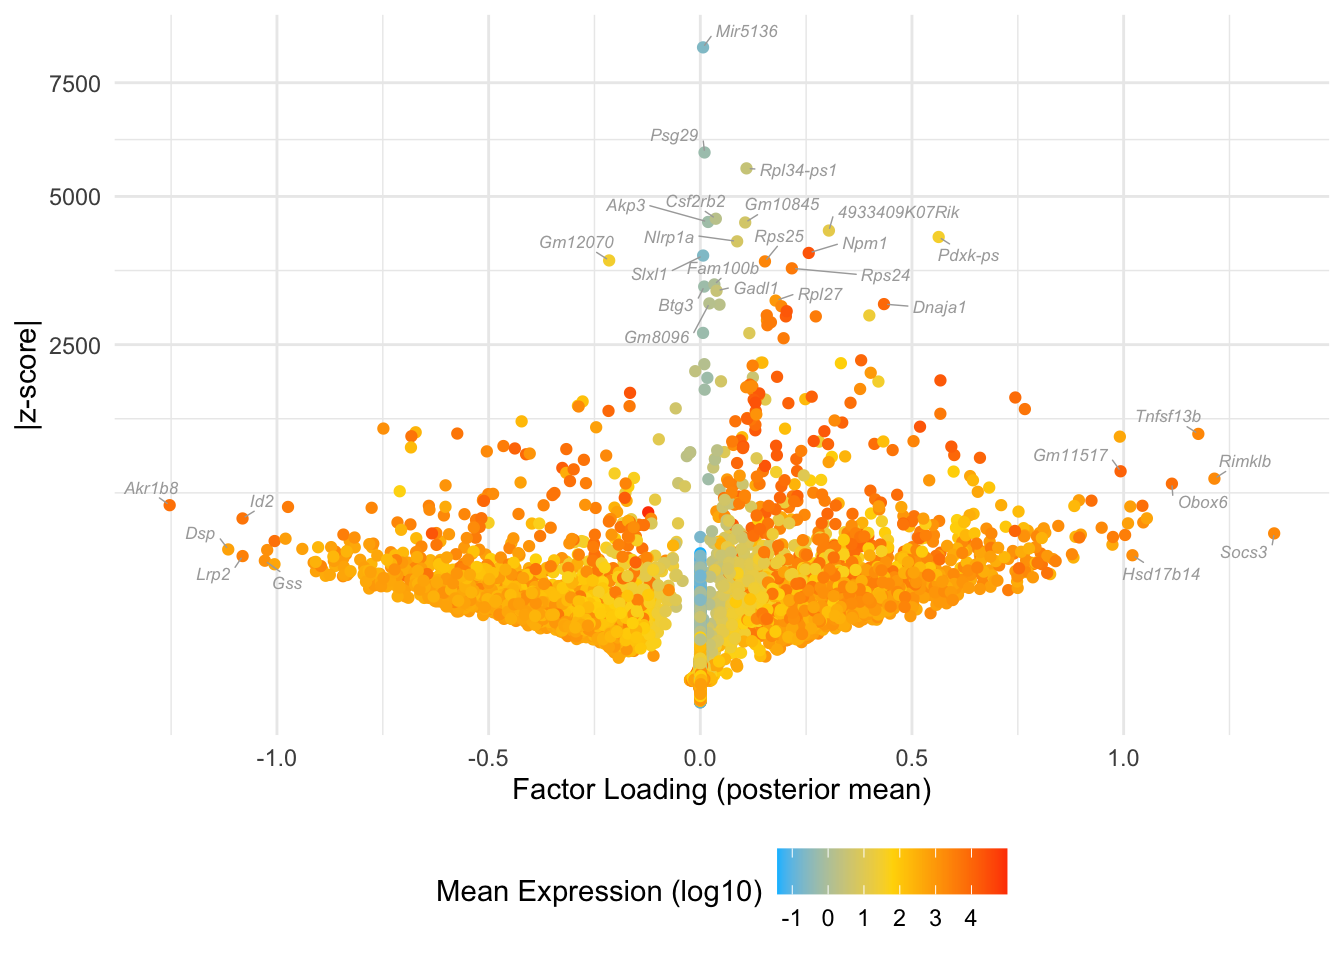
Factor 4: early to late blastocyte
Overlaps with the orange cluster in Dey et al.:
do.volcano.plot(fl25, 4)
#> Warning: ggrepel: 8 unlabeled data points (too many overlaps). Consider
#> increasing max.overlaps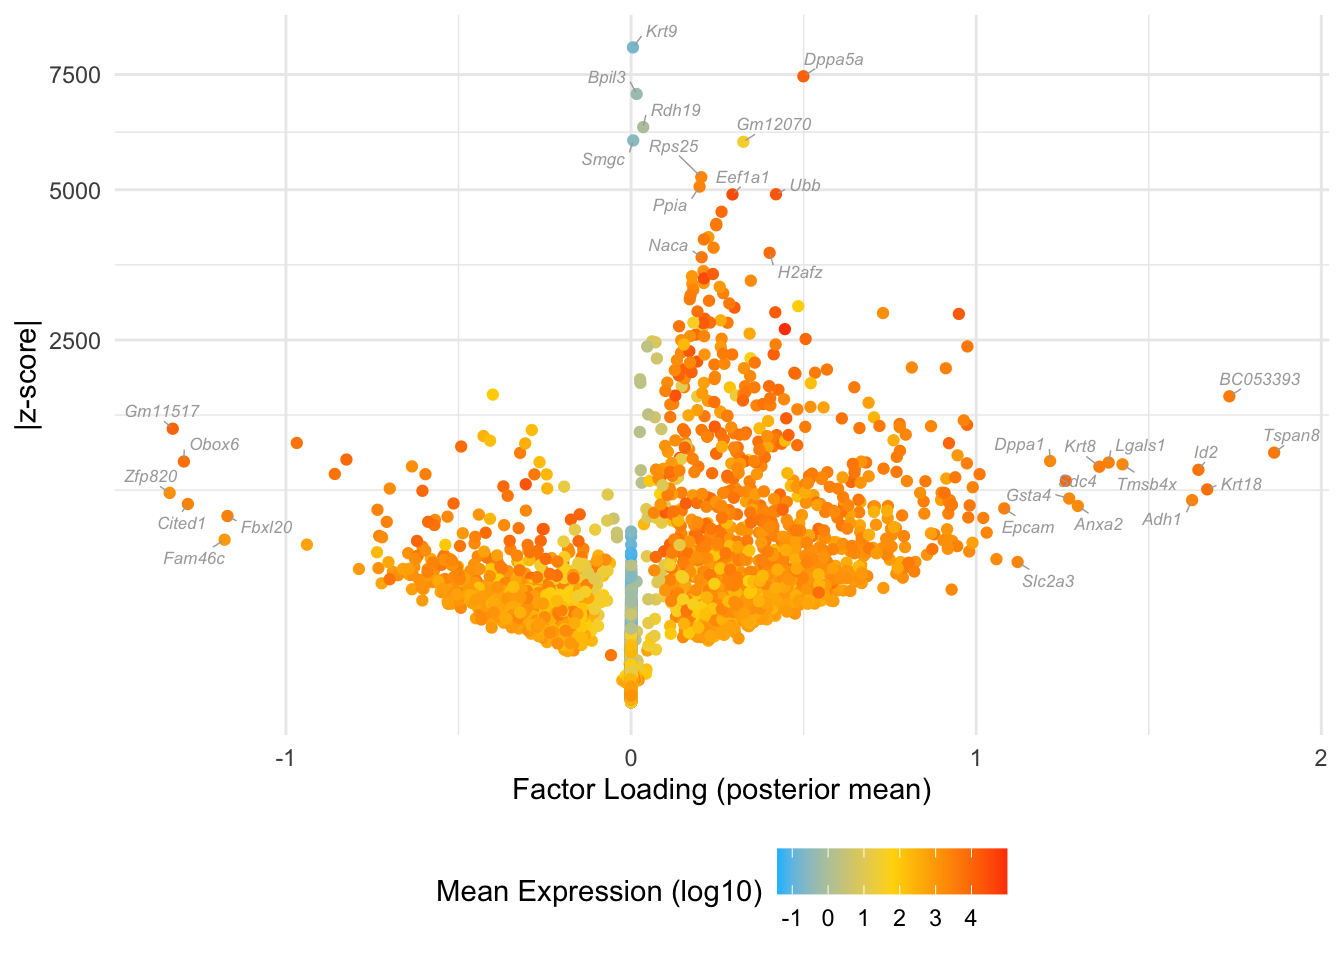
Factor 10: zygote to early 2-cell
do.volcano.plot(fl25, 10)
#> Warning: ggrepel: 6 unlabeled data points (too many overlaps). Consider
#> increasing max.overlaps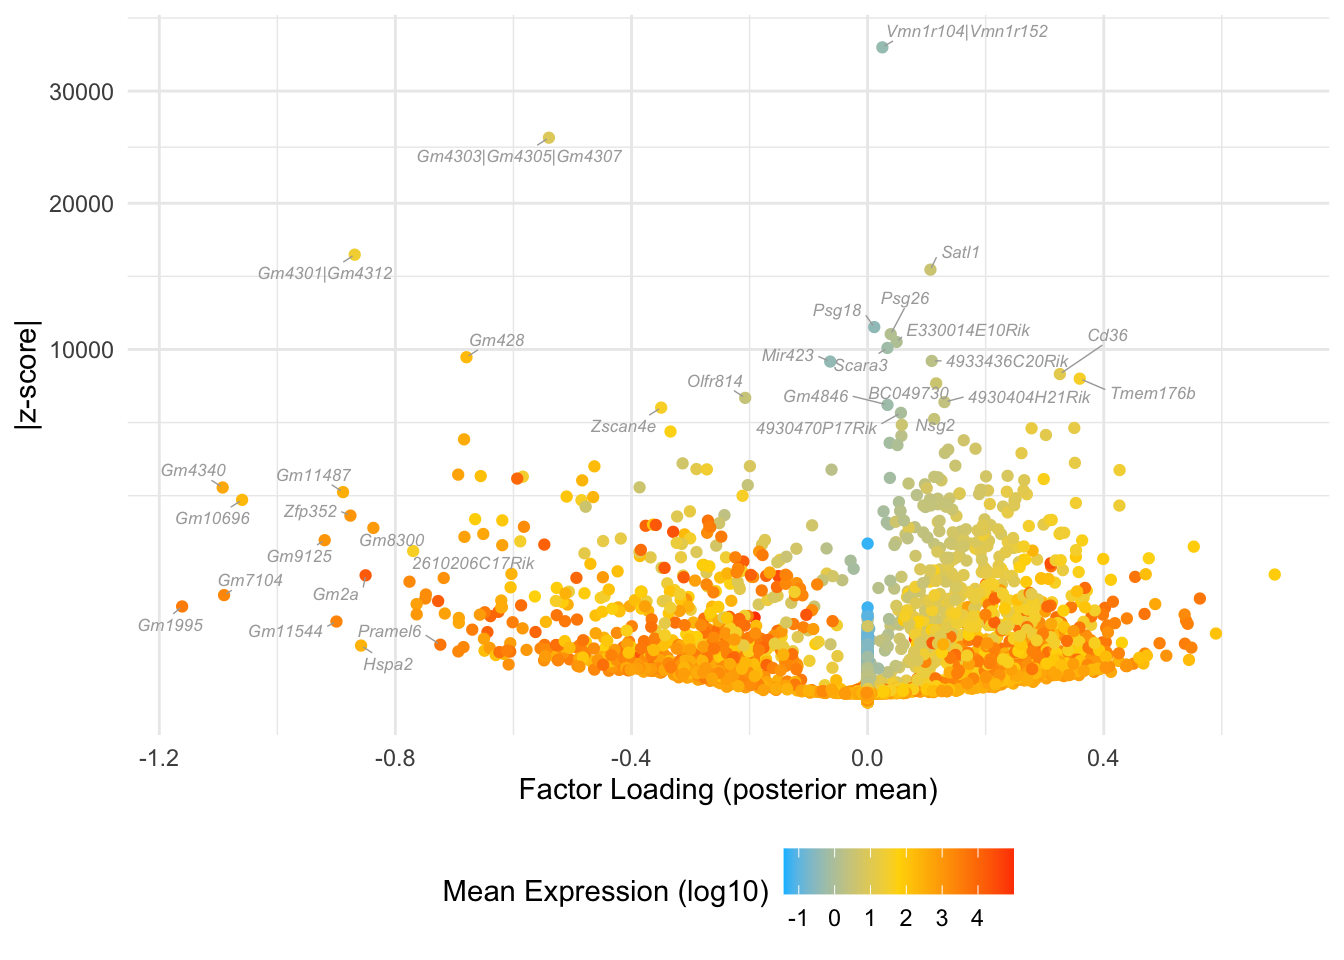
Factor 8: mid to late 2-cell
Overlaps with the magenta cluster in Dey et al.:
do.volcano.plot(fl25, 8)
#> Warning: ggrepel: 16 unlabeled data points (too many overlaps). Consider
#> increasing max.overlaps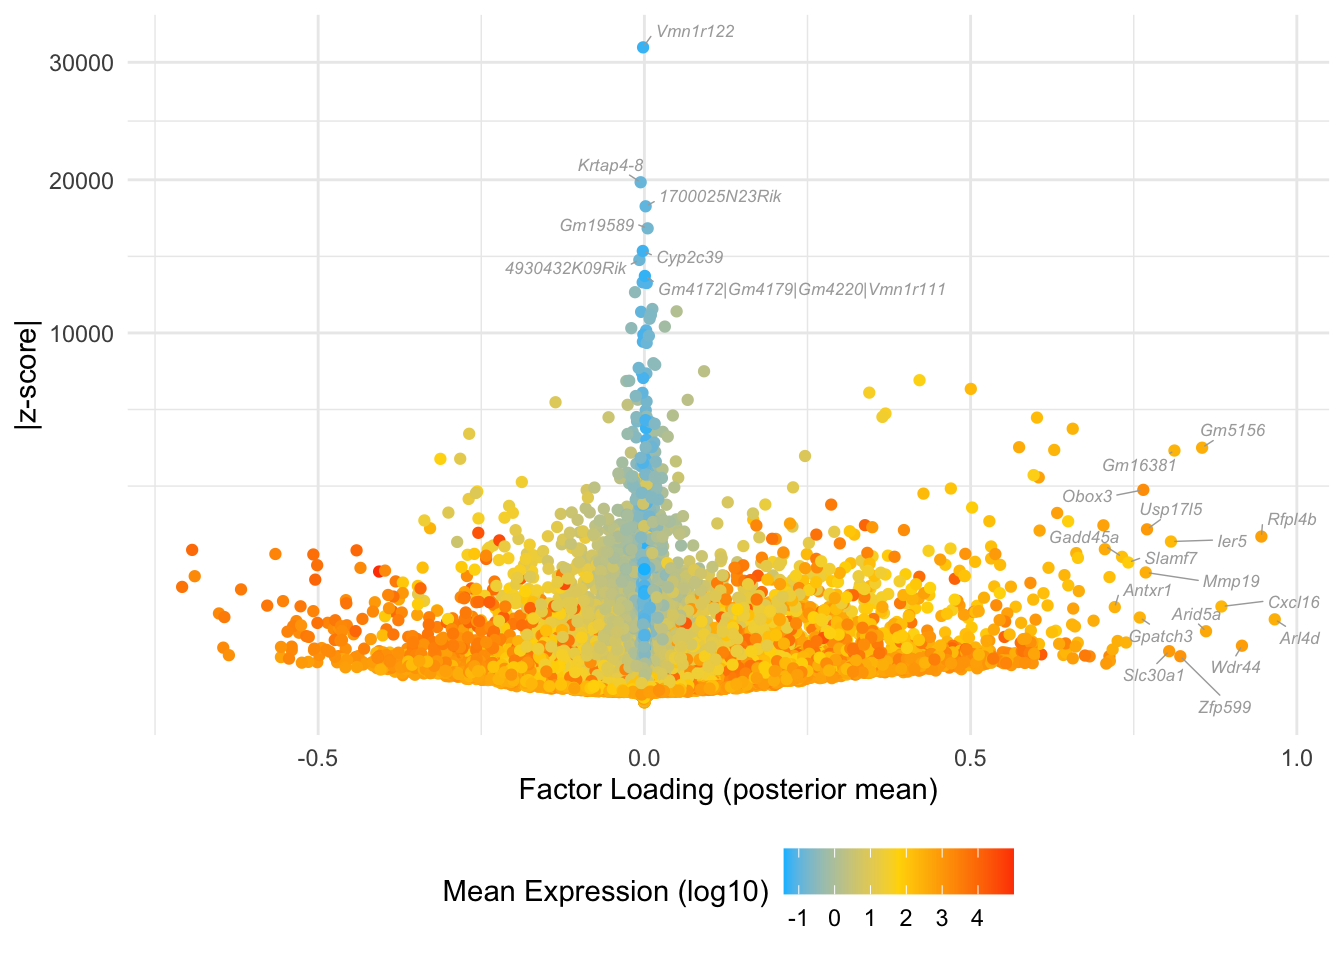
Factor 9: late 2-cell to 4-cell
do.volcano.plot(fl25, 9)
#> Warning: ggrepel: 10 unlabeled data points (too many overlaps). Consider
#> increasing max.overlaps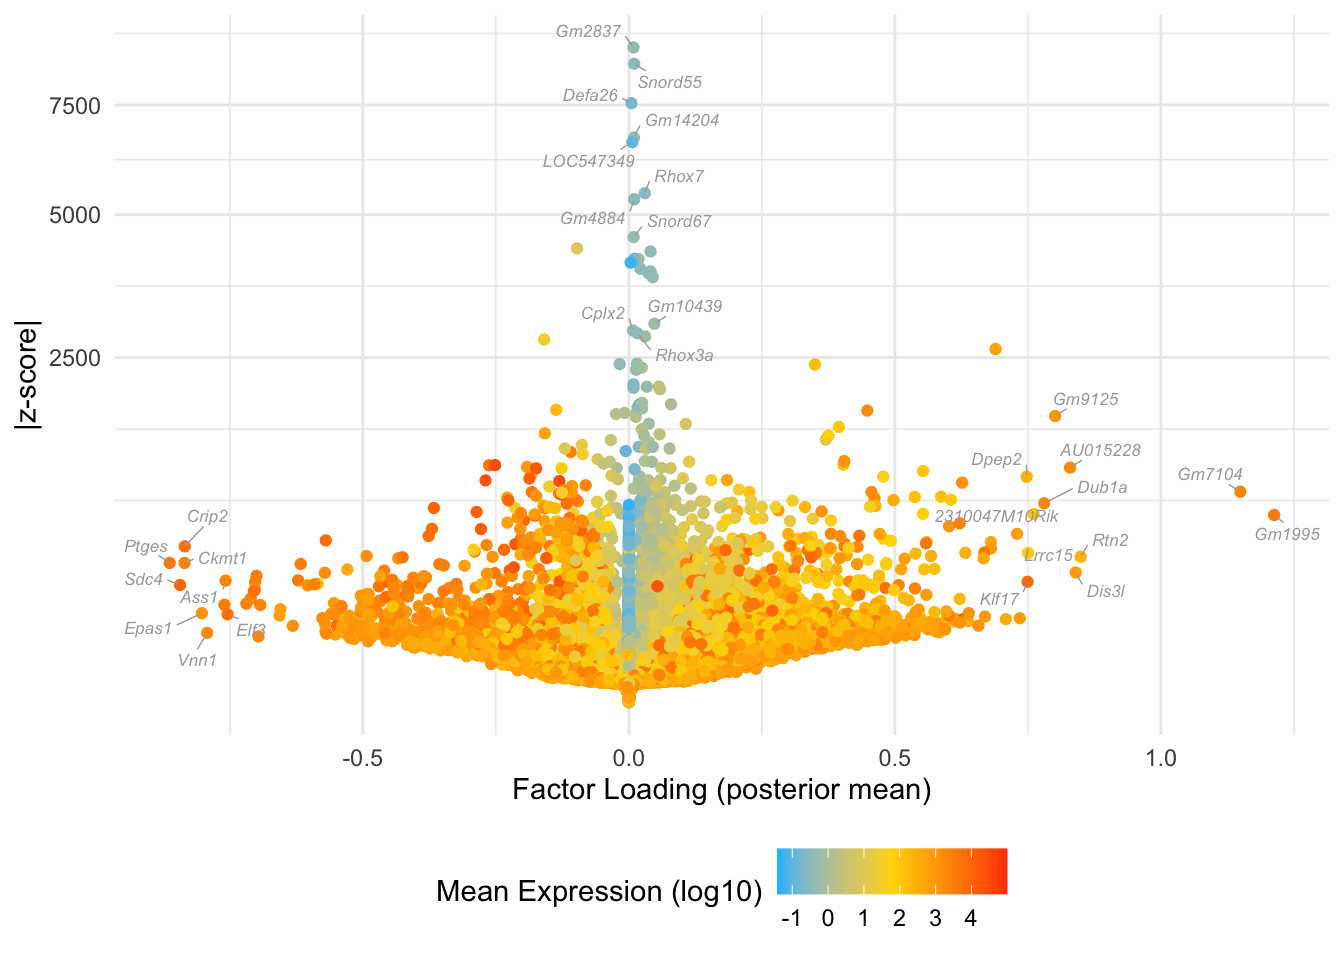
Factor 6: 16-cell to late blastocyte
Overlaps with the green cluster in Dey et al., but also the orange to some extent:
do.volcano.plot(fl25, 6)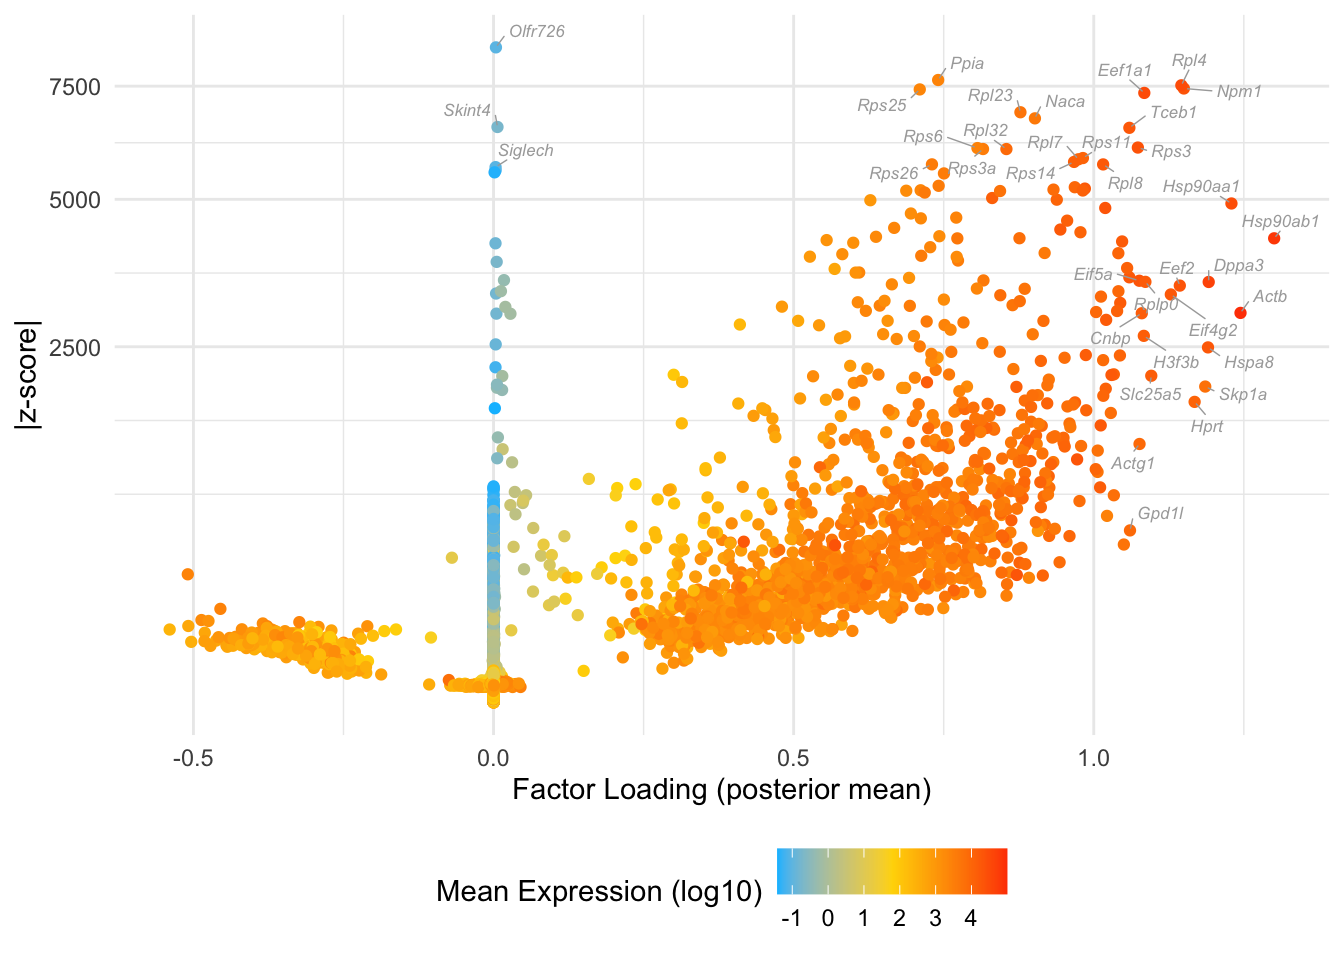
Factor 5: early to late blastocyte
Overlaps with the purple cluster in Dey et al.:
do.volcano.plot(fl25, 5)
#> Warning: ggrepel: 6 unlabeled data points (too many overlaps). Consider
#> increasing max.overlaps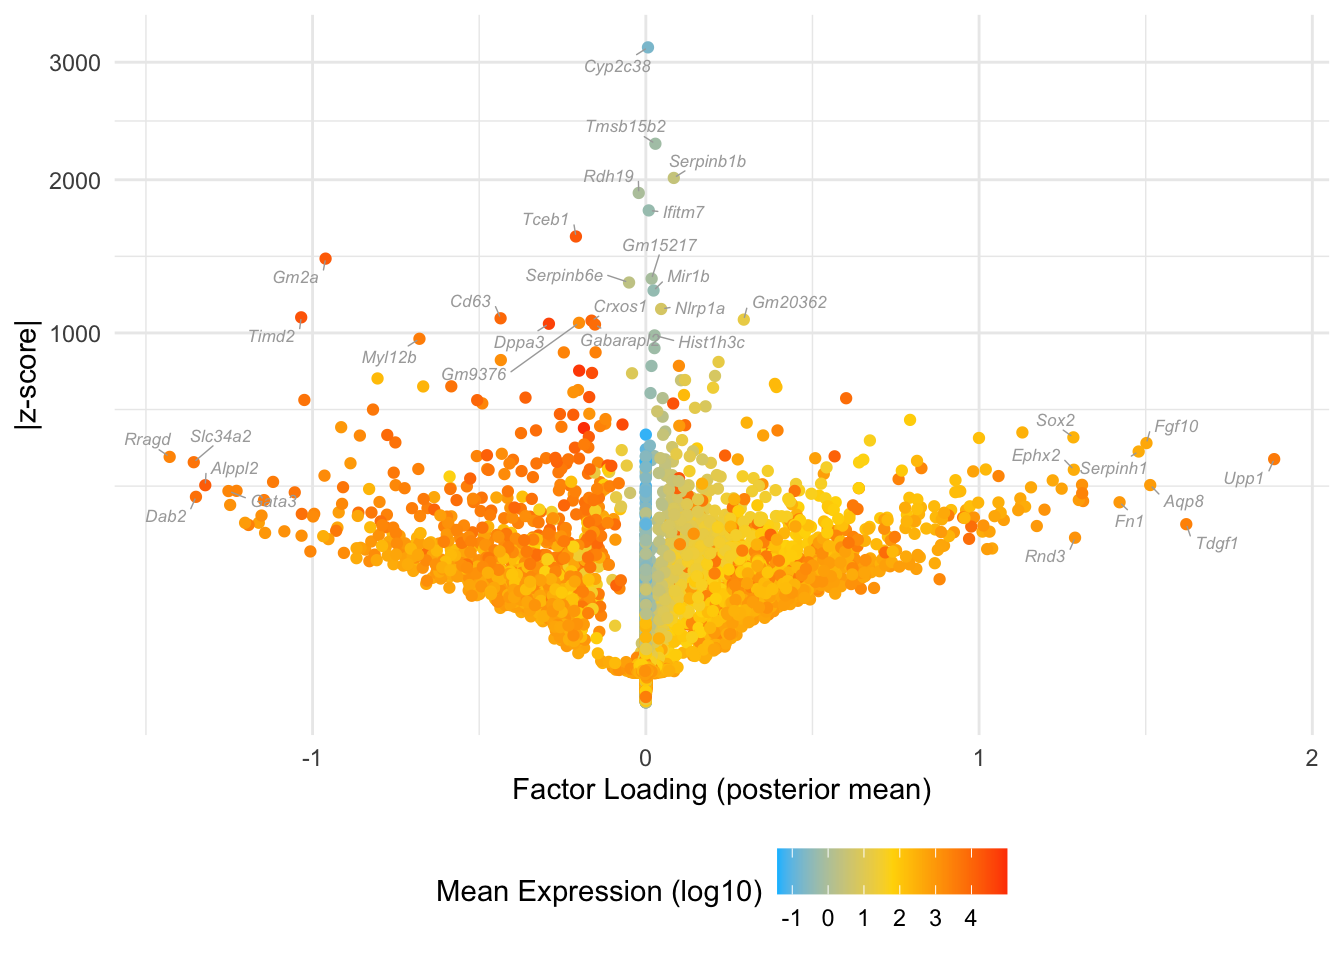
Factor 7: late blastocyte
do.volcano.plot(fl25, 7)
#> Warning: ggrepel: 4 unlabeled data points (too many overlaps). Consider
#> increasing max.overlaps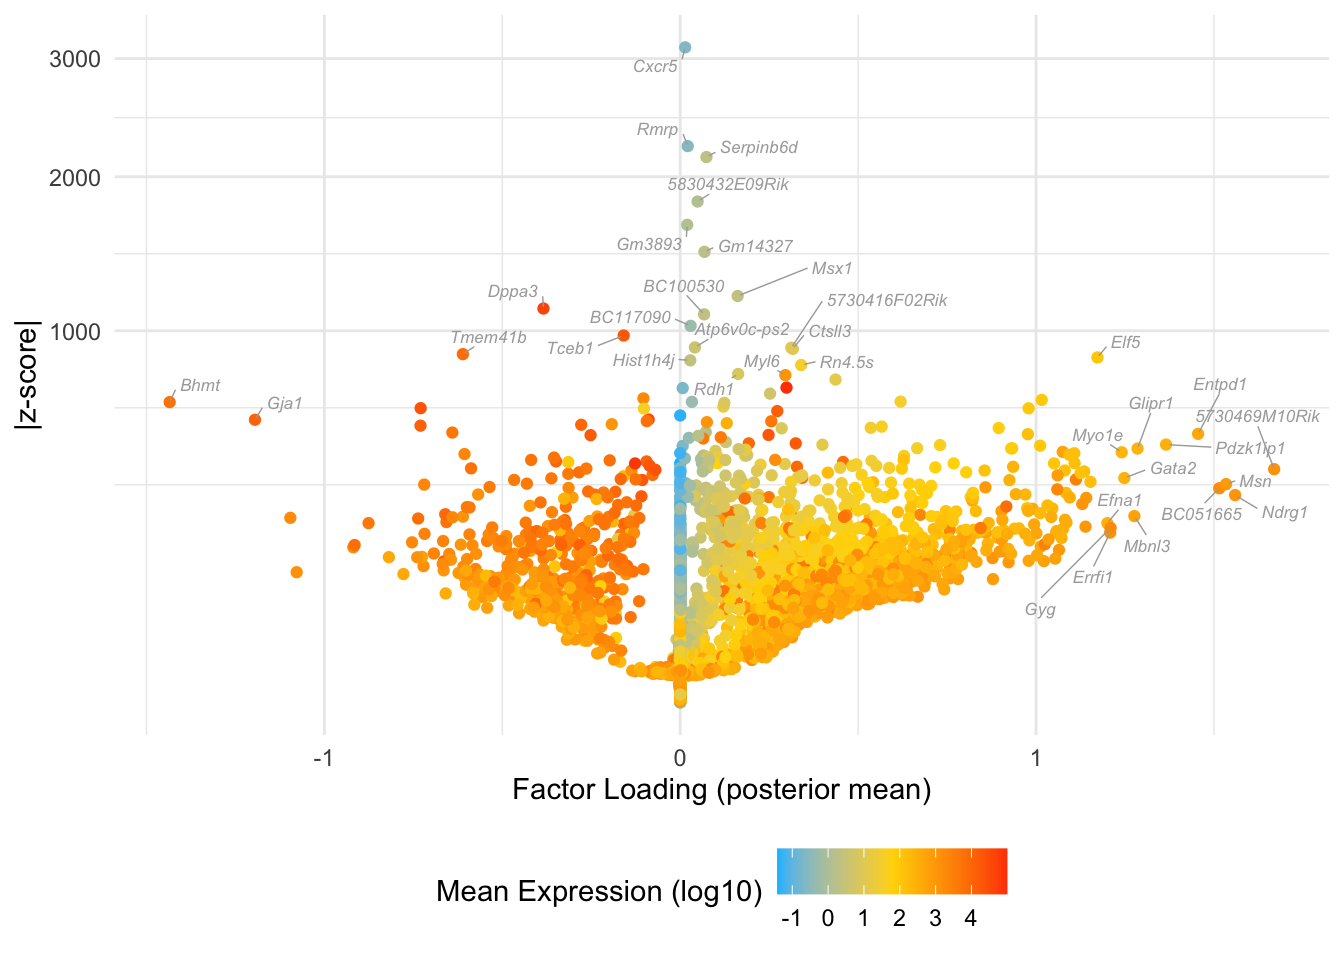
Factor 16: early blastocyte
do.volcano.plot(fl25, 16)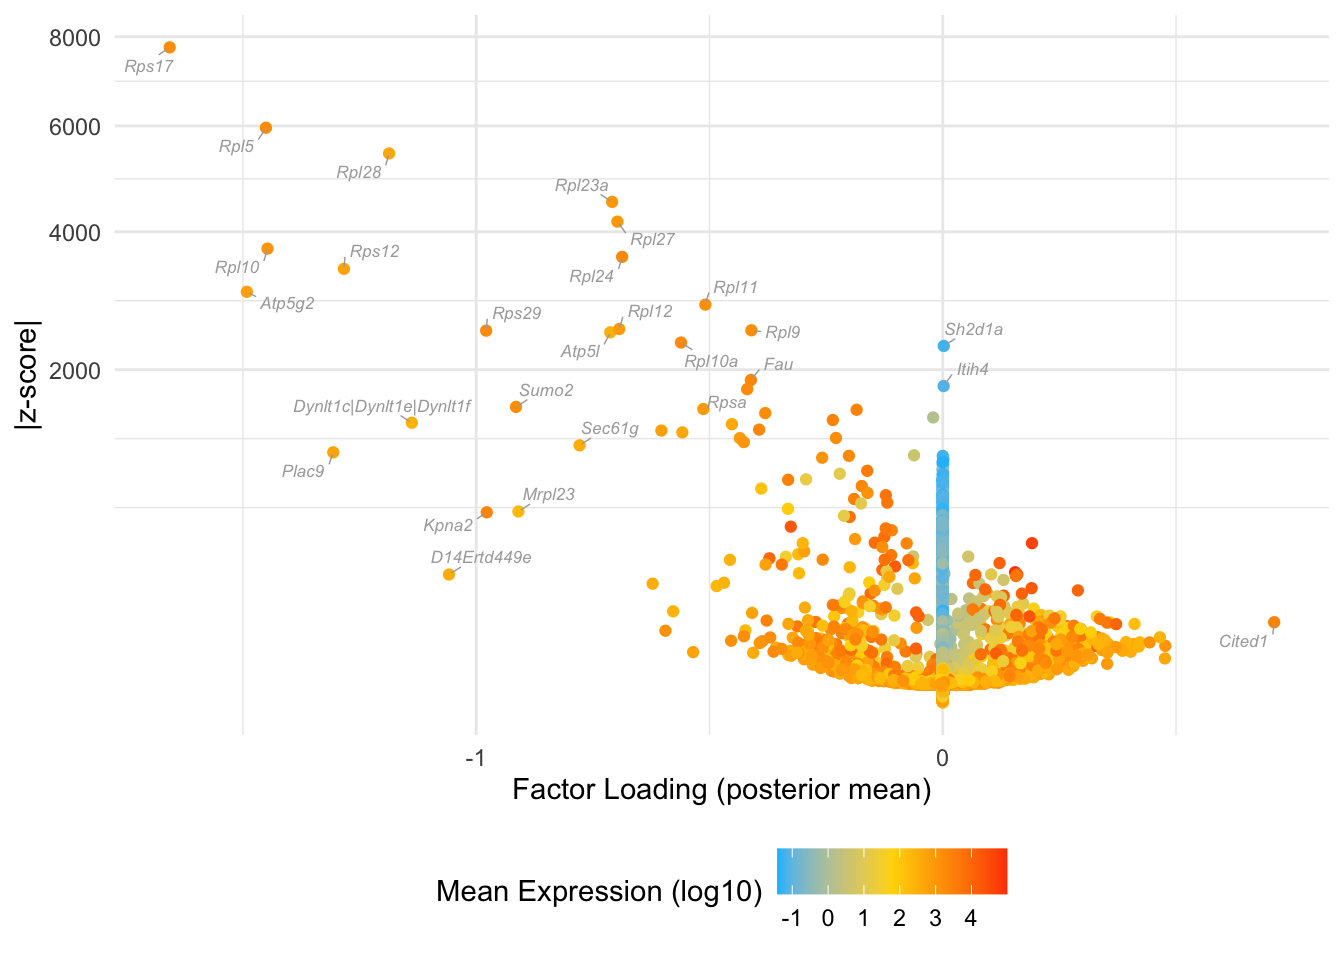
Factor 11: mid blastocyte
do.volcano.plot(fl25, 11)
#> Warning: ggrepel: 28 unlabeled data points (too many overlaps). Consider
#> increasing max.overlaps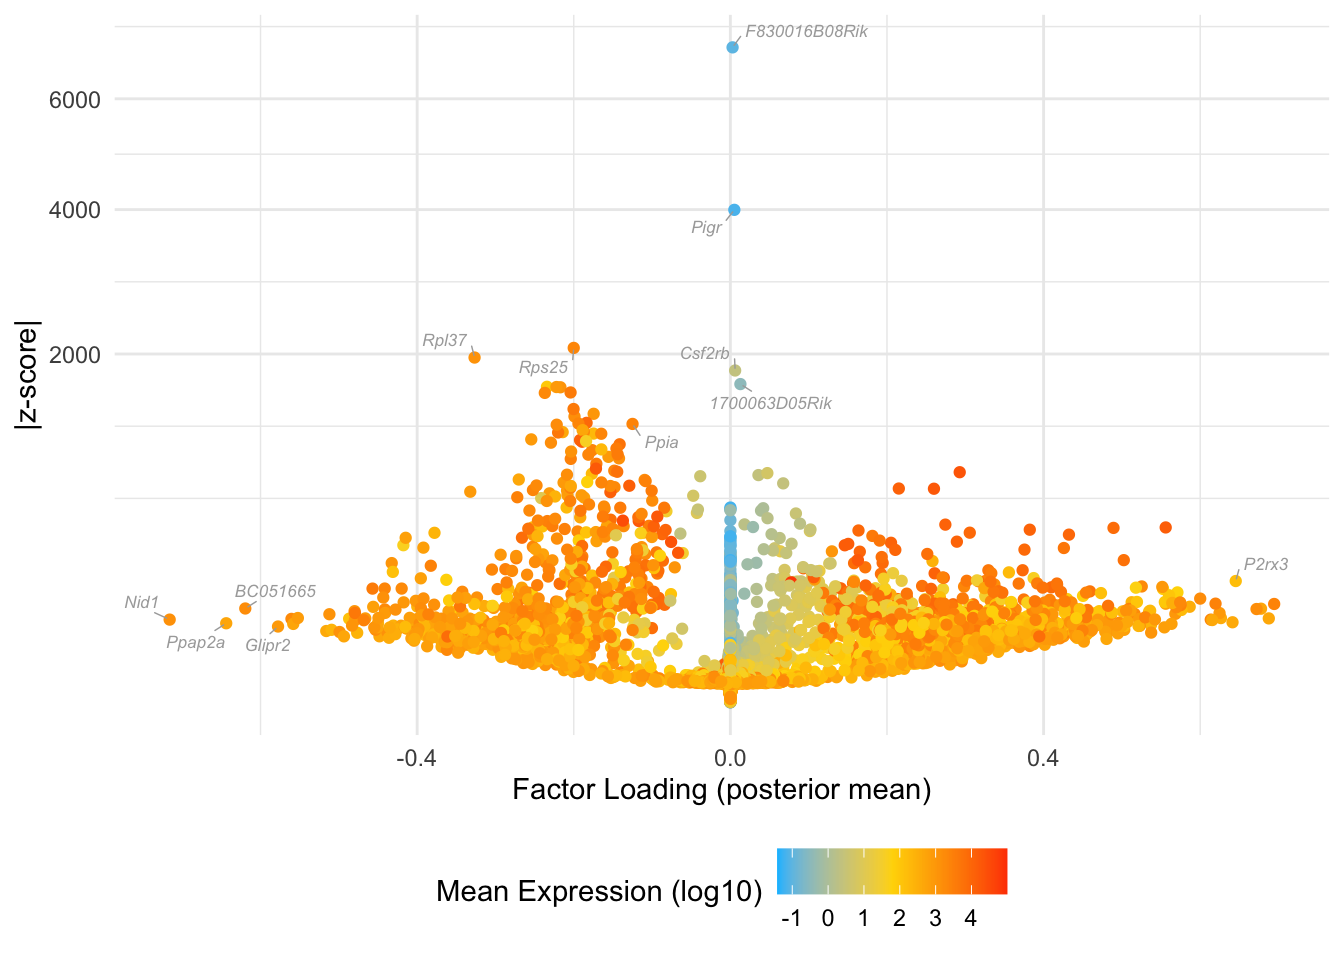
sessionInfo()
#> R version 3.5.3 (2019-03-11)
#> Platform: x86_64-apple-darwin15.6.0 (64-bit)
#> Running under: macOS Mojave 10.14.6
#>
#> Matrix products: default
#> BLAS: /Library/Frameworks/R.framework/Versions/3.5/Resources/lib/libRblas.0.dylib
#> LAPACK: /Library/Frameworks/R.framework/Versions/3.5/Resources/lib/libRlapack.dylib
#>
#> locale:
#> [1] en_US.UTF-8/en_US.UTF-8/en_US.UTF-8/C/en_US.UTF-8/en_US.UTF-8
#>
#> attached base packages:
#> [1] parallel  stats     graphics  grDevices utils     datasets  methods
#> [8] base
#>
#> other attached packages:
#>  [1] fastTopics_0.6-100                   Rtsne_0.15
#>  [3] singleCellRNASeqMouseDeng2014_0.99.0 Biobase_2.42.0
#>  [5] BiocGenerics_0.28.0                  ggrepel_0.9.1
#>  [7] flashier_0.2.27                      magrittr_2.0.2
#>  [9] forcats_0.5.1                        stringr_1.4.0
#> [11] dplyr_1.0.8                          purrr_0.3.4
#> [13] readr_2.0.0                          tidyr_1.2.0
#> [15] tibble_3.1.6                         ggplot2_3.3.5
#> [17] tidyverse_1.3.1                      workflowr_1.6.2
#>
#> loaded via a namespace (and not attached):
#>  [1] colorspace_2.0-3   ellipsis_0.3.2     rprojroot_2.0.2    fs_1.5.0
#>  [5] rstudioapi_0.13    farver_2.1.0       MatrixModels_0.4-1 fansi_1.0.2
#>  [9] lubridate_1.7.10   xml2_1.3.2         splines_3.5.3      knitr_1.33
#> [13] jsonlite_1.8.0     mcmc_0.9-7         broom_0.7.6        ashr_2.2-54
#> [17] dbplyr_2.1.1       uwot_0.1.11        compiler_3.5.3     httr_1.4.2
#> [21] backports_1.1.3    assertthat_0.2.1   Matrix_1.3-4       fastmap_1.1.0
#> [25] lazyeval_0.2.2     cli_3.2.0          later_1.3.0        htmltools_0.5.2
#> [29] quantreg_5.51      prettyunits_1.1.1  tools_3.5.3        coda_0.19-3
#> [33] gtable_0.3.0       glue_1.6.2         Rcpp_1.0.8         softImpute_1.4-1
#> [37] cellranger_1.1.0   jquerylib_0.1.4    vctrs_0.3.8        xfun_0.29
#> [41] trust_0.1-8        rvest_1.0.0        lifecycle_1.0.1    irlba_2.3.3
#> [45] MASS_7.3-51.1      scales_1.1.1       hms_1.1.1          promises_1.2.0.1
#> [49] SparseM_1.77       RColorBrewer_1.1-2 yaml_2.3.5         pbapply_1.5-0
#> [53] sass_0.4.0         stringi_1.4.6      SQUAREM_2021.1     highr_0.9
#> [57] deconvolveR_1.2-1  truncnorm_1.0-8    horseshoe_0.2.0    rlang_1.0.2
#> [61] pkgconfig_2.0.3    ebnm_1.0-8         evaluate_0.14      lattice_0.20-38
#> [65] invgamma_1.1       labeling_0.4.2     htmlwidgets_1.5.4  cowplot_1.1.1
#> [69] tidyselect_1.1.2   R6_2.5.1           generics_0.1.2     DBI_1.0.0
#> [73] pillar_1.7.0       haven_2.3.1        whisker_0.3-2      withr_2.5.0
#> [77] mixsqp_0.3-43      modelr_0.1.8       crayon_1.5.0       utf8_1.2.2
#> [81] plotly_4.10.0      tzdb_0.1.1         rmarkdown_2.11     progress_1.2.2
#> [85] grid_3.5.3         readxl_1.3.1       data.table_1.14.2  git2r_0.28.0
#> [89] reprex_2.0.0       digest_0.6.29      httpuv_1.5.2       MCMCpack_1.4-4
#> [93] RcppParallel_5.1.5 munsell_0.5.0      viridisLite_0.4.0  bslib_0.3.1
#> [97] quadprog_1.5-8