Meta-database: environmental and societal drivers of change in Arctic fjord ecosystems
Robert Schlegel
11 March 2021
Last updated: 2021-03-11
Checks: 6 1
Knit directory: FACE-IT/
This reproducible R Markdown analysis was created with workflowr (version 1.6.2). The Checks tab describes the reproducibility checks that were applied when the results were created. The Past versions tab lists the development history.
The R Markdown file has unstaged changes. To know which version of the R Markdown file created these results, you’ll want to first commit it to the Git repo. If you’re still working on the analysis, you can ignore this warning. When you’re finished, you can run wflow_publish to commit the R Markdown file and build the HTML.
Great job! The global environment was empty. Objects defined in the global environment can affect the analysis in your R Markdown file in unknown ways. For reproduciblity it’s best to always run the code in an empty environment.
The command set.seed(20210216) was run prior to running the code in the R Markdown file. Setting a seed ensures that any results that rely on randomness, e.g. subsampling or permutations, are reproducible.
Great job! Recording the operating system, R version, and package versions is critical for reproducibility.
Nice! There were no cached chunks for this analysis, so you can be confident that you successfully produced the results during this run.
Great job! Using relative paths to the files within your workflowr project makes it easier to run your code on other machines.
Great! You are using Git for version control. Tracking code development and connecting the code version to the results is critical for reproducibility.
The results in this page were generated with repository version 17454eb. See the Past versions tab to see a history of the changes made to the R Markdown and HTML files.
Note that you need to be careful to ensure that all relevant files for the analysis have been committed to Git prior to generating the results (you can use wflow_publish or wflow_git_commit). workflowr only checks the R Markdown file, but you know if there are other scripts or data files that it depends on. Below is the status of the Git repository when the results were generated:
Ignored files:
    Ignored:    .Rhistory
    Ignored:    .Rproj.user/

Unstaged changes:
    Modified:   analysis/FACE-IT.bib
    Modified:   analysis/index.Rmd
    Modified:   analysis/metadatabase.Rmd
Note that any generated files, e.g. HTML, png, CSS, etc., are not included in this status report because it is ok for generated content to have uncommitted changes.
These are the previous versions of the repository in which changes were made to the R Markdown (analysis/metadatabase.Rmd) and HTML (docs/metadatabase.html) files. If you’ve configured a remote Git repository (see ?wflow_git_remote), click on the hyperlinks in the table below to view the files as they were in that past version.
| File | Version | Author | Date | Message |
|---|---|---|---|---|
| Rmd | 17454eb | robwschlegel | 2021-03-08 | Added a couple of entries for Isfjorden |
| html | 17454eb | robwschlegel | 2021-03-08 | Added a couple of entries for Isfjorden |
| html | f8fbec0 | robwschlegel | 2021-03-08 | Build site. |
| Rmd | d4b695c | robwschlegel | 2021-03-08 | Re-built site. |
| Rmd | dc5dbf5 | robwschlegel | 2021-03-04 | Formatted all of the tables |
| html | dc5dbf5 | robwschlegel | 2021-03-04 | Formatted all of the tables |
| Rmd | 4a20757 | robwschlegel | 2021-03-04 | Added FACE-IT logo to top of each page |
| html | 4a20757 | robwschlegel | 2021-03-04 | Added FACE-IT logo to top of each page |
| Rmd | ddbd10d | robwschlegel | 2021-03-04 | Experimenting with popup rendering |
| html | ddbd10d | robwschlegel | 2021-03-04 | Experimenting with popup rendering |
| Rmd | c2e7863 | robwschlegel | 2021-03-04 | More HTML testing |
| html | c2e7863 | robwschlegel | 2021-03-04 | More HTML testing |
| Rmd | 49ebabd | robwschlegel | 2021-03-04 | Testing pop-ups and hyperlinks |
| html | 49ebabd | robwschlegel | 2021-03-04 | Testing pop-ups and hyperlinks |
| Rmd | c44e66f | robwschlegel | 2021-03-03 | Added a bit of text |
| html | c44e66f | robwschlegel | 2021-03-03 | Added a bit of text |
| html | 75d8f9b | robwschlegel | 2021-03-02 | Build site. |
| Rmd | f1c0ac2 | robwschlegel | 2021-03-02 | More spacing |
| html | f1c0ac2 | robwschlegel | 2021-03-02 | More spacing |
| html | 1765abd | robwschlegel | 2021-03-02 | Build site. |
| Rmd | 782169d | robwschlegel | 2021-03-02 | More playing around with widths and margins |
| html | 782169d | robwschlegel | 2021-03-02 | More playing around with widths and margins |
| html | 86624e0 | robwschlegel | 2021-03-02 | Build site. |
| Rmd | f853627 | robwschlegel | 2021-03-02 | Playing with page and table margins. |
| html | 8b80769 | robwschlegel | 2021-03-02 | Build site. |
| Rmd | 37be6e6 | robwschlegel | 2021-03-02 | Re-built site. |
| Rmd | a89dfa3 | robwschlegel | 2021-03-02 | Moving away from a single smart meta-data functions towards more user input |
| html | fbef3e0 | robwschlegel | 2021-03-01 | Build site. |
| Rmd | e020300 | robwschlegel | 2021-03-01 | Re-built site. |
| html | e8aab70 | robwschlegel | 2021-03-01 | Build site. |
| Rmd | f8ad72b | robwschlegel | 2021-03-01 | Re-built site. |
| Rmd | 665719d | robwschlegel | 2021-03-01 | Scraping convoluted date meta-data logic chain |
| Rmd | 21aed26 | robwschlegel | 2021-03-01 | Playing with meta-data function |
| html | 6c2110f | robwschlegel | 2021-03-01 | Build site. |
| Rmd | 5d4b15e | robwschlegel | 2021-03-01 | Re-built site. |
| html | 3a30630 | robwschlegel | 2021-03-01 | Build site. |
| Rmd | 9d46384 | robwschlegel | 2021-03-01 | Re-built site. |
| html | 3fd74f7 | robwschlegel | 2021-03-01 | Build site. |
| Rmd | 7d2db83 | robwschlegel | 2021-03-01 | Re-built site. |
| Rmd | 7ff8d63 | robwschlegel | 2021-03-01 | More work on metadatabase |
| html | 7ff8d63 | robwschlegel | 2021-03-01 | More work on metadatabase |
| html | 6b2f047 | robwschlegel | 2021-02-24 | Build site. |
| Rmd | 3e8114e | robwschlegel | 2021-02-24 | Re-built site. |
| Rmd | c38a8d3 | robwschlegel | 2021-02-19 | More minor changes |
| html | 9f9385e | robwschlegel | 2021-02-19 | Build site. |
| Rmd | 93d152e | robwschlegel | 2021-02-19 | Adjusting file pathways |
| html | 6208900 | robwschlegel | 2021-02-19 | Build site. |
| Rmd | b09fb3f | robwschlegel | 2021-02-19 | Re-built site. |
| html | 51741d5 | robwschlegel | 2021-02-19 | Build site. |
| Rmd | ca063d3 | robwschlegel | 2021-02-19 | Re-built site. |
| html | 849da96 | robwschlegel | 2021-02-19 | Build site. |
| Rmd | c5e635e | robwschlegel | 2021-02-19 | Re-built site. |
| html | ee3511e | robwschlegel | 2021-02-18 | Build site. |
| html | 04d996a | robwschlegel | 2021-02-18 | Build site. |
| html | c3a8a72 | robwschlegel | 2021-02-18 | Build site. |
| html | 3992686 | robwschlegel | 2021-02-18 | Build site. |
| Rmd | f9244d5 | Robert | 2021-02-17 | Re-built site. |
| Rmd | bd0919b | robwschlegel | 2021-02-16 | The metadatabase Rmd file |
Introduction
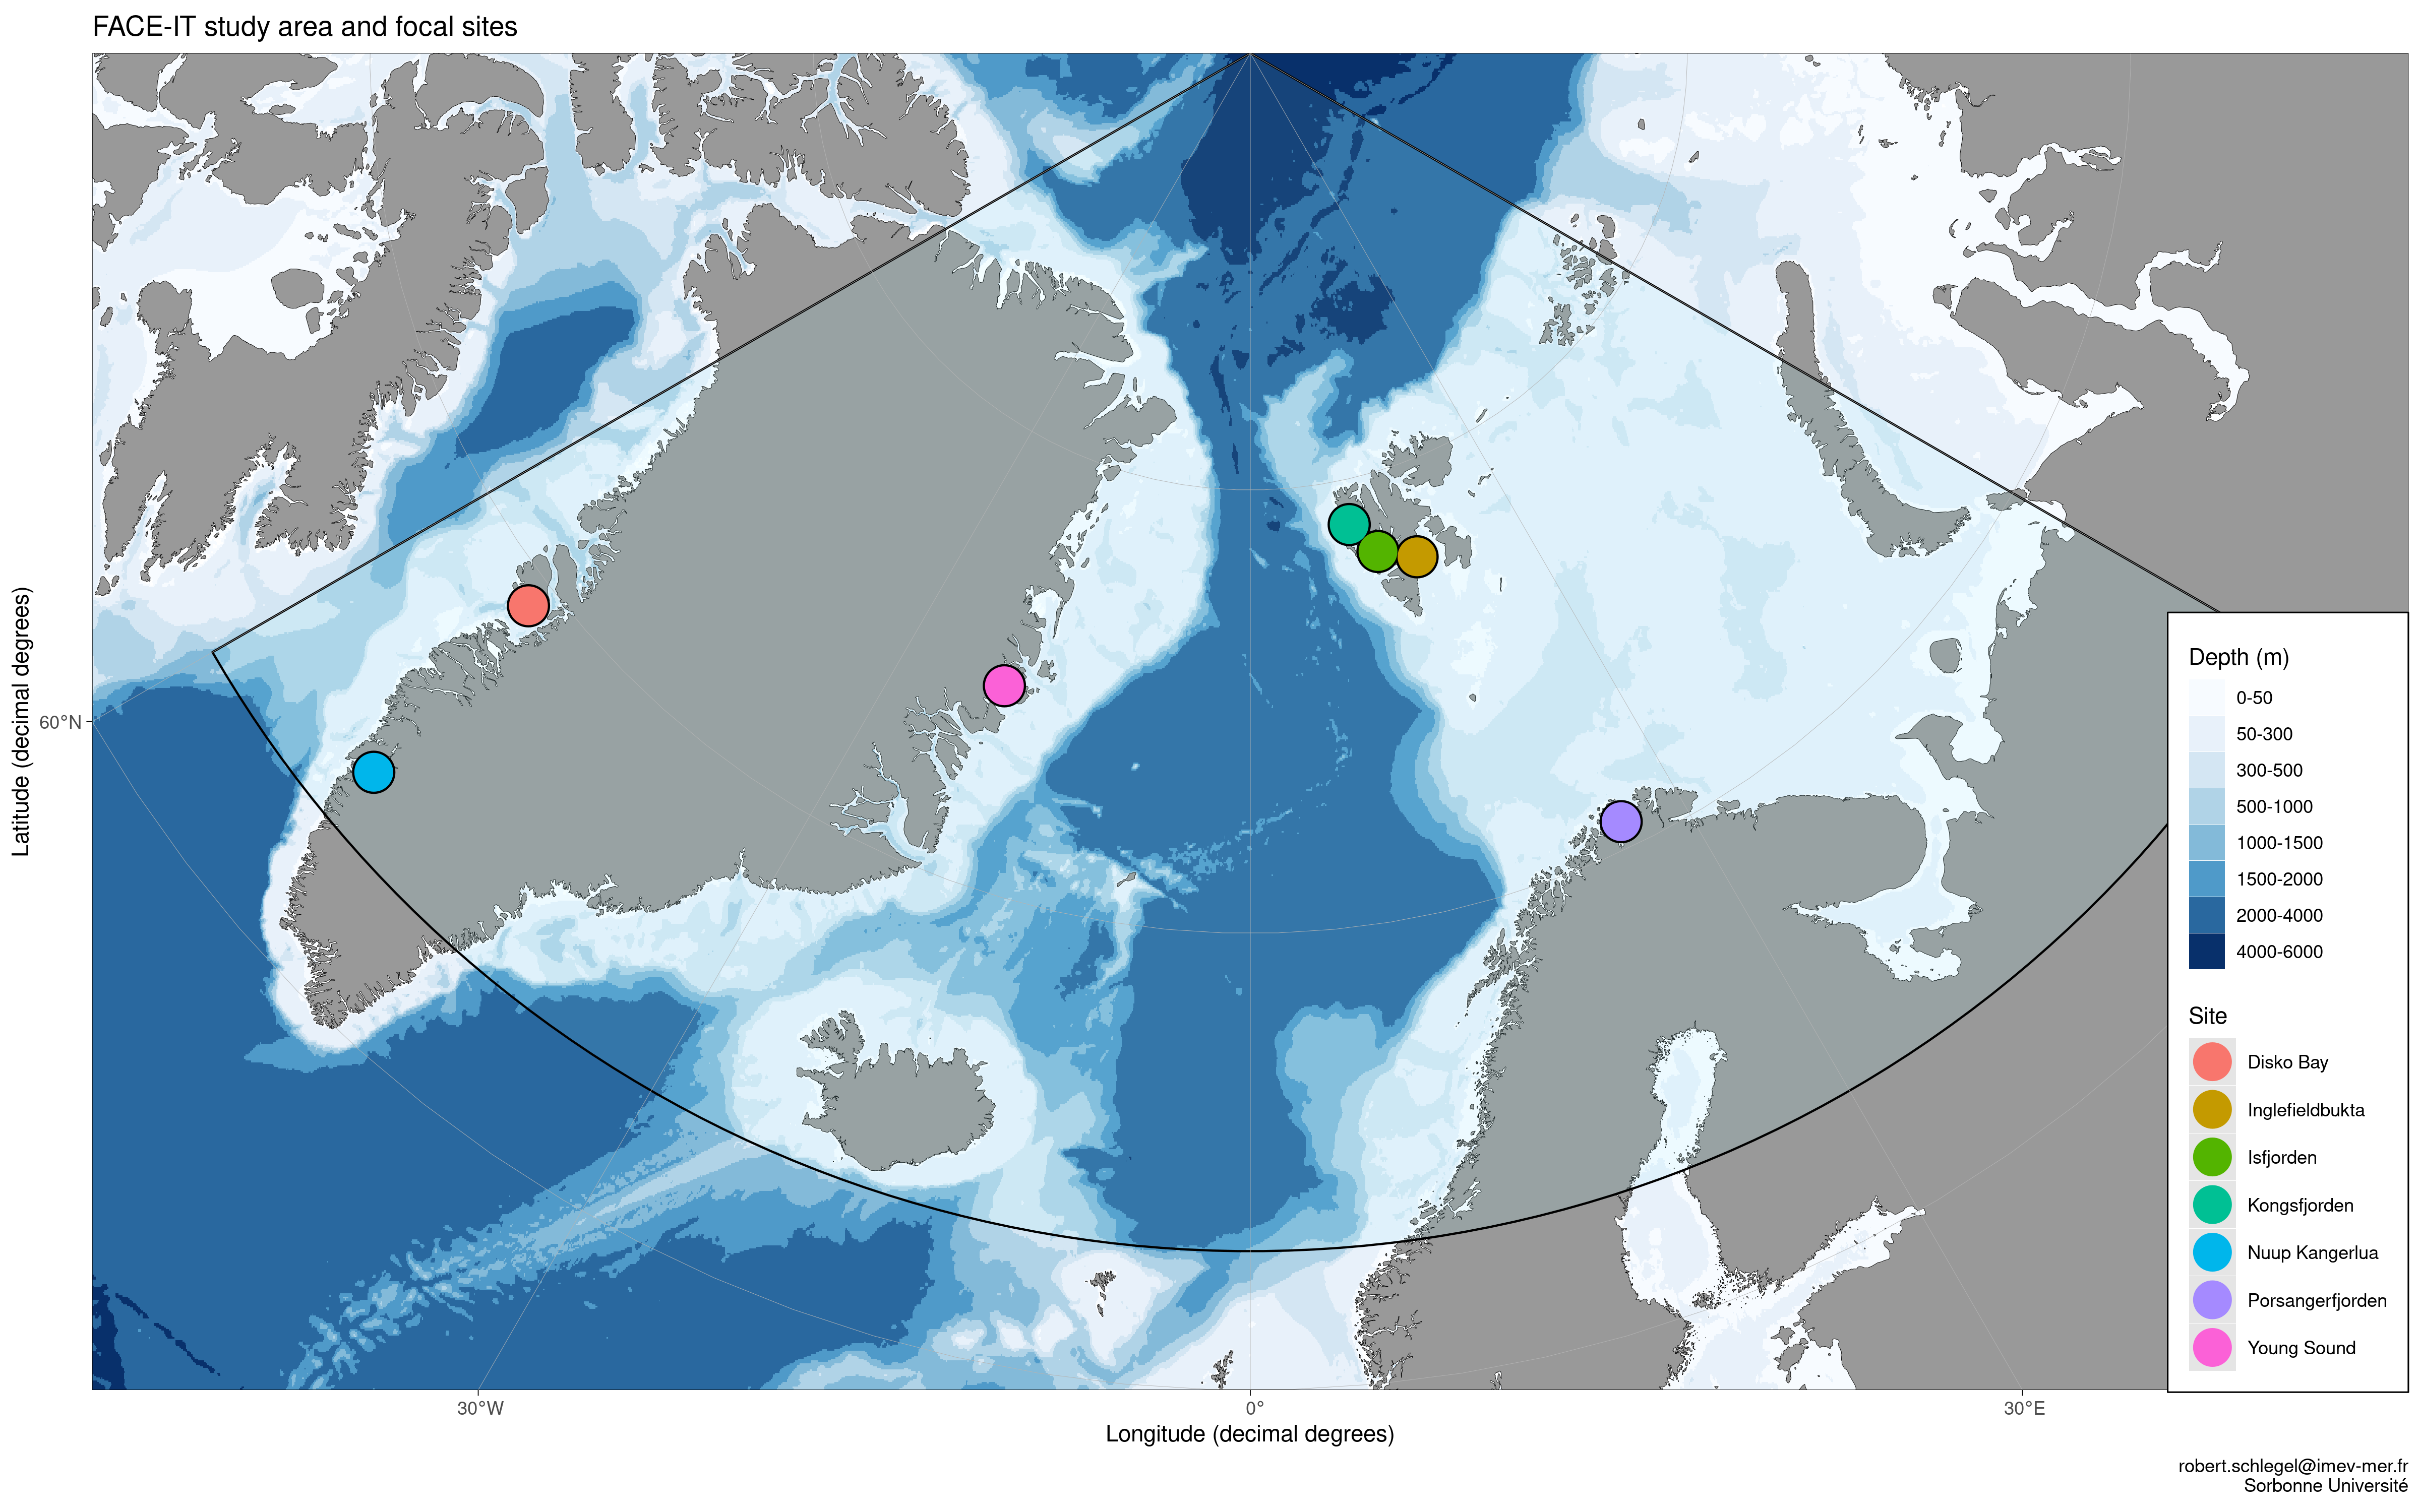
This document is designed to satisfy D1.1 and eventually D1.2 for the Horizon2020 project FACE-IT. The text and static tables in this document are a report on the key drivers of change in Arctic fjord biodiversity (D1.1). The interactive tables contain the meta-database for the data identified as key drivers of change (D1.2). The text and meta-data from this document will be used for the completion of a review article on past and future changes of key drivers in and around the FACE-IT study sites (D1.3). This document begins with a review of known drivers of change in the European Arctic before focussing in on each individual FACE-IT study site to discuss any differences from the broader Arctic. Each of the following sections for each region/study site contain tables that show a summary of their key drivers and meta-data. There is no central table for all of the drivers or meta-data.
European Arctic
The decline in the floating sea ice cover in the Arctic is one of the most striking manifestations of climate change.
(Stroeve and Notz, 2018)
Many physical processes are known to drive biodiversity in the Arctic. Unsurprisingly, the presence of sea ice is one of these controlling factors (Pavlova et al., 2019). The cryosphere, of which sea ice is a part, is one of the defining characteristics of the Arctic that sets it apart from neighbouring climatic regions (e.g. boreal and cold temperate). It is therefore safe to assume that changes to the Arctic cryosphere will lead to fundamental changes in the biodiversity found there. The cryosphere itself however is not the primary driver of change in the Arctic. This is because changes in the cryosphere are themselves being driven by the changes in temperature that are in turn driven by the primary driver of climatic change that defines the anthropocene: increases in CO2 emissions from human activities. It is this relatively rapid increase in temperature that is having a profound effect on the Arctic cryosphere (Meredith et al., 2019), and there is a robust linear relationship between increases in atmospheric CO2 and deceases in sea ice extent (Stroeve and Notz, 2018). Therefore, as with almost any study of biodiversity, high-quality spatiotemporally complete temperature data are crucial. The longer the complete time series the better.
There are however many more important variables to consider, such as photosynthetically available radiation (PAR), ultraviolet radiation (UVR), and turbidity (Hop and Wiencke, 2019). Many of these important drivers are known from research conducted further south. Where datasets are easier to build, and time series are longer. For this reason one may find that the drivers of change in Arctic are more often inferred than they are ‘known.’ This is because historically there has been a paucity of data in the Arctic (Bischof et al., 2019b). Many international projects, in coordination with many established Arctic research institutions, have been very busy to close this knowledge gap and the holes in our knowledge are being filled rapidly. FACE-IT is one of these projects that seeks to better understand biodiversity changes, while contributing to and drawing from this expanding body of knowledge.
In addition to knowing what it is that may cause changes, it is necessary to identify the fonts of biodiversity that may be affected by these drivers. There are many taxa/species etc. that have been identified as important for monitoring throughout the Arctic. Foremost of these are the kelps, brown macroalgae that often function as ecosystem engineers along the cool temperate coastlines of the world or cooler (Bischof et al., 2019a). The prevailing hypothesis is that as the Arctic warms, the retreating coastal sea ice and increased temperatures will be more hospitable to kelp forests, and everything that comes with them. But there’s a catch. As temperatures warm, glaciers melt more rapidly, releasing more runoff into coastal zones that increases turbidity (Bischof et al., 2019a). This means that benthic organisms, like kelps, will not receive the levels of PAR that they would like, potentially inhibiting their growth. One benefit of this is that the kelps are exposed to lower levels of UVR, which may help them to some extent. More research and longer time series are required to say conclusively how this situation will play out. It will also differ between sites and so this issue is addressed again below where appropriate.
Consider that even if global temperature rise is limited to 2°C, this will mean a +4°C increase in the Arctic (Overland et al., 2019). Land ice melt is also projected to continue regardless of emission reductions due to internal lags, meaning that continued sea level rise throughout the century is a certainty. One must also keep in mind that the disproportionately larger surface heat fluxes into the Arctic may inhibit the stabilisation of the global climate even if an effective emissions reduction strategy is implemented (Overland et al., 2019).
NB: This is one option for how to show tabular information. I’ve put the tables behind these buttons so that only one is shown at a time. Lower down in this document all tables are shown together. I’m curious to know what people prefer.
Tables
Drivers
| Category | Driver | Why | Reference |
|---|---|---|---|
| Cryosphere | Sea-ice cover | Stroeve and Notz (2018) | |
| Cryosphere | Glacial melt | ||
| Cryosphere | Permafrost thaw | ||
| Physical | Air temperature | ||
| Physical | SST | ||
| Physical | Precipitation | Affects the amount of fresh water runoff into coasts. | |
| Physical | Freshwater runoff | Delivers carbon and nutrient rich freshwater to coast. | Delpech et al. (2021) |
Meta-data
Svalbard
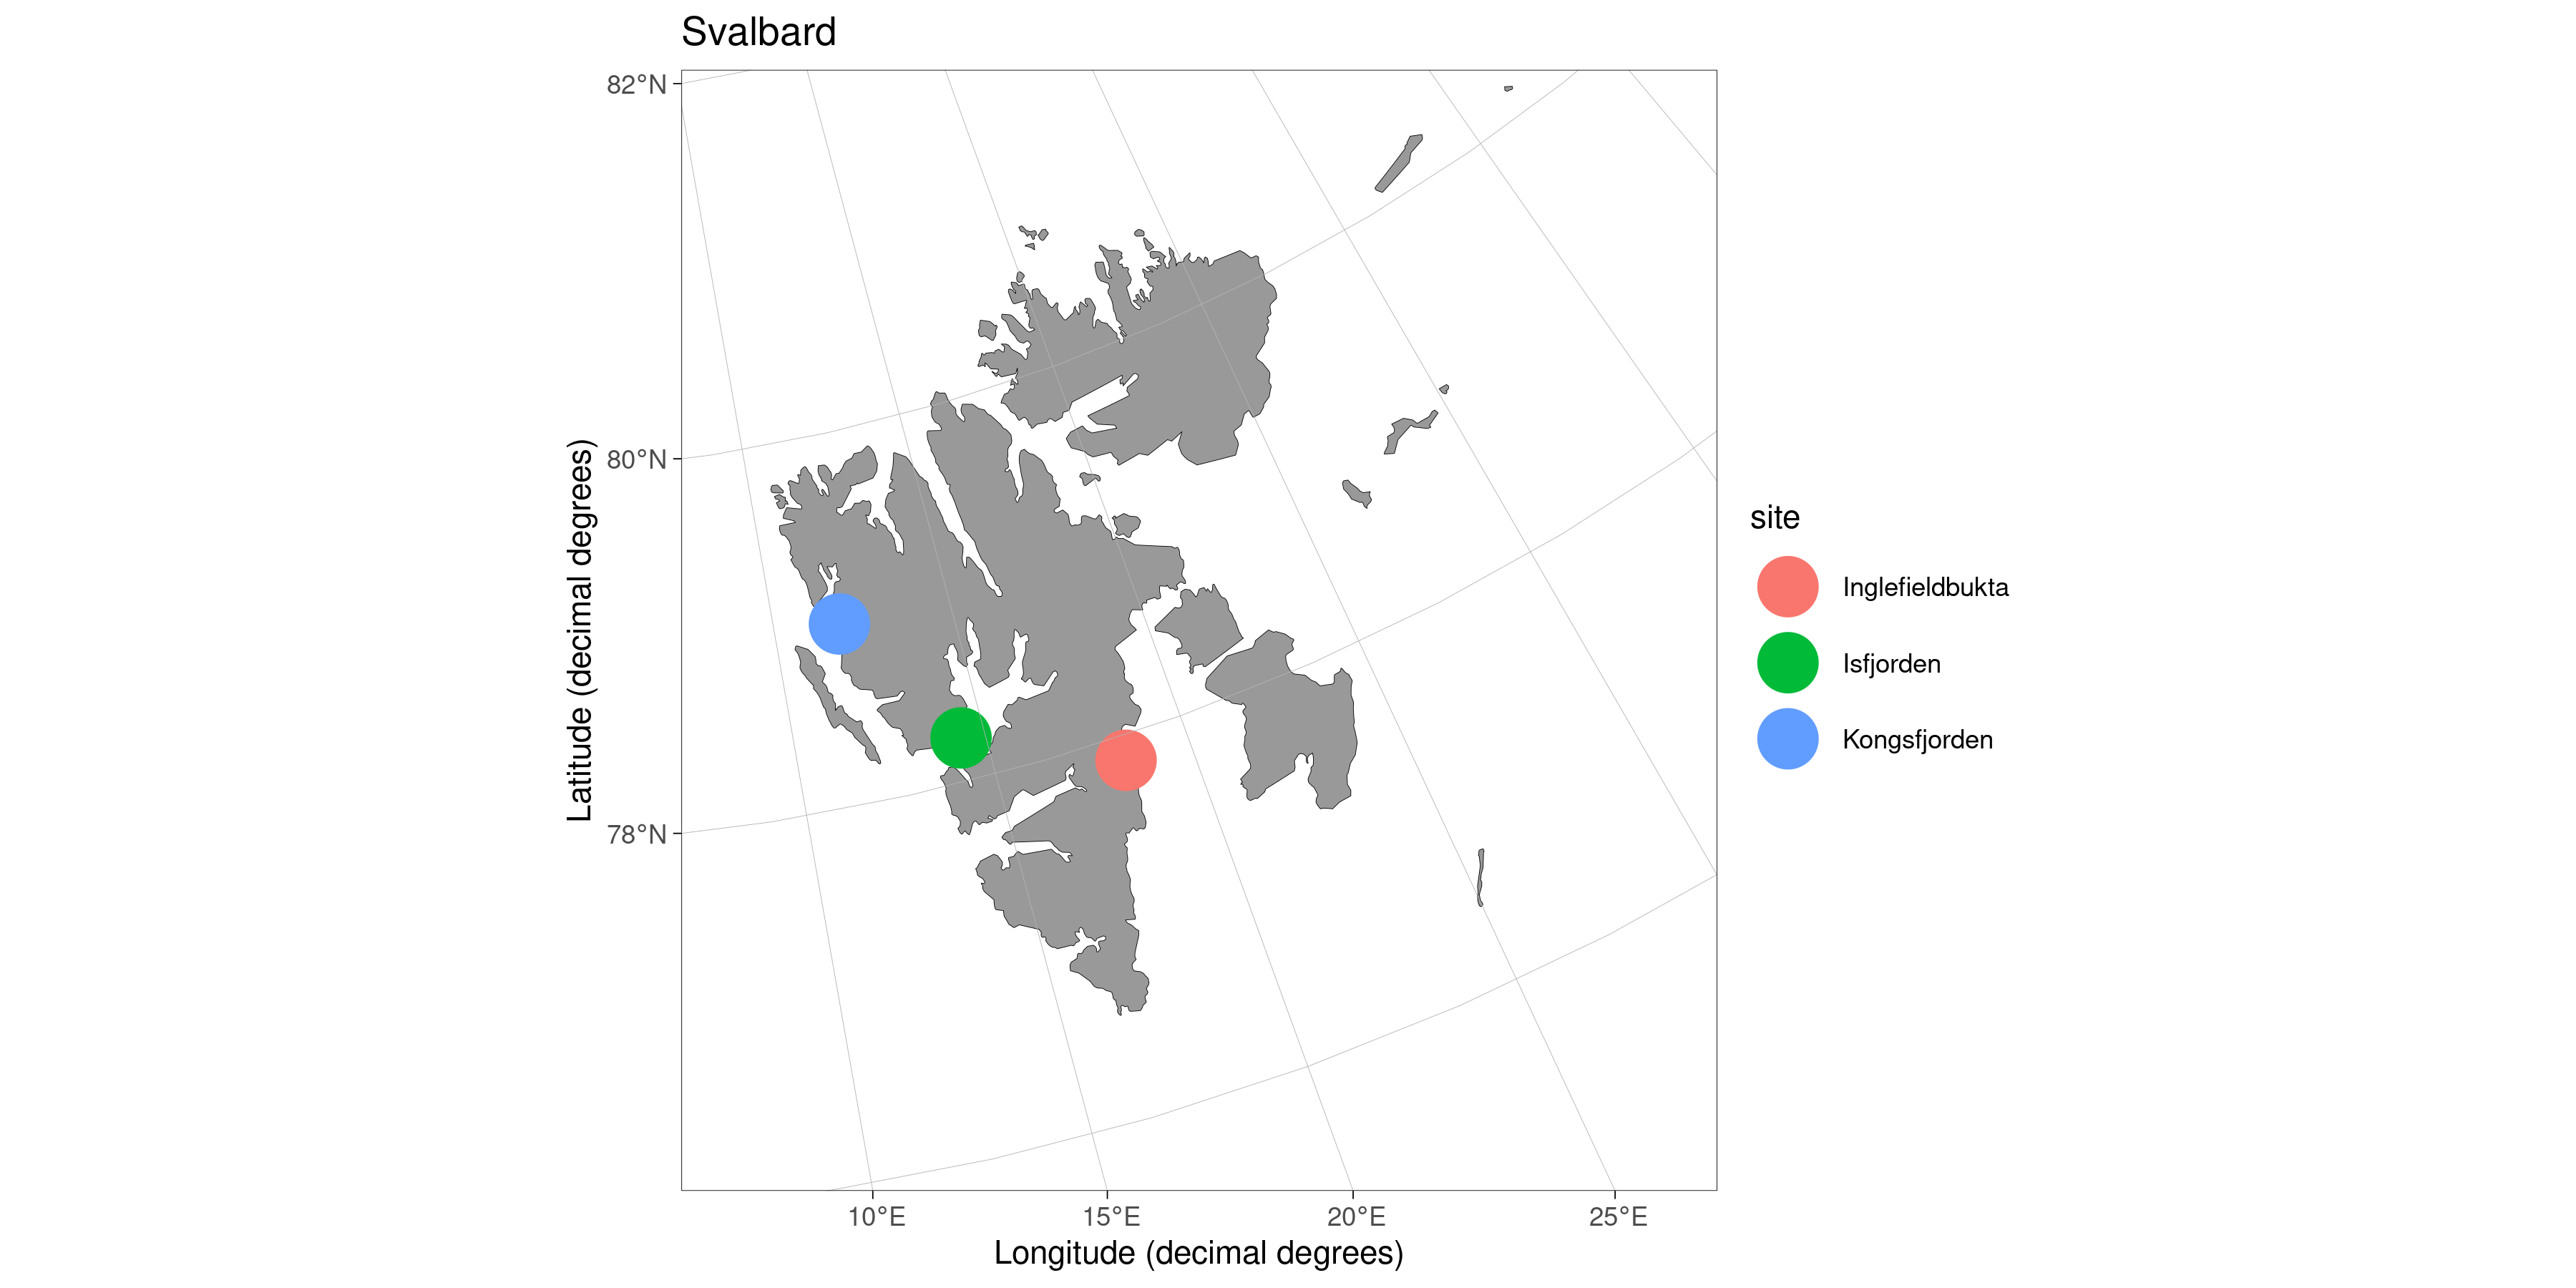
While not a study site itself, there are a lot of studies and data products that focus on Svalbard broadly, rather than individual study sites within this region. Therefore this geographical region has it’s own meta-data table. The primary drivers of change for each site are still listed in their own tables.
| Category | Driver | Why | Reference |
|---|---|---|---|
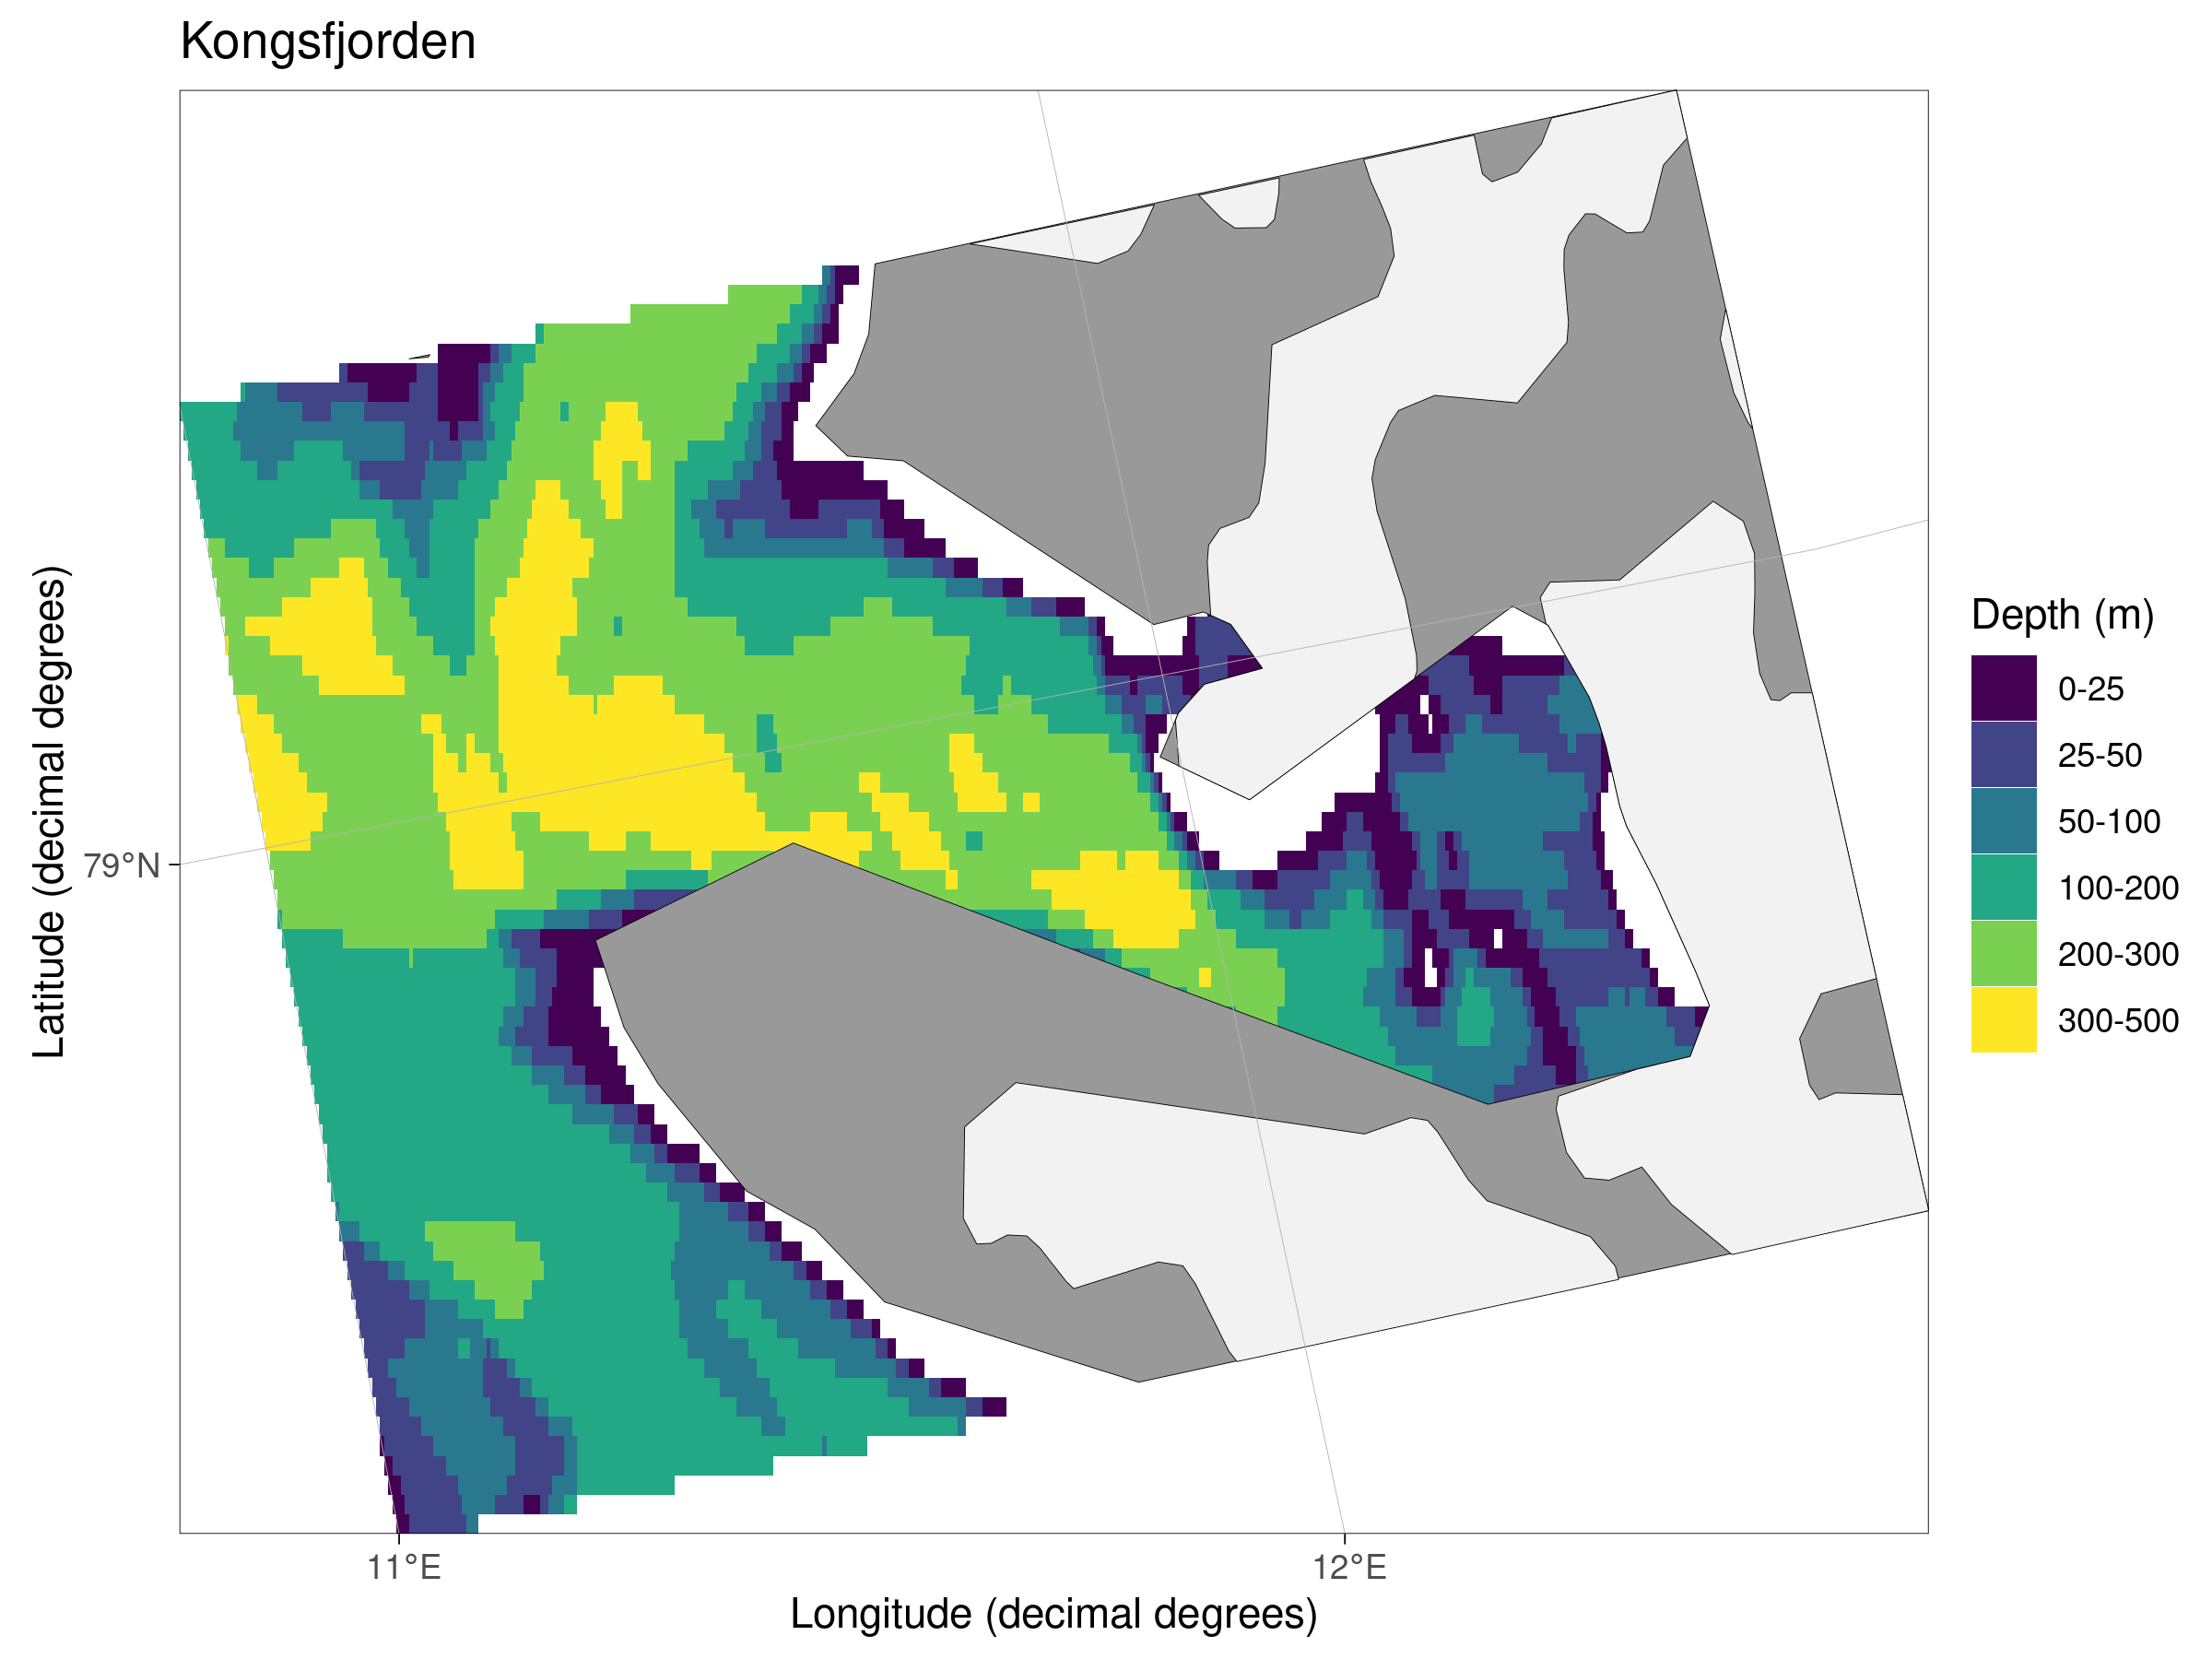
Kongsfjorden
Much of the solar magnetic radiation going towards earth is focussed around Ny Alesund. This can have a knock on effect to air temperature when there are strong auroras: up to 4°C! Unfortunately models currently capture this effect very poorly.
Land terminating glaciers around Kongsfjorden have been retreating linearly over the last decades. Water terminating glaciers retreat less linearly as there are occasions when the water terminating edge may surge forward, making it look like the terminating edge has improved. This is generally due to a destabilisation of the glacier that means an overall decrease in the glacier mass balance. 2020 was a record breaking warm year that has led to record breaking melts. Smaller glaciers are more susceptible to the increase in melt driven by climate change as they have smaller areas to accumulate ice etc. during the cold period of the year.
Up until 2007 the fjord tended to be frozen 100% until February (Pavlova et al., 2019). Since 2007 the fjord has been having less and less surface freezing. This is in part due to Atlantic water encroachment. These waters are higher in aragonite and pH. These are also less turbid, allowing for more light for use with plankton etc. The plankton do respond to this with Atlantic species favoured in warmer years.
As to the influence of light, this has been increasing both due to increased melt and less ice cover throughout the year, in addition to increases in tourism. Besides increases in light pollution, longer times and broader areas of exposed sea surface also allows for a greater accumulation of positive downward heat flux. Of the four heat flux terms, it appears that increases in long wave radiation (Q_lw) over time are the leading cause of change to the cryosphere (Bischof et al. (2019b)). Following this, short wave radiation (Q_sw) is also increasing at a worrying rate, due in part to a decrease in cloud cover over the summer months (Bischof et al., 2019b).
Because the higher trophic levels of Arctic ecosystems, including Kongsfjorden, are dominated by migratory species, such as sea birds, these will be less exposed to the build-up of contaminants in a given area. Such as those sources identified on Svalbard and around the Kongsfjorden area (Granberg et al., 2017). However, lower trophic level populations have shown the capacity to adapt rapidly enough to changes in local contamination that they are still able to carry contaminants up the food web (Bischof et al., 2019b).
A large priority area of Kongsfjorden research moving forward must be the processes of exchange between the neighbouring fjords of Kongsfjorden and the Atlantic ocean (Bischof et al., 2019b). Progressing from this regional analysis, the work being done in the other areas of western Svalbard should be upscaled so as to provide the basis across which modelling work could connect these areas into a single integrated region. The understanding of the effects of physical drivers on ecosystems, with a focus on primary and secondary producers, is a particularly important area of focus (Bischof et al., 2019b). Ultimately, one of the main goals of identifying these drivers is to better enhanced the predictive capabilities of science in the region.
A study conducted in situ compared biomass records from 2012-2014 against those from 1996-1998 and found that biomass had increased by 8.2 fold at the shallower depth of 2.5 m (Bartsch et al., 2016). These findings are similar to other macroalgae research throughout the Arctic that show a general increase in biomass accompanied by a shift to shallower depths. The physical processes that explain these observations are that increasing coastal sea-ice leads to less ice scour at these shallow depths, while less PAR is penetrating to the deeper range of macroalgae (Bartsch et al., 2016).
The distribution, abundance, and species composition of pelagic macro zooplankton are very sensitive to oceanic changes. It was found that the warming occurring in the Kongsfjorden ecosystem is having a dramatic positive effect on the abundance of euphausiids and amphipods (Dalpadado et al., 2016). This is of particular importance as these are key prey species for target fishery species such as capelin and polar cod. As the borealisation of the fjord continues it may alter the population dynamics of prey species so dramatically that the changes may be tracked in the by monitoring the diets of the local black-legged kittiwakes (Vihtakari et al., 2018).
| Category | Driver | Why | Reference |
|---|---|---|---|
| Cryosphere | Sea-ice cover | Affects pelagic and benthic production. | Bischof et al. (2019a) |
| cryosphere | Land glacier mass balance | An indicator of the change to other drivers | Pavlova et al. (2019) |
| Cryoshpere | Runoff | Alters salinity, nutrients, and turbidity of surface waters. | Bischof et al. (2019a) |
| Physical | Longwave radiation (Q_lw) | Primary driver of warming waters. | Bischof et al. (2019b) |
| Physical | Shortwave radiation (Q_sw) | Secondary driver of warming waters. | Bischof et al. (2019b) |
| Physical | Turbidity | Prevents light to benthic producers. | Bischof et al. (2019a) |
| Physical | Circulation | Allows for more encroachment of Atlantic waters. | Hop and Wiencke (2019) |
| Chemistry | Acidification | Affects pelagic primary production. | Hop and Wiencke (2019) |
| Biological | Benthic macroalgal biomass/production | Changes where coastal ecosystems will be found and at what scale. | Bartsch et al. (2016) |
| Biological | Macro zooplankton | Top down pressure on phytoplankton and a source of food higher up. | Dalpadado et al. (2016) |
| Biological | Seabird diet | Changes to prey items serve as an indicator of borealisation. | Vihtakari et al. (2018) |
| Social | Ship traffic | Indicative of direct anthropogenic disturbance. |
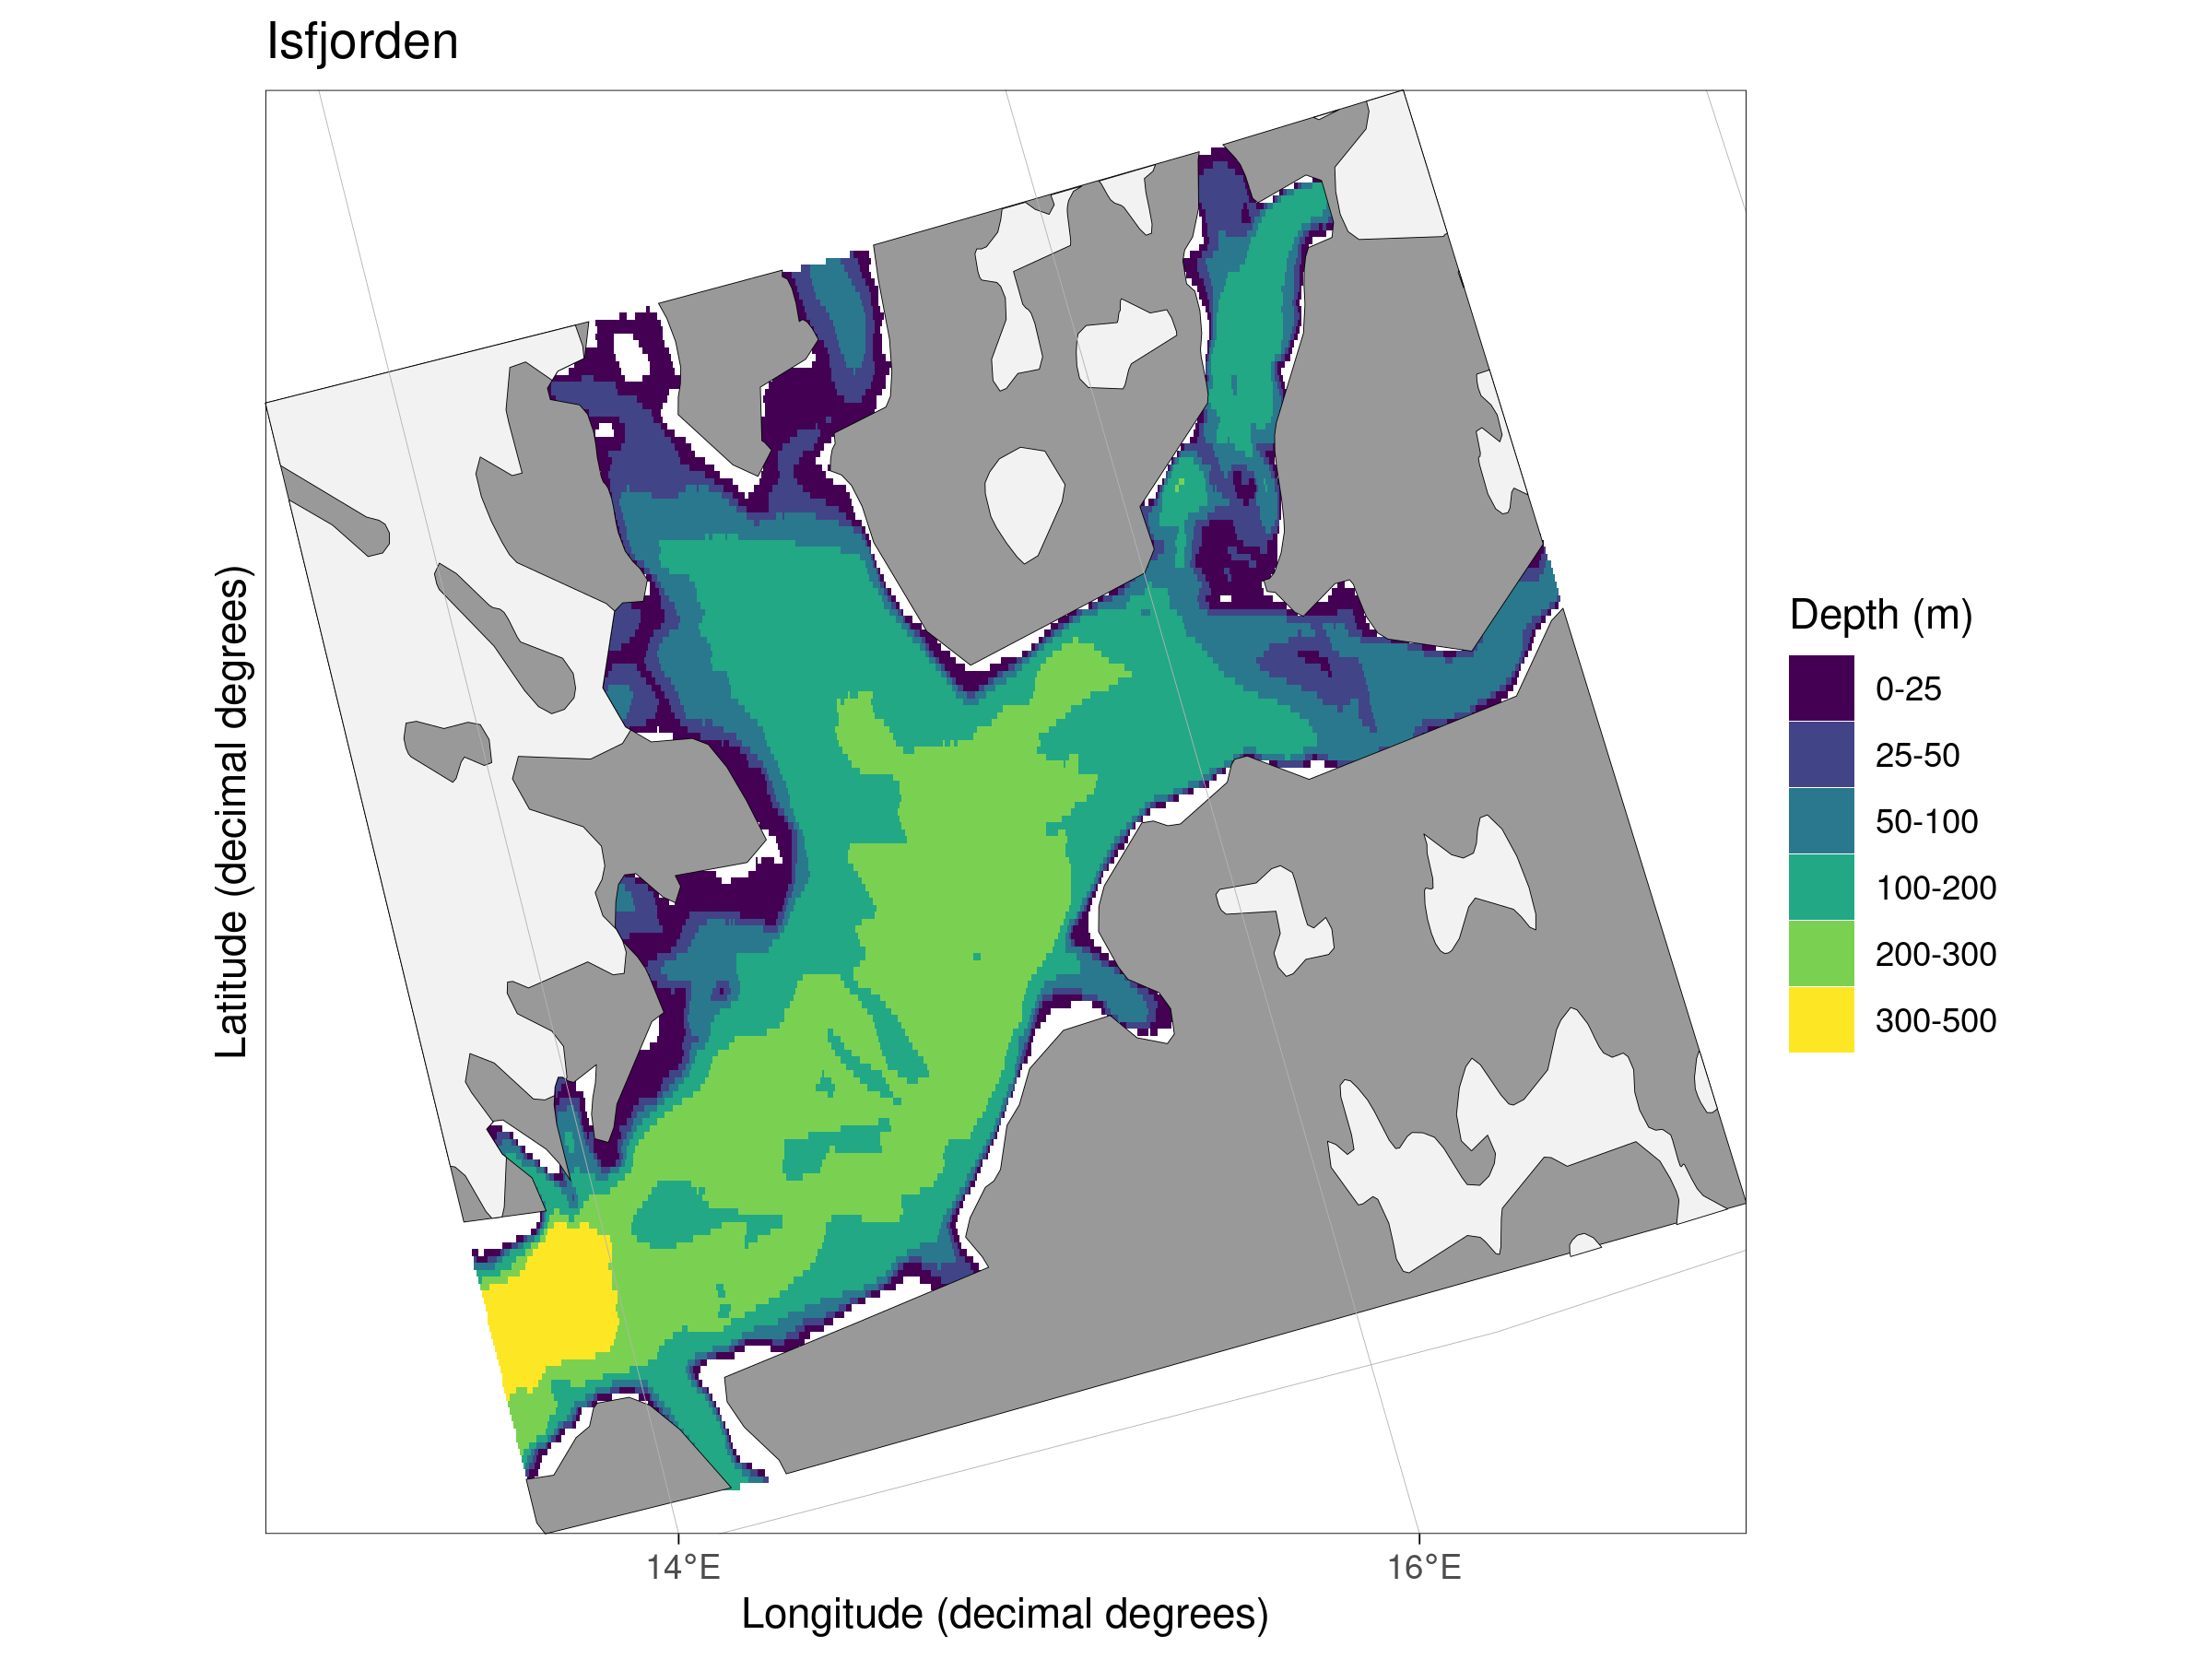
Isfjorden
Changes to the abundance of euphausiids and amphipods have been noted in Isfjorden, but not to the same extent as Kongsfjorden (Dalpadado et al., 2016). This is attributed primarily to the fact that the thermal regime of Isfjorden is not changing as rapidly as Kongsfjorden. Likely because Isfjorden does not experience as much encroachment from the Atlantic.
Atlantic inflows of water in the late summer can create pelagic microbial communities more similar to periods of summer stratification (Delpech et al., 2021). On the other end of the fjord, high riverine inputs can have a different effect on the expected microbial community for the time of year.
Fast ice, e.g. sea-ice attached to the coast, has decreased significantly in the fjord (Muckenhuber et al., 2016). The shift appears to have been most pronounce from 2006. Fast ice coverage correlates well with remotely sensed SST and and in situ air temperatures, meaning that these could perhaps be used as proxies where no ice cover data are available. As fast ice cover began to decrease more rapidly, there was an observed uptick in the heat content of the fjord in Autumn (Muckenhuber et al., 2016). The authors allude to, without concluding that, changes in sea ice cover must have a discernible connection to changes in heat flux into the ocean. Likely in both strength and phenology.
Atlantic Water (AW) has traditionally formed much of the bottom layer of the fjord in summer, but starting in 2006 a shift has begun in which AW is occupying much more of the water column (Skogseth et al., 2020). In combination with the disappearance of fast ice, this is one of the main forces attributed to the increasing SST trend of 0.7°C/dec. Skogseth et al. (2020) therefore conclude that the increased AW advection is the main reason for the changing climate of Isfjorden. The advection of AW into the fjord, and therefore the warming that it causes, is largely dictated by the competition between the Spitsbergen Polar Current (Arctic Water) and the Spitsbergen Trough Current (AW). AS the borealisation of the Arctic continues, the advection of AW into the fjord is only likely to increase. These inflows of AW are driven largely by changes to the patterns of the wind stress field in the area (Pavlov et al., 2013). Mean sea-level pressure (MSLP) data can be used as a proxy to determine changes in wind stress, and Pavlov et al. (2013) used ERA data to do so. This climate reanalysis product is freely available from CMEMS and is commonly used in climate science.
For zooplankton communities in the fjord, seasonality is the largest predictive factor (Vereide, 2019). This is however influenced by local scale perturbations in temperature, salinity, and light availability. Therefore, anything affecting these variables, such as runoff from glaciers and rivers, will also affect the zooplankton communities. As the Arctic warms, runoff will almost certainly increase, meaning that this will likely be a noteworthy driver of change. Accompanying these changes brought on by increased runoff are the changes to nutrient inflow from land to sea. Nutrient concentrations in rivers can be 12-fold higher than in the fjord (McGovern et al., 2020). So as increased warming leads to increased melt leads to increased runoff leads to increased nutrient input, the biogeochemical properties of the fjord are projected to change apace with climate (McGovern et al., 2020). One must remember however that with increased runoff comes increased turbidity, which may have a counteracting effect to nutrient input by preventing access to light at the surface. The effects of these fresh water plumes on coastal communities is very dramatic but also tends to be very localised (McGovern et al., 2020). They can be captured with some fidelity using remotely sensed ocean colour data, but future studies should aim to use not only high spatial resolution data, but high temporal resolutions as well in order to better resolve seasonal changes driven by this phenomenon (McGovern et al., 2020).
In support of this line of reasoning, surveys of benthic macrofauna in the smaller adjoining fjords has shown that small scale local differences in physical variables have a much stronger relationship to local community structure than do any fjord-wide gradients (Ugelstad, 2019). Ugelstad (2019) also found that species richness was higher in less disturbed environments. This implies that as the fjord continues to change, species that are able to persist at deeper depths (which will also be subject to less PAR) may have more time to adapt to the changing climate. Conversely, we also know that it is these deper areas that are experiencing increased amounts of AW inflow (Skogseth et al., 2020). So with increased runoff into the surface waters, and a rising of AW from below, it appears that the comfortable historic ranges for species in the fjord and it’s adjoining systems are being pinched off.
| Category | Driver | Why | Reference |
|---|---|---|---|
| Cryosphere | Fast ice cover | Decreasing (fast) ice cover can have a range of ecological effect. | Muckenhuber et al. (2016) |
| Physical | Atlantic water inflow | Increases the temperature and salinity of fjord waters. | Skogseth et al. (2020) |
| Physical | Freshwater runoff | Changes the temperature, salinity, and turbidity of surface waters. | Vereide (2019); Mcgovern et al. (2020) |
| Physical | Wind stress | Responsible for increasing Atlantic water inflow from the West Spitsbergen Current. | Pavlov et al. (2013) |
| Chemistry | Nutrient input | Can tip ecological balances by inordinately favouring some species over others. | Mcgovern et al. (2020) |
| Biological | Microbial communtiy | Affects the decomposition of material. | Delpech et al. (2021) |
| Biological | Zooplankton community | Foundational prey species for many pelagics. | Vereide (2019) |
| Biological | Benthic community | Contribute to biogeochemical processes; re-mineralise nutrients; food for higher trophic levels. | Ugelstad (2019) |
| Social | Fish landings | Alters top down trophic pressure. | |
| Social | Tourism arrivals | Increases to a range of pollutants from light to chemical. |
NB: This is just a place holder until Isfjorden data are added.
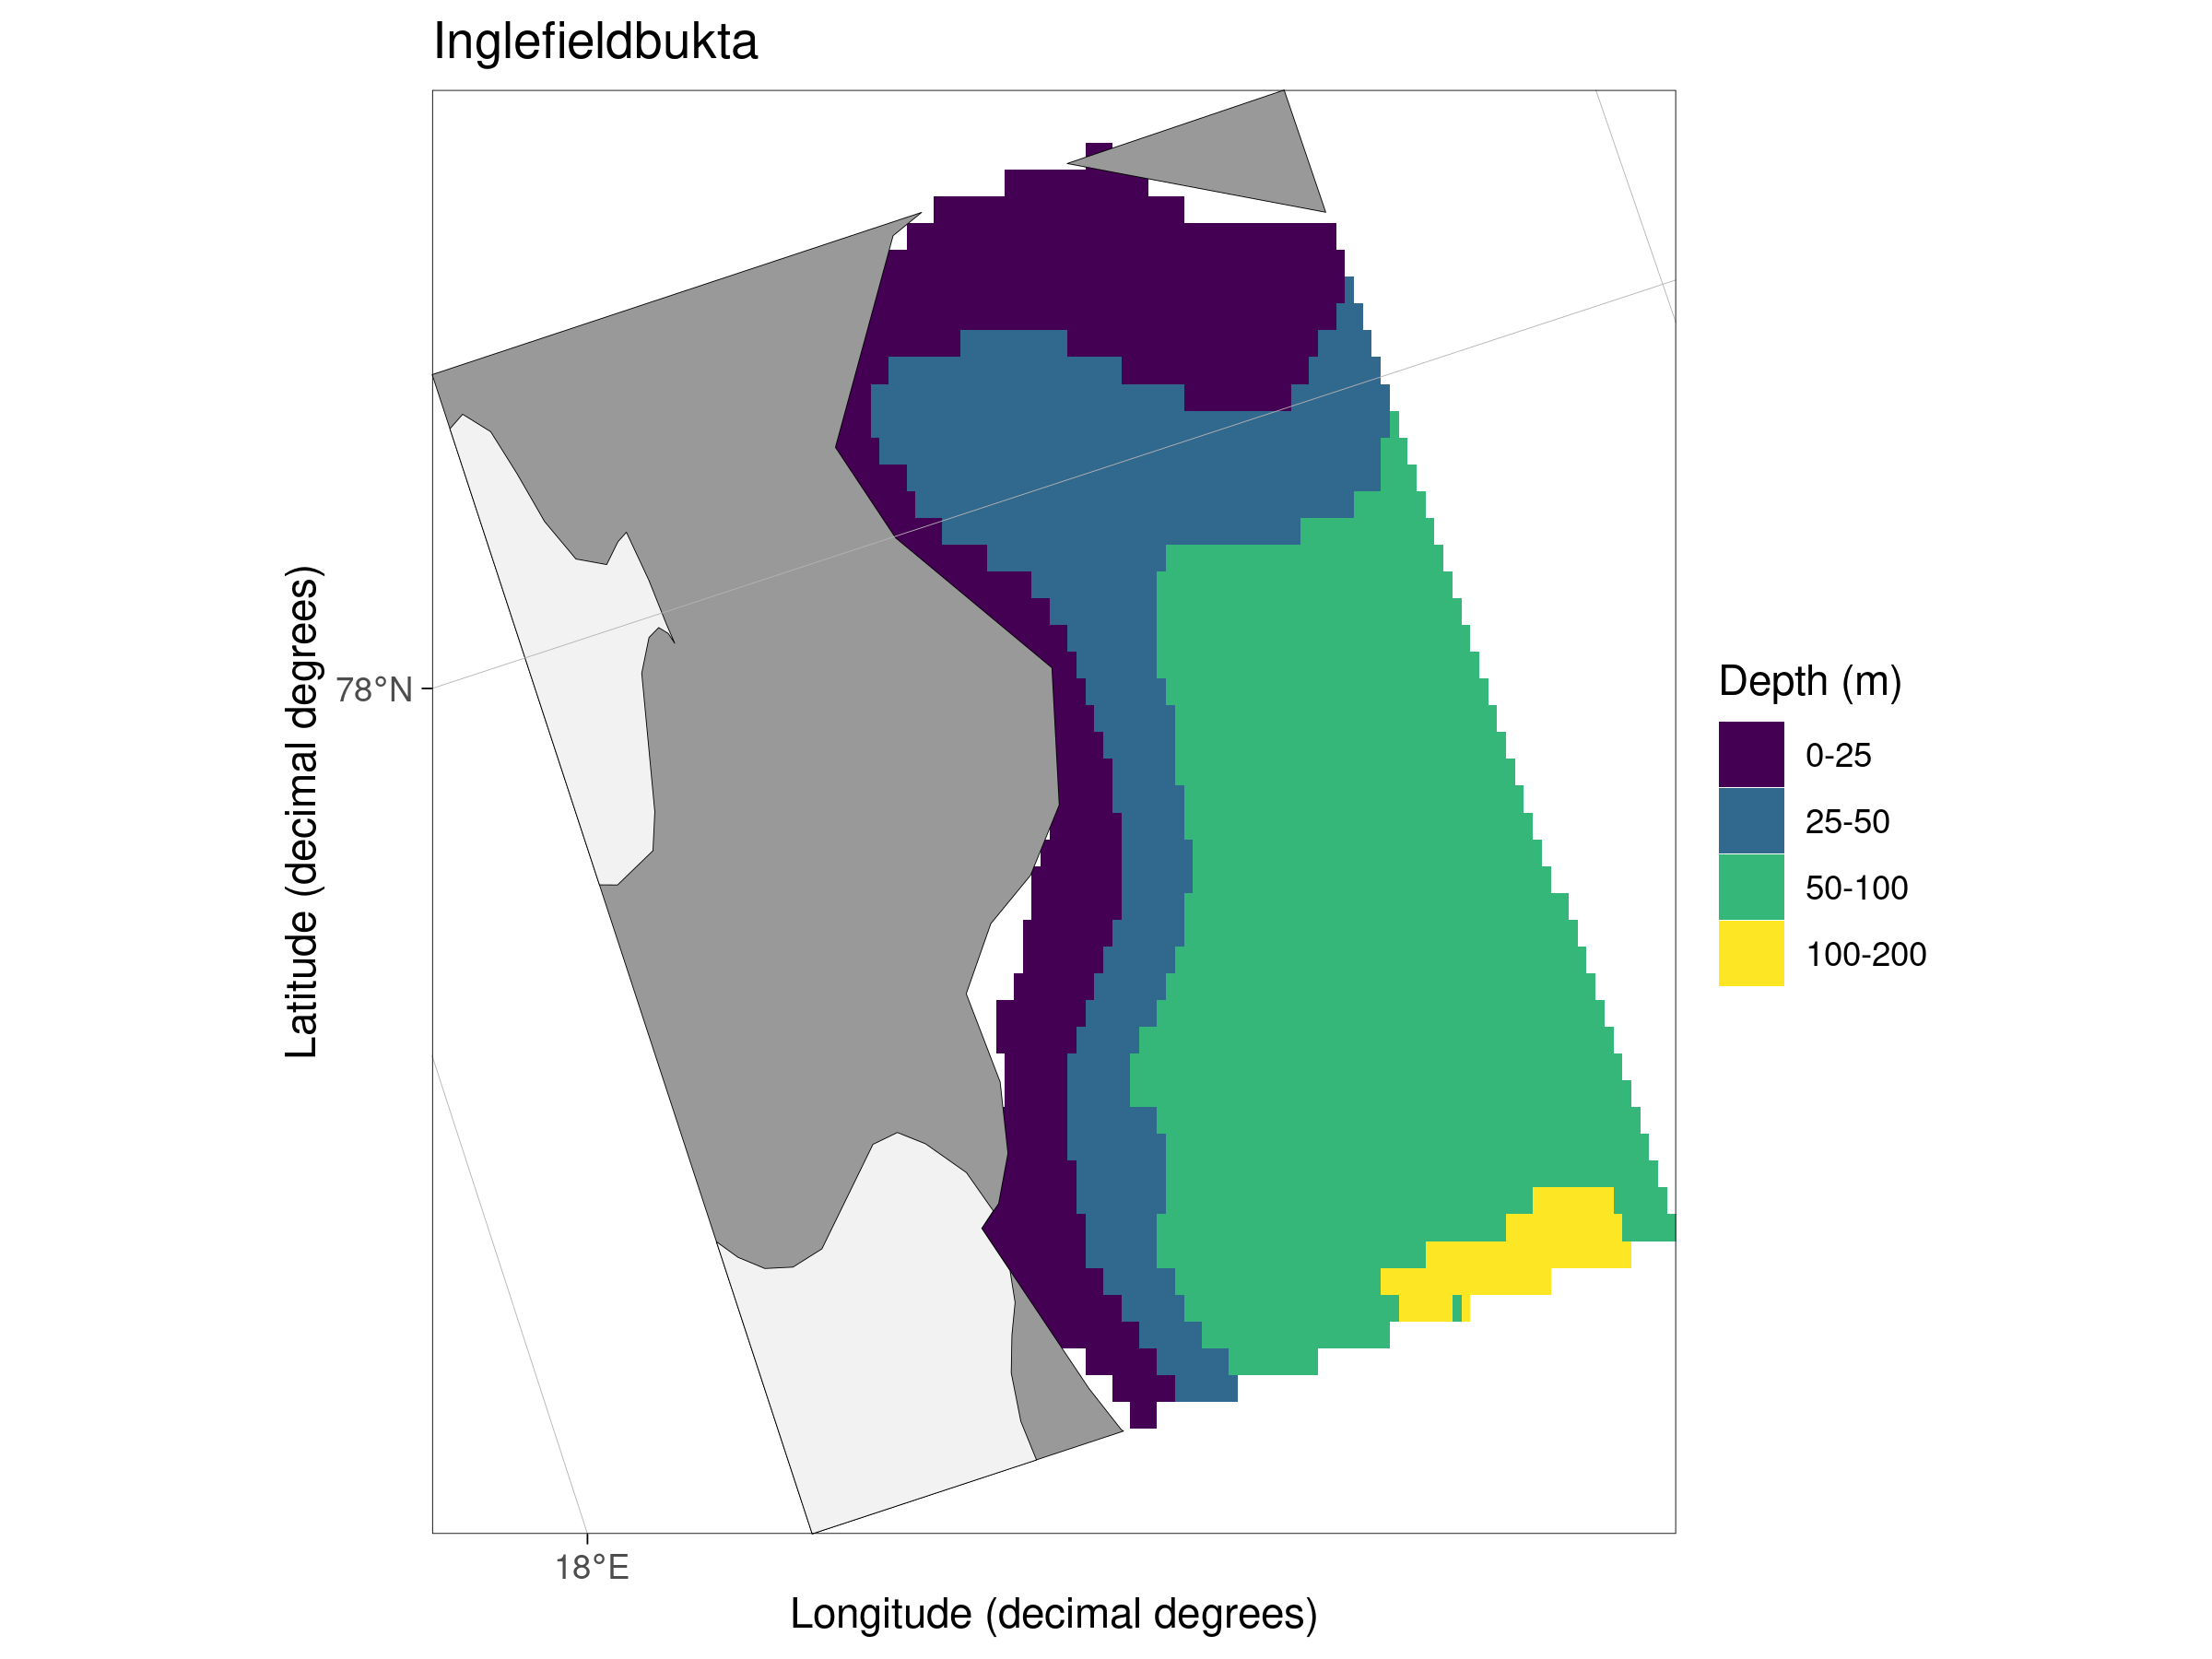
Inglefieldbukta
Greenland
See the EU Arctic figure above for where the Greenland sites are located. They are too spread out to be shown here in a single figure with any better precision than the full study area.
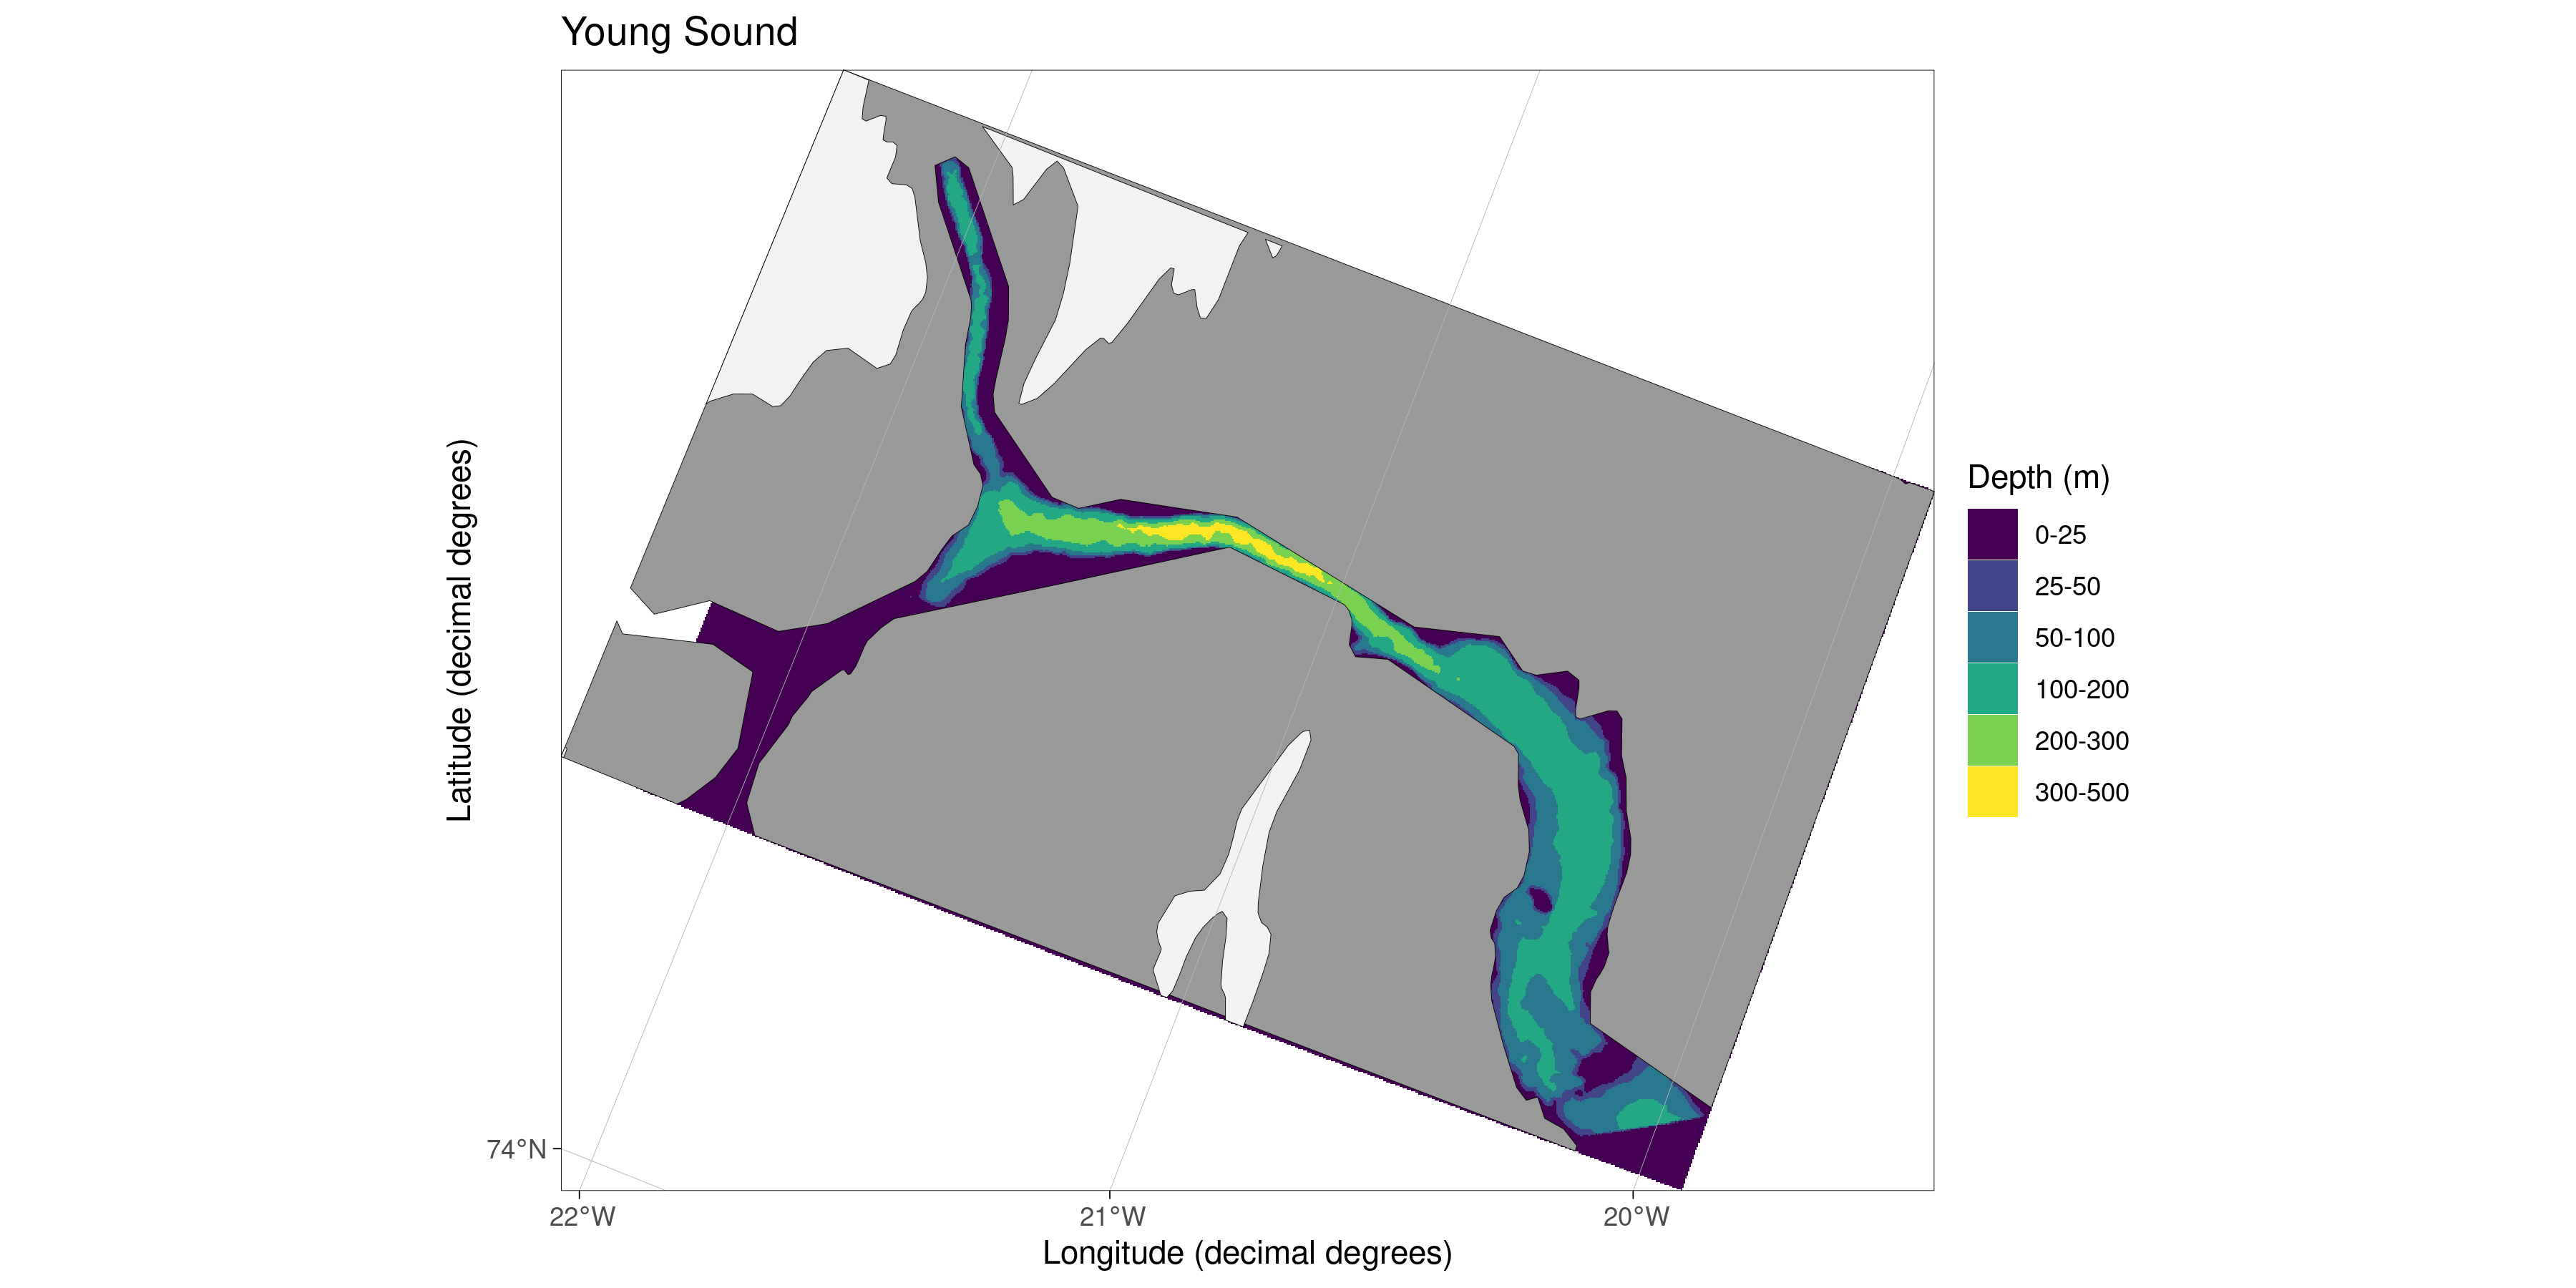
Young Sound
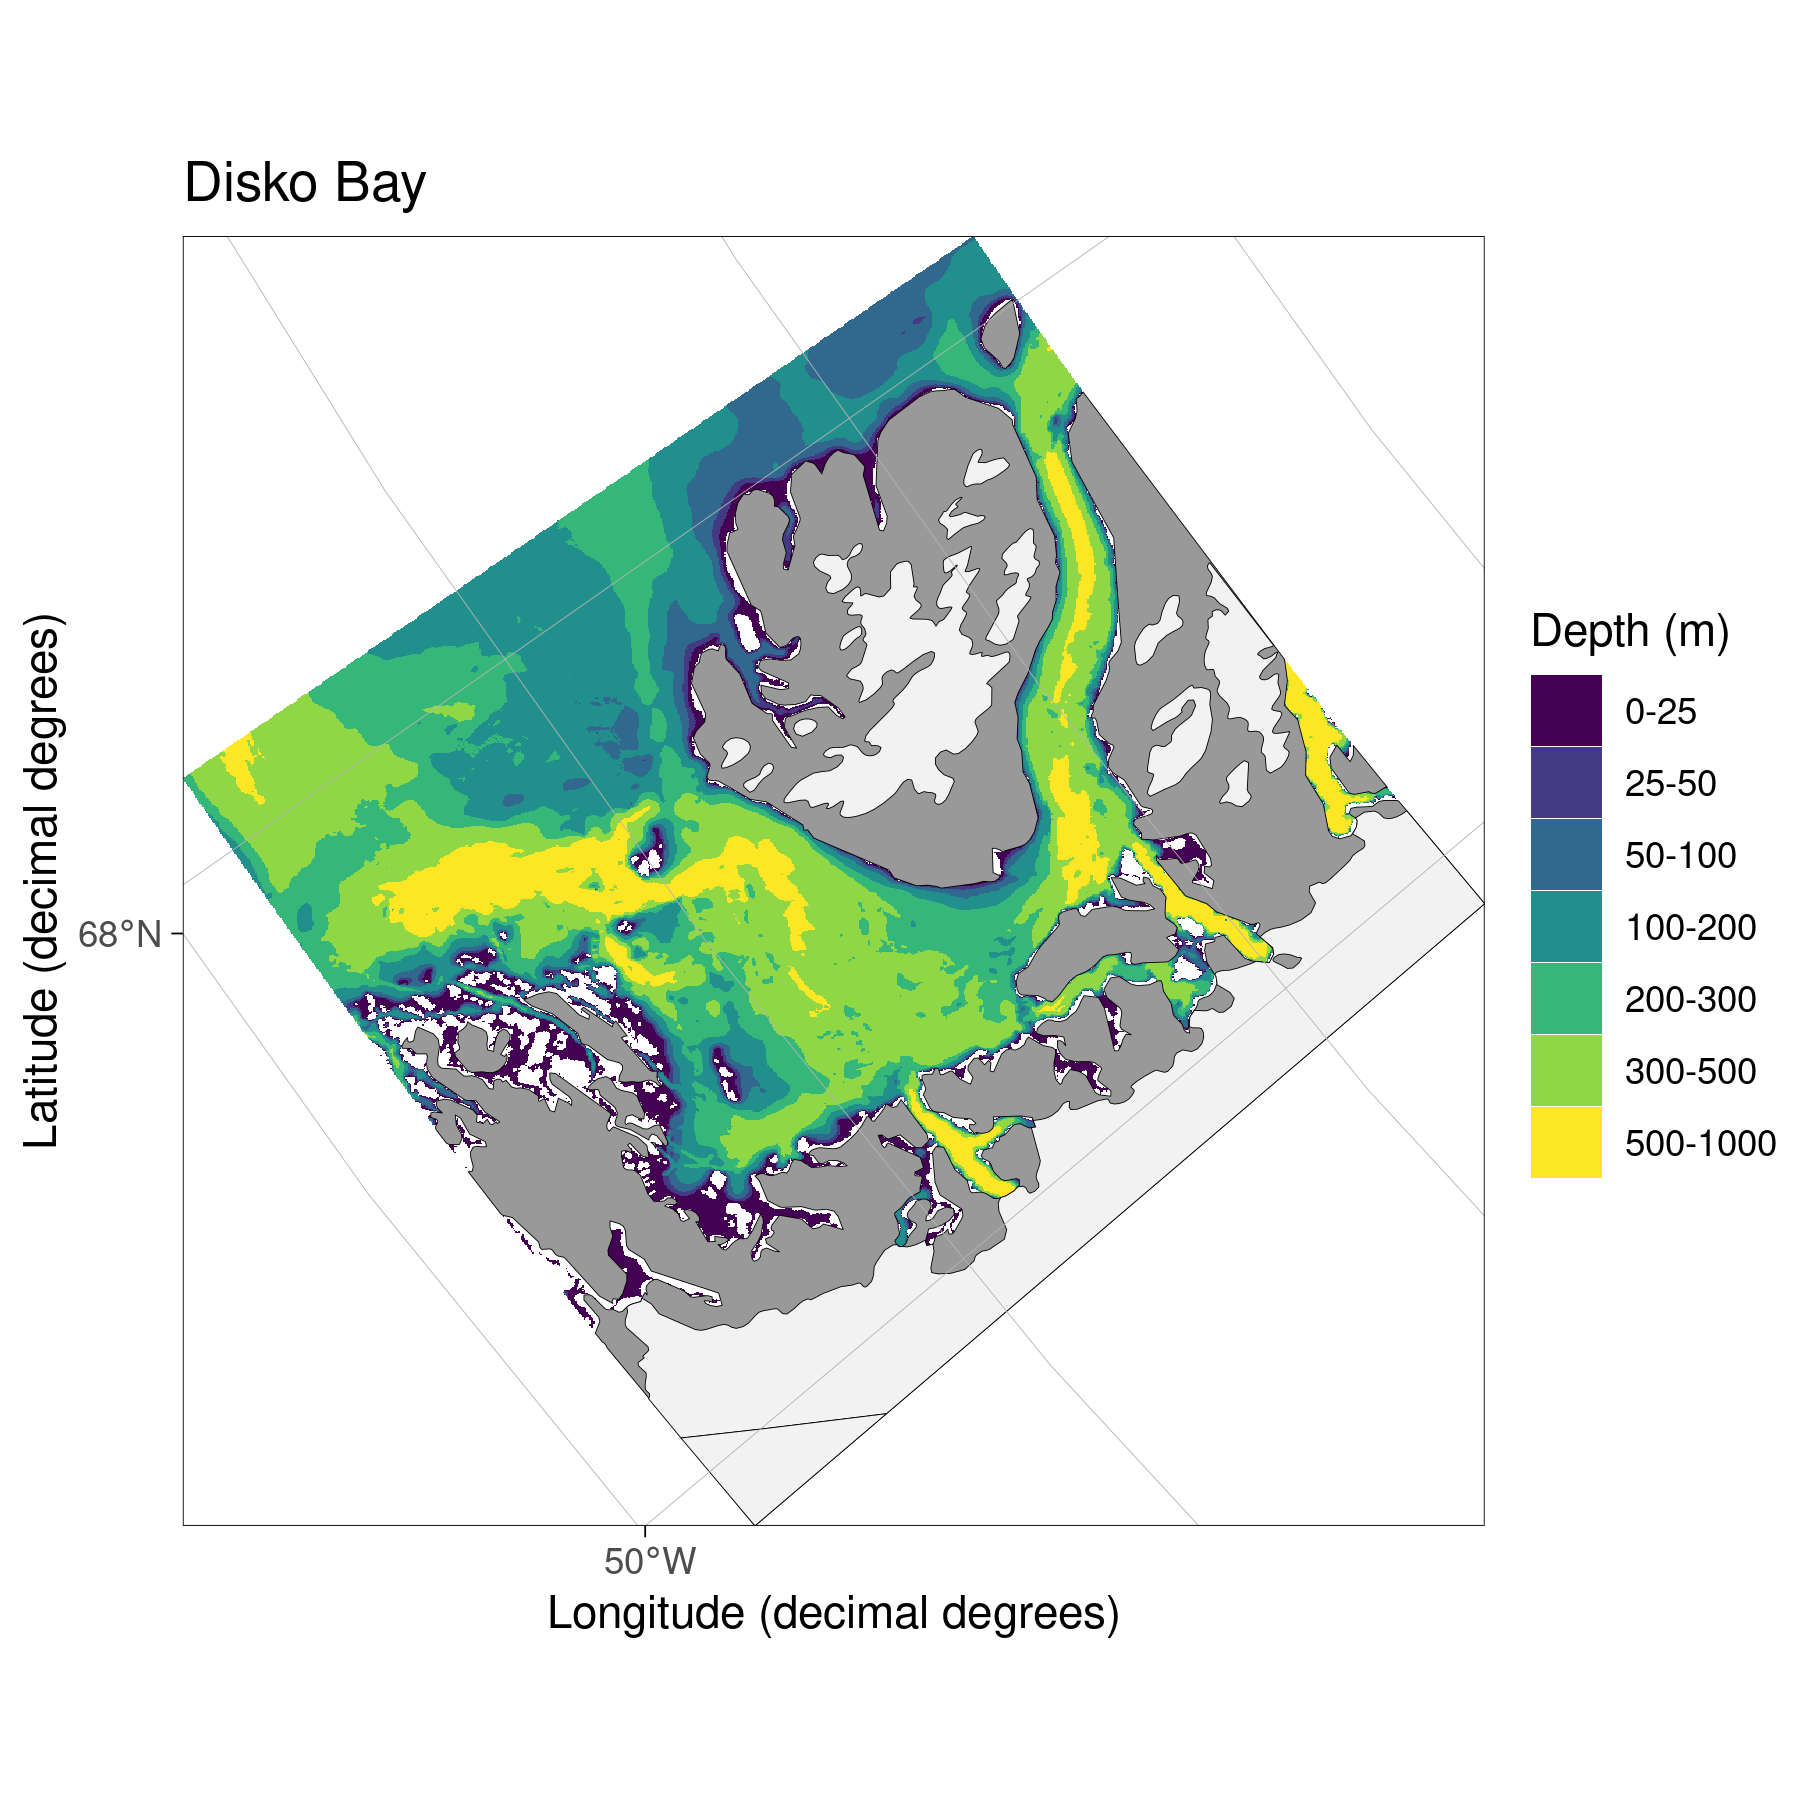
Disko Bay
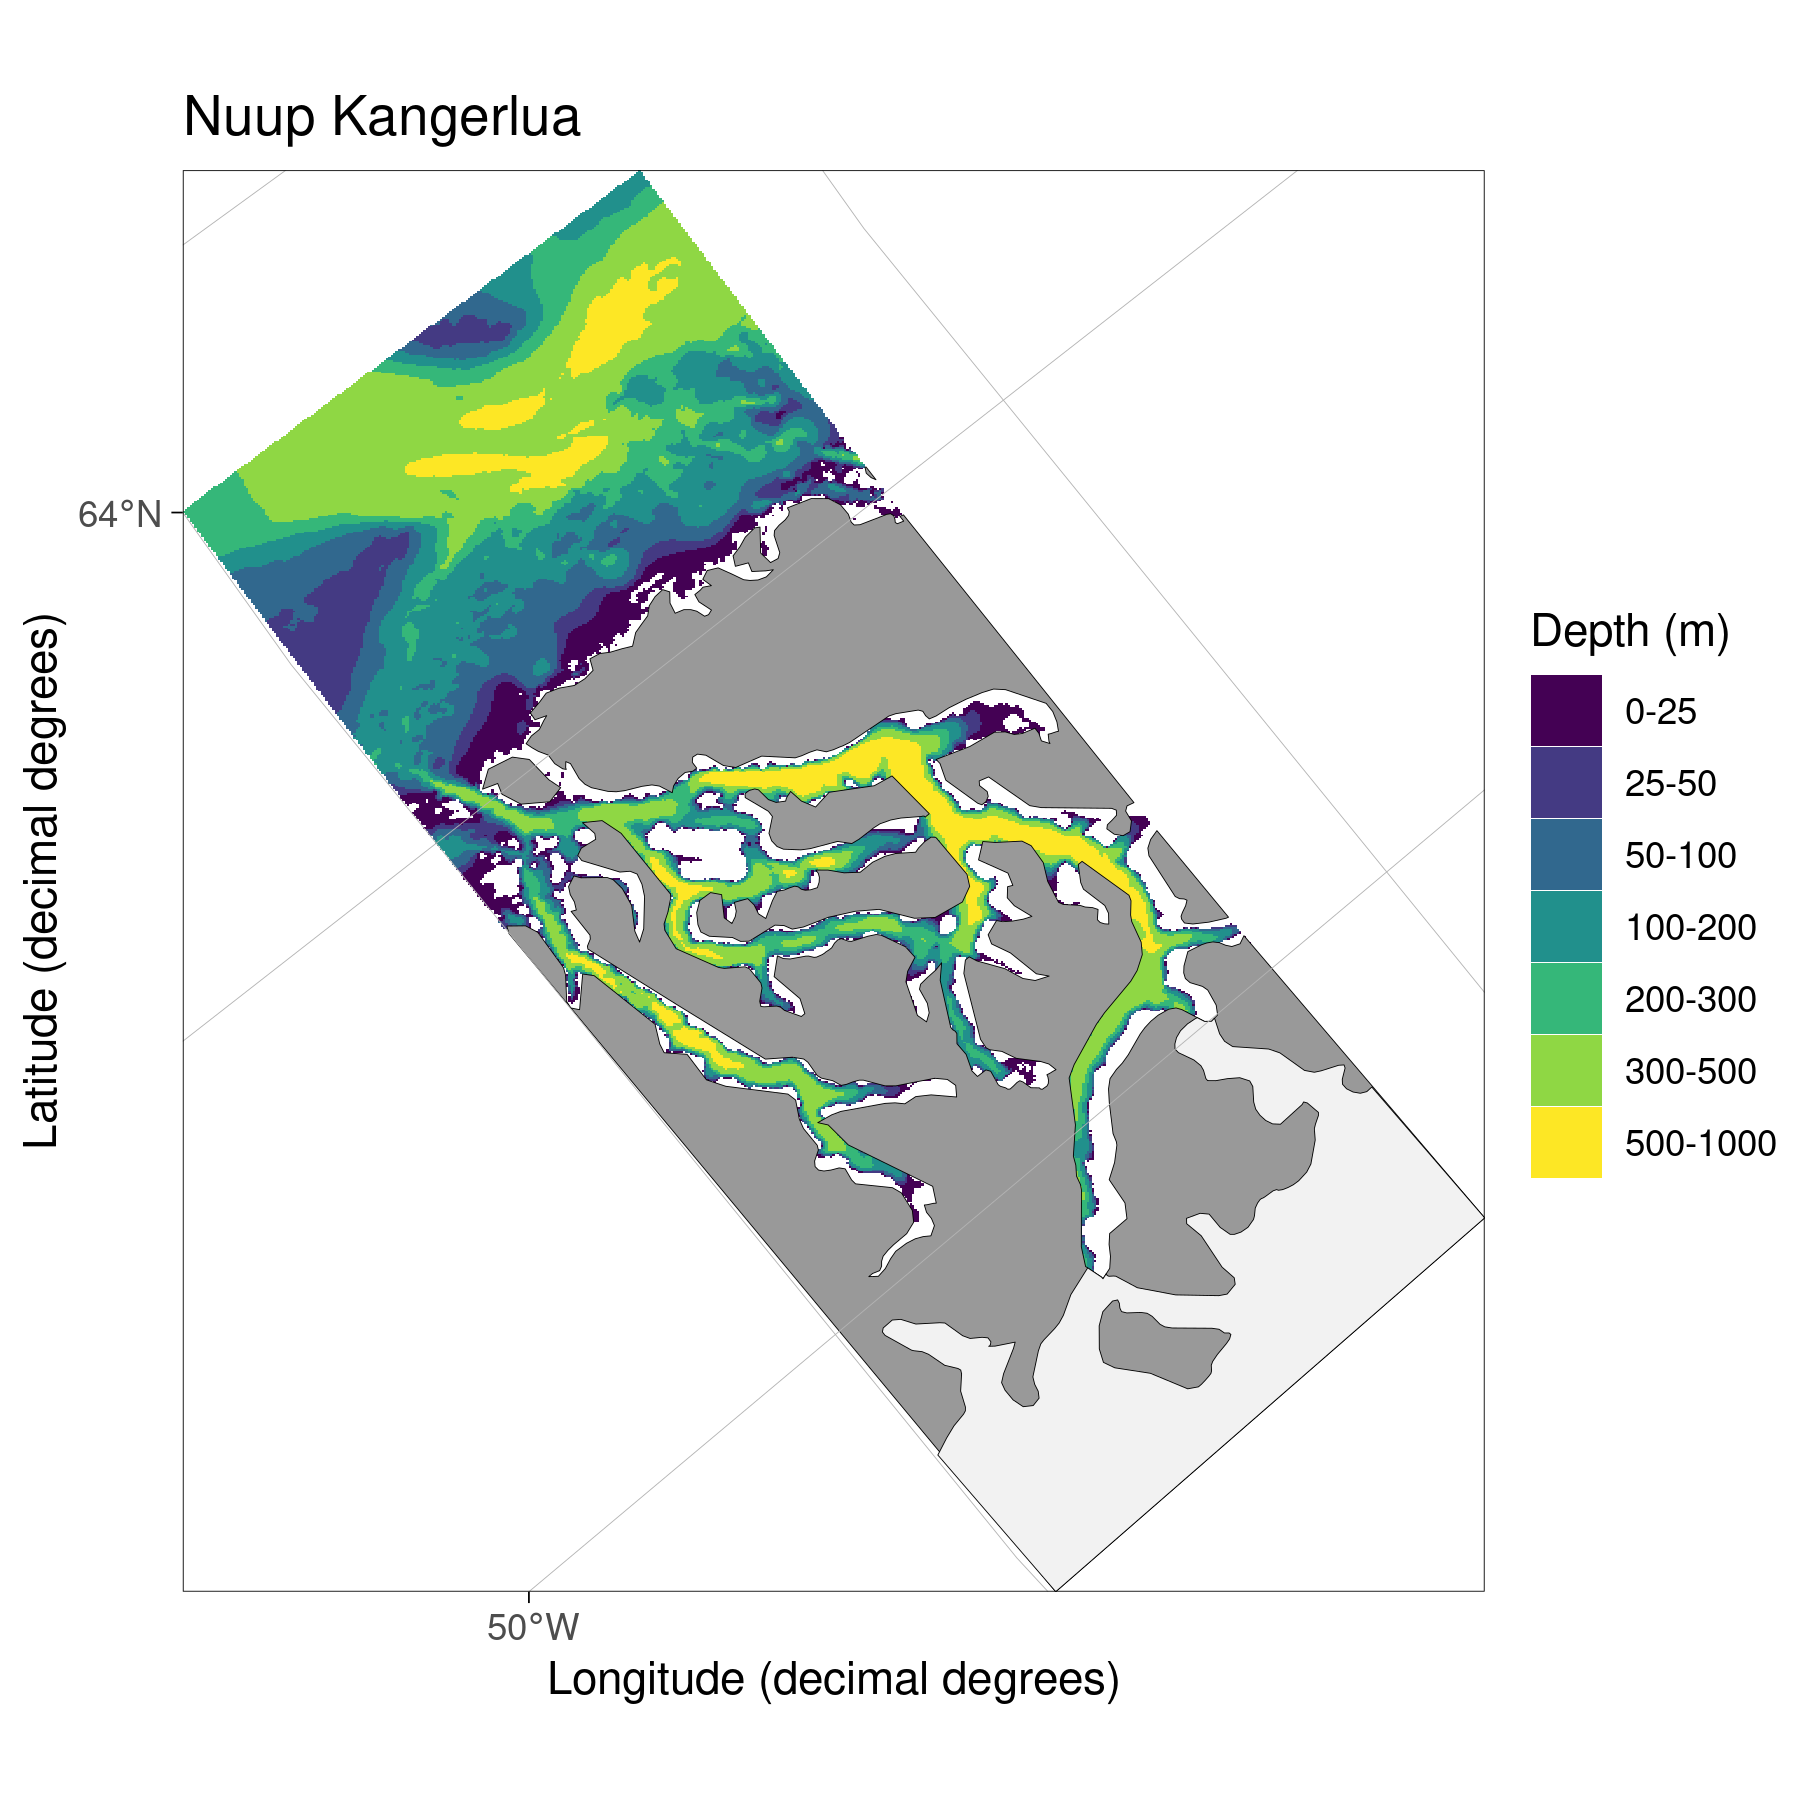
Nuup Kangerlua
Norway
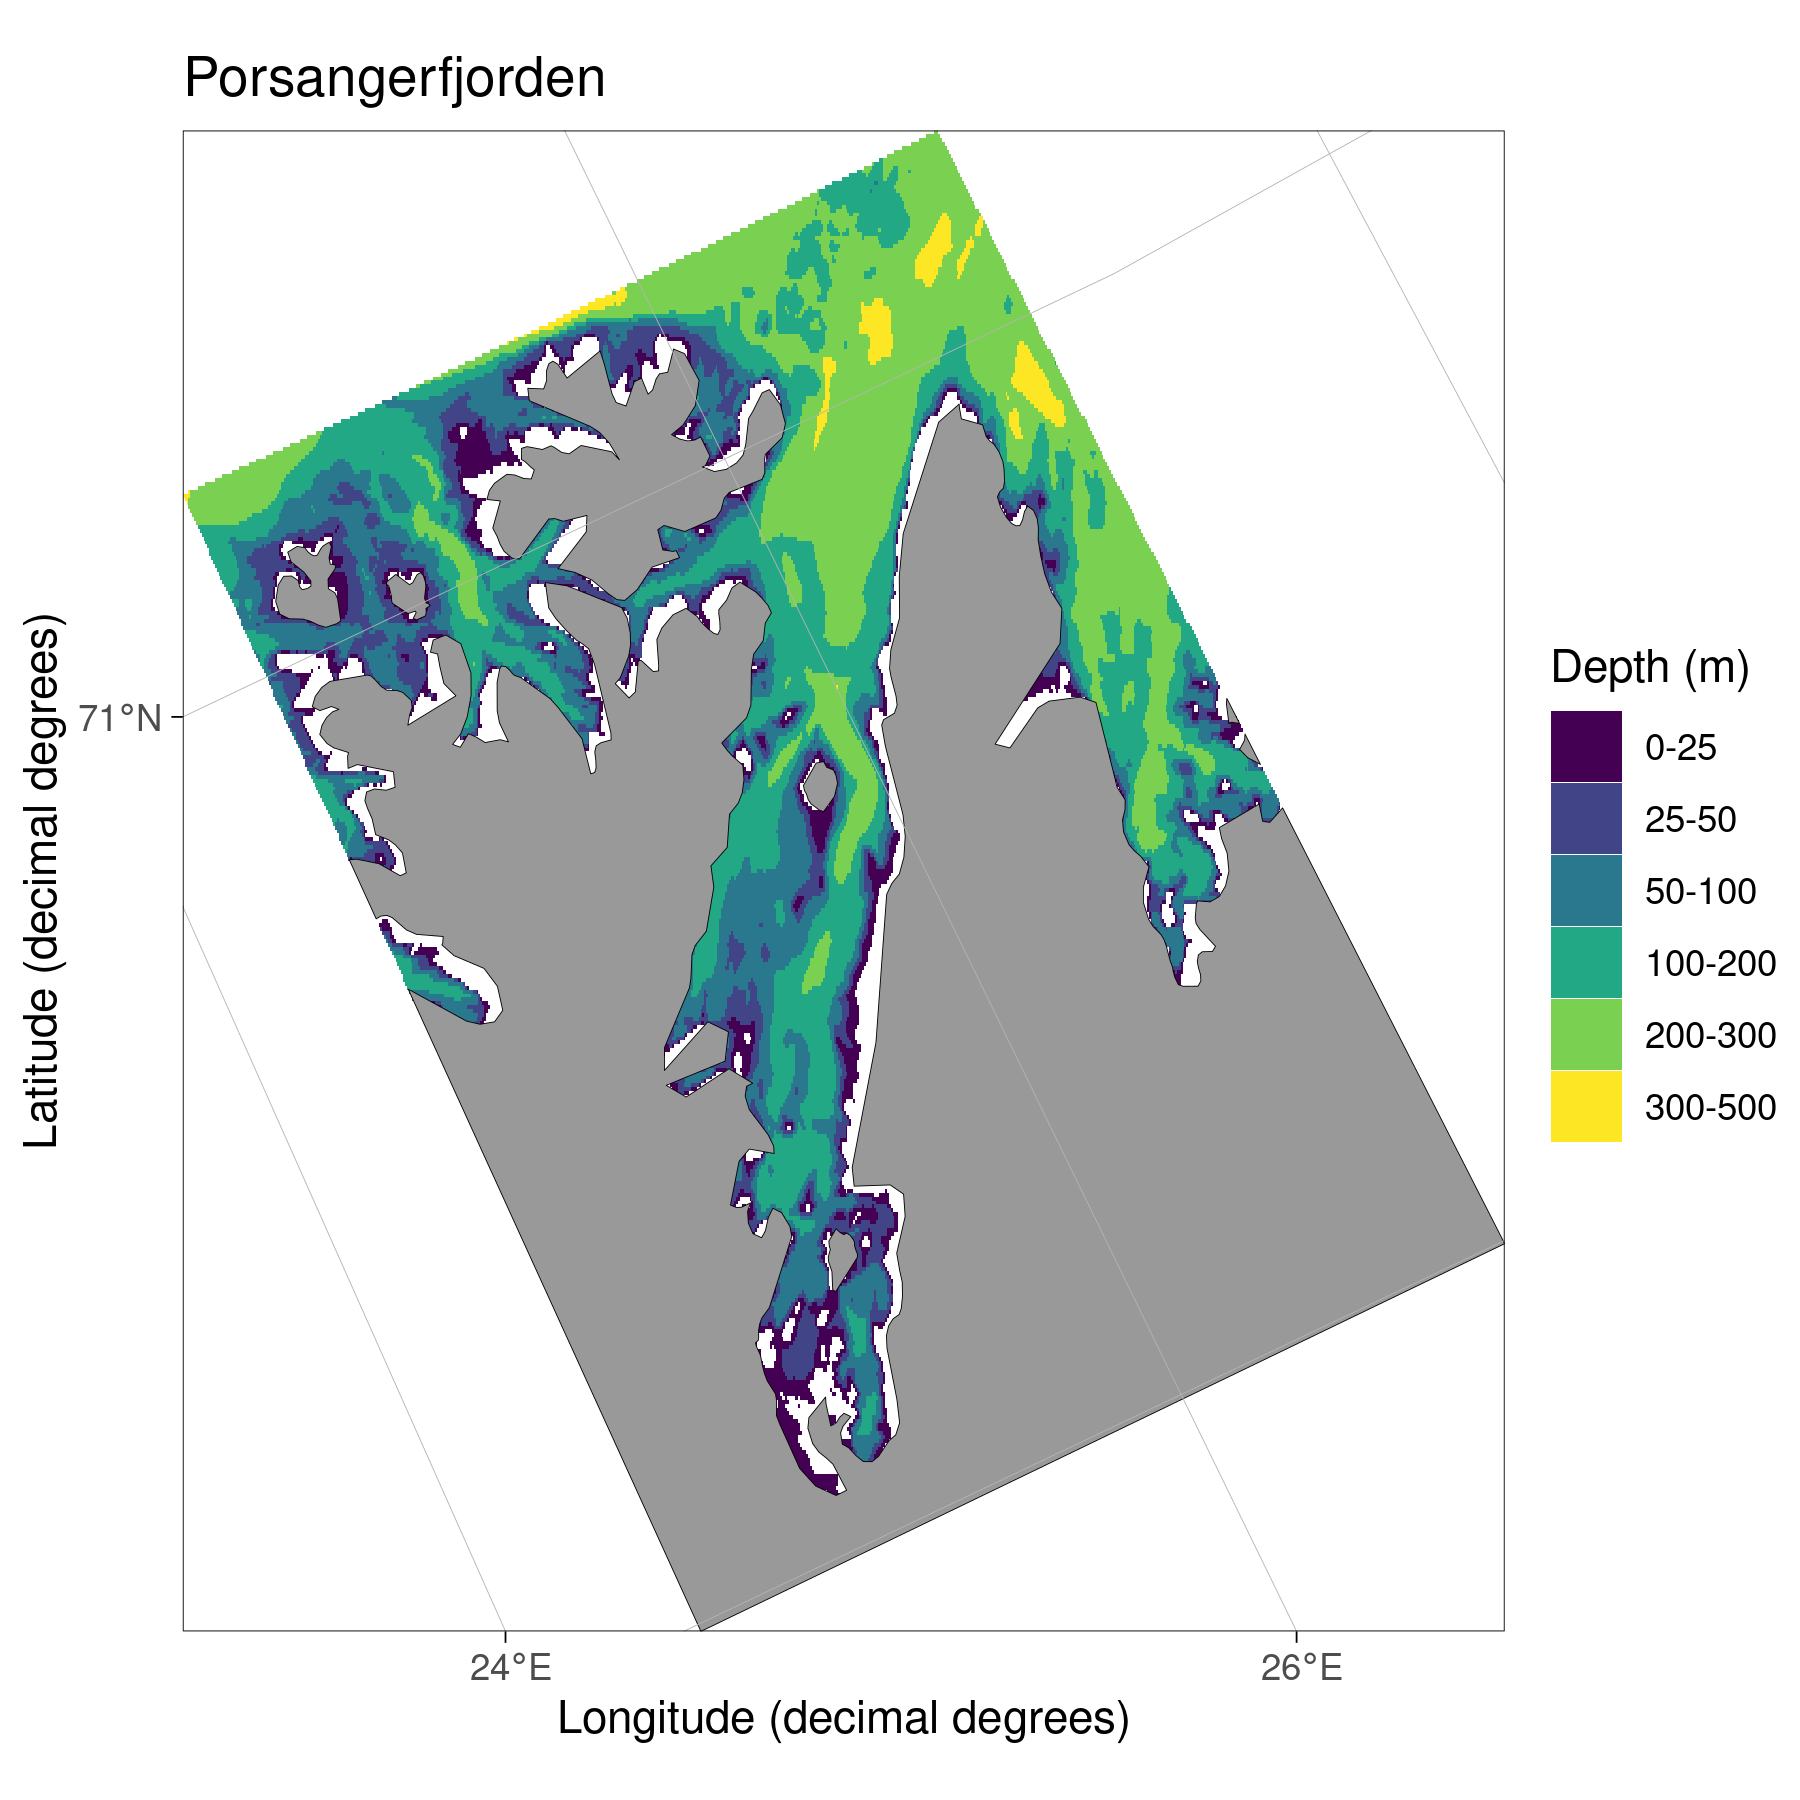
Porsangerfjorden
References
R version 4.0.4 (2021-02-15)
Platform: x86_64-pc-linux-gnu (64-bit)
Running under: Ubuntu 20.04.2 LTS

Matrix products: default
BLAS:   /usr/lib/x86_64-linux-gnu/blas/libblas.so.3.9.0
LAPACK: /usr/lib/x86_64-linux-gnu/lapack/liblapack.so.3.9.0

locale:
 [1] LC_CTYPE=en_GB.UTF-8       LC_NUMERIC=C
 [3] LC_TIME=en_CA.UTF-8        LC_COLLATE=en_GB.UTF-8
 [5] LC_MONETARY=en_CA.UTF-8    LC_MESSAGES=en_GB.UTF-8
 [7] LC_PAPER=en_CA.UTF-8       LC_NAME=C
 [9] LC_ADDRESS=C               LC_TELEPHONE=C
[11] LC_MEASUREMENT=en_CA.UTF-8 LC_IDENTIFICATION=C

attached base packages:
[1] stats     graphics  grDevices utils     datasets  methods   base

other attached packages:
 [1] kableExtra_1.3.4 DT_0.17          tidync_0.2.4     forcats_0.5.1
 [5] stringr_1.4.0    dplyr_1.0.4      purrr_0.3.4      readr_1.4.0
 [9] tidyr_1.1.2      tibble_3.1.0     ggplot2_3.3.3    tidyverse_1.3.0

loaded via a namespace (and not attached):
 [1] Rcpp_1.0.6        svglite_2.0.0     lubridate_1.7.9.2 assertthat_0.2.1
 [5] rprojroot_2.0.2   digest_0.6.27     utf8_1.1.4        R6_2.5.0
 [9] cellranger_1.1.0  backports_1.2.1   reprex_1.0.0      evaluate_0.14
[13] highr_0.8         httr_1.4.2        pillar_1.5.0      rlang_0.4.10
[17] readxl_1.3.1      ncmeta_0.3.0      rstudioapi_0.13   whisker_0.4
[21] jquerylib_0.1.3   rmarkdown_2.7     webshot_0.5.2     htmlwidgets_1.5.3
[25] munsell_0.5.0     broom_0.7.5       compiler_4.0.4    httpuv_1.5.5
[29] modelr_0.1.8      xfun_0.21         systemfonts_1.0.1 pkgconfig_2.0.3
[33] htmltools_0.5.1.1 tidyselect_1.1.0  workflowr_1.6.2   viridisLite_0.3.0
[37] fansi_0.4.2       crayon_1.4.1      dbplyr_2.1.0      withr_2.4.1
[41] later_1.1.0.1     grid_4.0.4        jsonlite_1.7.2    gtable_0.3.0
[45] lifecycle_1.0.0   DBI_1.1.1         git2r_0.28.0      magrittr_2.0.1
[49] scales_1.1.1      ncdf4_1.17        cli_2.3.1         stringi_1.5.3
[53] fs_1.5.0          promises_1.2.0.1  xml2_1.3.2        bslib_0.2.4
[57] ellipsis_0.3.1    generics_0.1.0    vctrs_0.3.6       tools_4.0.4
[61] glue_1.4.2        RNetCDF_2.4-2     crosstalk_1.1.1   hms_1.0.0
[65] yaml_2.2.1        colorspace_2.0-0  rvest_0.3.6       knitr_1.31
[69] haven_2.3.1       sass_0.3.1