Meta-database
Robert Schlegel
01 March 2021
Last updated: 2021-03-01
Checks: 7 0
Knit directory: FACE-IT/
This reproducible R Markdown analysis was created with workflowr (version 1.6.2). The Checks tab describes the reproducibility checks that were applied when the results were created. The Past versions tab lists the development history.
Great! Since the R Markdown file has been committed to the Git repository, you know the exact version of the code that produced these results.
Great job! The global environment was empty. Objects defined in the global environment can affect the analysis in your R Markdown file in unknown ways. For reproduciblity it’s best to always run the code in an empty environment.
The command set.seed(20210216) was run prior to running the code in the R Markdown file. Setting a seed ensures that any results that rely on randomness, e.g. subsampling or permutations, are reproducible.
Great job! Recording the operating system, R version, and package versions is critical for reproducibility.
Nice! There were no cached chunks for this analysis, so you can be confident that you successfully produced the results during this run.
Great job! Using relative paths to the files within your workflowr project makes it easier to run your code on other machines.
Great! You are using Git for version control. Tracking code development and connecting the code version to the results is critical for reproducibility.
The results in this page were generated with repository version e020300. See the Past versions tab to see a history of the changes made to the R Markdown and HTML files.
Note that you need to be careful to ensure that all relevant files for the analysis have been committed to Git prior to generating the results (you can use wflow_publish or wflow_git_commit). workflowr only checks the R Markdown file, but you know if there are other scripts or data files that it depends on. Below is the status of the Git repository when the results were generated:
Ignored files:
    Ignored:    .Rhistory
    Ignored:    .Rproj.user/

Unstaged changes:
    Modified:   analysis/FACE-IT.bib
Note that any generated files, e.g. HTML, png, CSS, etc., are not included in this status report because it is ok for generated content to have uncommitted changes.
These are the previous versions of the repository in which changes were made to the R Markdown (analysis/metadatabase.Rmd) and HTML (docs/metadatabase.html) files. If you’ve configured a remote Git repository (see ?wflow_git_remote), click on the hyperlinks in the table below to view the files as they were in that past version.
| File | Version | Author | Date | Message |
|---|---|---|---|---|
| Rmd | e020300 | robwschlegel | 2021-03-01 | Re-built site. |
| html | e8aab70 | robwschlegel | 2021-03-01 | Build site. |
| Rmd | f8ad72b | robwschlegel | 2021-03-01 | Re-built site. |
| Rmd | 665719d | robwschlegel | 2021-03-01 | Scraping convoluted date meta-data logic chain |
| Rmd | 21aed26 | robwschlegel | 2021-03-01 | Playing with meta-data function |
| html | 6c2110f | robwschlegel | 2021-03-01 | Build site. |
| Rmd | 5d4b15e | robwschlegel | 2021-03-01 | Re-built site. |
| html | 3a30630 | robwschlegel | 2021-03-01 | Build site. |
| Rmd | 9d46384 | robwschlegel | 2021-03-01 | Re-built site. |
| html | 3fd74f7 | robwschlegel | 2021-03-01 | Build site. |
| Rmd | 7d2db83 | robwschlegel | 2021-03-01 | Re-built site. |
| Rmd | 7ff8d63 | robwschlegel | 2021-03-01 | More work on metadatabase |
| html | 7ff8d63 | robwschlegel | 2021-03-01 | More work on metadatabase |
| html | 6b2f047 | robwschlegel | 2021-02-24 | Build site. |
| Rmd | 3e8114e | robwschlegel | 2021-02-24 | Re-built site. |
| Rmd | c38a8d3 | robwschlegel | 2021-02-19 | More minor changes |
| html | 9f9385e | robwschlegel | 2021-02-19 | Build site. |
| Rmd | 93d152e | robwschlegel | 2021-02-19 | Adjusting file pathways |
| html | 6208900 | robwschlegel | 2021-02-19 | Build site. |
| Rmd | b09fb3f | robwschlegel | 2021-02-19 | Re-built site. |
| html | 51741d5 | robwschlegel | 2021-02-19 | Build site. |
| Rmd | ca063d3 | robwschlegel | 2021-02-19 | Re-built site. |
| html | 849da96 | robwschlegel | 2021-02-19 | Build site. |
| Rmd | c5e635e | robwschlegel | 2021-02-19 | Re-built site. |
| html | ee3511e | robwschlegel | 2021-02-18 | Build site. |
| html | 04d996a | robwschlegel | 2021-02-18 | Build site. |
| html | c3a8a72 | robwschlegel | 2021-02-18 | Build site. |
| html | 3992686 | robwschlegel | 2021-02-18 | Build site. |
| Rmd | f9244d5 | Robert | 2021-02-17 | Re-built site. |
| Rmd | bd0919b | robwschlegel | 2021-02-16 | The metadatabase Rmd file |
Introduction
This document is designed to satisfy both D1.1 and D1.2 for the Horizon2020 project “FACE-IT.” The text in this document is a report on the key drivers of changes in Arctic biodiversity (D1.1). The tables contain the meta-database for the data identified as key drivers of change (D1.2). The text and meta-data from this document will be used for the completion of a review article on past and future changes of key drivers in and around the FACE-IT study sites (D1.3). We begin with a review of known drivers of change in the Arctic before focussing in on each individual FACE-IT study site to discuss any differences from the broader Arctic. Within each section a table is given that shows the meta-data for the drivers of change for the topic of that section.
European Arctic
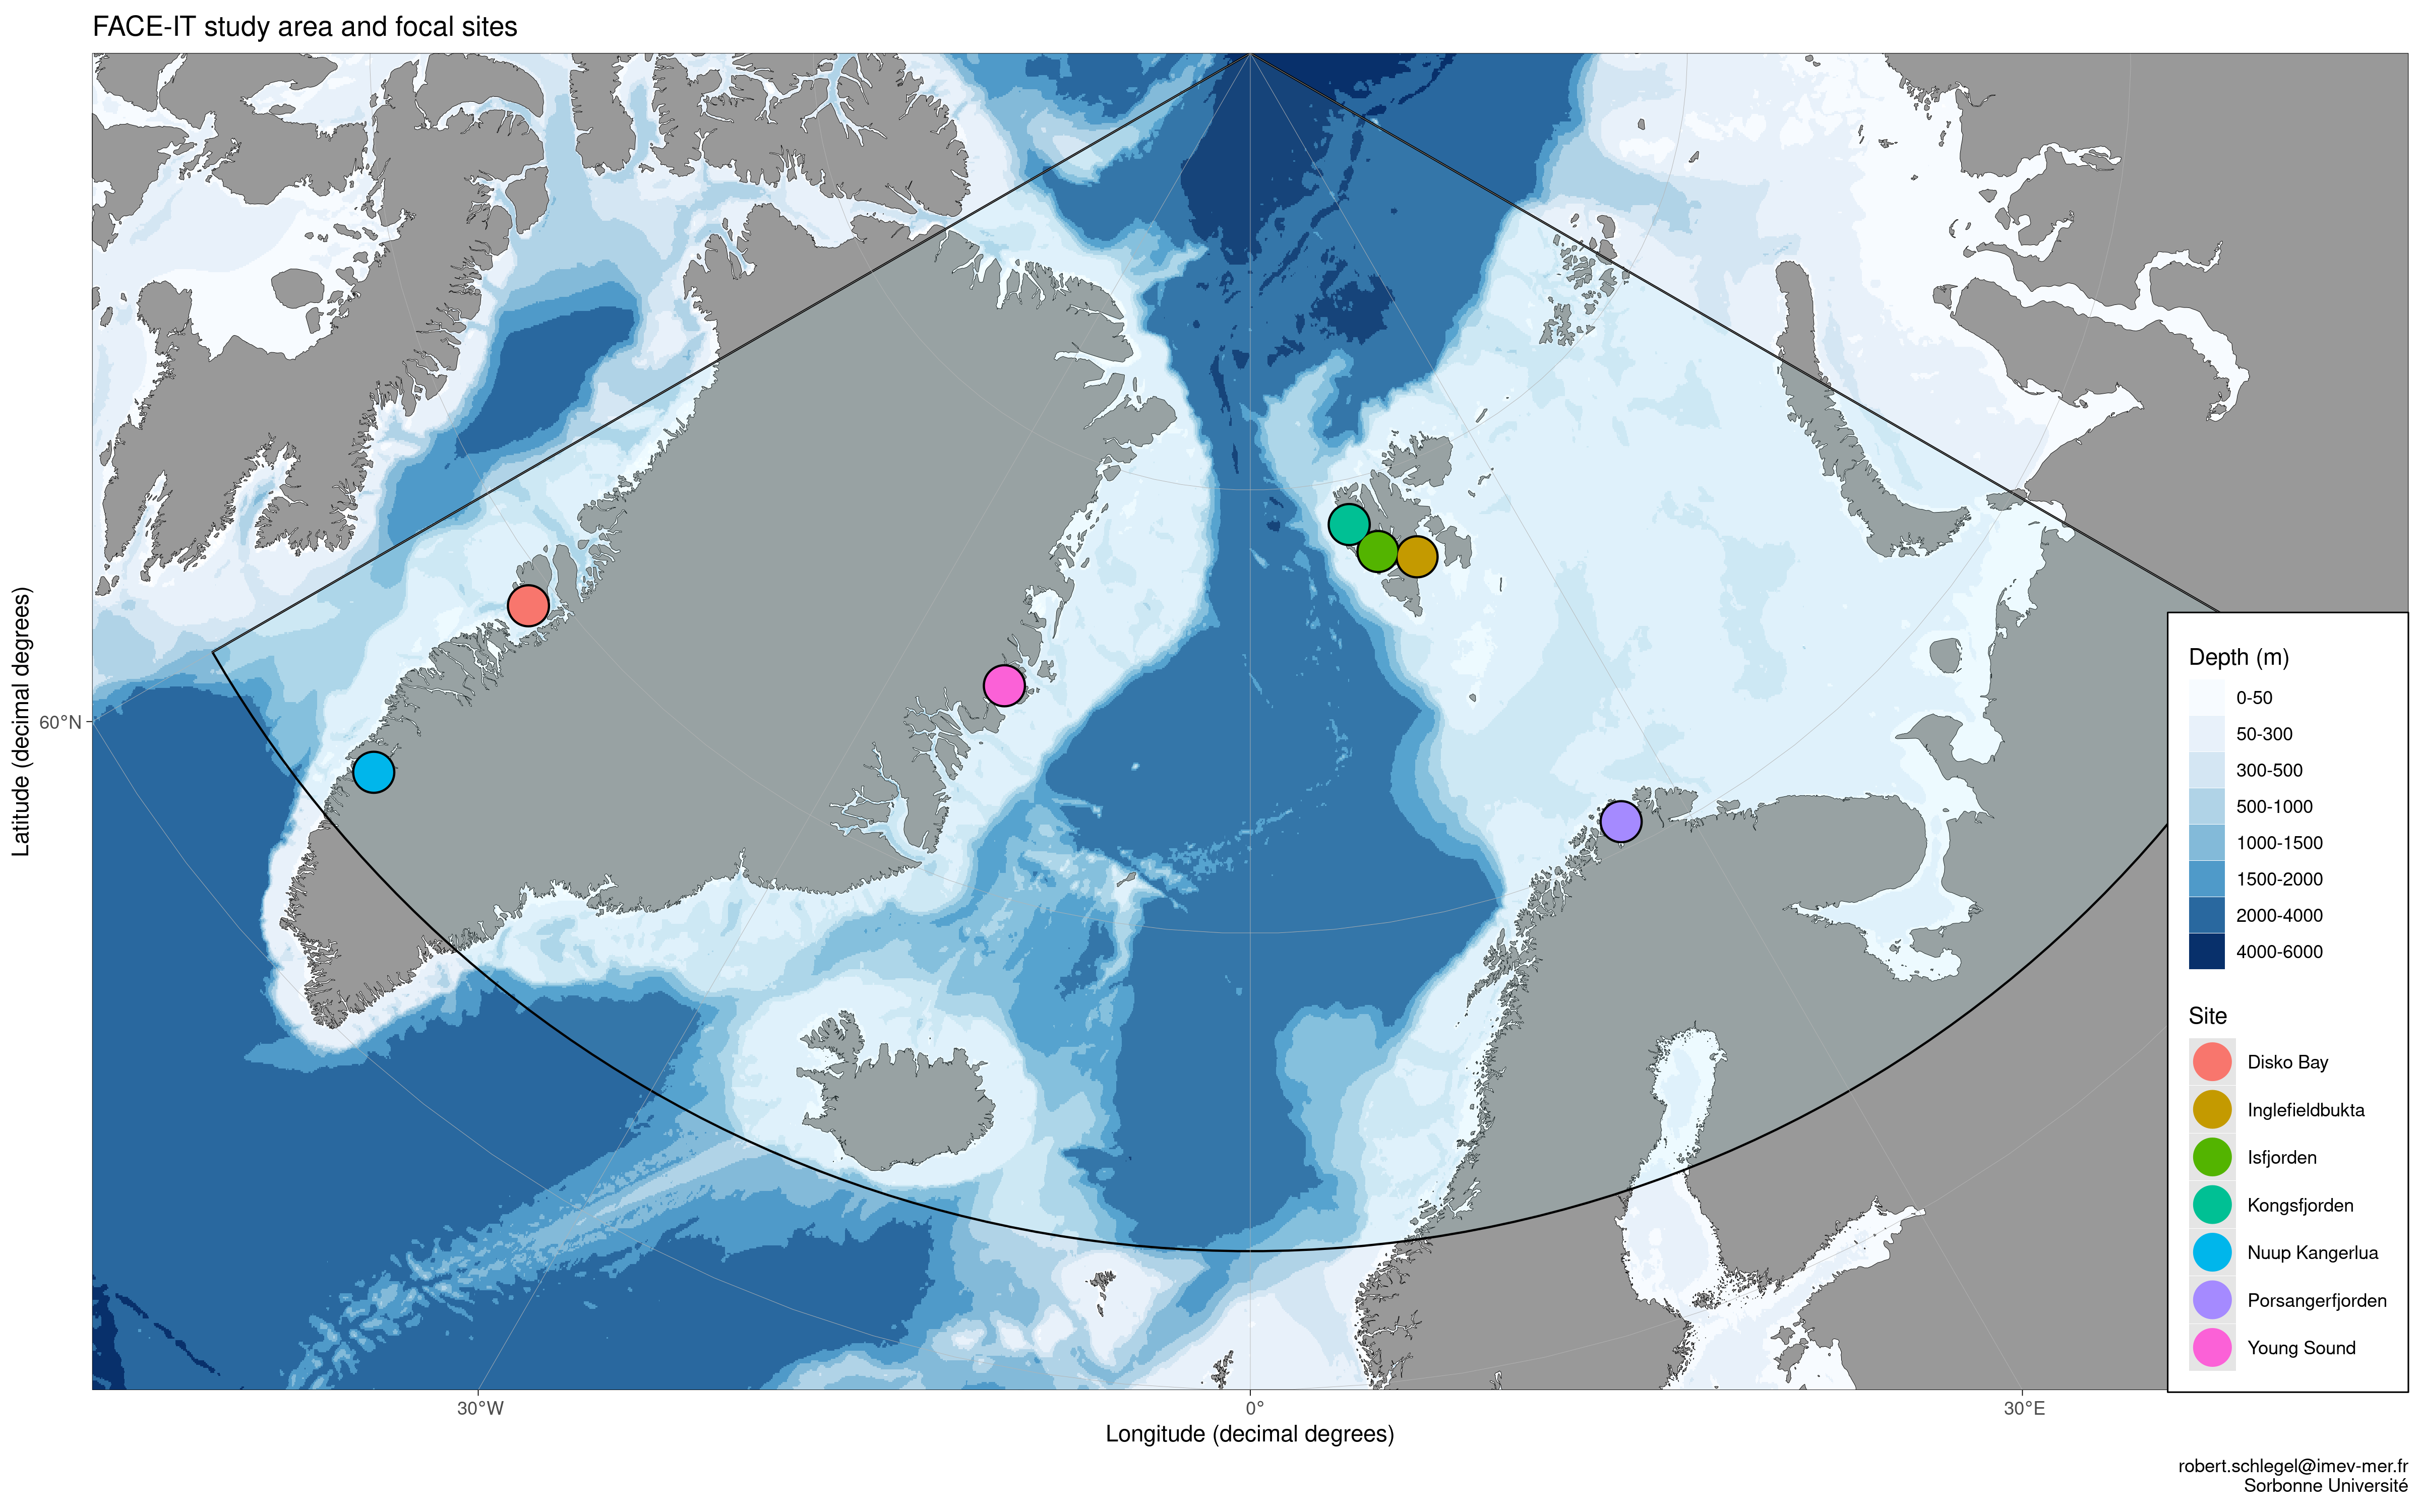
Many physical processes are known to drive biodiversity in the Arctic. Unsurprisingly, the presence of sea ice is one of these controlling factors (Pavlova et al. (2019)). The cryosphere, of which sea ice is a part, is one of the defining characteristics of the Arctic that sets it apart from neighbouring climatic regions (e.g. boreal and cold temperate). It is therefore safe to assume that changes to the Arctic cryosphere will lead to fundamental changes in the biodiversity found there. The cryosphere itself however is not the primary driver of change in the Arctic. This is because changes in the cryosphere are themselves being driven by the primary driver of climatic change that defines the anthropocene: increases in CO2 emissions that are primarily responsible for global increases in temperature. It is this relatively rapid increase in temperature that is having a profound effect on the Arctic cryosphere (Meredith et al. (2019)). Therefore, as with almost any study of biodiversity, high-quality spatiotemporally complete temperature data are crucial. The longer the complete time series the better.
There are however many more important variables to consider, such as photosynthetically available radiation (PAR), ultraviolet radiation (UVR), and turbidity (Hop and Wiencke (2019)). Many of these important drivers are known from research conducted further south. Where datasets are easier to build, and time series are longer. For this reason one may find that the drivers of change in Arctic are more often inferred than they are ‘known.’ This is because historically there has been a paucity of data in the Arctic (Bischof et al. (2019b)). Many international projects, in coordination with many established Arctic research institutions, have been very busy to close this knowledge gap and the holes in our knowledge are being filled rapidly. FACE-IT is one of these projects that seeks to better understand biodiversity changes, while contributing to and drawing from this expanding body of knowledge.
In addition to knowing what it is that may cause changes, it is necessary to identify the fonts of biodiversity that may be affected by these drivers. There are many taxa/species etc. that have been identified as important for monitoring throughout the Arctic. Foremost of these are the kelps, brown macroalgae that often function as ecosystem engineers along the cool temperate coastlines of the world or cooler (Bischof et al. (2019a)). The prevailing hypothesis is that as the Arctic warms, the retreating coastal sea ice and increased temperatures will be more hospitable to kelp forests, and everything that comes with them. But there’s a catch. As temperatures warm, glaciers melt more rapidly, releasing more runoff into coastal zones that increases turbidity (Bischof et al. (2019a)). This means that benthic organisms, like kelps, will not receive the levels of PAR that they would like, potentially inhibiting their growth. One benefit of this is that the kelps are exposed to lower levels of UVR, which may help them to some extent. More research and longer time series are required to say conclusively how this situation will play out. It will also differ between sites and so this issue is addressed again below where appropriate.
| Category | Driver |
|---|---|
| Physical | Air temp. |
| Physical | SST |
| Cryosphere | Sea ice |
Svalbard
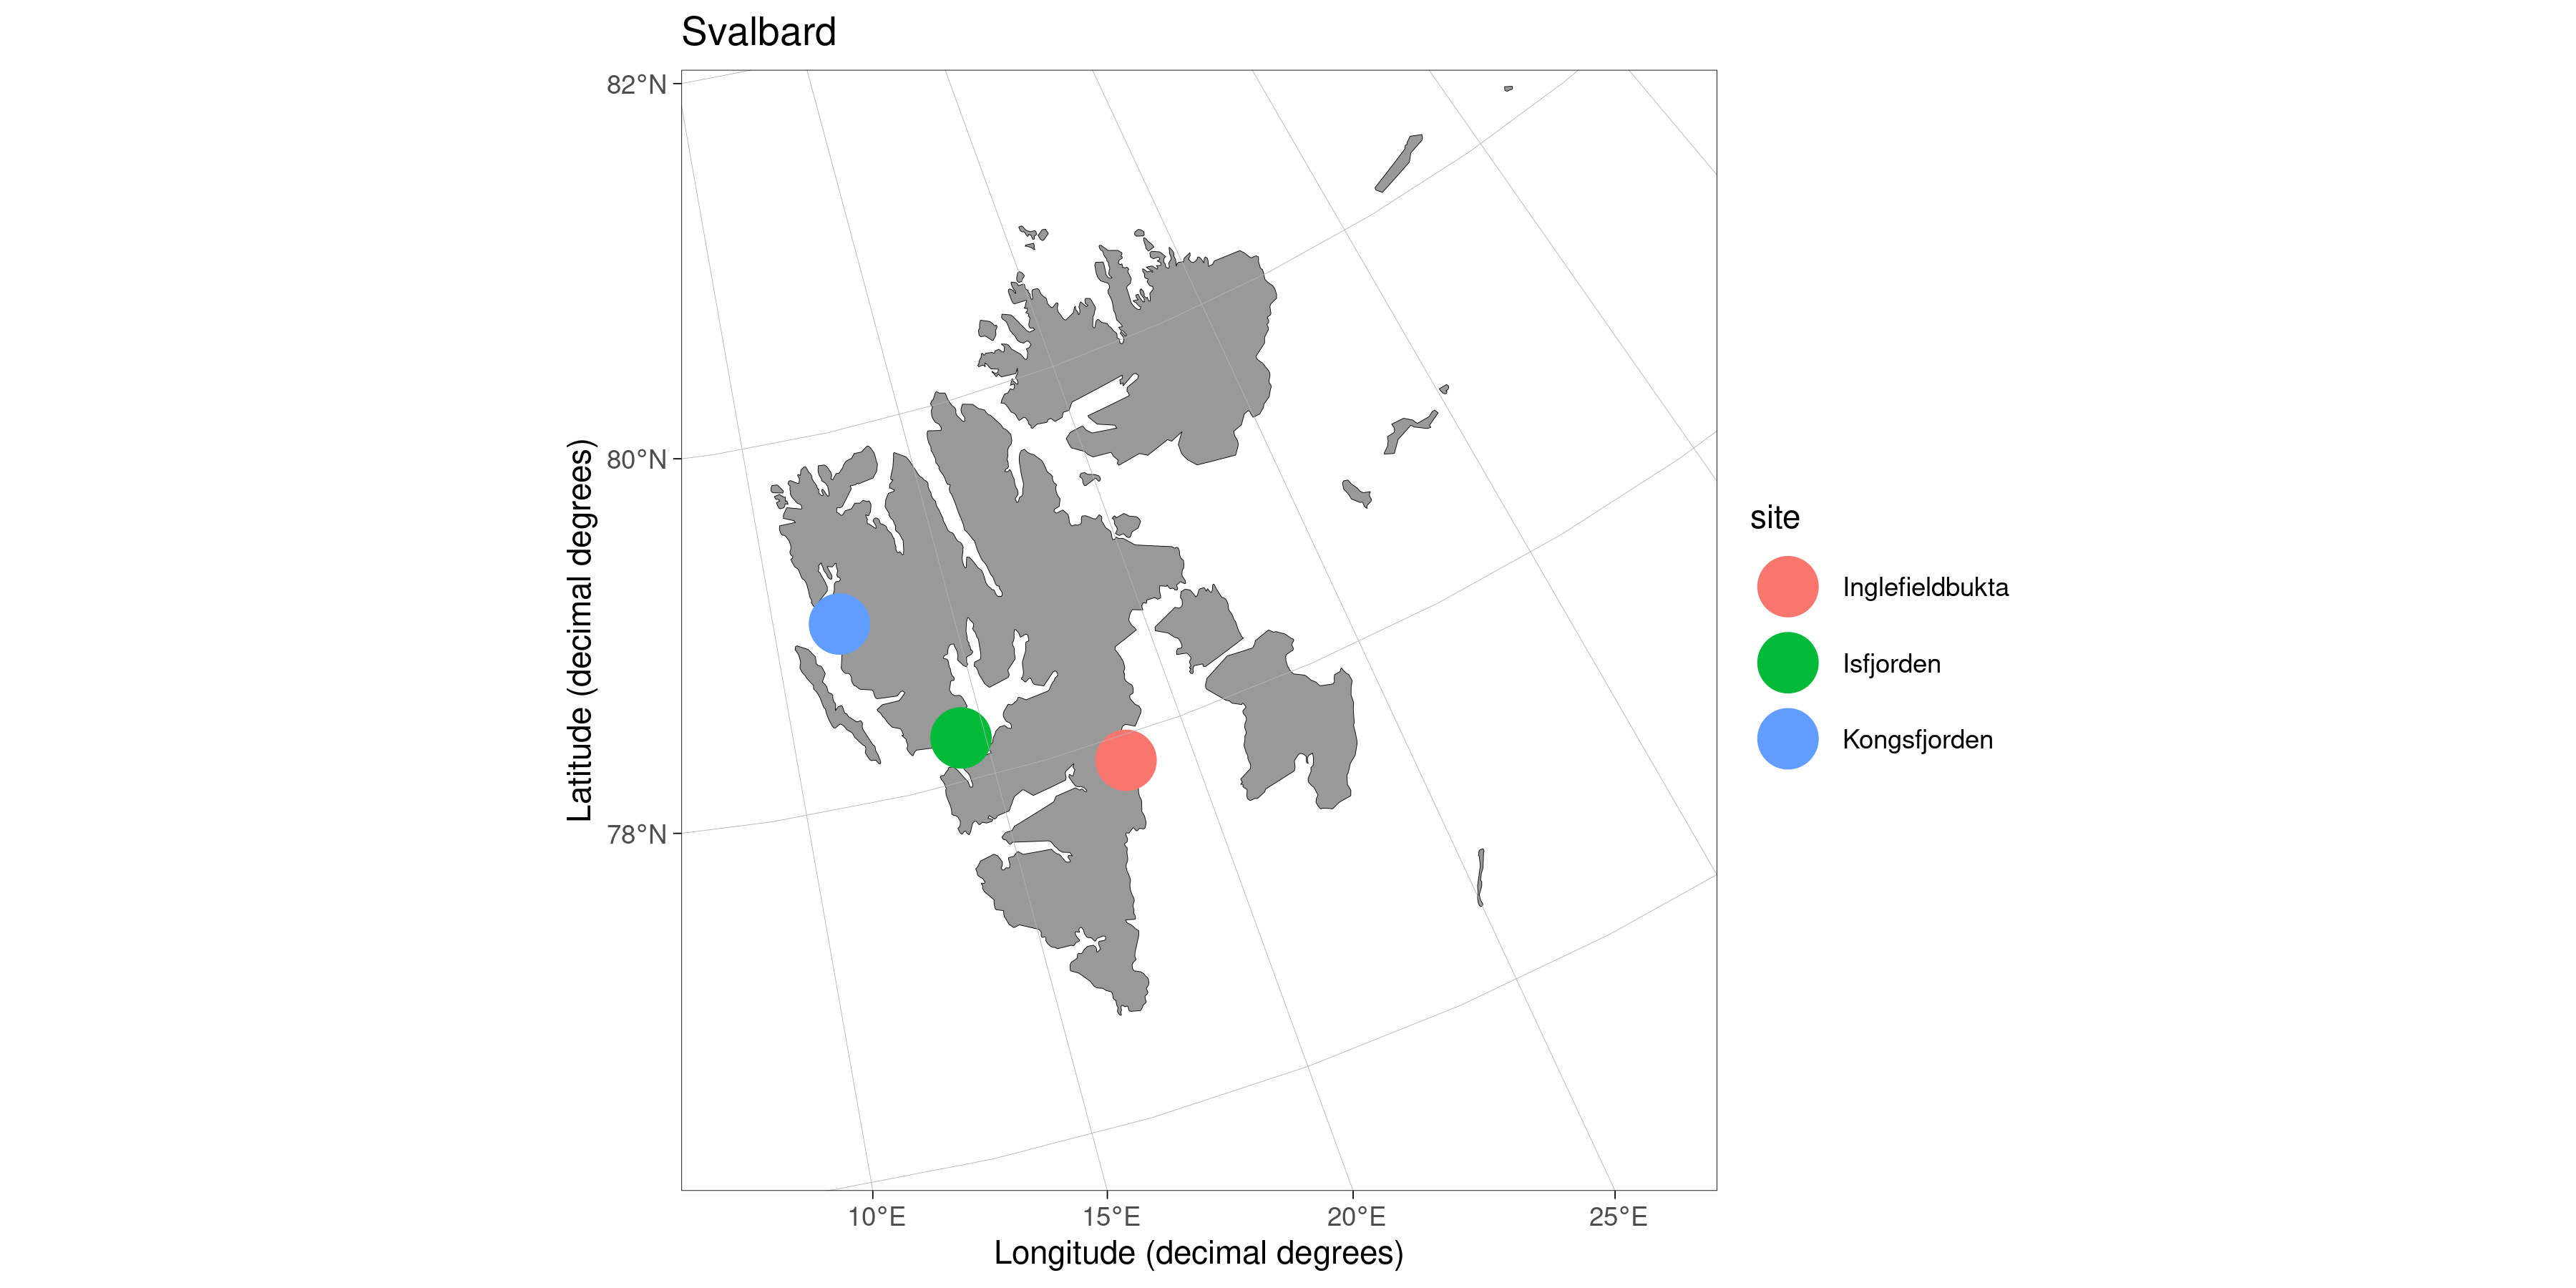
While not a study site itself, there are a lot of studies and data products that focus on Svalbard broadly, rather than individual study sites within this region. Therefore this geographical region
Kongsfjorden
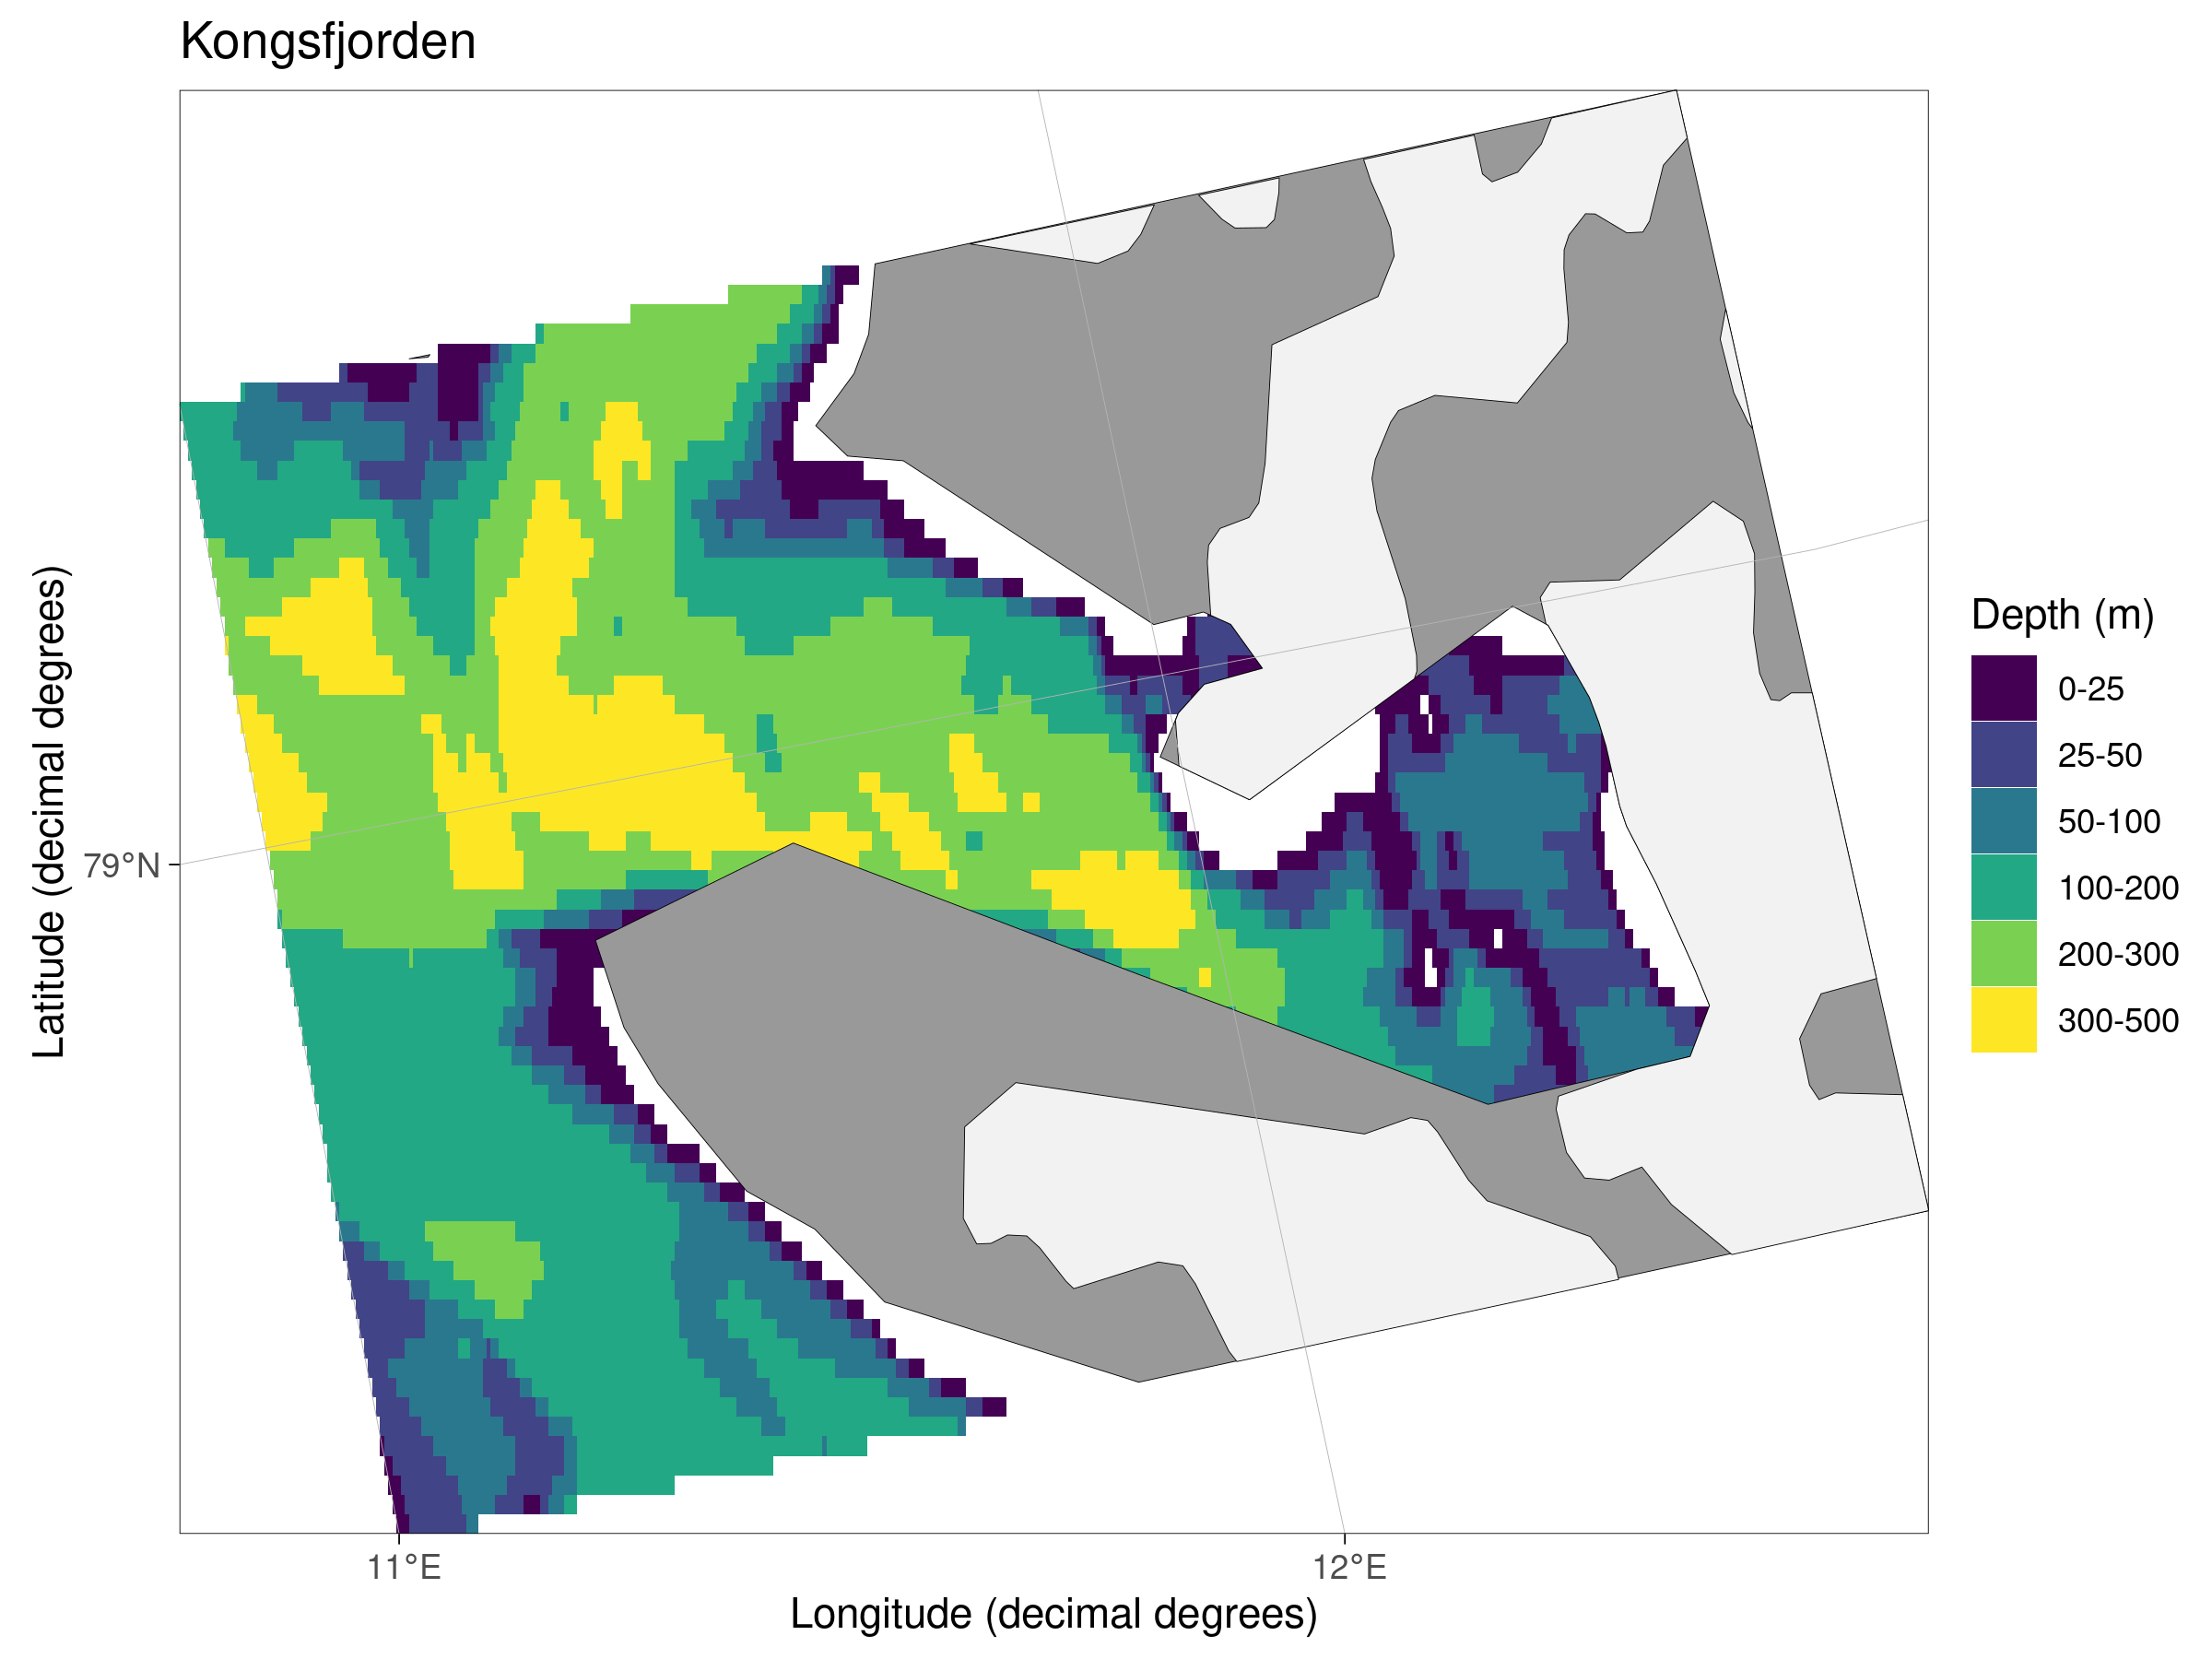
Much of the solar magnetic radiation going towards earth is focussed around Ny Alesund. This can have a knock on effect to air temperature when there are strong auroras: up to 4°C! Unfortunately models currently capture this effect very poorly.
Land terminating glaciers around Kongsfjorden have been retreating linearly over the last decades. Water terminating glaciers retreat less linearly as there are occasions when the water terminating edge may surge forward, making it look like the terminating edge has improved. This is generally due to a destabilisation of the glacier that means an overall decrease in the glacier mass balance. 2020 was a record breaking warm year that has led to record breaking melts. Smaller glaciers are more susceptible to the increase in melt driven by climate change as they have smaller areas to accumulate ice etc. during the cold period of the year.
Up until 2007 the fjord tended to be frozen 100% until February. Since 2007 the fjord has been having less and less surface freezing. This is in part due to Atlantic water encroachment. These waters are higher in aragonite and pH. These are also less turbid, allowing for more light for use with plankton etc. The plankton do respond to this with Atlantic species favoured in warmer years.
As to the influence of light, this has been increasing both due to increased melt and less ice cover throughout the year, in addition to increases in tourism. Besides increases in light pollution, longer times and broader areas of exposed sea surface also allows for a greater accumulation of positive downward heat flux. Of the four heat flux terms, it appears that increases in long wave radiation (Q_lw) over time are the leading cause of change to the cryosphere (Bischof et al. (2019b)). Following this, short wave radiation (Q_sw) is also increasing at a worrying rate, due in part to a decrease in cloud cover over the summer months (Bischof et al. (2019b)).
| Category | Driver |
|---|---|
| Physical | Q_lw |
| Physical | Q_sw |
| Physical | turbidity |
| Cryosphere | Land glacier mass balance |
| Cryoshpere | Runoff |
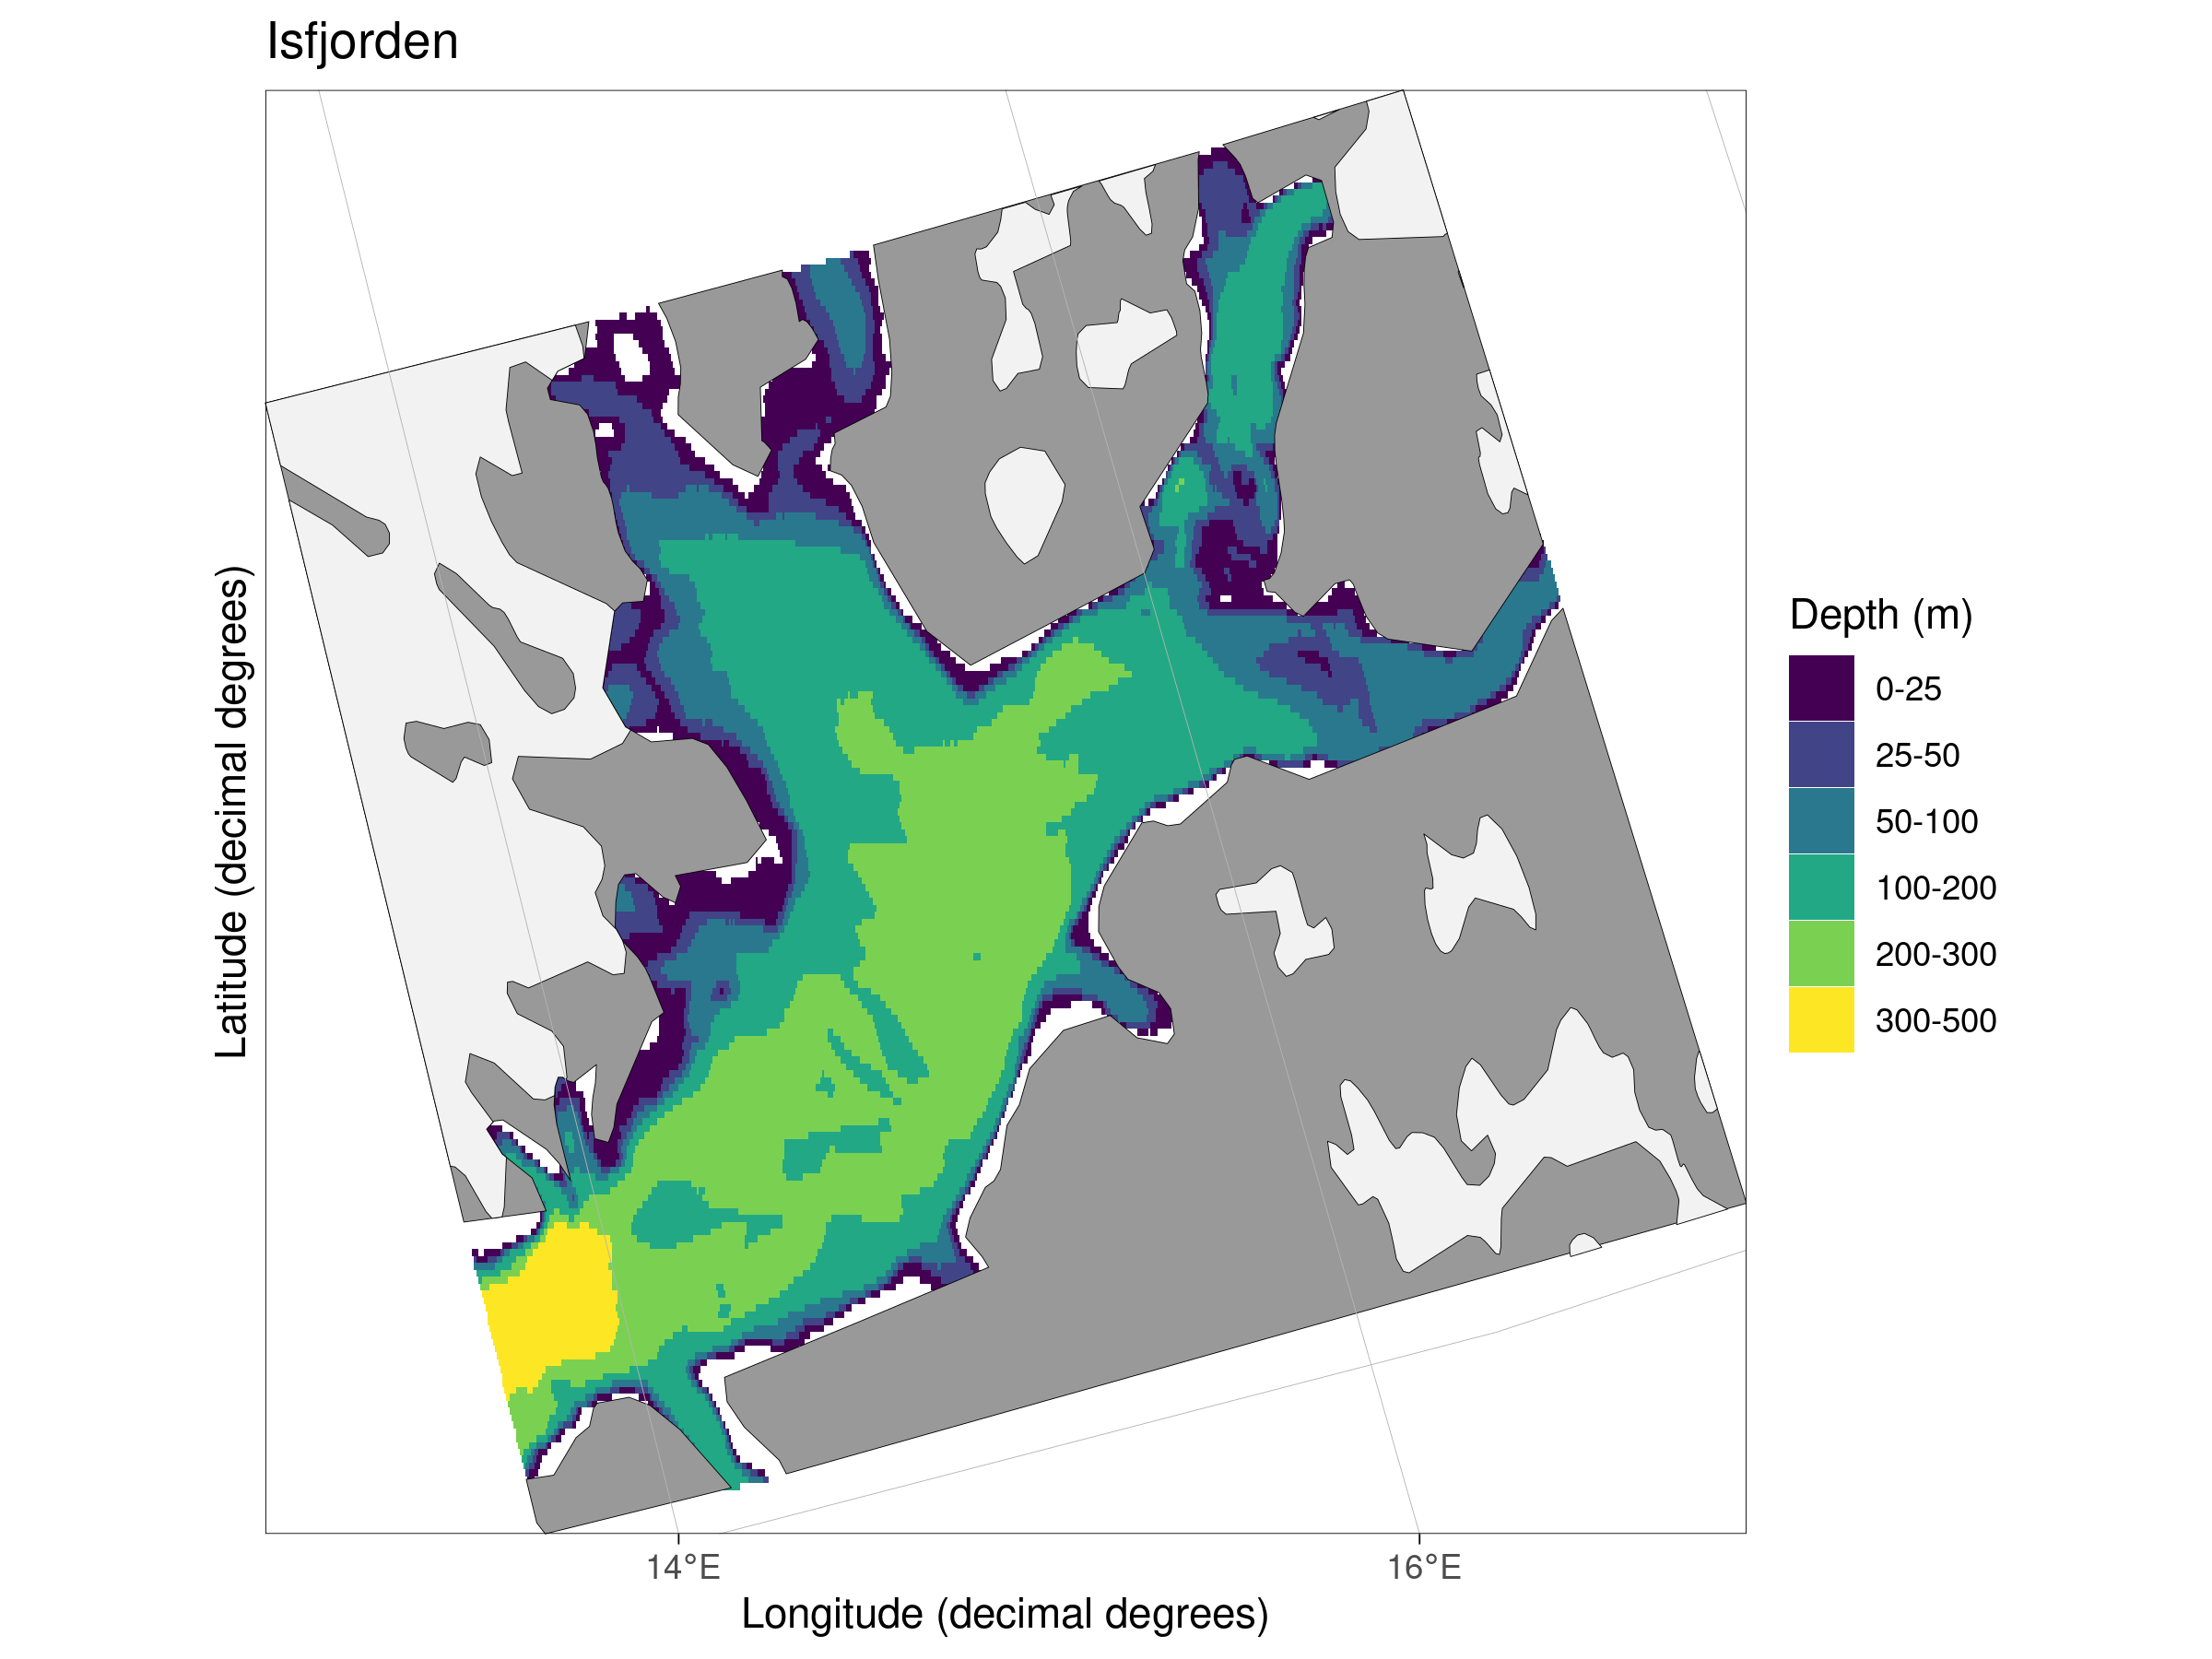
Isfjorden
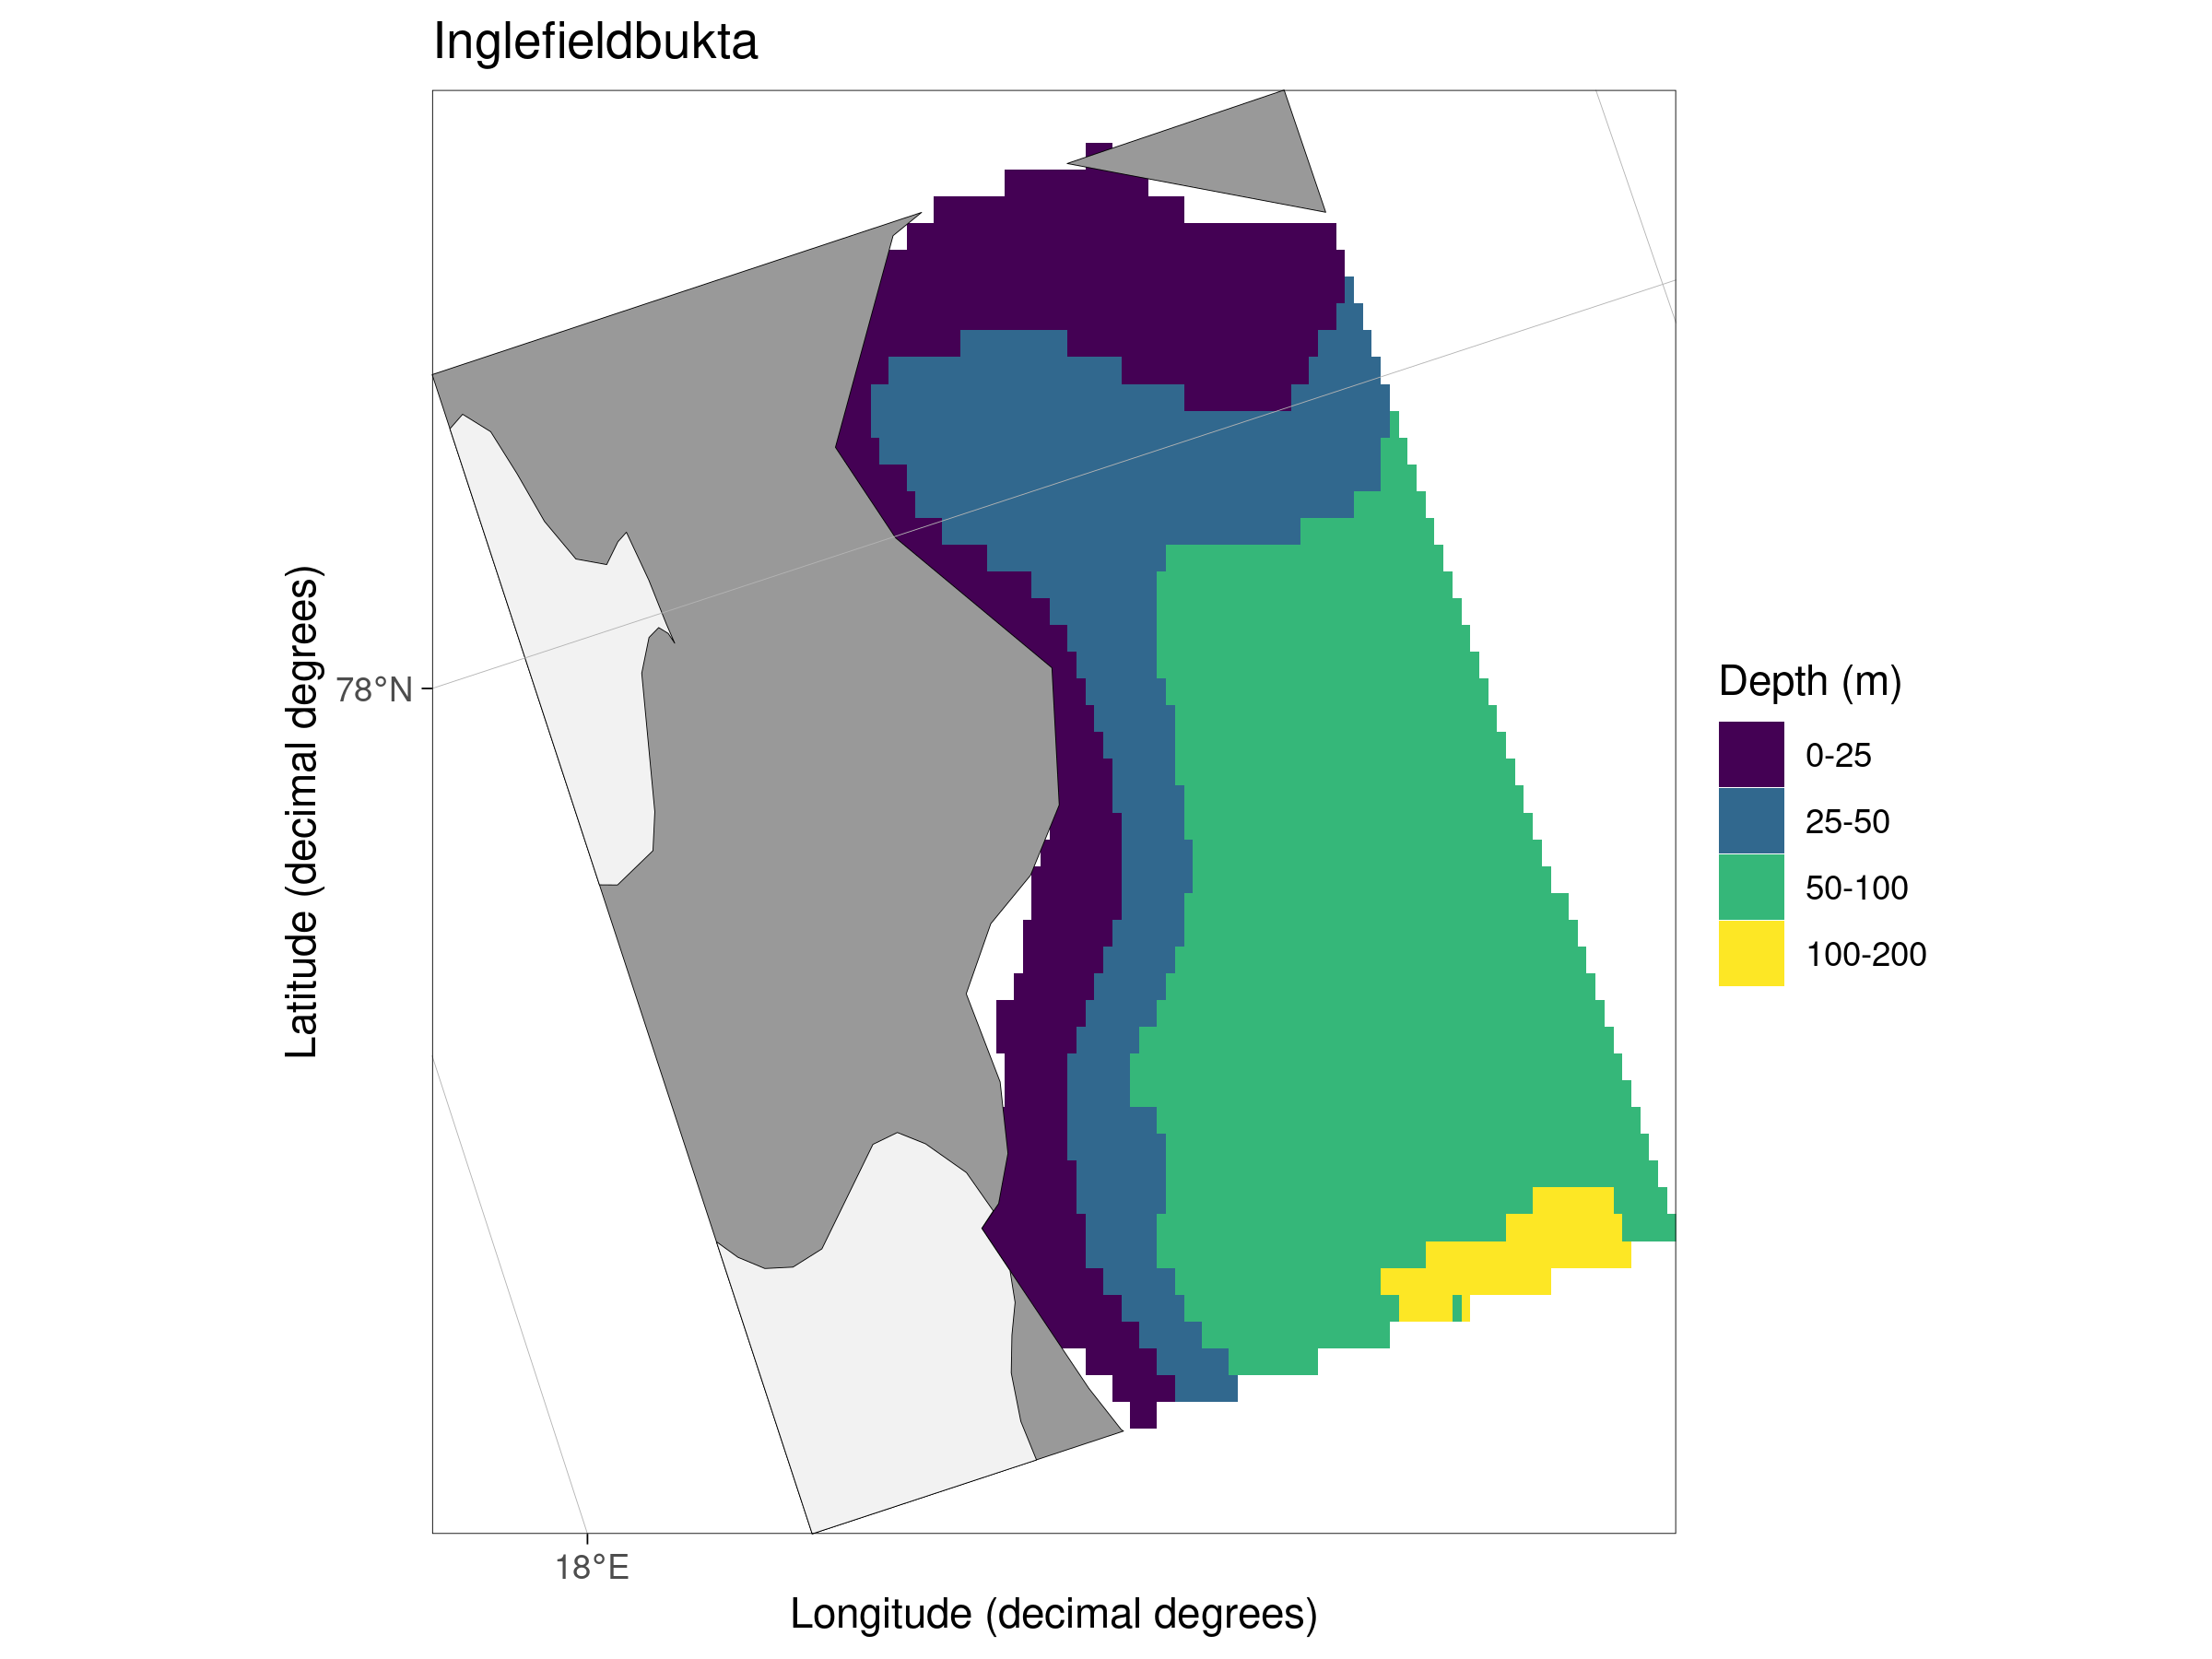
Inglefieldbukta
Greenland
See the EU Arctic figure above for where the Greenland sites are located. They are too spread out to be shown here in a single figure with any better precision than the full study area.
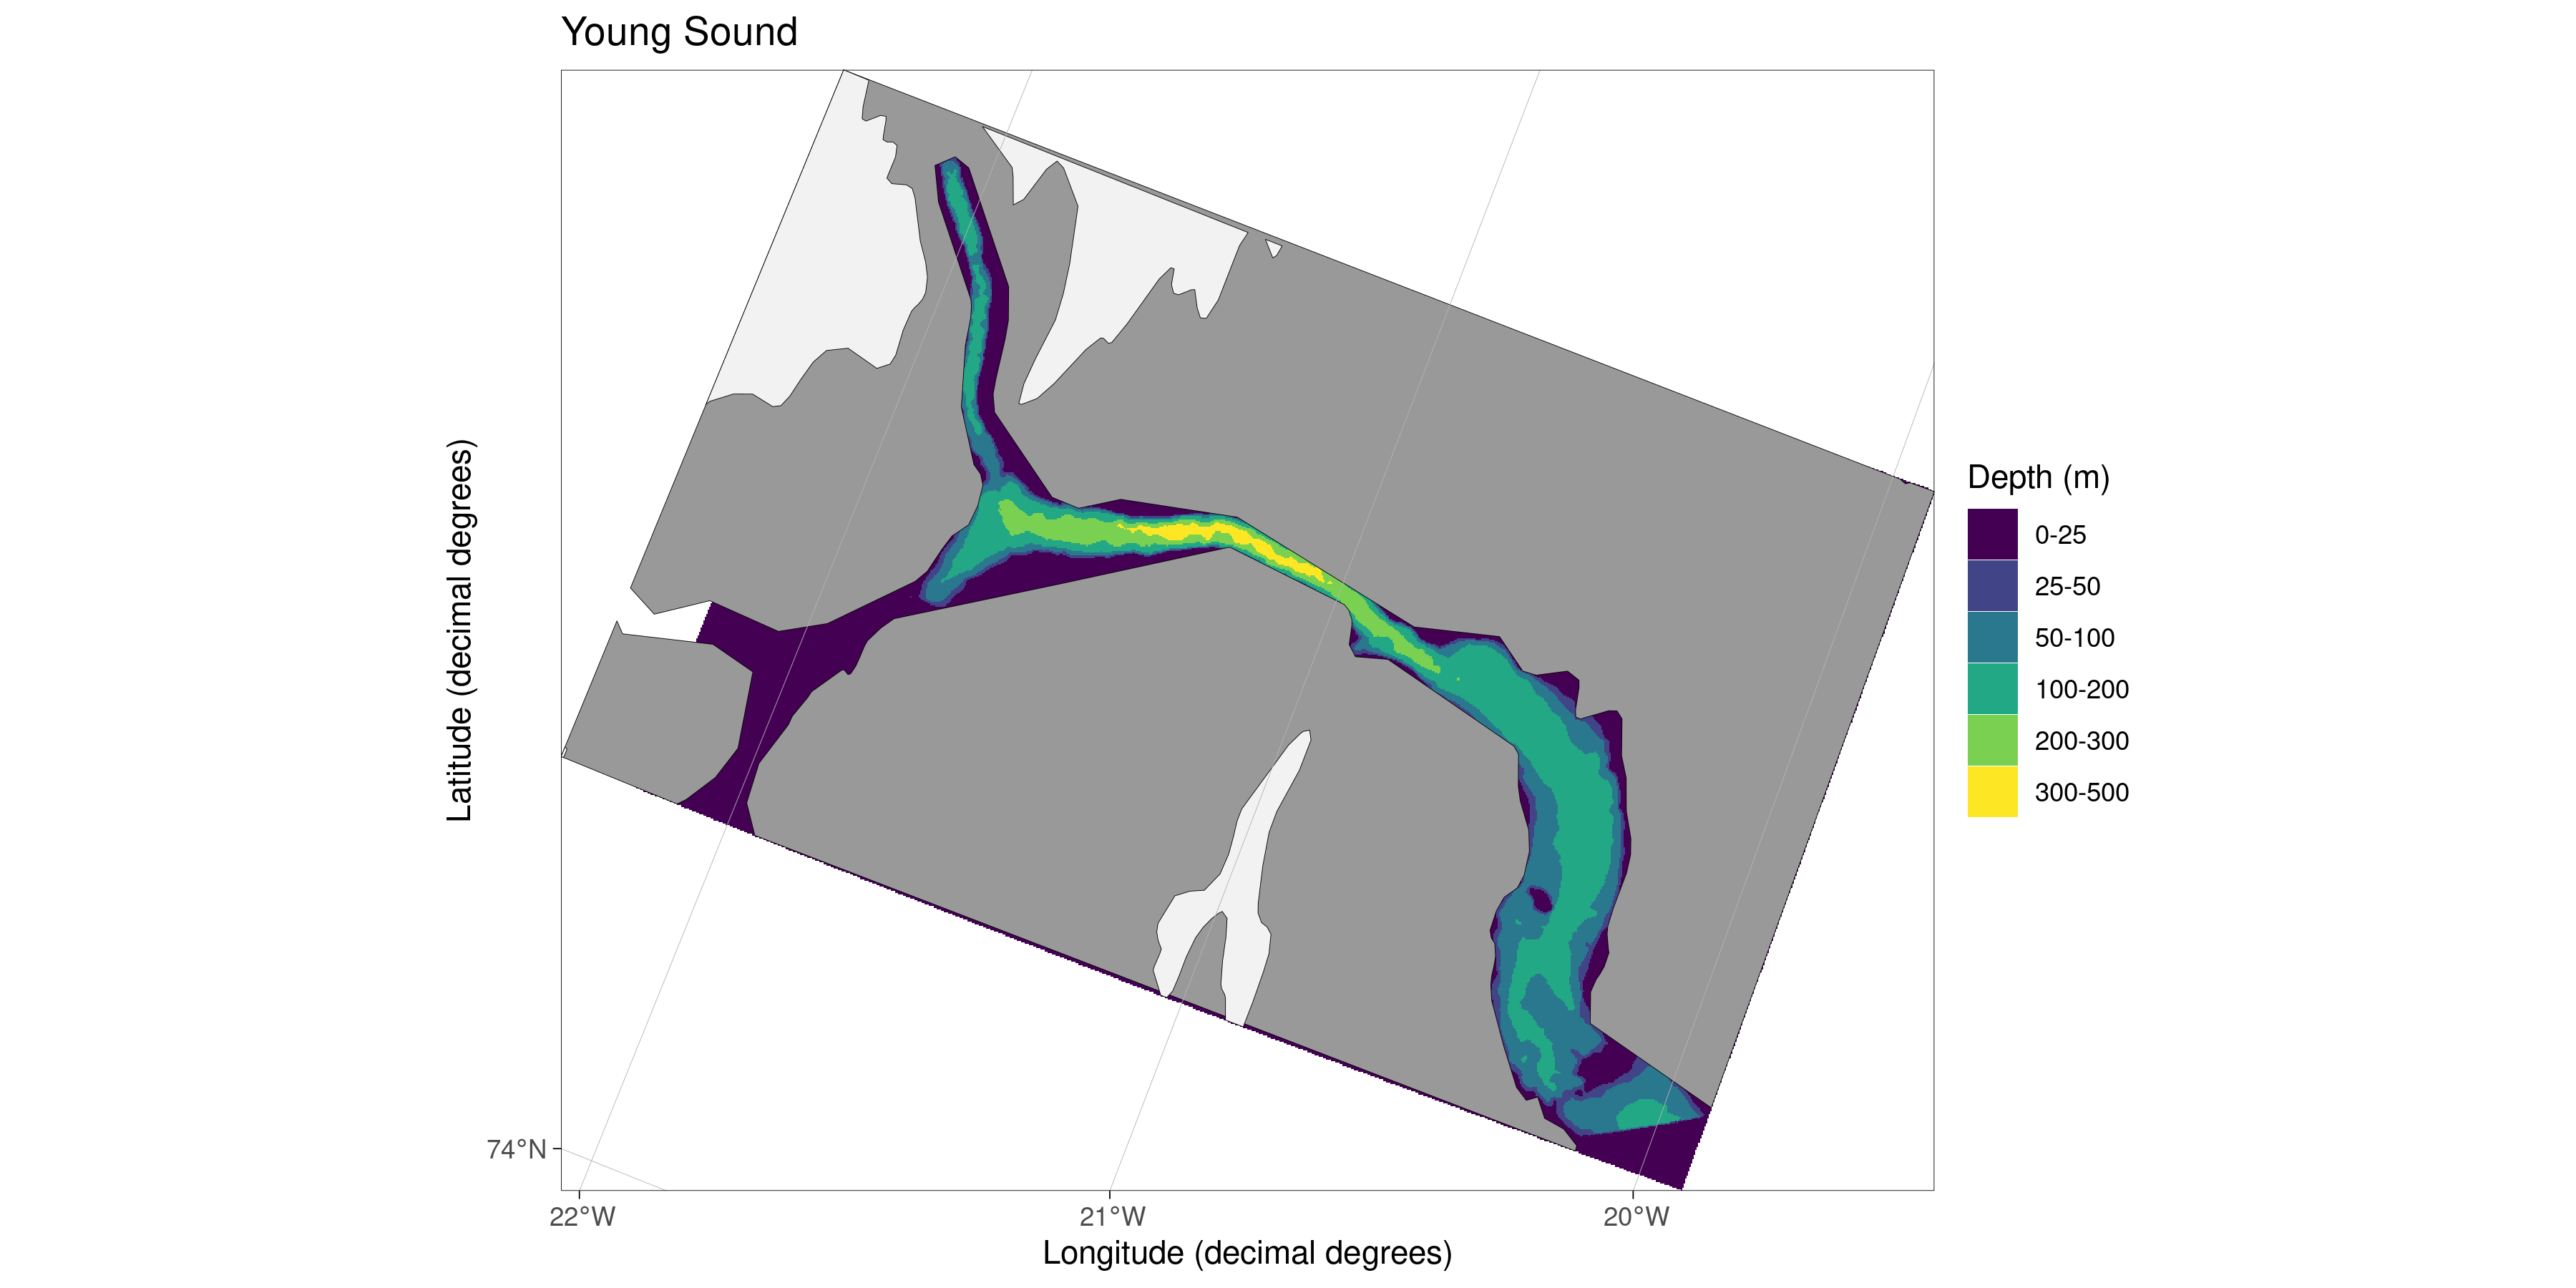
Young Sound
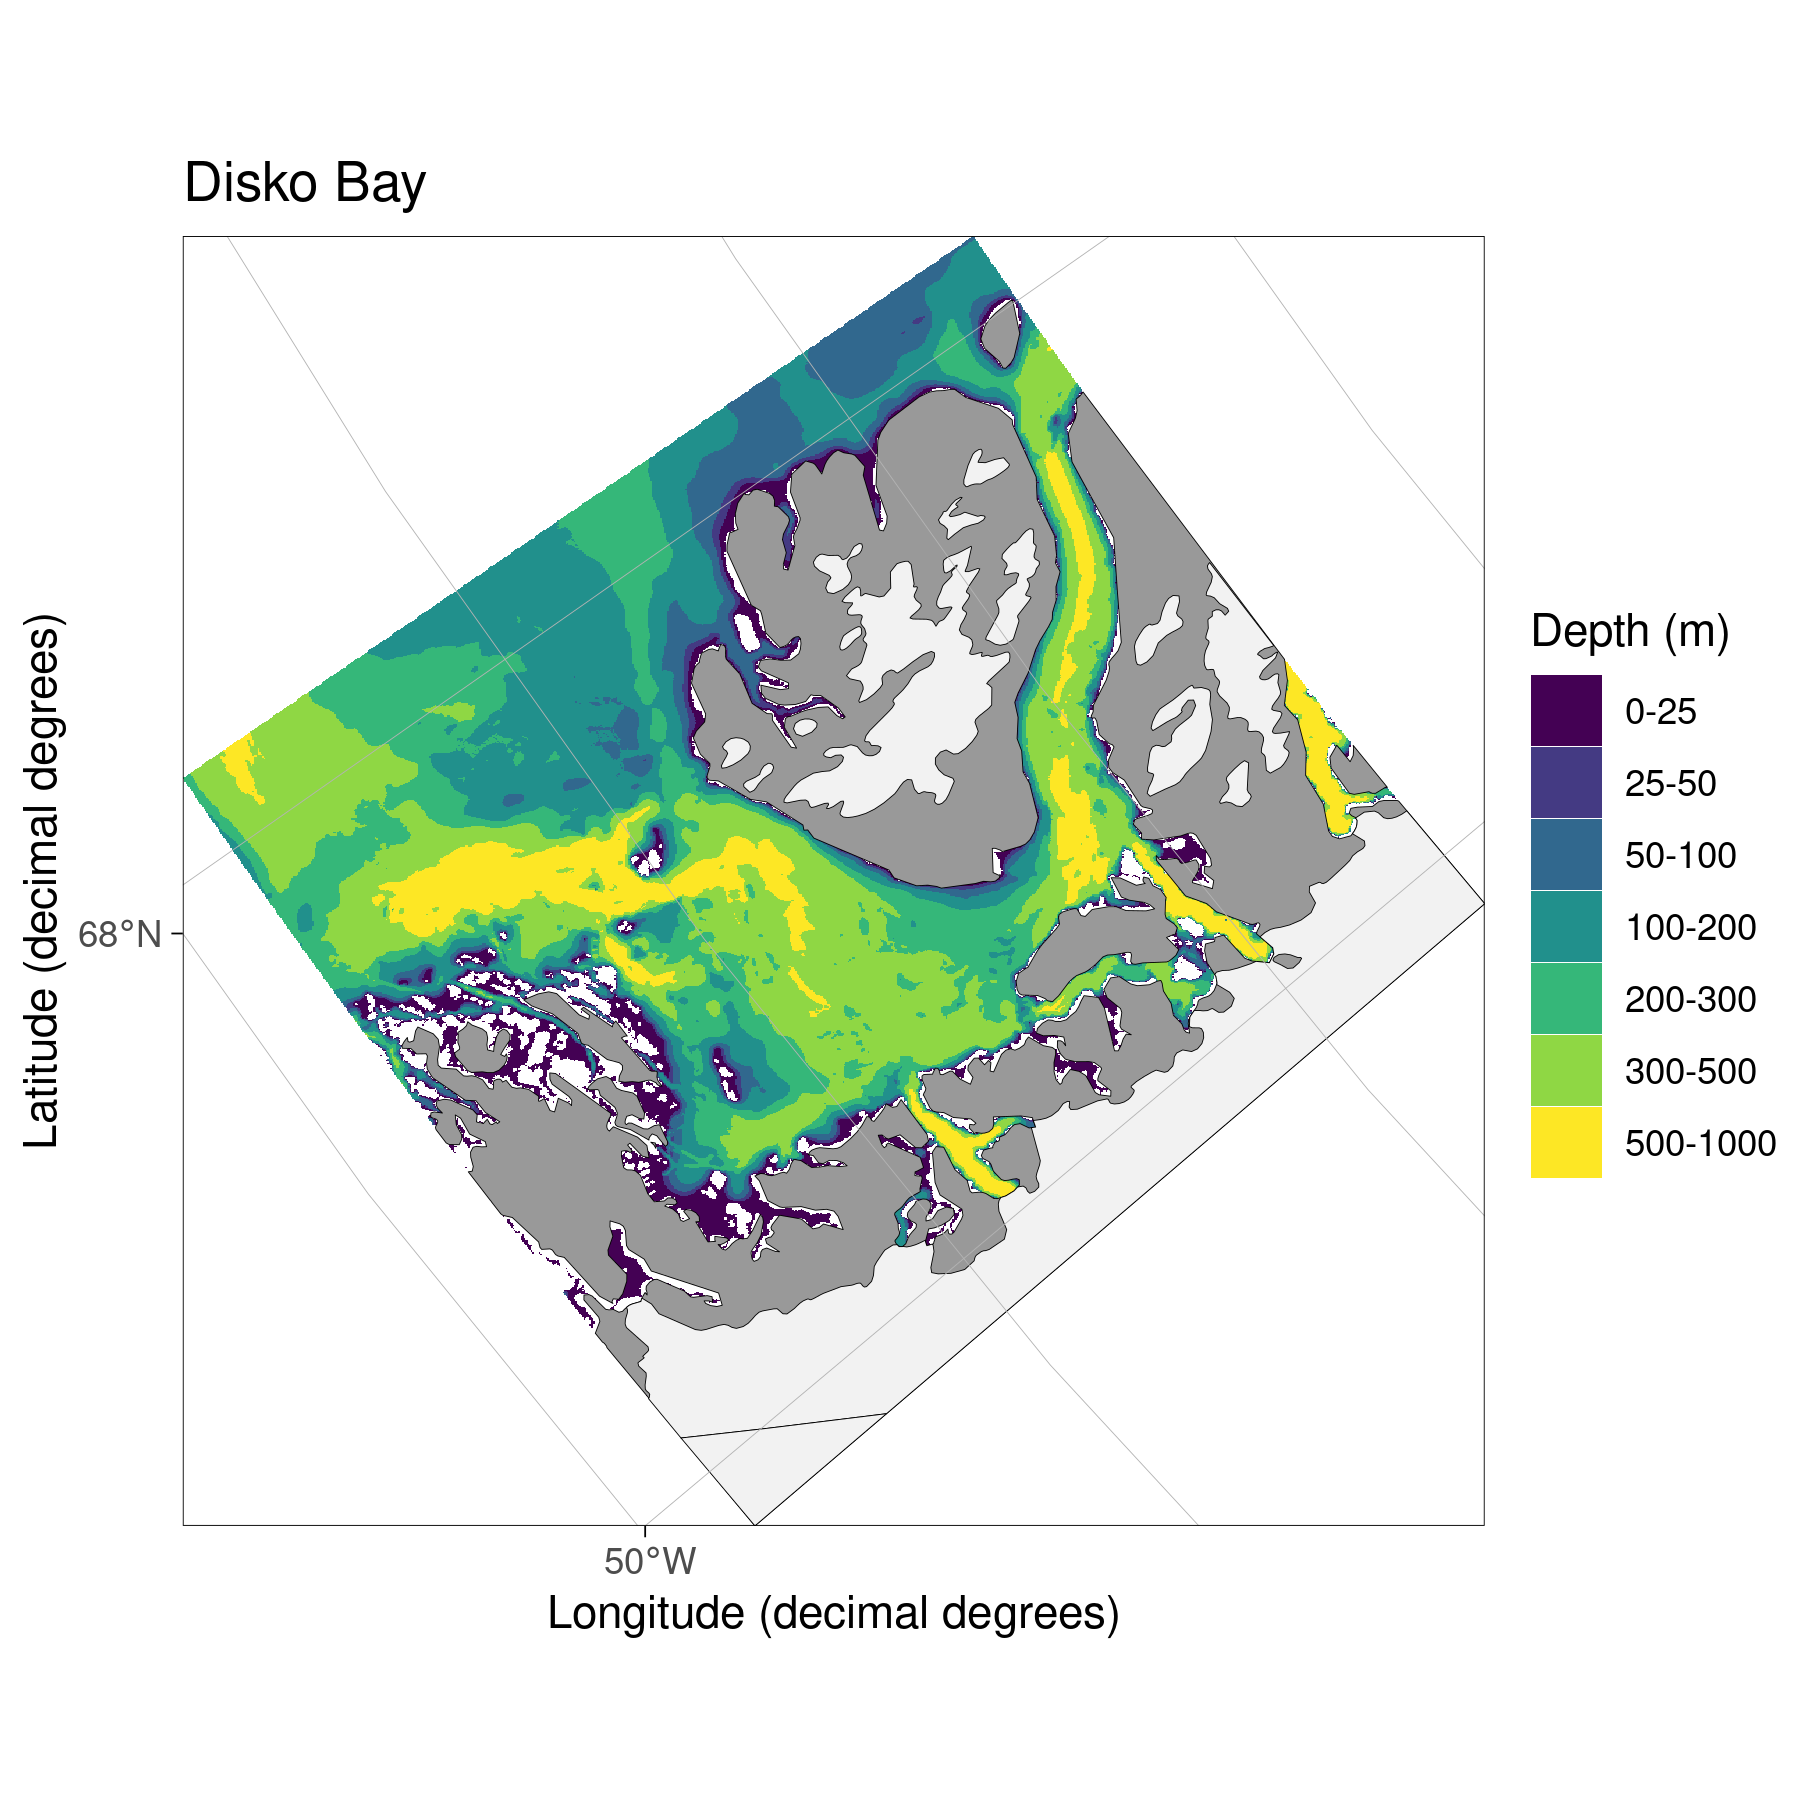
Disko Bay
Nuup Kangerlua

Norway
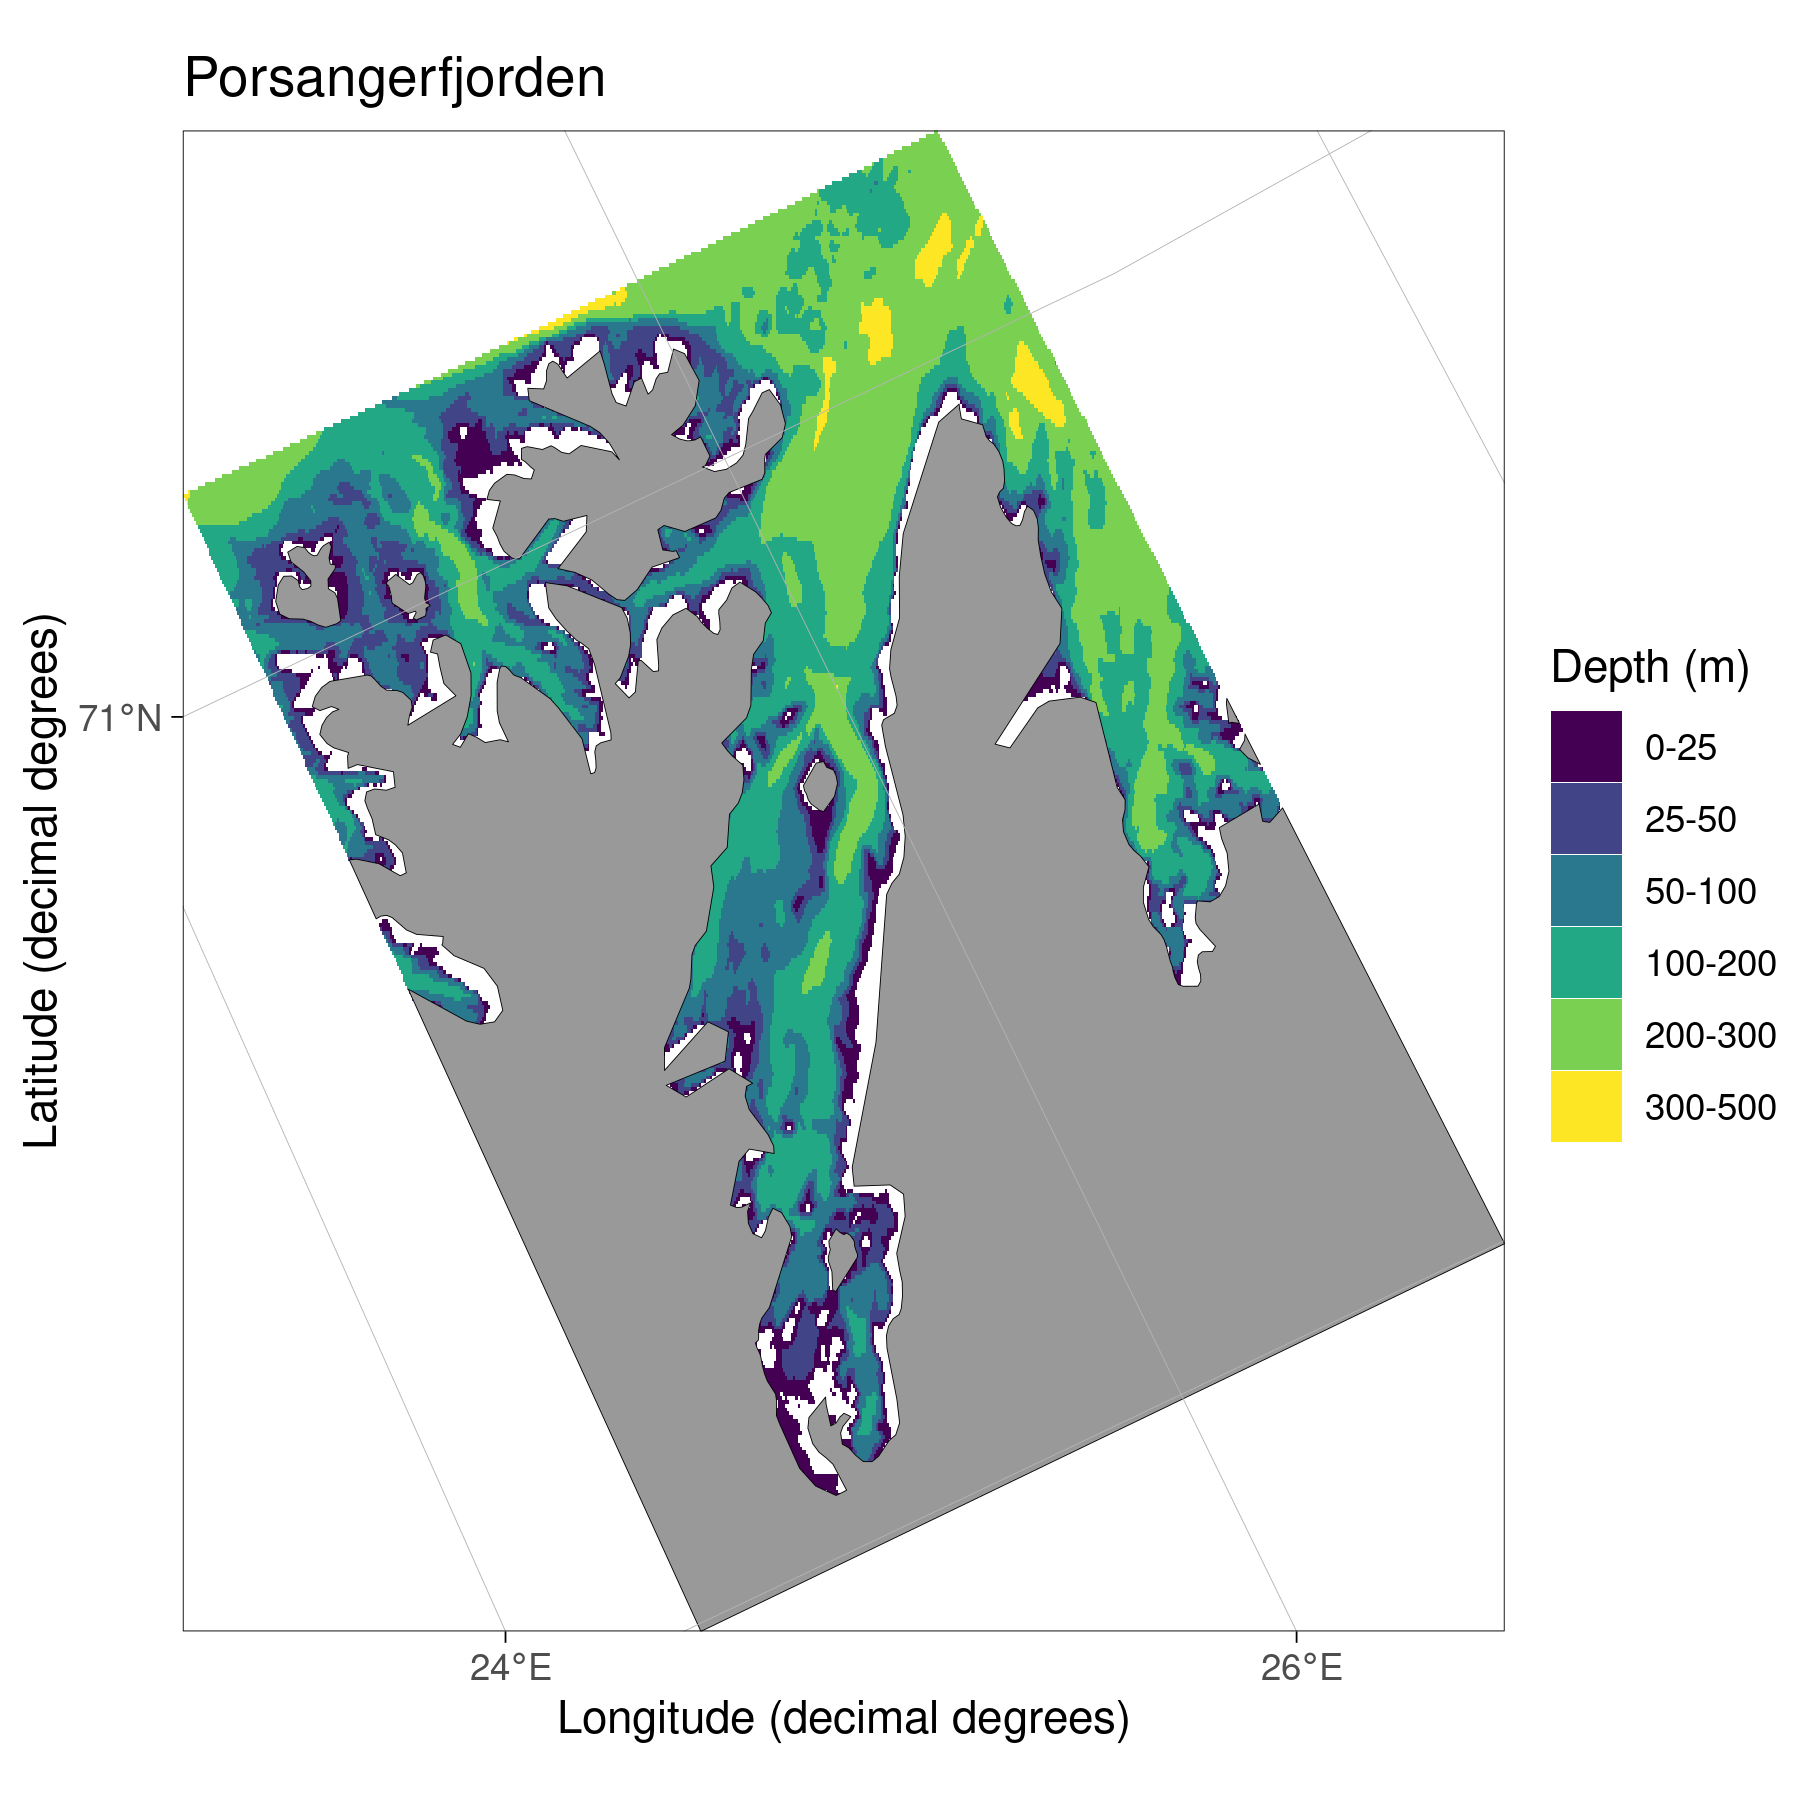
Porsangerfjorden
References
sessionInfo()R version 4.0.4 (2021-02-15)
Platform: x86_64-pc-linux-gnu (64-bit)
Running under: Ubuntu 20.04.2 LTS
Matrix products: default
BLAS: /usr/lib/x86_64-linux-gnu/blas/libblas.so.3.9.0
LAPACK: /usr/lib/x86_64-linux-gnu/lapack/liblapack.so.3.9.0
locale:
[1] LC_CTYPE=en_GB.UTF-8 LC_NUMERIC=C
[3] LC_TIME=en_CA.UTF-8 LC_COLLATE=en_GB.UTF-8
[5] LC_MONETARY=en_CA.UTF-8 LC_MESSAGES=en_GB.UTF-8
[7] LC_PAPER=en_CA.UTF-8 LC_NAME=C
[9] LC_ADDRESS=C LC_TELEPHONE=C
[11] LC_MEASUREMENT=en_CA.UTF-8 LC_IDENTIFICATION=C
attached base packages:
[1] stats graphics grDevices utils datasets methods base
other attached packages:
[1] DT_0.17 forcats_0.5.1 stringr_1.4.0 dplyr_1.0.4
[5] purrr_0.3.4 readr_1.4.0 tidyr_1.1.2 tibble_3.1.0
[9] ggplot2_3.3.3 tidyverse_1.3.0 workflowr_1.6.2
loaded via a namespace (and not attached):
[1] Rcpp_1.0.6 lubridate_1.7.9.2 assertthat_0.2.1 rprojroot_2.0.2
[5] digest_0.6.27 utf8_1.1.4 R6_2.5.0 cellranger_1.1.0
[9] backports_1.2.1 reprex_1.0.0 evaluate_0.14 httr_1.4.2
[13] highr_0.8 pillar_1.5.0 rlang_0.4.10 readxl_1.3.1
[17] rstudioapi_0.13 whisker_0.4 jquerylib_0.1.3 rmarkdown_2.7
[21] htmlwidgets_1.5.3 munsell_0.5.0 broom_0.7.5 compiler_4.0.4
[25] httpuv_1.5.5 modelr_0.1.8 xfun_0.21 pkgconfig_2.0.3
[29] htmltools_0.5.1.1 tidyselect_1.1.0 fansi_0.4.2 crayon_1.4.1
[33] dbplyr_2.1.0 withr_2.4.1 later_1.1.0.1 grid_4.0.4
[37] jsonlite_1.7.2 gtable_0.3.0 lifecycle_1.0.0 DBI_1.1.1
[41] git2r_0.28.0 magrittr_2.0.1 scales_1.1.1 cli_2.3.1
[45] stringi_1.5.3 fs_1.5.0 promises_1.2.0.1 xml2_1.3.2
[49] bslib_0.2.4 ellipsis_0.3.1 generics_0.1.0 vctrs_0.3.6
[53] tools_4.0.4 glue_1.4.2 crosstalk_1.1.1 hms_1.0.0
[57] yaml_2.2.1 colorspace_2.0-0 rvest_0.3.6 knitr_1.31
[61] haven_2.3.1 sass_0.3.1