Functional Enrichment Analysis
Maeva Techer
2025-07-01
Last updated: 2025-07-01
Checks: 6 1
Knit directory:
locust-comparative-genomics/
This reproducible R Markdown analysis was created with workflowr (version 1.7.1). The Checks tab describes the reproducibility checks that were applied when the results were created. The Past versions tab lists the development history.
Great! Since the R Markdown file has been committed to the Git repository, you know the exact version of the code that produced these results.
Great job! The global environment was empty. Objects defined in the global environment can affect the analysis in your R Markdown file in unknown ways. For reproduciblity it’s best to always run the code in an empty environment.
The command set.seed(20221025) was run prior to running
the code in the R Markdown file. Setting a seed ensures that any results
that rely on randomness, e.g. subsampling or permutations, are
reproducible.
Great job! Recording the operating system, R version, and package versions is critical for reproducibility.
Nice! There were no cached chunks for this analysis, so you can be confident that you successfully produced the results during this run.
Using absolute paths to the files within your workflowr project makes it difficult for you and others to run your code on a different machine. Change the absolute path(s) below to the suggested relative path(s) to make your code more reproducible.
| absolute | relative |
|---|---|
| /Users/maevatecher/Documents/GitHub/locust-comparative-genomics/data | data |
| /Users/maevatecher/Documents/GitHub/locust-comparative-genomics/data/pathway_enrichment | data/pathway_enrichment |
| /Users/maevatecher/Documents/GitHub/locust-comparative-genomics/data/list/GO_Annotations/DesertLocustR_0.1.0.tar.gz | data/list/GO_Annotations/DesertLocustR_0.1.0.tar.gz |
Great! You are using Git for version control. Tracking code development and connecting the code version to the results is critical for reproducibility.
The results in this page were generated with repository version 4c99fd7. See the Past versions tab to see a history of the changes made to the R Markdown and HTML files.
Note that you need to be careful to ensure that all relevant files for
the analysis have been committed to Git prior to generating the results
(you can use wflow_publish or
wflow_git_commit). workflowr only checks the R Markdown
file, but you know if there are other scripts or data files that it
depends on. Below is the status of the Git repository when the results
were generated:
Ignored files:
    Ignored:    .DS_Store
    Ignored:    analysis/.DS_Store
    Ignored:    analysis/.Rhistory
    Ignored:    analysis/figure/
    Ignored:    code/.DS_Store
    Ignored:    code/scripts/.DS_Store
    Ignored:    code/scripts/pal2nal.v14/.DS_Store
    Ignored:    data/.DS_Store
    Ignored:    data/DEG_results/.DS_Store
    Ignored:    data/DEG_results/Bulk_RNAseq/.DS_Store
    Ignored:    data/DEG_results/Bulk_RNAseq/americana/.DS_Store
    Ignored:    data/DEG_results/Bulk_RNAseq/cancellata/.DS_Store
    Ignored:    data/DEG_results/Bulk_RNAseq/cubense/.DS_Store
    Ignored:    data/DEG_results/Bulk_RNAseq/gregaria/.DS_Store
    Ignored:    data/DEG_results/Bulk_RNAseq/nitens/.DS_Store
    Ignored:    data/HYPHY_selection/.DS_Store
    Ignored:    data/HYPHY_selection/ParsedABSRELResults_unlabeled/
    Ignored:    data/HYPHY_selection/pathway_enrichment/.DS_Store
    Ignored:    data/HYPHY_selection/pathway_enrichment/americana/
    Ignored:    data/HYPHY_selection/pathway_enrichment/cancellata/
    Ignored:    data/HYPHY_selection/pathway_enrichment/cubense/
    Ignored:    data/HYPHY_selection/pathway_enrichment/nitens/
    Ignored:    data/HYPHY_selection/pathway_enrichment/piceifrons/
    Ignored:    data/WGCNA/.DS_Store
    Ignored:    data/WGCNA/input/.DS_Store
    Ignored:    data/WGCNA/input/Bulk_RNAseq/.DS_Store
    Ignored:    data/WGCNA/output/.DS_Store
    Ignored:    data/WGCNA/output/Bulk_RNAseq/.DS_Store
    Ignored:    data/WGCNA/output/Bulk_RNAseq/gregaria/.DS_Store
    Ignored:    data/behavioral_data/.DS_Store
    Ignored:    data/behavioral_data/Raw_data/.DS_Store
    Ignored:    data/cafe5_results/.DS_Store
    Ignored:    data/list/.DS_Store
    Ignored:    data/list/Bulk_RNAseq/.DS_Store
    Ignored:    data/list/GO_Annotations/.DS_Store
    Ignored:    data/list/GO_Annotations/DesertLocustR/.DS_Store
    Ignored:    data/list/excluded_loci/.DS_Store
    Ignored:    data/orthofinder/.DS_Store
    Ignored:    data/orthofinder/Polyneoptera/.DS_Store
    Ignored:    data/orthofinder/Polyneoptera/Results_I2_iqtree/.DS_Store
    Ignored:    data/orthofinder/Polyneoptera/Results_I2_iqtree/Orthogroups/.DS_Store
    Ignored:    data/orthofinder/Polyneoptera/Results_I2_withDaust/.DS_Store
    Ignored:    data/orthofinder/Polyneoptera/Results_I2_withDaust/Orthogroups/.DS_Store
    Ignored:    data/orthofinder/Schistocerca/.DS_Store
    Ignored:    data/orthofinder/Schistocerca/Results_I2/.DS_Store
    Ignored:    data/orthofinder/Schistocerca/Results_I2/Orthogroups/.DS_Store
    Ignored:    data/overlap/.DS_Store
    Ignored:    data/pathway_enrichment/.DS_Store
    Ignored:    data/pathway_enrichment/OLD/.DS_Store
    Ignored:    data/pathway_enrichment/OLD/custom_sgregaria_orgdb/.DS_Store
    Ignored:    data/pathway_enrichment/REVIGO_results/.DS_Store
    Ignored:    data/pathway_enrichment/REVIGO_results/BP/.DS_Store
    Ignored:    data/pathway_enrichment/REVIGO_results/CC/.DS_Store
    Ignored:    data/pathway_enrichment/REVIGO_results/MF/.DS_Store
    Ignored:    data/pathway_enrichment/cancellata/.DS_Store
    Ignored:    data/pathway_enrichment/gregaria/.DS_Store
    Ignored:    data/pathway_enrichment/nitens/Thorax/
    Ignored:    data/pathway_enrichment/piceifrons/.DS_Store
    Ignored:    data/readcounts/.DS_Store
    Ignored:    data/readcounts/Bulk_RNAseq/.DS_Store
    Ignored:    data/readcounts/RNAi/.DS_Store

Untracked files:
    Untracked:  VennDiagram.2025-07-01_22-29-17.821048.log
    Untracked:  VennDiagram.2025-07-01_22-29-18.506144.log
    Untracked:  VennDiagram.2025-07-01_22-29-18.958763.log
    Untracked:  VennDiagram.2025-07-01_22-29-19.371613.log
    Untracked:  VennDiagram.2025-07-01_22-29-19.779524.log
    Untracked:  VennDiagram.2025-07-01_22-29-20.277996.log
    Untracked:  VennDiagram.2025-07-01_22-29-20.345743.log
    Untracked:  VennDiagram.2025-07-01_22-29-20.474673.log
    Untracked:  VennDiagram.2025-07-01_22-29-21.284291.log
    Untracked:  VennDiagram.2025-07-01_22-29-21.387256.log
    Untracked:  VennDiagram.2025-07-01_22-29-21.456684.log
    Untracked:  VennDiagram.2025-07-01_22-29-22.101485.log
    Untracked:  VennDiagram.2025-07-01_22-29-22.135053.log
    Untracked:  VennDiagram.2025-07-01_22-29-22.197645.log
    Untracked:  VennDiagram.2025-07-01_22-29-22.681624.log
    Untracked:  VennDiagram.2025-07-01_22-29-22.759487.log
    Untracked:  VennDiagram.2025-07-01_22-29-22.820729.log
    Untracked:  VennDiagram.2025-07-01_22-29-23.357623.log
    Untracked:  VennDiagram.2025-07-01_22-29-23.490271.log
    Untracked:  VennDiagram.2025-07-01_22-29-23.633047.log
    Untracked:  VennDiagram.2025-07-01_22-29-24.270207.log
    Untracked:  VennDiagram.2025-07-01_22-29-24.362805.log
    Untracked:  VennDiagram.2025-07-01_22-29-24.509054.log
    Untracked:  VennDiagram.2025-07-01_22-29-25.246743.log
    Untracked:  VennDiagram.2025-07-01_22-29-25.366255.log
    Untracked:  VennDiagram.2025-07-01_22-29-25.501511.log
    Untracked:  VennDiagram.2025-07-01_22-29-25.619718.log
    Untracked:  VennDiagram.2025-07-01_22-29-25.752386.log
    Untracked:  VennDiagram.2025-07-01_22-29-25.884214.log
    Untracked:  VennDiagram.2025-07-01_22-29-32.21566.log
    Untracked:  VennDiagram.2025-07-01_22-29-32.702845.log
    Untracked:  VennDiagram.2025-07-01_22-29-33.141174.log
    Untracked:  VennDiagram.2025-07-01_22-29-33.623571.log
    Untracked:  VennDiagram.2025-07-01_22-29-34.043207.log
    Untracked:  VennDiagram.2025-07-01_22-29-35.582962.log
    Untracked:  VennDiagram.2025-07-01_22-29-35.683173.log
    Untracked:  VennDiagram.2025-07-01_22-29-35.748569.log
    Untracked:  VennDiagram.2025-07-01_22-29-37.312887.log
    Untracked:  VennDiagram.2025-07-01_22-29-37.353473.log
    Untracked:  VennDiagram.2025-07-01_22-29-39.165353.log
    Untracked:  VennDiagram.2025-07-01_22-29-39.266576.log
    Untracked:  VennDiagram.2025-07-01_22-29-39.338425.log
    Untracked:  VennDiagram.2025-07-01_22-29-40.967686.log
    Untracked:  VennDiagram.2025-07-01_22-29-41.01039.log
    Untracked:  VennDiagram.2025-07-01_22-29-43.224263.log
    Untracked:  VennDiagram.2025-07-01_22-29-43.2803.log
    Untracked:  VennDiagram.2025-07-01_22-29-45.133675.log
    Untracked:  VennDiagram.2025-07-01_22-29-45.174807.log
    Untracked:  VennDiagram.2025-07-01_22-29-45.232512.log
    Untracked:  VennDiagram.2025-07-01_22-29-47.42983.log
    Untracked:  VennDiagram.2025-07-01_22-29-47.499088.log
    Untracked:  VennDiagram.2025-07-01_22-29-47.628661.log
    Untracked:  VennDiagram.2025-07-01_22-29-49.898753.log
    Untracked:  VennDiagram.2025-07-01_22-29-49.968615.log
    Untracked:  VennDiagram.2025-07-01_22-29-50.099433.log
    Untracked:  VennDiagram.2025-07-01_22-29-52.845994.log
    Untracked:  VennDiagram.2025-07-01_22-29-52.919004.log
    Untracked:  VennDiagram.2025-07-01_22-29-53.056101.log
    Untracked:  VennDiagram.2025-07-01_22-29-53.141373.log
    Untracked:  VennDiagram.2025-07-01_22-29-53.276752.log
    Untracked:  VennDiagram.2025-07-01_22-29-53.411026.log
    Untracked:  VennDiagram.2025-07-01_22-29-56.851583.log
    Untracked:  VennDiagram.2025-07-01_22-29-56.973729.log
    Untracked:  VennDiagram.2025-07-01_22-29-57.056898.log
    Untracked:  VennDiagram.2025-07-01_22-29-59.855275.log
    Untracked:  VennDiagram.2025-07-01_22-29-59.92735.log
    Untracked:  VennDiagram.2025-07-01_22-30-00.060886.log
    Untracked:  data/RefSeq/

Unstaged changes:
    Modified:   data/HYPHY_selection/pathway_enrichment/gregaria/GO_BP_dotplot_gregaria_BUSTED_CAELIFERA.pdf
    Modified:   data/HYPHY_selection/pathway_enrichment/gregaria/GO_BP_dotplot_gregaria_BUSTED_POLYNEOPTERA.pdf
    Modified:   data/HYPHY_selection/pathway_enrichment/gregaria/GO_CC_dotplot_gregaria_BUSTED_CAELIFERA.pdf
    Modified:   data/HYPHY_selection/pathway_enrichment/gregaria/GO_CC_dotplot_gregaria_BUSTED_POLYNEOPTERA.pdf
    Modified:   data/HYPHY_selection/pathway_enrichment/gregaria/GO_MF_dotplot_gregaria_BUSTED_CAELIFERA.pdf
    Modified:   data/HYPHY_selection/pathway_enrichment/gregaria/GO_MF_dotplot_gregaria_BUSTED_POLYNEOPTERA.pdf
    Modified:   data/HYPHY_selection/pathway_enrichment/gregaria/KEGG_dotplot_gregaria_BUSTED_CAELIFERA.pdf
    Modified:   data/HYPHY_selection/pathway_enrichment/gregaria/KEGG_dotplot_gregaria_BUSTED_POLYNEOPTERA.pdf
    Modified:   data/orthofinder/Polyneoptera/Results_I2_iqtree/Orthogroups/Orthogroups_UnassignedGenes_reprocessed.tsv
    Modified:   data/orthofinder/Polyneoptera/Results_I2_iqtree/Orthogroups/Orthogroups_reprocessed.tsv
    Modified:   data/orthofinder/Polyneoptera/Results_I2_iqtree/Plots_Polyneoptera/VerticalStackedBar_A. simplex.pdf
    Modified:   data/orthofinder/Polyneoptera/Results_I2_iqtree/Plots_Polyneoptera/VerticalStackedBar_B. rossius.pdf
    Modified:   data/orthofinder/Polyneoptera/Results_I2_iqtree/Plots_Polyneoptera/VerticalStackedBar_C. secundus.pdf
    Modified:   data/orthofinder/Polyneoptera/Results_I2_iqtree/Plots_Polyneoptera/VerticalStackedBar_G. bimaculatus.pdf
    Modified:   data/orthofinder/Polyneoptera/Results_I2_iqtree/Plots_Polyneoptera/VerticalStackedBar_G. longicornis.pdf
    Modified:   data/orthofinder/Polyneoptera/Results_I2_iqtree/Plots_Polyneoptera/VerticalStackedBar_L. migratoria.pdf
    Modified:   data/orthofinder/Polyneoptera/Results_I2_iqtree/Plots_Polyneoptera/VerticalStackedBar_P. americana.pdf
    Modified:   data/orthofinder/Polyneoptera/Results_I2_iqtree/Plots_Polyneoptera/VerticalStackedBar_americana.pdf
    Modified:   data/orthofinder/Polyneoptera/Results_I2_iqtree/Plots_Polyneoptera/VerticalStackedBar_cancellata.pdf
    Modified:   data/orthofinder/Polyneoptera/Results_I2_iqtree/Plots_Polyneoptera/VerticalStackedBar_cubense.pdf
    Modified:   data/orthofinder/Polyneoptera/Results_I2_iqtree/Plots_Polyneoptera/VerticalStackedBar_gregaria.pdf
    Modified:   data/orthofinder/Polyneoptera/Results_I2_iqtree/Plots_Polyneoptera/VerticalStackedBar_nitens.pdf
    Modified:   data/orthofinder/Polyneoptera/Results_I2_iqtree/Plots_Polyneoptera/VerticalStackedBar_piceifrons.pdf
    Modified:   data/orthofinder/Schistocerca/Results_I2/Plots_Schistocerca/VerticalStackedBar_americana.pdf
    Modified:   data/orthofinder/Schistocerca/Results_I2/Plots_Schistocerca/VerticalStackedBar_cancellata.pdf
    Modified:   data/orthofinder/Schistocerca/Results_I2/Plots_Schistocerca/VerticalStackedBar_cubense.pdf
    Modified:   data/orthofinder/Schistocerca/Results_I2/Plots_Schistocerca/VerticalStackedBar_gregaria.pdf
    Modified:   data/orthofinder/Schistocerca/Results_I2/Plots_Schistocerca/VerticalStackedBar_nitens.pdf
    Modified:   data/orthofinder/Schistocerca/Results_I2/Plots_Schistocerca/VerticalStackedBar_piceifrons.pdf
Note that any generated files, e.g. HTML, png, CSS, etc., are not included in this status report because it is ok for generated content to have uncommitted changes.
These are the previous versions of the repository in which changes were
made to the R Markdown (analysis/3_go-enrichment.Rmd) and
HTML (docs/3_go-enrichment.html) files. If you’ve
configured a remote Git repository (see ?wflow_git_remote),
click on the hyperlinks in the table below to view the files as they
were in that past version.
| File | Version | Author | Date | Message |
|---|---|---|---|---|
| Rmd | a2d2955 | Maeva TECHER | 2025-07-01 | Updated wgcna and compiling |
| html | a2d2955 | Maeva TECHER | 2025-07-01 | Updated wgcna and compiling |
| html | b982319 | Maeva TECHER | 2025-03-03 | update font |
| Rmd | 9451c02 | Maeva TECHER | 2025-03-03 | adding GO enrich |
| Rmd | 89984c0 | Maeva TECHER | 2025-02-19 | Add overlap update |
| Rmd | 3746422 | Maeva TECHER | 2025-02-12 | Add RNAi |
| html | 3746422 | Maeva TECHER | 2025-02-12 | Add RNAi |
| Rmd | 1fddc47 | Maeva TECHER | 2025-02-03 | Go enrichment |
| html | 1fddc47 | Maeva TECHER | 2025-02-03 | Go enrichment |
| Rmd | faf2db3 | Maeva TECHER | 2025-01-13 | update markdown |
| Rmd | 616f6d6 | Maeva TECHER | 2025-01-07 | remove old files |
| html | 616f6d6 | Maeva TECHER | 2025-01-07 | remove old files |
| Rmd | 0f0ac1f | Maeva TECHER | 2024-11-19 | update deseq2 |
| html | 0f0ac1f | Maeva TECHER | 2024-11-19 | update deseq2 |
| Rmd | fe6dae9 | Maeva TECHER | 2024-11-19 | changes ESA |
| html | fe6dae9 | Maeva TECHER | 2024-11-19 | changes ESA |
| Rmd | 3fa8e62 | Maeva TECHER | 2024-11-09 | updated analysis |
| html | 3fa8e62 | Maeva TECHER | 2024-11-09 | updated analysis |
| Rmd | edb70fe | Maeva TECHER | 2024-11-08 | overlap and deg results created |
| html | edb70fe | Maeva TECHER | 2024-11-08 | overlap and deg results created |
| html | ba35b82 | Maeva A. TECHER | 2024-06-20 | Build site. |
| html | d605bd3 | Maeva A. TECHER | 2024-05-16 | Build site. |
| Rmd | 9f04a80 | Maeva A. TECHER | 2024-05-16 | wflow_publish("analysis/3_go-enrichment.Rmd") |
| html | d7b2c58 | Maeva A. TECHER | 2024-05-16 | Build site. |
| Rmd | f5a78da | Maeva A. TECHER | 2024-05-16 | wflow_publish("analysis/3_go-enrichment.Rmd") |
| html | a32a56d | Maeva A. TECHER | 2024-05-15 | Build site. |
| Rmd | ebc0f04 | Maeva A. TECHER | 2024-05-15 | wflow_publish("analysis/3_go-enrichment.Rmd") |
library(topGO)
library(dplyr)
library(ggplot2)
library(tidyr)
library(tibble)
library(pheatmap)
library(data.table)
library(DiagrammeR)
library(GO.db)
library(AnnotationHub)
library(clusterProfiler)
library(rtracklayer)
library(Biostrings)
library(data.table)
library(readr)
library(forcats)
library(clusterProfiler)
library(enrichplot)
library(purrr)
library(GO.db)
library(patchwork)
library(stringr)
library(AnnotationDbi)

workDir <- "/Users/maevatecher/Documents/GitHub/locust-comparative-genomics/data"
enrichDir <- "/Users/maevatecher/Documents/GitHub/locust-comparative-genomics/data/pathway_enrichment"
Once we have shortlisted some genes of interest—whether they are obtained from top differentially expressed genes (DEGs), weighted gene co-expression network analysis (WGCNA) modules, or other comparative genomics analyses (e.g., signatures of selection, gene family expansion)—we want to determine if certain functions are enriched in our subset.
For example, we hypothesize that although locusts have evolved similar traits, they may have diverged in their strategies to respond to the environment. Therefore, we expect to see DEGs involved in divergent biological processes, molecular function, and cellular components between S. gregaria, S. piceifrons and S. cancellata. To test that, we need to look for Gene Ontology (GO) terms that can provide us a bird’s-eye of the related functions associated with our genes of interests.
Here we show two workflow: one with Blast2Go and
TopGo in R and the other with EggNOG
annotations and ClusterProfiler in R, which has been
packaged by Devon Boland for all Schistocerca species.
library(DiagrammeR)

grViz("
digraph go_workflow {

    # Define node styles
    node [shape=rectangle, style=filled, fillcolor=lightgoldenrod1, fontname=Helvetica, fontsize=12]

    # Nodes
    shortlist     [label=\"Shortlist Genes:\\nFrom DEGs, WGCNA, selection, etc.\"]
    load_deg      [label=\"Load DEGs:\\nSeparate Up/Downregulated\\n(GeneID)\"]
    load_annot    [label=\"Load GO Annotation:\\n.blast2go_custom.txt\\n(OmicsBox Export)\"]
    process_annot [label=\"Parse GO Annotation:\\nSplit Category / GO ID / Term\\n(Build gene2GO)\"]
    run_topgo_species  [label=\"Run topGO per Species:\\nSeparate by Ontology (BP, MF, CC)\"]
    run_topgo_overlap  [label=\"Run topGO on Overlap:\\nShared gene sets across species\"]
    compute_stats [label=\"Compute Stats:\\n-log10(p), Fold Enrichment\"]
    manual_cleaning    [label=\"Manual Curation:\\nRemove redundancy, resolve term conflicts\"]
    visualize_plots [label=\"Visualize:\\nDotplots, Barplots, Heatmap\\n(GO term significance)\"]
    revigo_cluster   [label=\"REVIGO Summarization:\\nReduce redundancy\\nSemantic similarity\"]
    revigo_scatter     [label=\"Scatterplot:\\nSemantic space + species color + label\"]
    revigo_treemap   [label=\"Treemap Plot:\\nGrouped by representative term\\nColored by species\"]
    export_csv    [label=\"Export Results:\\nGO10_enrichment_*_custom.csv\"]

    # Edges
    shortlist -> load_deg
    load_deg -> run_topgo_species
    load_annot -> process_annot
    process_annot -> run_topgo_species
    process_annot -> run_topgo_overlap
    run_topgo_species -> compute_stats
    run_topgo_overlap -> compute_stats
    compute_stats -> manual_cleaning [label=\"Manual cleaning\" fontcolor=gray30 fontsize=10]
    manual_cleaning -> revigo_cluster
    revigo_cluster -> revigo_treemap
    revigo_cluster -> revigo_scatter
    compute_stats -> visualize_plots
    compute_stats -> export_csv
}
")
1. GO term enrichment with blast2GO
1.1. Create .annot files
To create the GO association file with each of our genome, we are
using the paid version of OmicsBox with the integrated
workflow Blast2Go. We details below our step-by-step with
one Schistocerca genome, but followed the same process for all
six RefSeq.
Step 1: Load Genome (fasta + GFF)

Step 2: Run Blast

We choose the More Sensitive mode of blastx from the
Diamond Blast mode which allows to align large lists of nucleotide or
protein sequences against up-to-date public sequence collections.
Diamond Blast has a very similar accuracy compared to the NCBI Blast
with a much higher throughput. All our association files were run
against the Database (NR (2024-07-11)).

1.2. Using TopGo in R
First we need to load the DEG results for a particular species:
# Define working directory and species
species <- "gregaria"

# Step 1: Load DESeq2 results for the species
deg_file <- file.path(workDir, "DEG_results/Bulk_RNAseq/", paste0(species, "/Head/DESeq2_sigresults_sva_Head_", species ,".csv"))
deg_data <- read.csv(deg_file, stringsAsFactors = FALSE)
names(deg_data)[names(deg_data) == "X"] <- "GeneID"

# Separate DEGs into upregulated and downregulated
upregulated_genes <- subset(deg_data, padj < 0.05 & log2FoldChange > 1)$GeneID
downregulated_genes <- subset(deg_data, padj < 0.05 & log2FoldChange < -1)$GeneID
Then using the custom annotation for that species, we associate each gene with GOterms:
# Load the custom annotation file
custom_annot_file <- file.path(workDir, "list/GO_Annotations", paste0("blast2go_", species, "_custom.txt"))
custom_annot_df <- read.table(custom_annot_file, sep = "\t", header = TRUE, quote = "", fill = TRUE, stringsAsFactors = FALSE)

# Prepare gene-to-GO mapping for topGO
colnames(custom_annot_df) <- c("GeneID", "Description", "GO_Extended")
#custom_annot_df <- custom_annot_df %>%
#    separate(GO_Extended, into = c("Category", "GO_ID", "GO_Term"), sep = " ", extra = "merge") %>%
#    mutate(Category = substr(Category, 1, 1))

# Convert to data.table (if not already)
setDT(custom_annot_df)

# Split `GO_Extended` column efficiently
custom_annot_df[, c("Category", "GO_ID", "GO_Term") := tstrsplit(GO_Extended, " ", fixed = TRUE, keep = 1:3)]

# Extract first letter of `Category`
custom_annot_df[, Category := substr(Category, 1, 1)]


gene2GO <- custom_annot_df %>%
  group_by(GeneID) %>%
  summarize(GOterms = list(unique(GO_ID))) %>%
  deframe()
Subsequently, we create a list of upregulated genes and downregulated
ones, and enrich for the GOterms the most present in each list using
TopGo:
# Function to run topGO analysis by ontology
run_topGO <- function(ontology, gene_set, gene2GO) {
  all_genes <- factor(as.integer(names(gene2GO) %in% gene_set), levels = c(0, 1))
  names(all_genes) <- names(gene2GO)
  GOdata <- new("topGOdata", ontology = ontology, allGenes = all_genes, annot = annFUN.gene2GO, gene2GO = gene2GO)
  resultFisher <- runTest(GOdata, algorithm = "classic", statistic = "fisher")
  GenTable(GOdata, classicFisher = resultFisher, orderBy = "classicFisher", topNodes = 10)
}

# Run topGO for each ontology category and regulation type
allRes_up_BP <- run_topGO("BP", upregulated_genes, gene2GO) %>% mutate(Regulation = "Upregulated", ontology = "BP")
allRes_up_MF <- run_topGO("MF", upregulated_genes, gene2GO) %>% mutate(Regulation = "Upregulated", ontology = "MF")
allRes_up_CC <- run_topGO("CC", upregulated_genes, gene2GO) %>% mutate(Regulation = "Upregulated", ontology = "CC")

allRes_down_BP <- run_topGO("BP", downregulated_genes, gene2GO) %>% mutate(Regulation = "Downregulated", ontology = "BP")
allRes_down_MF <- run_topGO("MF", downregulated_genes, gene2GO) %>% mutate(Regulation = "Downregulated", ontology = "MF")
allRes_down_CC <- run_topGO("CC", downregulated_genes, gene2GO) %>% mutate(Regulation = "Downregulated", ontology = "CC")

# Combine all results with ontology labels
allRes <- bind_rows(
  allRes_up_BP, allRes_up_MF, allRes_up_CC,
  allRes_down_BP, allRes_down_MF, allRes_down_CC
)

# Check if ontology is retained
head(allRes)
GO.ID Term Annotated Significant Expected
1 GO:0055085 transmembrane transport 649 25 10.27
2 GO:0006810 transport 987 32 15.62
3 GO:0051234 establishment of localization 1002 32 15.86
4 GO:0051179 localization 1012 32 16.02
5 GO:0006665 sphingolipid metabolic process 15 3 0.24
6 GO:0019310 inositol catabolic process 6 2 0.09
classicFisher Regulation ontology
1 1.3e-05 Upregulated BP
2 1.9e-05 Upregulated BP
3 2.6e-05 Upregulated BP
4 3.2e-05 Upregulated BP
5 0.0015 Upregulated BP
6 0.0036 Upregulated BP# Visualization with ggplot2
allRes$classicFisher <- as.numeric(as.character(allRes$classicFisher))
allRes$FoldEnrichment <- allRes$Significant / allRes$ExpectedWe can then plot for example the top 10 GO terms enriched for each ontology using a dot plot, showing the Gene Count and Fold Enrichment values:
# Plot with ggplot2 using facet_wrap by ontology
ggplot(allRes, aes(x = reorder(Term, -log10(classicFisher)), y = -log10(classicFisher), size = Significant, color = FoldEnrichment)) +
    geom_point() +
    facet_wrap(~ ontology, scales = "free_y") +
    coord_flip() +
    labs(
        x = "GO Term",
        y = "-log10(p-value)",
        size = "Gene Count",
        color = "Fold Enrichment",
        title = "Top 10 Enriched GO Terms by Ontology",
        subtitle = "Head transcriptomes S. gregaria"
    ) +
    theme_minimal() +
    theme(
        plot.title = element_text(size = 16, face = "bold"),
        plot.subtitle = element_text(size = 12, face = "bold.italic"),
        axis.text.y = element_text(size = 8, face = "bold.italic", color = "black")
    ) +
    scale_size_continuous(range = c(3, 10)) +
    scale_color_viridis_c(option = "D")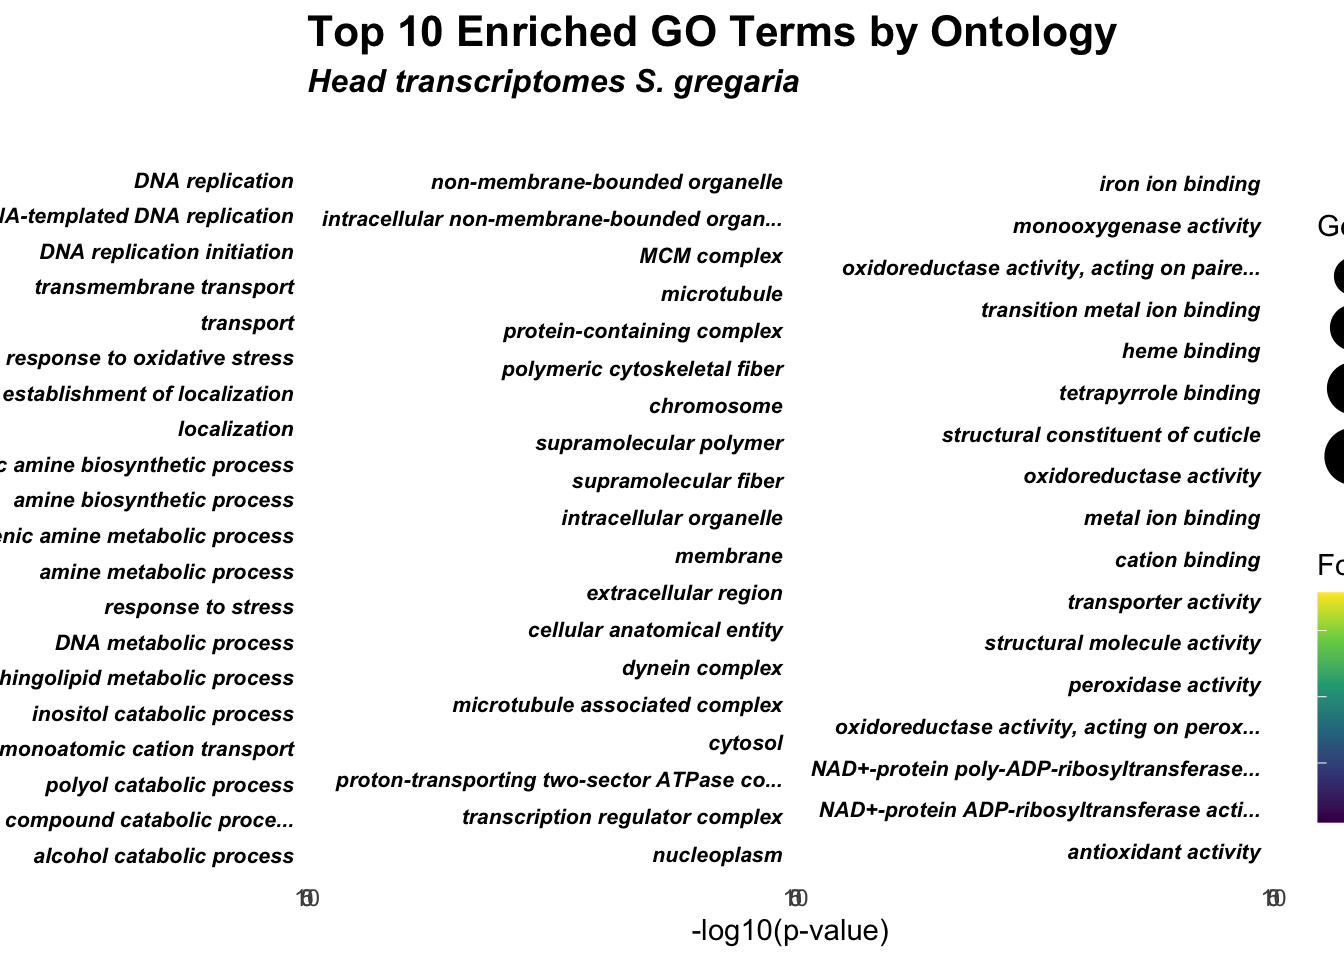
# Plotting code up and downregulated
ggplot(allRes, aes(x = reorder(Term, -log10(classicFisher)), y = -log10(classicFisher), size = Significant, color = Regulation)) +
    geom_point() +
    facet_wrap(~ ontology, scales = "free_y") +
    coord_flip() +
    labs(
        x = "GO Term",
        y = "-log10(p-value)",
        size = "Gene Count",
        color = "Regulation",
        title = "Top 10 Enriched GO Terms by Ontology",
        subtitle = "Head transcriptomes S. gregaria"
    ) +
    theme_minimal() +
    theme(
        plot.title = element_text(size = 16, face = "bold"),
        plot.subtitle = element_text(size = 12, face = "italic"),
        axis.text.y = element_text(size = 8, face = "bold", color = "black")
    ) +
    scale_size_continuous(range = c(3, 10)) +
    scale_color_manual(values = c("Upregulated" = "red", "Downregulated" = "blue"))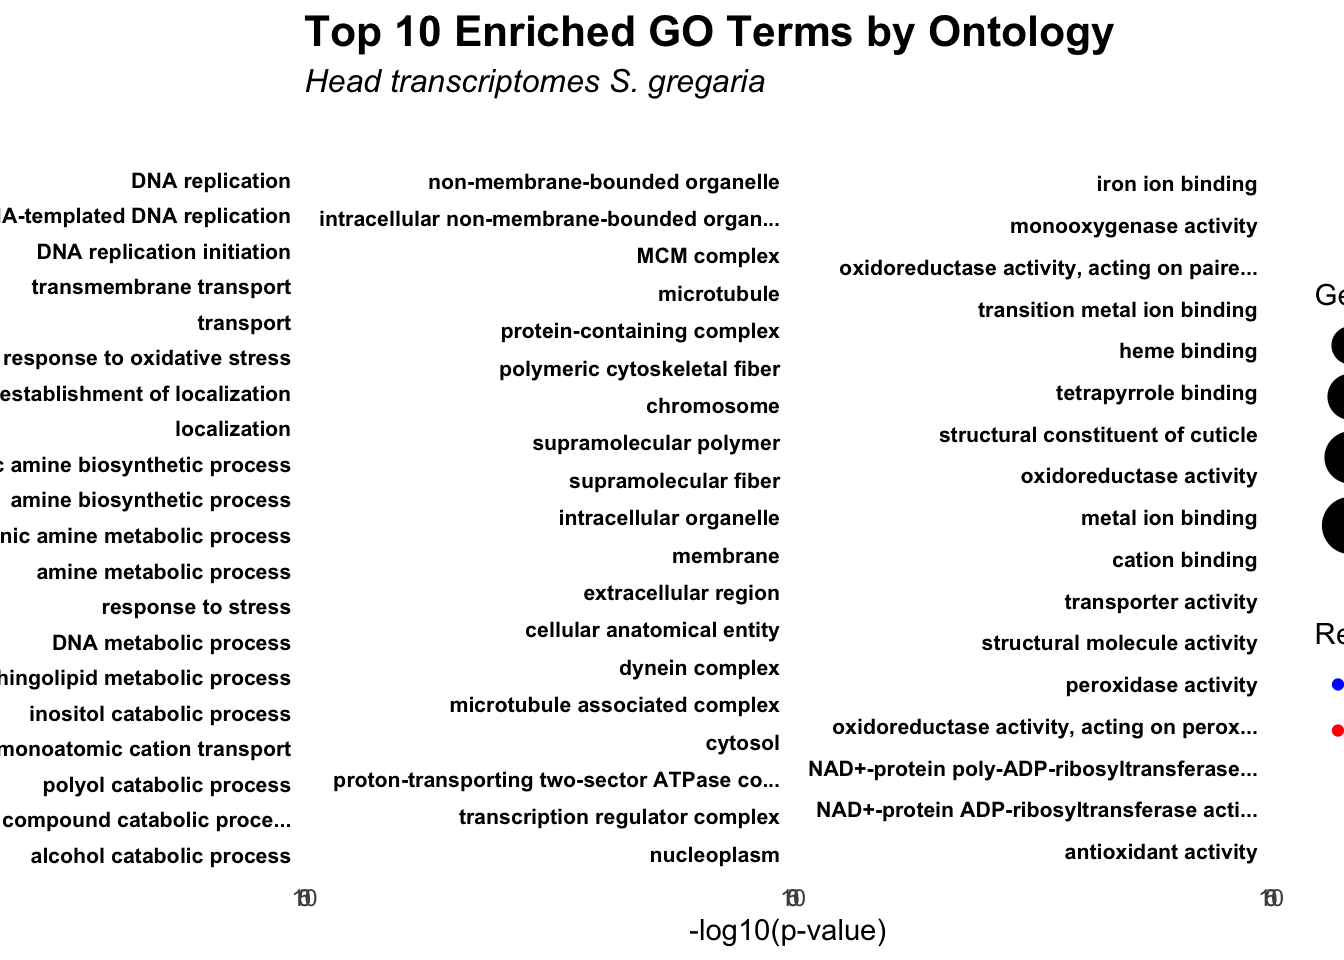
# Bar Plot for top GO terms per ontology
ggplot(allRes, aes(x = FoldEnrichment, y = reorder(Term, FoldEnrichment), color = -log10(classicFisher), size = Significant)) +
    geom_point() +
    facet_wrap(~ ontology, scales = "free_y") +
    labs(
        x = "Fold Enrichment",
        y = "GO Term",
        color = "-log10(p-value)",
        size = "Gene Count",
        title = "GO Term Enrichment: Fold Enrichment vs p-value"
    ) +
    theme_minimal() +
    theme(
        plot.title = element_text(size = 16, face = "bold"),
        plot.subtitle = element_text(size = 12, face = "bold.italic"),
        axis.text.y = element_text(size = 8, face = "bold", color = "black")
    ) +
    scale_fill_viridis_c(option = "C")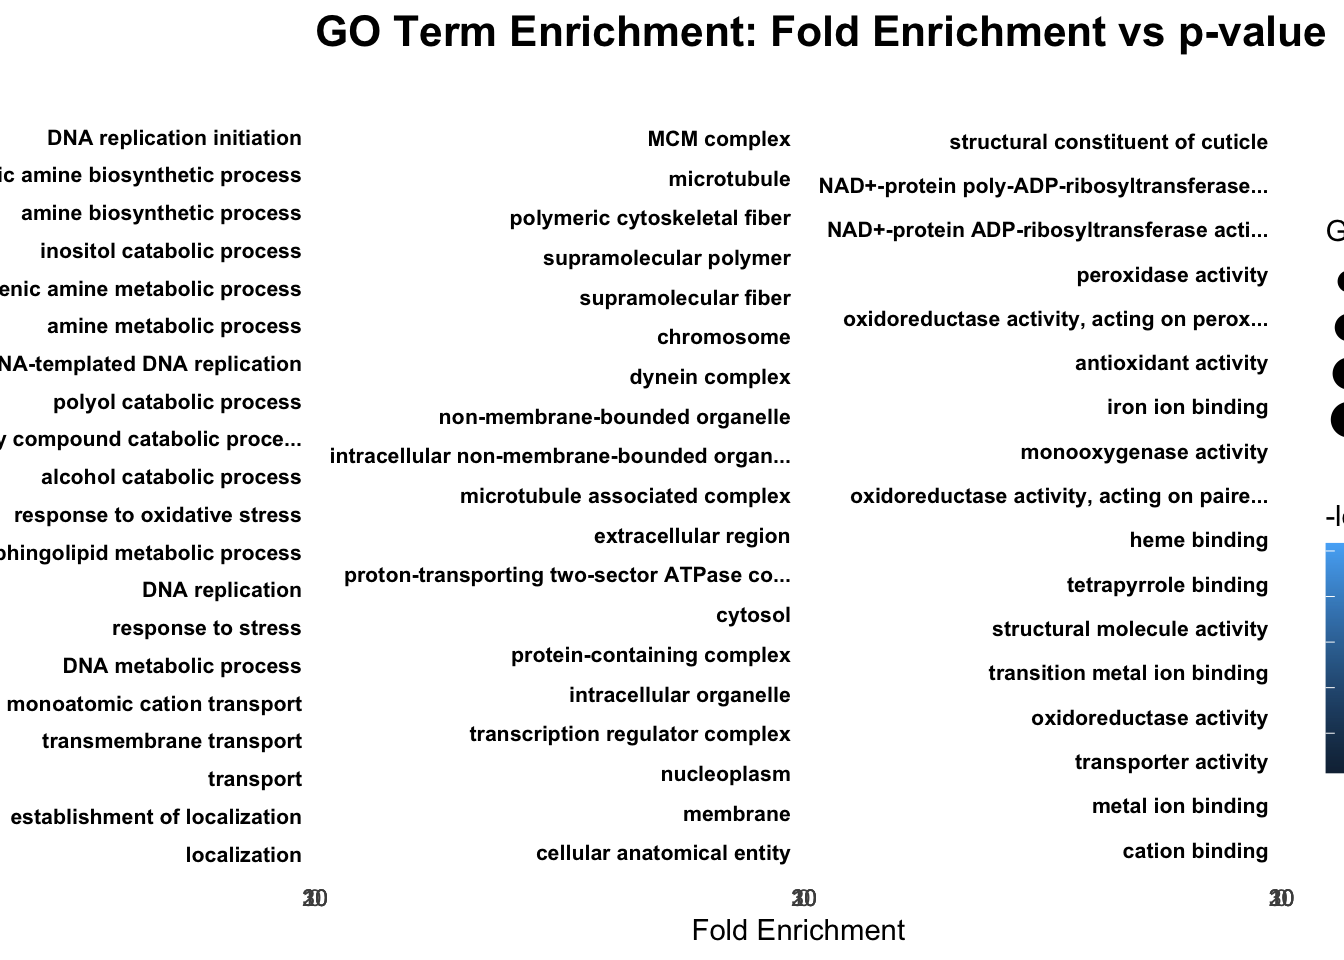
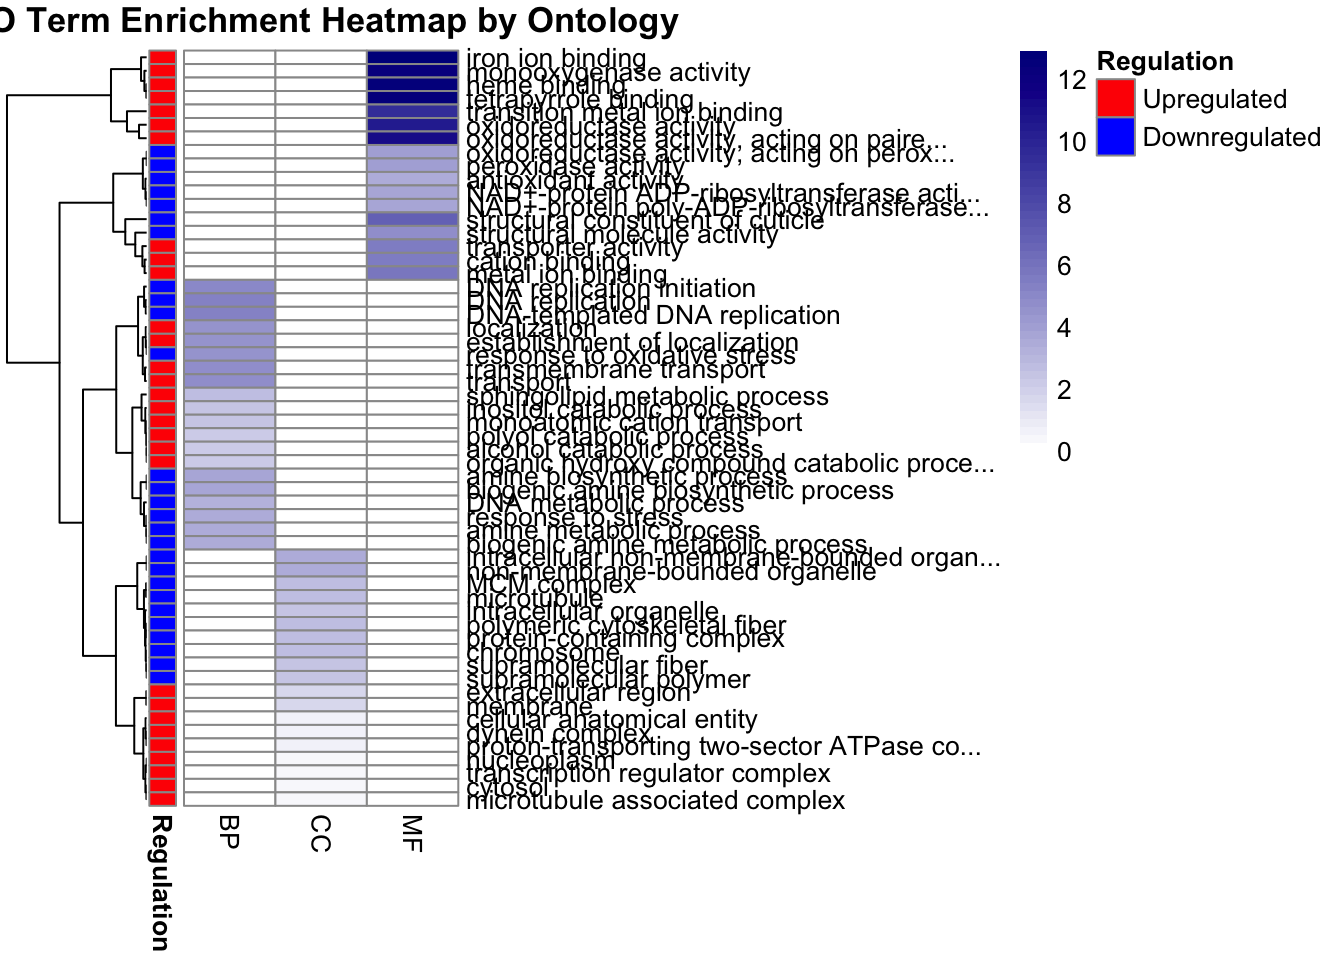
We can also plot the terms using a heatmap and informing on the regulation levels:
# Keep the row with the smallest classicFisher value for each Term and ontology pair
heatmap_data <- allRes %>%
    dplyr::group_by(Term, ontology) %>%
    dplyr::slice_min(order_by = classicFisher, n = 1) %>%
    dplyr::ungroup() %>%
    dplyr::select(Term, ontology, classicFisher, Regulation) %>%
    tidyr::spread(ontology, classicFisher) %>%
    tibble::column_to_rownames("Term")

# Verify heatmap data
str(heatmap_data)
'data.frame': 56 obs. of 4 variables:
$ Regulation: chr "Upregulated" "Downregulated" "Downregulated" "Downregulated" ...
$ BP : num 0.0049 0.00018 0.00039 NA 0.00018 0.00039 NA NA NA NA ...
$ CC : num NA NA NA NA NA NA NA 0.193 0.00242 0.334 ...
$ MF : num NA NA NA 2.9e-04 NA NA 2.1e-06 NA NA NA ...# Ensure Regulation exists
if (!"Regulation" %in% colnames(heatmap_data)) {
stop("Error: 'Regulation' column is missing from heatmap_data!")
}
# Create annotation data frame
annotation <- data.frame(Regulation = heatmap_data$Regulation)
rownames(annotation) <- rownames(heatmap_data)
# Ensure no NA values
annotation <- na.omit(annotation)
# Define annotation colors
annotation_colors <- list(
Regulation = c("Upregulated" = "red", "Downregulated" = "blue")
)
# Ensure annotation_colors matches annotation values
if (!all(unique(annotation$Regulation) %in% names(annotation_colors$Regulation))) {
stop("Error: annotation_colors does not match all values in annotation$Regulation")
}
# Create heatmap matrix
heatmap_matrix <- as.matrix(-log10(heatmap_data %>%
dplyr::select(-Regulation)))
# Replace NA values
heatmap_matrix[is.na(heatmap_matrix)] <- -log10(1)
# Plot heatmap
pheatmap(
heatmap_matrix,
cluster_rows = TRUE,
cluster_cols = FALSE,
color = colorRampPalette(c("white", "darkblue"))(50),
annotation_row = annotation,
main = "GO Term Enrichment Heatmap by Ontology",
annotation_colors = annotation_colors
)
1.3. Running the GO enrichment on all species
Head
# Define working directory and species list
workDir <- "/Users/maevatecher/Documents/GitHub/locust-comparative-genomics/data"
species_list <- c("gregaria", "piceifrons", "cancellata", "americana", "cubense", "nitens")

# Function to run the GO analysis for a given species
run_GO_analysis_for_species <- function(species) {
  # Load DESeq2 results for the species
  deg_file <- file.path(workDir, "DEG_results/Bulk_RNAseq/", paste0(species, "/Head/DESeq2_sigresults_sva_Head_", species ,".csv"))
  deg_data <- read.csv(deg_file, stringsAsFactors = FALSE)
  names(deg_data)[names(deg_data) == "X"] <- "GeneID"

  # Separate DEGs into upregulated and downregulated
  upregulated_genes <- subset(deg_data, padj < 0.05 & log2FoldChange > 1)$GeneID
  downregulated_genes <- subset(deg_data, padj < 0.05 & log2FoldChange < -1)$GeneID

  # Load the custom annotation file
  custom_annot_file <- file.path(workDir, "list/GO_Annotations", paste0("blast2go_", species, "_custom.txt"))
  custom_annot_df <- read.table(custom_annot_file, sep = "\t", header = TRUE, quote = "", fill = TRUE, stringsAsFactors = FALSE)

  # Prepare gene-to-GO mapping for topGO
  colnames(custom_annot_df) <- c("GeneID", "Description", "GO_Extended")

# Convert to data.table (if not already)
setDT(custom_annot_df)

# Split `GO_Extended` column efficiently
custom_annot_df[, c("Category", "GO_ID", "GO_Term") := tstrsplit(GO_Extended, " ", fixed = TRUE, keep = 1:3)]

# Extract first letter of `Category`
custom_annot_df[, Category := substr(Category, 1, 1)]

  gene2GO <- custom_annot_df %>%
    group_by(GeneID) %>%
    summarize(GOterms = list(unique(GO_ID))) %>%
    deframe()

  # Function to run topGO analysis by ontology
  run_topGO <- function(ontology, gene_set, gene2GO) {
    all_genes <- factor(as.integer(names(gene2GO) %in% gene_set), levels = c(0, 1))
    names(all_genes) <- names(gene2GO)
    GOdata <- new("topGOdata", ontology = ontology, allGenes = all_genes, annot = annFUN.gene2GO, gene2GO = gene2GO)
    resultFisher <- runTest(GOdata, algorithm = "classic", statistic = "fisher")
    GenTable(GOdata, classicFisher = resultFisher, orderBy = "classicFisher", topNodes = 30)
  }

  # Run topGO for each ontology category and regulation type
  allRes_up_BP <- run_topGO("BP", upregulated_genes, gene2GO) %>% mutate(Regulation = "Upregulated", ontology = "BP")
  allRes_up_MF <- run_topGO("MF", upregulated_genes, gene2GO) %>% mutate(Regulation = "Upregulated", ontology = "MF")
  allRes_up_CC <- run_topGO("CC", upregulated_genes, gene2GO) %>% mutate(Regulation = "Upregulated", ontology = "CC")

  allRes_down_BP <- run_topGO("BP", downregulated_genes, gene2GO) %>% mutate(Regulation = "Downregulated", ontology = "BP")
  allRes_down_MF <- run_topGO("MF", downregulated_genes, gene2GO) %>% mutate(Regulation = "Downregulated", ontology = "MF")
  allRes_down_CC <- run_topGO("CC", downregulated_genes, gene2GO) %>% mutate(Regulation = "Downregulated", ontology = "CC")

  # Combine all results with ontology labels
  allRes <- bind_rows(
    allRes_up_BP, allRes_up_MF, allRes_up_CC,
    allRes_down_BP, allRes_down_MF, allRes_down_CC
  )

  # Calculate FoldEnrichment and convert p-values
  allRes$classicFisher <- as.numeric(as.character(allRes$classicFisher))
  allRes$FoldEnrichment <- allRes$Significant / allRes$Expected

  # Export results for this species
  output_file <- file.path(enrichDir, paste0("GO30_enrichment_Head_", species, "_custom.csv"))
  write.csv(allRes, output_file, row.names = FALSE)

  return(allRes)
}

# Name each element in species_list
names(species_list) <- species_list

# Run the analysis for each species
results_list <- lapply(species_list, run_GO_analysis_for_species)

# Combine all results into a single table if desired
combined_results <- bind_rows(results_list, .id = "Species")
Thorax
# Define working directory and species list
workDir <- "/Users/maevatecher/Documents/GitHub/locust-comparative-genomics/data"
species_list <- c("gregaria", "piceifrons", "cancellata", "americana", "cubense", "nitens")

# Function to run the GO analysis for a given species
run_GO_analysis_for_species <- function(species) {
  # Load DESeq2 results for the species
  deg_file <- file.path(workDir, "DEG_results/Bulk_RNAseq/", paste0(species, "/Thorax/DESeq2_sigresults_sva_Thorax_", species ,".csv"))
  deg_data <- read.csv(deg_file, stringsAsFactors = FALSE)
  names(deg_data)[names(deg_data) == "X"] <- "GeneID"

  # Separate DEGs into upregulated and downregulated
  upregulated_genes <- subset(deg_data, padj < 0.05 & log2FoldChange > 1)$GeneID
  downregulated_genes <- subset(deg_data, padj < 0.05 & log2FoldChange < -1)$GeneID

  # Load the custom annotation file
  custom_annot_file <- file.path(workDir, "list/GO_Annotations", paste0("blast2go_", species, "_custom.txt"))
  custom_annot_df <- read.table(custom_annot_file, sep = "\t", header = TRUE, quote = "", fill = TRUE, stringsAsFactors = FALSE)

  # Prepare gene-to-GO mapping for topGO
  colnames(custom_annot_df) <- c("GeneID", "Description", "GO_Extended")

# Convert to data.table (if not already)
setDT(custom_annot_df)

# Split `GO_Extended` column efficiently
custom_annot_df[, c("Category", "GO_ID", "GO_Term") := tstrsplit(GO_Extended, " ", fixed = TRUE, keep = 1:3)]

# Extract first letter of `Category`
custom_annot_df[, Category := substr(Category, 1, 1)]

  gene2GO <- custom_annot_df %>%
    group_by(GeneID) %>%
    summarize(GOterms = list(unique(GO_ID))) %>%
    deframe()

  # Function to run topGO analysis by ontology
  run_topGO <- function(ontology, gene_set, gene2GO) {
    all_genes <- factor(as.integer(names(gene2GO) %in% gene_set), levels = c(0, 1))
    names(all_genes) <- names(gene2GO)
    GOdata <- new("topGOdata", ontology = ontology, allGenes = all_genes, annot = annFUN.gene2GO, gene2GO = gene2GO)
    resultFisher <- runTest(GOdata, algorithm = "classic", statistic = "fisher")
    GenTable(GOdata, classicFisher = resultFisher, orderBy = "classicFisher", topNodes = 30)
  }

  # Run topGO for each ontology category and regulation type
  allRes_up_BP <- run_topGO("BP", upregulated_genes, gene2GO) %>% mutate(Regulation = "Upregulated", ontology = "BP")
  allRes_up_MF <- run_topGO("MF", upregulated_genes, gene2GO) %>% mutate(Regulation = "Upregulated", ontology = "MF")
  allRes_up_CC <- run_topGO("CC", upregulated_genes, gene2GO) %>% mutate(Regulation = "Upregulated", ontology = "CC")

  allRes_down_BP <- run_topGO("BP", downregulated_genes, gene2GO) %>% mutate(Regulation = "Downregulated", ontology = "BP")
  allRes_down_MF <- run_topGO("MF", downregulated_genes, gene2GO) %>% mutate(Regulation = "Downregulated", ontology = "MF")
  allRes_down_CC <- run_topGO("CC", downregulated_genes, gene2GO) %>% mutate(Regulation = "Downregulated", ontology = "CC")

  # Combine all results with ontology labels
  allRes <- bind_rows(
    allRes_up_BP, allRes_up_MF, allRes_up_CC,
    allRes_down_BP, allRes_down_MF, allRes_down_CC
  )

  # Calculate FoldEnrichment and convert p-values
  allRes$classicFisher <- as.numeric(as.character(allRes$classicFisher))
  allRes$FoldEnrichment <- allRes$Significant / allRes$Expected

  # Export results for this species
  output_file <- file.path(enrichDir, paste0("GO30_enrichment_Thorax_", species, "_custom.csv"))
  write.csv(allRes, output_file, row.names = FALSE)

  return(allRes)
}

# Name each element in species_list
names(species_list) <- species_list

# Run the analysis for each species
results_list <- lapply(species_list, run_GO_analysis_for_species)

# Combine all results into a single table if desired
combined_results <- bind_rows(results_list, .id = "Species")
2. GO term enrichment with EggNOG
2.1. Install and Load Required Packages
Devon used EggNOG on each of the six genomes of Schistocerca
in data/list/GO_Annotations and build these types of files
GCF_023864275.1_iqSchCanc2.1_Arthopoda_one2one.emapper.annotations.
We also will need the gff from NCBI FTP of the six folders which we will
place in data/RefSeq.
He then make the DesertLocustR_0.1.0 package which
includes three functions in R lift_annotations(),
GO_enrichment(), and KEGG_enrichment().
Before installing the package we need to install all dependencies, with the script below:
To install the package from a local source, we then run the following in R:
#install.packages("/Users/maevatecher/Documents/GitHub/locust-comparative-genomics/data/list/GO_Annotations/DesertLocustR_0.1.0.tar.gz", repos = NULL, type = "source")

# === Load Required Libraries ===
library(data.table)
library(dplyr)
library(readr)
library(clusterProfiler)
library(GO.db)
library(rtracklayer)
library(DesertLocustR)  # Local installation

# Check functions
?lift_annotaitons
?GO_enrichment
?KEGG_enrichment
2.2. Define Constants and Paths
# === Paths and Constants ===
workDir     <- "/Users/maevatecher/Documents/GitHub/locust-comparative-genomics/data"
GODir       <- file.path(workDir, "list", "GO_Annotations")
RefDir      <- file.path(workDir, "RefSeq")
enrichDir   <- file.path(workDir, "pathway_enrichment")
degDir      <- file.path(workDir, "DEG_results", "Bulk_RNAseq")

species_list <- c("gregaria", "cancellata", "piceifrons", "americana", "cubense", "nitens")
tissues      <- c("Head", "Thorax")

gff_map <- c(
  gregaria   = "GCF_023897955.1_iqSchGreg1.2_genomic.gff",
  cancellata = "GCF_023864275.1_iqSchCanc2.1_genomic.gff",
  piceifrons = "GCF_021461385.2_iqSchPice1.1_genomic.gff",
  americana  = "GCF_021461395.2_iqSchAmer2.1_genomic.gff",
  cubense    = "GCF_023864345.2_iqSchSeri2.2_genomic.gff",
  nitens     = "GCF_023898315.1_iqSchNite1.1_genomic.gff"
)

annot_map <- c(
  gregaria   = "EggNog_Arthropoda_one2one.emapper.annotations",
  cancellata = "GCF_023864275.1_iqSchCanc2.1_Arthopoda_one2one.emapper.annotations",
  piceifrons = "GCF_021461385.2_iqSchPice1.1_Arthopoda_one2one.emapper.annotations",
  americana  = "GCF_021461395.2_iqSchAmer2.1_Arthopoda_one2one.emapper.annotations",
  cubense    = "GCF_023864345.2_iqSchSeri2.2_Arthopoda_one2one.emapper.annotations",
  nitens     = "GCF_023898315.1_iqSchNite1.1_Arthopoda_one2one.emapper.annotations"
)
2.3. Define Functions GO/KEGG
# GO enrichment
enrich_GO <- function(dge_genes.df, term2gene, term2name, pval, qval){
  genes <- rownames(dge_genes.df)
  enricher(genes, TERM2GENE = term2gene, TERM2NAME = term2name, pvalueCutoff = pval,
           pAdjustMethod = "BH", qvalueCutoff = qval)
}

# KEGG preparation
assign_kegg_ids <- function(sig_genes.df){
  sig_genes.df$X.query <- rownames(sig_genes.df)
  dge_with_kegg_ids <- left_join(sig_genes.df, kegg_final, by = "X.query")
  dge_with_kegg_ids$KEGG_ko[grepl("^K", dge_with_kegg_ids$KEGG_ko)]
}

# KEGG enrichment
enrich_KEGG <- function(dge_genes.df, pval, qval){
  gene_with_kegg_ids <- assign_kegg_ids(dge_genes.df)
  enrichKEGG(gene_with_kegg_ids, organism = "ko",
             pvalueCutoff = pval, qvalueCutoff = qval,
             pAdjustMethod = "BH")
}
2.4. GO & KEGG Result Export
run_GO_enrichment <- function(deg_filtered, go_table, term2name, species, suffix, ontology, output_dir, show_n = 30, top_n = 30) {
  if (nrow(deg_filtered) == 0) return(NULL)

  go_result <- enrich_GO(deg_filtered, go_table, term2name, 0.05, 0.2)

  if (!is.null(go_result) && inherits(go_result, "enrichResult") &&
      nrow(go_result@result) > 0 && sum(!is.na(go_result@result$Description)) > 0) {
    try({
      pdf(file = file.path(output_dir, paste0("GO_", ontology, "_dotplot_", species, "_", suffix, ".pdf")),
          width = 8, height = 6)
      print(dotplot(go_result, showCategory = min(show_n, nrow(go_result@result))) +
              ggtitle(paste(ontology, suffix)))
      dev.off()
    }, silent = TRUE)

    species_enrich_ready <- go_result@result[, c("ID", "p.adjust")]
    species_enrich_ready$logp <- -log10(species_enrich_ready$p.adjust)
    species_enrich_ready <- species_enrich_ready[order(-species_enrich_ready$logp), ][1:min(nrow(species_enrich_ready), top_n), ]
    species_enrich_ready <- species_enrich_ready[, c("ID", "logp")]

    write.table(species_enrich_ready,
                file = file.path(output_dir, paste0("enrich_", ontology, "_GOs_", species, "_", suffix, ".txt")),
                sep = "\t", quote = FALSE, row.names = FALSE, col.names = FALSE)
  }
}

run_KEGG_enrichment <- function(deg_filtered, species, tissue, output_dir, show_n = 40, top_n = 40) {
  if (nrow(deg_filtered) == 0) return(NULL)

  kegg_result <- enrich_KEGG(deg_filtered, 0.05, 0.2)

  if (!is.null(kegg_result) && inherits(kegg_result, "enrichResult") &&
      nrow(kegg_result@result) > 0) {
    try({
      pdf(file = file.path(output_dir, paste0("KEGG_dotplot_", species, "_", tissue, ".pdf")),
          width = 8, height = 6)
      print(dotplot(kegg_result, showCategory = min(show_n, nrow(kegg_result@result))) +
              ggtitle(paste("KEGG", tissue)))
      dev.off()
    }, silent = TRUE)

    write.csv(kegg_result@result,
              file = file.path(output_dir, paste0("KEGG_enrichment_", species, "_", tissue, ".csv")),
              row.names = FALSE)

    species_enrich_kegg <- kegg_result@result[, c("ID", "p.adjust")]
    species_enrich_kegg$logp <- -log10(species_enrich_kegg$p.adjust)
    species_enrich_kegg <- species_enrich_kegg[order(-species_enrich_kegg$logp), ][1:min(nrow(species_enrich_kegg), top_n), ]
    species_enrich_kegg <- species_enrich_kegg[, c("ID", "logp")]

    write.table(species_enrich_kegg,
                file = file.path(output_dir, paste0("enrich_KEGG_", species, "_", tissue, ".txt")),
                sep = "\t", quote = FALSE, row.names = FALSE, col.names = FALSE)
  } else {
    message(paste("⚠️ No KEGG enrichment result to plot/export for", species, "-", tissue))
  }
}
2.5. Running the loop for all species
for (species in species_list) {
  cat("⏳ Processing species:", species, "\n")

  eggnog_path <- file.path(GODir, annot_map[[species]])
  gff_path    <- file.path(RefDir,  gff_map[[species]])

  if (!file.exists(eggnog_path)) {
    warning(paste("Missing EggNOG file for", species)); next
  }

  if (!file.exists(gff_path)) {
    warning(paste("Missing GFF file for", species)); next
  }

  # === Annotation Prep ===
  eggnog_annots <- read.delim(eggnog_path, sep = "\t", skip = 4, header = TRUE)
  eggnog_annots <- eggnog_annots[1:(nrow(eggnog_annots) - 3), ]

  gff.df <- as.data.frame(import(gff_path))
  protein_2_gene <- unique(gff.df[c("Name", "gene")])
  protein_2_gene_df <- subset(protein_2_gene, grepl("^XP", protein_2_gene$Name))
  eggnog_annots$Name <- eggnog_annots$X.query
  eggnog_annots <- left_join(eggnog_annots, protein_2_gene_df, by = "Name")
  eggnog_annots$X.query <- eggnog_annots$gene

  # === GO tables ===
  GO_terms <- data.table(eggnog_annots[, c("X.query", "GOs")])
  GO_terms <- GO_terms[, .(GOs = unlist(strsplit(GOs, ","))), by = X.query]
  term2name <- GO_terms[, .(GOs, X.query)]
  term2name$Names <- mapIds(GO.db, keys = term2name$GOs, column = "TERM", keytype = "GOID", multiVals = "first")
  term2name$Ontology <- mapIds(GO.db, keys = term2name$GOs, column = "ONTOLOGY", keytype = "GOID", multiVals = "first")
  term2name <- as.data.frame(term2name)

  go_bp <- term2name[term2name$Ontology == "BP", c("GOs", "X.query")]
  go_mf <- term2name[term2name$Ontology == "MF", c("GOs", "X.query")]
  go_cc <- term2name[term2name$Ontology == "CC", c("GOs", "X.query")]
  term2name_filtered <- term2name[c("GOs", "Names")]

  # === KEGG table ===
KO_terms <- data.table(eggnog_annots[, c("X.query", "KEGG_ko")])
KO_terms$KEGG_ko <- gsub("ko:", "", as.character(KO_terms$KEGG_ko))
KO_terms <- KO_terms[, .(KEGG_ko = unlist(strsplit(KEGG_ko, ","))), by = X.query]
kegg_final <- KO_terms[, .(KEGG_ko, X.query)]

for (tissue in tissues) {
  deg_path <- file.path(degDir, species, tissue, paste0("DESeq2_sigresults_sva_", tissue, "_", species, ".csv"))
  if (!file.exists(deg_path)) next

  deg_df <- read.csv(deg_path, row.names = 1)
  deg_all  <- deg_df[deg_df$padj < 0.05 & abs(deg_df$log2FoldChange) > 1, ]
  deg_up   <- deg_df[deg_df$padj < 0.05 & deg_df$log2FoldChange >= 1, ]
  deg_down <- deg_df[deg_df$padj < 0.05 & deg_df$log2FoldChange <= -1, ]
  deg_sets <- list(ALL = deg_all, UP = deg_up, DOWN = deg_down)

  output_dir <- file.path(enrichDir, species, tissue)
  if (!dir.exists(output_dir)) dir.create(output_dir, recursive = TRUE)

  ontologies <- list(BP = go_bp, MF = go_mf, CC = go_cc)
  for (onto in names(ontologies)) {
    for (suffix in names(deg_sets)) {
      # GO enrichment
      run_GO_enrichment(deg_sets[[suffix]], ontologies[[onto]], term2name_filtered, species, suffix, onto, output_dir)

      # NEW: run KEGG enrichment for each DEG subset
      if (onto == "BP") {
        tissue_suffix <- paste0(tissue, "_", suffix)
        run_KEGG_enrichment(deg_sets[[suffix]], species, tissue_suffix, output_dir)
      }
    }
  }
}
}
⏳ Processing species: gregaria ⏳ Processing species: cancellata ⏳ Processing species: piceifrons ⏳ Processing species: americana ⏳ Processing species: cubense ⏳ Processing species: nitens 2.6. Running the loop on overlap
# === Paths and Constants ===
overlapDir  <- file.path(workDir, "overlap", "Locusts")

species_list <- c("gregaria", "cancellata", "piceifrons")
tissues      <- c("Head", "Thorax")

gff_map <- c(
  gregaria   = "GCF_023897955.1_iqSchGreg1.2_genomic.gff",
  cancellata = "GCF_023864275.1_iqSchCanc2.1_genomic.gff",
  piceifrons = "GCF_021461385.2_iqSchPice1.1_genomic.gff"
)

annot_map <- c(
  gregaria   = "EggNog_Arthropoda_one2one.emapper.annotations",
  cancellata = "GCF_023864275.1_iqSchCanc2.1_Arthopoda_one2one.emapper.annotations",
  piceifrons = "GCF_021461385.2_iqSchPice1.1_Arthopoda_one2one.emapper.annotations"
)

# === GO enrichment ===
enrich_GO <- function(gene_ids, term2gene, term2name, pval, qval){
  enricher(gene_ids, TERM2GENE = term2gene, TERM2NAME = term2name,
           pvalueCutoff = pval, pAdjustMethod = "BH", qvalueCutoff = qval)
}

# === KEGG enrichment ===
assign_kegg_ids <- function(gene_ids){
  dge_with_kegg_ids <- data.frame(X.query = gene_ids) %>%
    left_join(kegg_final, by = "X.query")
  dge_with_kegg_ids$KEGG_ko[grepl("^K", dge_with_kegg_ids$KEGG_ko)]
}

enrich_KEGG <- function(gene_ids, pval, qval){
  gene_with_kegg_ids <- assign_kegg_ids(gene_ids)
  enrichKEGG(gene_with_kegg_ids, organism = "ko",
             pvalueCutoff = pval, qvalueCutoff = qval,
             pAdjustMethod = "BH")
}

run_GO_enrichment <- function(gene_ids, go_table, term2name, species, suffix, ontology, output_dir, show_n = 30, top_n = 30) {
  if (length(gene_ids) == 0) return(NULL)

  go_result <- enrich_GO(gene_ids, go_table, term2name, 0.05, 0.2)

  if (!is.null(go_result) && inherits(go_result, "enrichResult") &&
      nrow(go_result@result) > 0 && sum(!is.na(go_result@result$Description)) > 0) {
    try({
      pdf(file = file.path(output_dir, paste0("GO_", ontology, "_dotplot_", species, "_", suffix, ".pdf")),
          width = 8, height = 6)
      print(dotplot(go_result, showCategory = min(show_n, nrow(go_result@result))) +
              ggtitle(paste(ontology, suffix)))
      dev.off()
    }, silent = TRUE)

    species_enrich_ready <- go_result@result[, c("ID", "p.adjust")]
    species_enrich_ready$logp <- -log10(species_enrich_ready$p.adjust)
    species_enrich_ready <- species_enrich_ready[order(-species_enrich_ready$logp), ][1:min(nrow(species_enrich_ready), top_n), ]
    species_enrich_ready <- species_enrich_ready[, c("ID", "logp")]

    write.table(species_enrich_ready,
                file = file.path(output_dir, paste0("enrich_", ontology, "_GOs_", species, "_", suffix, ".txt")),
                sep = "\t", quote = FALSE, row.names = FALSE, col.names = FALSE)
  }
}

run_KEGG_enrichment <- function(gene_ids, species, tissue, output_dir, show_n = 40, top_n = 40) {
  if (length(gene_ids) == 0) return(NULL)

  kegg_result <- enrich_KEGG(gene_ids, 0.05, 0.2)

  if (!is.null(kegg_result) && inherits(kegg_result, "enrichResult") &&
      nrow(kegg_result@result) > 0) {
    try({
      pdf(file = file.path(output_dir, paste0("KEGG_dotplot_", species, "_", tissue, ".pdf")),
          width = 8, height = 6)
      print(dotplot(kegg_result, showCategory = min(show_n, nrow(kegg_result@result))) +
              ggtitle(paste("KEGG", tissue)))
      dev.off()
    }, silent = TRUE)

    write.csv(kegg_result@result,
              file = file.path(output_dir, paste0("KEGG_enrichment_", species, "_", tissue, ".csv")),
              row.names = FALSE)

    species_enrich_kegg <- kegg_result@result[, c("ID", "p.adjust")]
    species_enrich_kegg$logp <- -log10(species_enrich_kegg$p.adjust)
    species_enrich_kegg <- species_enrich_kegg[order(-species_enrich_kegg$logp), ][1:min(nrow(species_enrich_kegg), top_n), ]
    species_enrich_kegg <- species_enrich_kegg[, c("ID", "logp")]

    write.table(species_enrich_kegg,
                file = file.path(output_dir, paste0("enrich_KEGG_", species, "_", tissue, ".txt")),
                sep = "\t", quote = FALSE, row.names = FALSE, col.names = FALSE)
  } else {
    message(paste("\u26a0\ufe0f No KEGG enrichment result to plot/export for", species, "-", tissue))
  }
}

# === Run enrichment ===
for (species in species_list) {
  cat("\u23f3 Processing species:", species, "\n")

  eggnog_path <- file.path(GODir, annot_map[[species]])
  gff_path    <- file.path(RefDir,  gff_map[[species]])

  if (!file.exists(eggnog_path)) {
    warning(paste("Missing EggNOG file for", species)); next
  }

  if (!file.exists(gff_path)) {
    warning(paste("Missing GFF file for", species)); next
  }

  # === Annotation Prep ===
  eggnog_annots <- read.delim(eggnog_path, sep = "\t", skip = 4, header = TRUE)
  eggnog_annots <- eggnog_annots[1:(nrow(eggnog_annots) - 3), ]

  gff.df <- as.data.frame(import(gff_path))
  protein_2_gene <- unique(gff.df[c("Name", "gene")])
  protein_2_gene_df <- subset(protein_2_gene, grepl("^XP", protein_2_gene$Name))
  eggnog_annots$Name <- eggnog_annots$X.query
  eggnog_annots <- left_join(eggnog_annots, protein_2_gene_df, by = "Name")
  eggnog_annots$X.query <- eggnog_annots$gene

  # === GO tables ===
  GO_terms <- data.table(eggnog_annots[, c("X.query", "GOs")])
  GO_terms <- GO_terms[, .(GOs = unlist(strsplit(GOs, ","))), by = X.query]
  term2name <- GO_terms[, .(GOs, X.query)]
  term2name$Names <- mapIds(GO.db, keys = term2name$GOs, column = "TERM", keytype = "GOID", multiVals = "first")
  term2name$Ontology <- mapIds(GO.db, keys = term2name$GOs, column = "ONTOLOGY", keytype = "GOID", multiVals = "first")
  term2name <- as.data.frame(term2name)

  go_bp <- term2name[term2name$Ontology == "BP", c("GOs", "X.query")]
  go_mf <- term2name[term2name$Ontology == "MF", c("GOs", "X.query")]
  go_cc <- term2name[term2name$Ontology == "CC", c("GOs", "X.query")]
  term2name_filtered <- term2name[c("GOs", "Names")]

  # === KEGG table ===
  KO_terms <- data.table(eggnog_annots[, c("X.query", "KEGG_ko")])
  KO_terms$KEGG_ko <- gsub("ko:", "", as.character(KO_terms$KEGG_ko))
  KO_terms <- KO_terms[, .(KEGG_ko = unlist(strsplit(KEGG_ko, ","))), by = X.query]
  kegg_final <- KO_terms[, .(KEGG_ko, X.query)]

  for (tissue in tissues) {
    deg_path <- file.path(overlapDir, paste0(species, "_", tissue, "_overlaplist.csv"))
    if (!file.exists(deg_path)) next

    deg_df <- read.csv(deg_path)
    deg_all <- unique(deg_df$GeneID)
    deg_sets <- list(ALL = deg_all)

    output_dir <- file.path(overlapDir, species, tissue)
    if (!dir.exists(output_dir)) dir.create(output_dir, recursive = TRUE)

    ontologies <- list(BP = go_bp, MF = go_mf, CC = go_cc)
    for (onto in names(ontologies)) {
      for (suffix in names(deg_sets)) {
        run_GO_enrichment(deg_sets[[suffix]], ontologies[[onto]], term2name_filtered, species, suffix, onto, output_dir)
        if (suffix == "ALL" && onto == "BP") {
          run_KEGG_enrichment(deg_sets[[suffix]], species, tissue, output_dir)
        }
      }
    }
  }
}
⏳ Processing species: gregaria ⏳ Processing species: cancellata ⏳ Processing species: piceifrons 3. Summarizing GO terms in a semantic space
3.1. Quick check and file formatting
Once we have created a file with the top 30 GO terms per tissues and
per species we can go ahead and make a cross-species comparison. Most of
the time, enriched GO terms associated with genes differentially
expressed are very redundant and difficult to interpret. Aside from the
KEGG pathways enrichment, we can also summarize GO terms using semantic
similarity either with REVIGO, or similarly
inspired R package like rrvgo
or GO-Figure!.
Here we are going to use REVIGO and tweak it so the
matrix score is not related to p-value or logFoldChange but rather
associated to one tissue and one species. rrvgo is great
but needs us to build a custom org.db database.
First we can generate the files with different scores or do it by hand:
# === Define paths and parameters ===
enrichDir <- "/Users/maevatecher/Documents/GitHub/locust-comparative-genomics/data/pathway_enrichment"
species_list <- c("gregaria", "cancellata", "piceifrons")
tissues <- c("Head", "Thorax")
ontologies <- c("BP", "MF", "CC")

# === Loop over ontologies ===
for (onto in ontologies) {
  cat("🔍 Combining top 30 terms per species/tissue for", onto, "\n")

  # Step 1: Read all top-30 GO term tables directly
  cross_species_top <- map_dfr(tissues, function(tissue) {
    map_dfr(species_list, function(sp) {
      file_path <- file.path(enrichDir, sp, tissue, paste0("enrich_", onto, "_GOs_", sp, "_ALL.txt"))
      if (file.exists(file_path)) {
        read_tsv(file_path, col_names = c("GO_ID", "logp")) %>%
          mutate(Species = sp, Tissue = tissue)
      } else {
        message("⚠️ Missing file: ", file_path)
        NULL
      }
    })
  })

  # Skip to next ontology if no data
  if (nrow(cross_species_top) == 0) {
    message("⚠️ No data found for ontology: ", onto)
    next
  }

  # === Save long format table ===
  write_csv(
    cross_species_top,
    file.path(enrichDir, paste0("cross_species_GO_terms_", onto, "_ALL.csv"))
  )

  # === Save matrix format for heatmap ===
  heatmap_df <- cross_species_top %>%
    unite("Species_Tissue", Species, Tissue) %>%
    pivot_wider(names_from = Species_Tissue, values_from = logp) %>%
    replace(is.na(.), 0)

  write_csv(
    heatmap_df,
    file.path(enrichDir, paste0("cross_species_GO_terms_matrix_", onto, ".csv"))
  )
}
🔍 Combining top 30 terms per species/tissue for BP 🔍 Combining top 30 terms per species/tissue for MF 🔍 Combining top 30 terms per species/tissue for CC Now we plot the heatmaps just to check the list quickly:
heatmap_plots <- list()

for (onto in ontologies) {
  cat("🖼️ Creating heatmap for", onto, "\n")

  matrix_file <- file.path(enrichDir, paste0("cross_species_top30_GO_terms_matrix_", onto, ".csv"))
  if (!file.exists(matrix_file)) {
    message("⚠️ Missing matrix file for ", onto)
    next
  }

  # === Read and annotate ===
  heatmap_df <- read_csv(matrix_file)

  go_table <- AnnotationDbi::select(
    GO.db,
    keys = unique(heatmap_df$GO_ID),
    columns = c("TERM"),
    keytype = "GOID"
  )

  heatmap_df <- heatmap_df %>%
    left_join(go_table, by = c("GO_ID" = "GOID")) %>%
    mutate(GO_Term = str_wrap(TERM, width = 30))  # Wrapping just GO name

  # === Long format ===
  heatmap_long <- heatmap_df %>%
    pivot_longer(cols = -c(GO_ID, TERM, GO_Term),
                 names_to = "Species_Tissue",
                 values_to = "logp") %>%
    filter(!is.na(logp)) %>%
    mutate(
      GO_Term = fct_reorder(GO_Term, logp, .fun = max, .desc = TRUE),
      Species_Tissue = factor(Species_Tissue, levels = unique(Species_Tissue))
    )

  # === Identify shared GO terms ===
  shared_terms <- heatmap_long %>%
    group_by(GO_ID) %>%
    summarize(n_st = n_distinct(Species_Tissue), .groups = "drop") %>%
    filter(n_st > 1)

  heatmap_long <- heatmap_long %>%
    mutate(shared = GO_ID %in% shared_terms$GO_ID)

  # === Plot ===
  p <- ggplot(heatmap_long, aes(x = Species_Tissue, y = GO_Term, fill = logp)) +
    geom_tile(aes(color = shared), size = 0.4) +
    scale_fill_gradient(low = "white", high = "firebrick", name = "-log10(p.adj)") +
    scale_color_manual(values = c(`TRUE` = "black", `FALSE` = NA), guide = "none") +
    labs(
      title = paste("Top 30", onto, "GO Terms"),
      x = "Species-Tissue", y = "GO Term"
    ) +
    theme_minimal(base_size = 11) +
    theme(
      axis.text.x = element_text(angle = 45, hjust = 1),
      panel.grid = element_blank(),
      axis.text.y = element_text(size = 8)
    )

  ggsave(
    filename = file.path(enrichDir, paste0("cross_species_top30_heatmap_", onto, ".pdf")),
    plot = p, width = 9, height = 7
  )

  heatmap_plots[[onto]] <- p
}
🖼️ Creating heatmap for BP 🖼️ Creating heatmap for MF 🖼️ Creating heatmap for CC # === Display all plots in RMarkdown ===
wrap_plots(heatmap_plots, ncol = 1)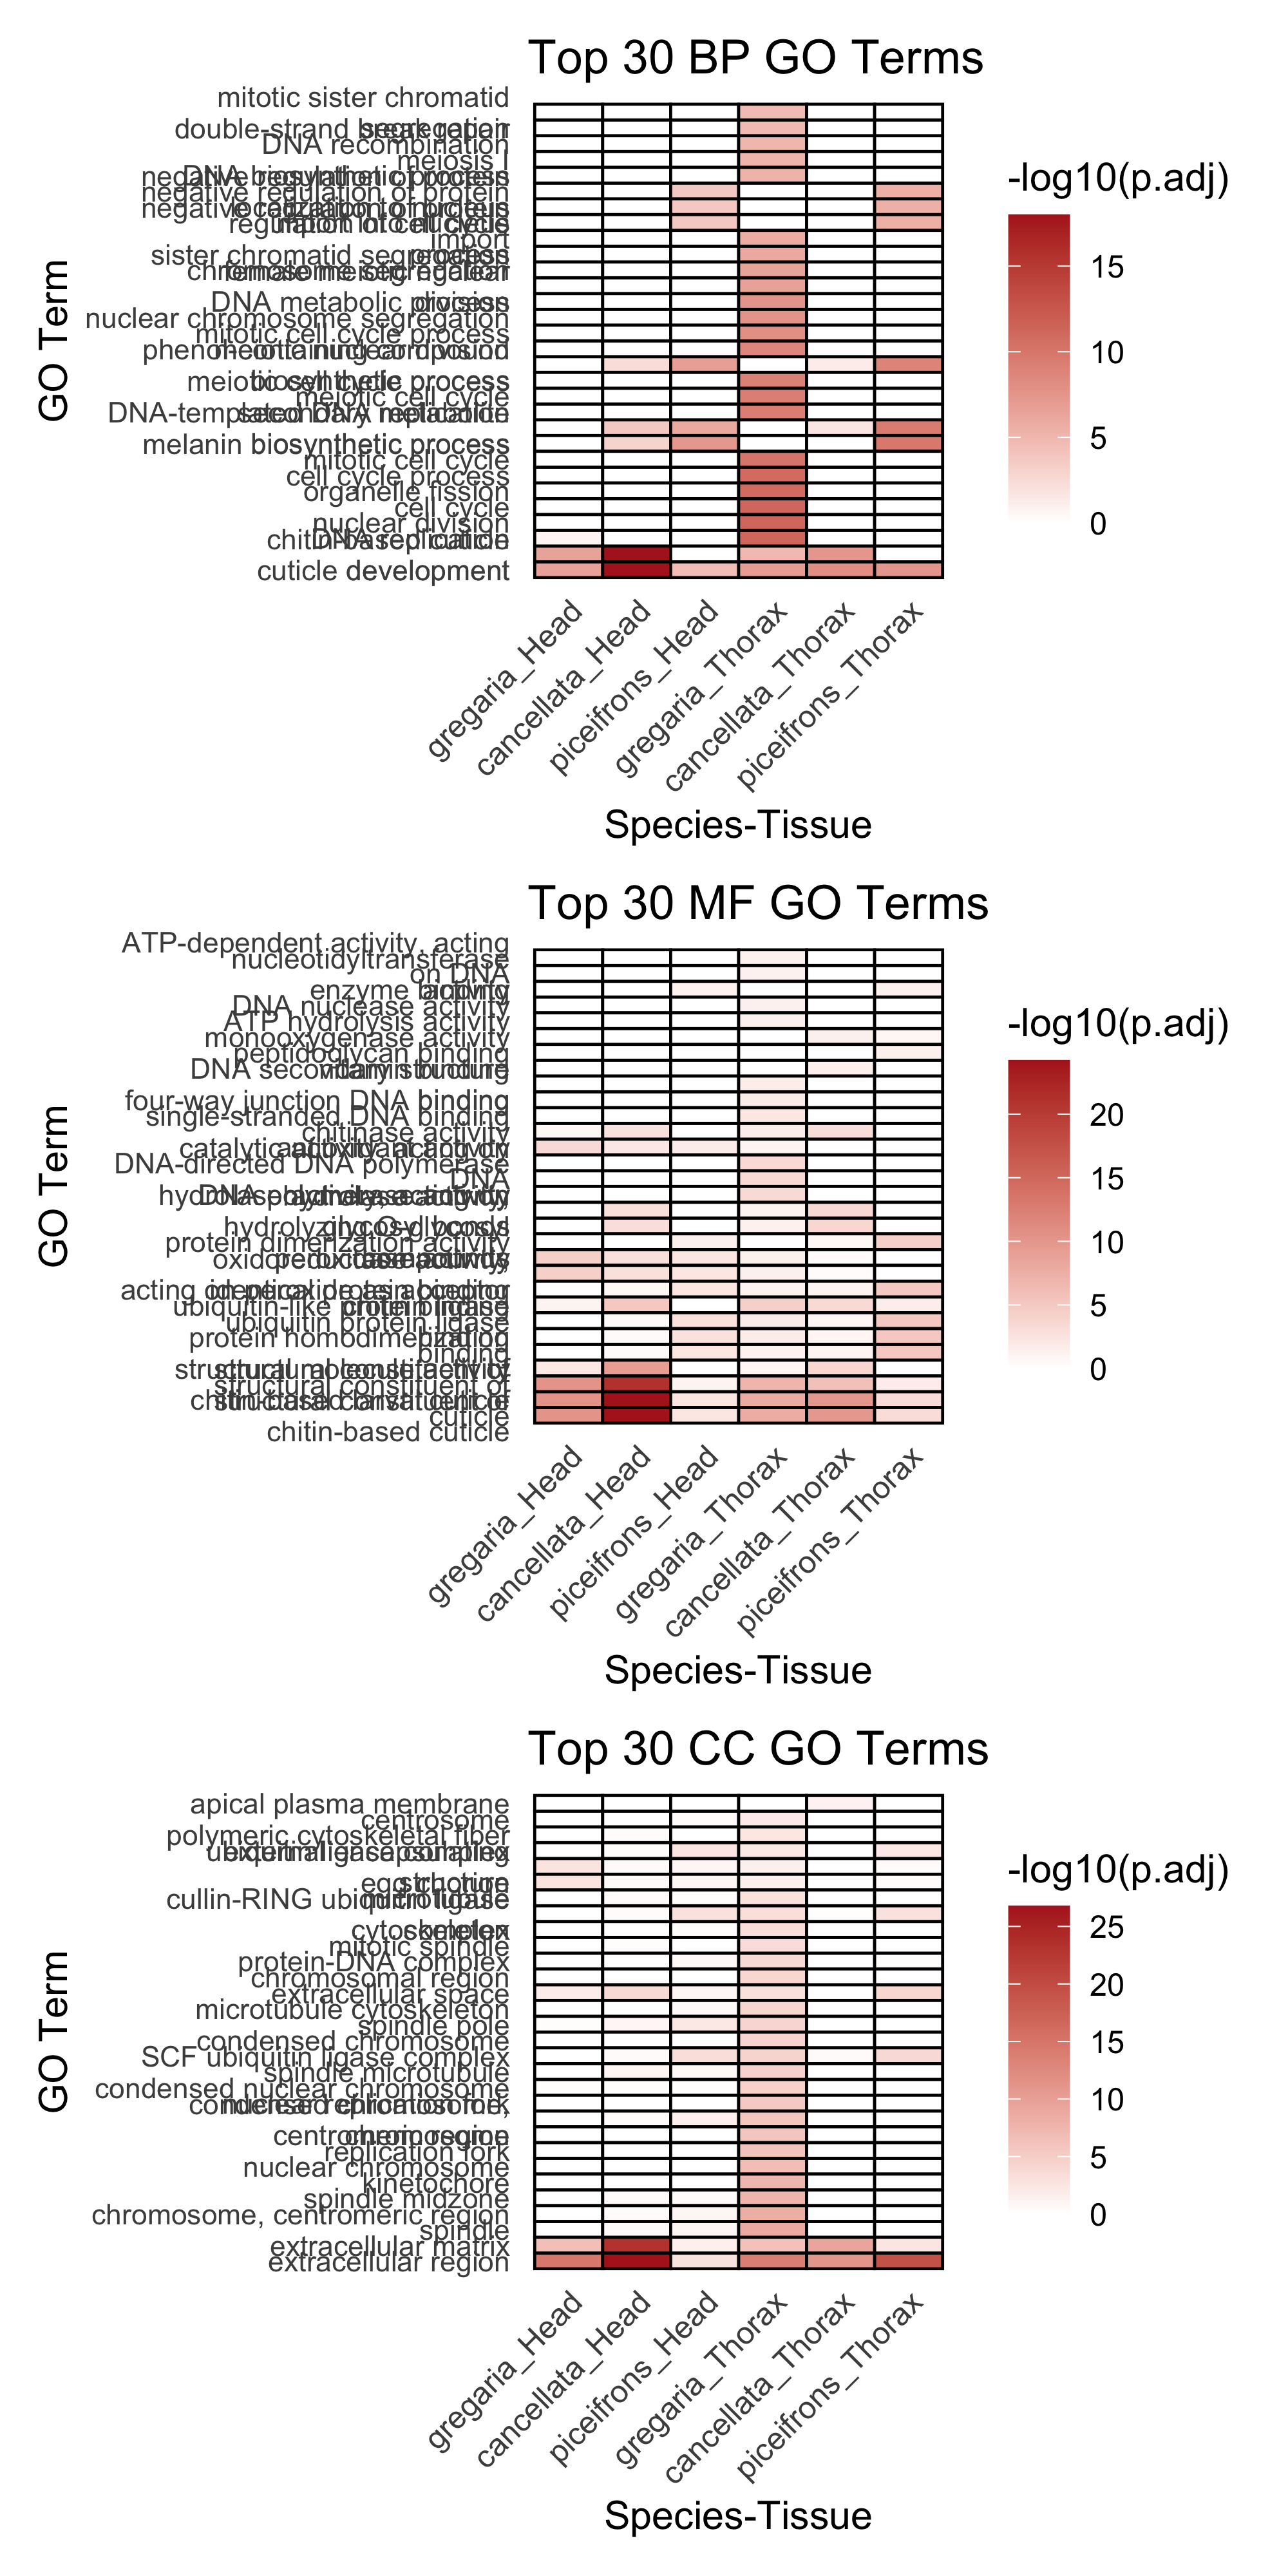
3.2. Running REVIGO
I decided to collate the top 30 GO terms per species and per tissues by myself while adding also the results of the enrichment for the shared genes. In this way, GO terms (without keeping the logp value) that were: - unique to one species (concatenating head and thorax) were coded as species-specific. In some case we would have GO terms for Head only, Thorax only or Shared but they would be all coded with the species value score for REVIGO scatterplot plotting. - shared with at least two species, which were coded as locust.
In our table we attributed the score this way: - gregaria = 1 -
piceifrons = 2
- cancellata = 3 - locust-overlap = 4 - locust-shared = 5
Below is the example of the matrix generated:
| GO_ID | Score | logp | Species | Tissue |
|---|---|---|---|---|
| GO:0043207 | 1 | 0.736484 | cancellata | Head |
| GO:1901136 | 1 | 1.907278 | cancellata | Head |
| GO:0006022 | 1 | 0.922916 | cancellata | shared |
| GO:0006026 | 1 | 1.371220 | cancellata | shared |
| GO:0022404 | 1 | 1.371220 | cancellata | shared |
| GO:0001736 | 1 | 1.317834 | cancellata | Thorax |
| GO:0003382 | 1 | 1.326424 | cancellata | Thorax |
| GO:0003383 | 1 | 1.680496 | cancellata | Thorax |
| GO:0007164 | 1 | 1.317834 | cancellata | Thorax |
| GO:0007591 | 1 | 1.317834 | cancellata | Thorax |
| GO:0016476 | 1 | 1.317834 | cancellata | Thorax |
| GO:0031589 | 1 | 1.922457 | cancellata | Thorax |
| GO:0042067 | 1 | 1.616769 | cancellata | Thorax |
| GO:0042303 | 1 | 1.317834 | cancellata | Thorax |
| GO:0045879 | 1 | 1.317834 | cancellata | Thorax |
| GO:0070252 | 1 | 1.616769 | cancellata | Thorax |
| GO:0006637 | 2 | 0.344995 | gregaria | Head |
| GO:0006811 | 2 | 0.344995 | gregaria | Head |
| GO:0007623 | 2 | 0.293607 | gregaria | Head |
| GO:0030431 | 2 | 0.293607 | gregaria | Head |
| GO:0035383 | 2 | 0.344995 | gregaria | Head |
| GO:0045187 | 2 | 0.293607 | gregaria | Head |
| GO:0048511 | 2 | 0.293607 | gregaria | Head |
| GO:0097164 | 2 | 0.293607 | gregaria | Head |
| GO:0006260 | 2 | 0.649423 | gregaria | shared |
| GO:0097305 | 2 | 0.344995 | gregaria | shared |
| GO:0000070 | 2 | 4.714657 | gregaria | Thorax |
| GO:0000278 | 2 | 10.069361 | gregaria | Thorax |
| GO:0000280 | 2 | 11.272136 | gregaria | Thorax |
| GO:0000819 | 2 | 6.036858 | gregaria | Thorax |
| GO:0006259 | 2 | 7.587470 | gregaria | Thorax |
| GO:0006261 | 2 | 9.302264 | gregaria | Thorax |
| GO:0006302 | 2 | 4.801917 | gregaria | Thorax |
| GO:0006310 | 2 | 5.008506 | gregaria | Thorax |
| GO:0007049 | 2 | 11.257149 | gregaria | Thorax |
| GO:0007059 | 2 | 6.448863 | gregaria | Thorax |
| GO:0007127 | 2 | 5.115993 | gregaria | Thorax |
| GO:0007143 | 2 | 6.606235 | gregaria | Thorax |
| GO:0010564 | 2 | 5.753206 | gregaria | Thorax |
| GO:0022402 | 2 | 10.850991 | gregaria | Thorax |
| GO:0048285 | 2 | 10.851326 | gregaria | Thorax |
We copy-paste this list in REVIGO using the following
parameters:
- Medium threshold
- indicating arbitrary that higher value is better for score (not used
for semantic similarity)
- remove obsolete GO terms
- use the default SimRel algorith against the whole UniProt database
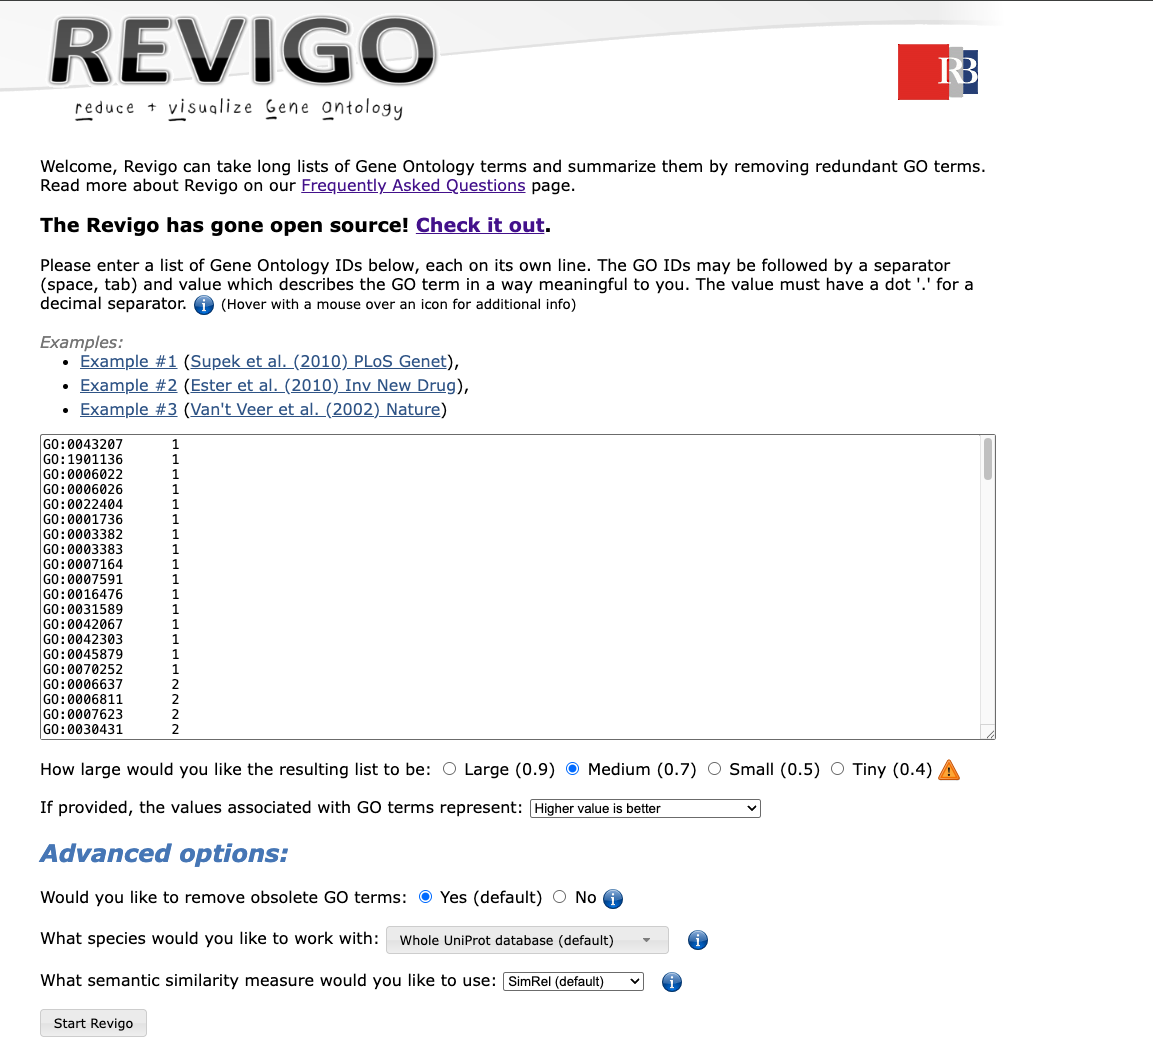
We then go on the scatterplot and select the terms we want to appear on the future graph, and export the R script on the bottom:
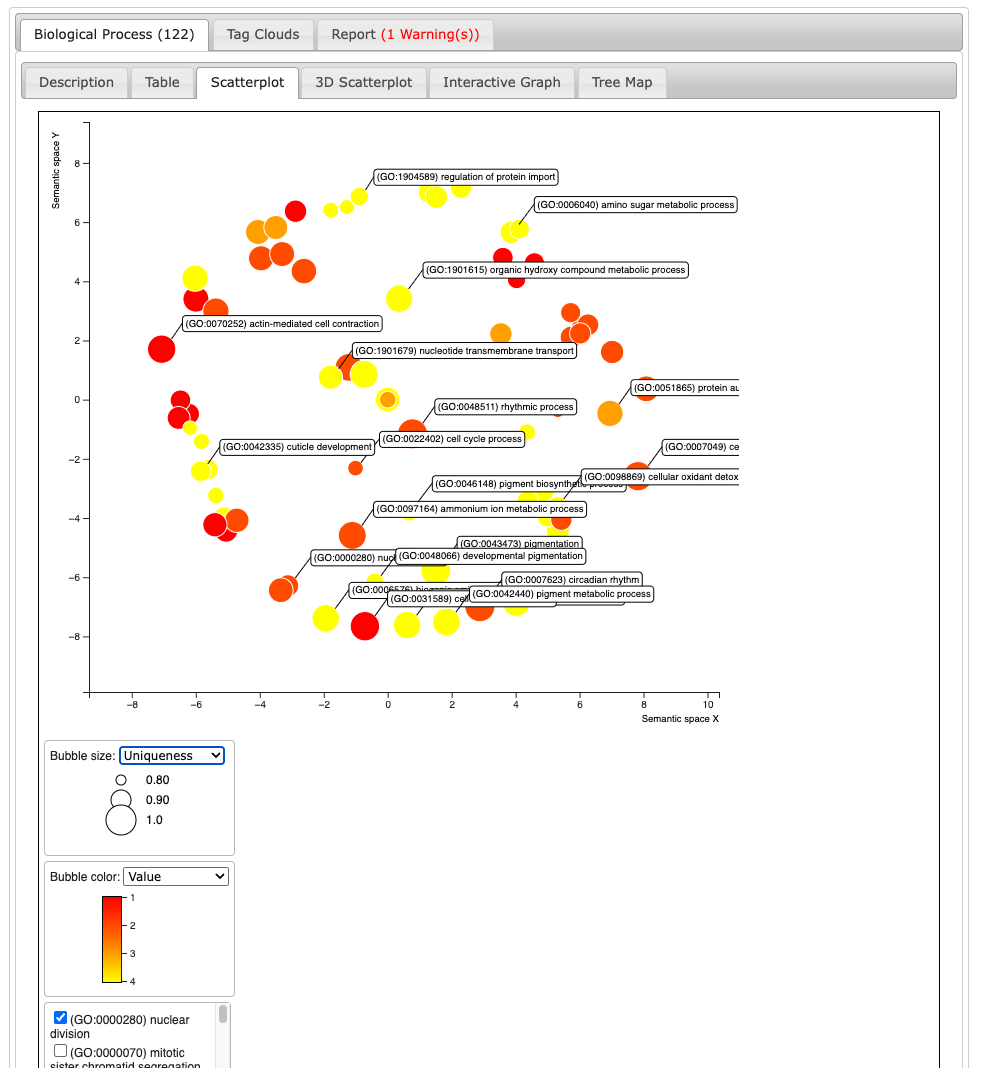
3.3. REVIGO Scatterplots results
We want to make the plot values make sense with the species so we will modify the coloring and other graphical aspect of the bubbles for each process:
BP
Biological Processes
The larger processes, or “biological programs” accomplished by multiple molecular activities. Examples of broad biological process terms are DNA repair or signal transduction. Examples of more specific terms are pyrimidine nucleobase biosynthetic process or glucose transmembrane transport. Note that a biological process is not equivalent to a pathway. At present, the GO does not try to represent the dynamics or dependencies that would be required to fully describe a pathway.
The following graph is with Medium threshold:
# A plotting R script produced by the Revigo server at http://revigo.irb.hr/
# If you found Revigo useful in your work, please cite the following reference:
# Supek F et al. "REVIGO summarizes and visualizes long lists of Gene Ontology terms" PLoS ONE 2011. doi:10.1371/journal.pone.0021800

# Load required packages
library(ggplot2)
library(scales)

# Define column names and data matrix
revigo.names <- c("term_ID","description","frequency","plot_X","plot_Y","log_size","value","uniqueness","dispensability");
revigo.data <- rbind(c("GO:0000280","nuclear division",0.43374453844241945,-4.044604872871782,-6.195160523496234,5.24606259034848,1,0.9203633143023929,0.0145439),
c("GO:0001736","establishment of planar polarity",0.012597204365790324,-5.532367162302316,-3.3636131051284583,3.7091851295502454,3,0.9142437325647337,0.34386795),
c("GO:0003383","apical constriction",0.0006399517653586332,-4.7987894684420755,-3.465176928232046,2.416640507338281,3,0.9076691857816676,0.69789184),
c("GO:0006022","aminoglycan metabolic process",1.0723474823879122,4.803722570177969,4.3299754348749335,5.639162639867929,3,0.9034636008747918,0.56823322),
c("GO:0006026","aminoglycan catabolic process",0.23307781700244523,4.227552889971272,3.7953483538973996,4.976331634603942,3,0.885217306898431,0.43359455),
c("GO:0006040","amino sugar metabolic process",0.3589095635425583,4.12473585693988,5.395711155835499,5.163814115597508,4,0.9249021956414294,0.04675586),
c("GO:0006259","DNA metabolic process",5.572970721566783,5.839273926888814,1.7668754947002228,6.3549130597720795,1,0.9199632948846261,0.44921146),
c("GO:0006260","DNA replication",1.4421509940592292,6.1937960811682435,2.0500757432532857,5.767837581402916,1,0.9156297053292961,0.66164169),
c("GO:0006261","DNA-templated DNA replication",0.8777086143070274,6.382819053261924,2.158987036811364,5.552177685196805,1,0.9193041593736468,0.62403964),
c("GO:0006302","double-strand break repair",0.7311276624516326,5.32059142806106,-0.6974544171577215,5.472820784475008,1,0.8424858862325634,0.5572529),
c("GO:0006310","DNA recombination",1.827734239452524,6.130277511200447,1.8797804382554986,5.870739739053611,1,0.913783022508282,0.61482406),
c("GO:0006515","protein quality control for misfolded or incompletely synthesized proteins",0.15183594039016676,3.659421488502199,1.982256971973892,4.790207730237464,2,0.9253356348813432,0.5151125),
c("GO:0006576","biogenic amine metabolic process",0.5549686322719504,-0.004190621313091041,-7.6999238249724336,5.35309646946214,5,0.9750527320547442,0.04894618),
c("GO:0006637","acyl-CoA metabolic process",0.4982787512729502,7.098883642481972,1.2081366405235368,5.306300619215061,1,0.9345859103184873,0.27177693),
c("GO:0006811","monoatomic ion transport",4.917982551075166,-1.300496606645125,1.0681996977267068,6.300613307421874,1,0.9767174309447683,0.33192004),
c("GO:0006820","monoatomic anion transport",0.5148633474075136,-1.5341832440602141,0.5927318031780507,5.3205201586614885,5,0.9799486131656947,0.22281075),
c("GO:0007049","cell cycle",2.051845347681118,-2.6035406946052717,-7.298094014247026,5.920971251397435,1,0.9923269777276804,0.01898308),
c("GO:0007164","establishment of tissue polarity",0.01264397007172038,-5.819041203673994,-3.5166289869824765,3.7107940999303275,3,0.9299814494139796,0.46327057),
c("GO:0007304","chorion-containing eggshell formation",0.0025081186496171046,-5.636795805417369,-2.951292387758833,3.0086001717619175,5,0.848294398106928,0.60600549),
c("GO:0007306","egg chorion assembly",0.0011346837070397304,-5.3788357715930175,-3.7321025393351324,2.6646419755561257,5,0.8629891444201249,0.58221055),
c("GO:0007552","metamorphosis",0.00751943324296394,-6.105933230536611,-1.6197230849587683,3.485153349903652,5,0.9051328026153795,0.39274887),
c("GO:0007610","behavior",0.1060966186376303,-6.41458855741391,0.1102428392489389,4.6345377245814365,5,0.9383282967613209,0.37499273),
c("GO:0007623","circadian rhythm",0.07992013008151853,7.731156046565456,-3.0169555170571396,4.511495663673566,1,1,-0),
c("GO:0009308","amine metabolic process",0.6775809291617207,3.7196816694270893,-7.113690631277297,5.439788858197747,5,0.9746183372601386,0.05001938),
c("GO:0009607","response to biotic stimulus",0.9712178739906423,4.735183871369976,-3.377557944324624,5.596143873584628,5,0.9319879109296256,0.31714106),
c("GO:0009636","response to toxic substance",1.0264457113410923,5.025423282225043,-4.050343739141898,5.620163132442645,5,0.8986402479626618,0.63919829),
c("GO:0010564","regulation of cell cycle process",0.6468238627774074,-3.8114712347748134,4.8908397279878955,5.4196137927680255,1,0.9515886829663438,0.21679232),
c("GO:0016476","regulation of embryonic cell shape",0.0005144227652305936,-5.944641426138607,3.5854325536027765,2.322219294733919,3,0.9607435392943682,0.30655905),
c("GO:0019098","reproductive behavior",0.014864110426926098,-6.266470145288718,-0.705076926050926,3.7810369386211318,5,0.8664520083013199,0.40983691),
c("GO:0019748","secondary metabolic process",0.6368553833554749,2.5448710332836497,-7.434568730549327,5.412868609276585,5,0.9747548268922844,0.04968112),
c("GO:0022402","cell cycle process",1.8491578554743764,0.4060957599850953,-3.88017256867666,5.875800671392008,1,0.858638604260016,0.01693195),
c("GO:0022404","molting cycle process",0.009198075950558507,-6.16196461394471,0.3865587388311474,3.572639297042813,3,0.9368476986264557,0.39765148),
c("GO:0030431","sleep",0.011191771834945019,-6.586180047420198,0.47742575789792935,3.6578204560156973,1,0.9446904403651594,0.4025437),
c("GO:0031589","cell-substrate adhesion",0.22749792987910672,1.2407681031649302,-7.747882714342551,4.965808254379985,3,0.9936653152233844,0.01368493),
c("GO:0031648","protein destabilization",0.004789792828415001,-5.115831107698028,3.290954097369007,3.2893659515200318,4,0.9641496933951281,0.07874843),
c("GO:0035383","thioester metabolic process",0.4982787512729502,8.114294966825488,-0.07798666149984847,5.306300619215061,1,0.9579526250577883,0.68809034),
c("GO:0042303","molting cycle",0.020793509668268203,-6.742011410141778,0.141412897709861,3.926805310111606,3,0.9430435514770823,0.41881322),
c("GO:0042306","regulation of protein import into nucleus",0.005528198711521116,-1.000459956424539,6.464597513174297,3.351603072419129,4,0.8513240574194825,0.68376658),
c("GO:0042335","cuticle development",0.0034680462976550545,-5.903485563000276,-1.5435189368796238,3.1492191126553797,5,0.9084619004205097,-0),
c("GO:0042440","pigment metabolic process",0.481708923256049,-1.263299323445723,-7.675104961475257,5.29161301693988,5,0.9753519587674996,0.04821255),
c("GO:0043065","positive regulation of apoptotic process",0.14442726802966876,-3.8026193393361725,5.743579633946291,4.768482704043391,2,0.9502843718096744,0.13443282),
c("GO:0043473","pigmentation",0.043122903573397126,-1.6051121177530674,-6.117316324436138,4.24355888962248,5,1,-0),
c("GO:0044550","secondary metabolite biosynthetic process",0.46700972347634995,2.5993166220177044,6.956733287145932,5.278154318435337,5,0.9133518702809249,0.17672197),
c("GO:0045187","regulation of circadian sleep/wake cycle, sleep",0.0014817344720996044,-6.048330989154471,4.063471768895951,2.780317312140151,1,0.9628036658511914,0.40477353),
c("GO:0045471","response to ethanol",0.004935012652092536,5.1499845819607675,-4.753776327091216,3.302330928684399,5,0.9278307329068086,0.40800794),
c("GO:0045879","negative regulation of smoothened signaling pathway",0.01173326948255617,-2.6022743423172576,6.36925602519119,3.67833624673218,3,0.9252037996614233,0.09661721),
c("GO:0046148","pigment biosynthetic process",0.44087261656733717,1.6474395417813048,-6.177563660323333,5.25314165596348,5,0.8885215104661132,0.04776458),
c("GO:0046189","phenol-containing compound biosynthetic process",0.07071713142507265,1.6194741466900162,6.847003424122477,4.458365857761262,5,0.9289008568177316,0.6713704),
c("GO:0046677","response to antibiotic",0.32127301568063965,4.852159087421879,-4.271662483283184,5.115703683637,5,0.9078022559540678,0.56902982),
c("GO:0048066","developmental pigmentation",0.023939118730300253,0.004890253886584211,-5.686828401537474,3.987978915875482,5,0.8811300665639379,-0),
c("GO:0048285","organelle fission",0.5008139448049479,-4.27086942028559,-6.150426248563704,5.3085046539438085,1,0.9484833282072216,0.47432026),
c("GO:0048511","rhythmic process",0.13974577473077598,-0.9400558887782225,-2.3988362552143006,4.754172441415161,1,1,-0),
c("GO:0051707","response to other organism",0.9426071073732241,4.250220432370971,-3.7087498458954906,5.58315795063656,5,0.9125079064821305,0.31025914),
c("GO:0051726","regulation of cell cycle",0.9785034787039558,-3.1365445222559822,4.922843608790608,5.5993895729336165,1,0.9502374701580993,0.1876856),
c("GO:0051783","regulation of nuclear division",0.1342471122545791,-2.4307293982213674,4.37927599611249,4.736739021533997,1,0.9562060640831007,0.15934251),
c("GO:0051865","protein autoubiquitination",0.026011577908884753,6.944397816488774,-0.8600349874843958,4.024033897900905,2,0.9629166684099913,0.03683097),
c("GO:0070252","actin-mediated cell contraction",0.020682748785802285,-2.5732086658262414,-4.1387827708468405,3.924486043733915,3,0.9833712783489073,0.00961515),
c("GO:0071630","nuclear protein quality control by the ubiquitin-proteasome system",0.005446974064379443,4.345061135373658,-1.390562284879986,3.345177616542704,4,0.8675924895748699,0.23279871),
c("GO:0071897","DNA biosynthetic process",0.7699653505500705,5.85912959472983,2.592924253416382,5.4952986766316325,1,0.9034078302127245,0.18587457),
c("GO:0097164","ammonium ion metabolic process",0.03849556003926547,0.5251277732549116,3.3740277980709297,4.194264516025517,1,0.9796960577886287,0.03803692),
c("GO:0097305","response to alcohol",0.06957260230625817,5.272160173893265,-4.39517919445122,4.451279718904047,1,0.91474391877154,0.54281438),
c("GO:0098869","cellular oxidant detoxification",0.7902075171589529,5.183709220239396,-3.894347799732332,5.506568616038737,5,0.8780144818940214,0.01255665),
c("GO:1901071","glucosamine-containing compound metabolic process",0.16436668822647757,4.382029859223924,5.491293835122046,4.824646414718352,4,0.8998774553583297,0.42101696),
c("GO:1901136","carbohydrate derivative catabolic process",1.245173840681842,3.8345848988406175,4.555809933698198,5.704056953207529,3,0.9071567090256398,0.50613591),
c("GO:1901615","organic hydroxy compound metabolic process",1.6412842926152864,0.790515374699221,-1.2445223160287358,5.82401057106121,5,0.9724988999886642,-0),
c("GO:1901617","organic hydroxy compound biosynthetic process",0.8333107299088005,1.818502365690546,6.679434878683641,5.529634363247561,5,0.9277597821225819,0.05118243),
c("GO:1901679","nucleotide transmembrane transport",0.08522926838105149,-0.5799976130468237,0.9410977691983398,4.539427408845252,5,0.9420536498650476,0),
c("GO:1902533","positive regulation of intracellular signal transduction",0.412717200244501,-3.238439352317262,5.851059850271292,5.224481265303632,2,0.9407528222932182,0.5502835),
c("GO:1903828","negative regulation of protein localization",0.030806293443187124,-1.507255001639861,6.375032207380582,4.097500252231686,4,0.8602349620563929,0.57032705),
c("GO:1904589","regulation of protein import",0.00015752658839597125,-0.5957613949609292,6.795098584996391,1.8129133566428555,4,0.8854841358076434,-0));

# Convert to data frame
one.data <- data.frame(revigo.data)
names(one.data) <- revigo.names

# Filter out rows with null coordinates
one.data <- one.data[one.data$plot_X != "null" & one.data$plot_Y != "null", ]

# Ensure numeric conversion
one.data$plot_X <- as.numeric(as.character(one.data$plot_X))
one.data$plot_Y <- as.numeric(as.character(one.data$plot_Y))
one.data$log_size <- as.numeric(as.character(one.data$log_size))
one.data$value <- as.factor(one.data$value)
one.data$frequency <- as.numeric(as.character(one.data$frequency))
one.data$uniqueness <- as.numeric(as.character(one.data$uniqueness))
one.data$dispensability <- as.numeric(as.character(one.data$dispensability))

# Base plot
p1 <- ggplot(data = one.data) +
geom_point(aes(plot_X, plot_Y, color = value, size = uniqueness), alpha = 0.9) +
  scale_color_manual(
    values = c(
      "1" = "#FFC067",   # gregaria
      "2" = "#FF474C",   # piceifrons
      "3" = "orchid",    # cancellata
      "4" = "#895129",     # shared
      "5" = "gray50"     # overlap
    ),
    labels = c(
      "1" = "gregaria",
      "2" = "piceifrons",
      "3" = "cancellata",
      "4" = "shared",
      "5" = "overlap"
    ),
    name = "Species"
  ) +
  scale_size(range = c(5, 20))

# Add labels for representative terms
ex <- one.data[one.data$dispensability < 0.20, ]
p1 <- p1 + geom_text(data = ex, aes(plot_X, plot_Y, label = description),
                     colour = alpha("gray30", 0.95), fontface = "bold", size = 3)

#p1 + geom_text(data = one.data, aes(plot_X, plot_Y, label = description), colour = alpha("gray30", 0.95), fontface = "bold", size = 3)

# Customize axes and legend
p1 <- p1 +
  labs(x = "Semantic Space y", y = "Semantic Space x",
  title = "Semantic Clustering of BP GO Terms (Medium threshold)") +
  theme_bw() +
  theme(
    panel.border = element_blank(),
    legend.key = element_blank(),
    axis.title.x = element_text(size = 20, face = "bold", family = "Arial", color = "gray50"),
    axis.title.y = element_text(size = 20, face = "bold", family = "Arial", color = "gray50"),
    axis.text.x  = element_text(size = 12, angle = 0, hjust = 1),
    axis.text.y  = element_text(size = 12),
    legend.title = element_text(size = 10, face = "bold"),
    legend.text  = element_text(size = 12)
  )

# Adjust plot limits
one.x_range <- max(one.data$plot_X) - min(one.data$plot_X)
one.y_range <- max(one.data$plot_Y) - min(one.data$plot_Y)
p1 <- p1 +
  xlim(min(one.data$plot_X) - one.x_range / 10, max(one.data$plot_X) + one.x_range / 10) +
  ylim(min(one.data$plot_Y) - one.y_range / 10, max(one.data$plot_Y) + one.y_range / 10)

# Show plot
p1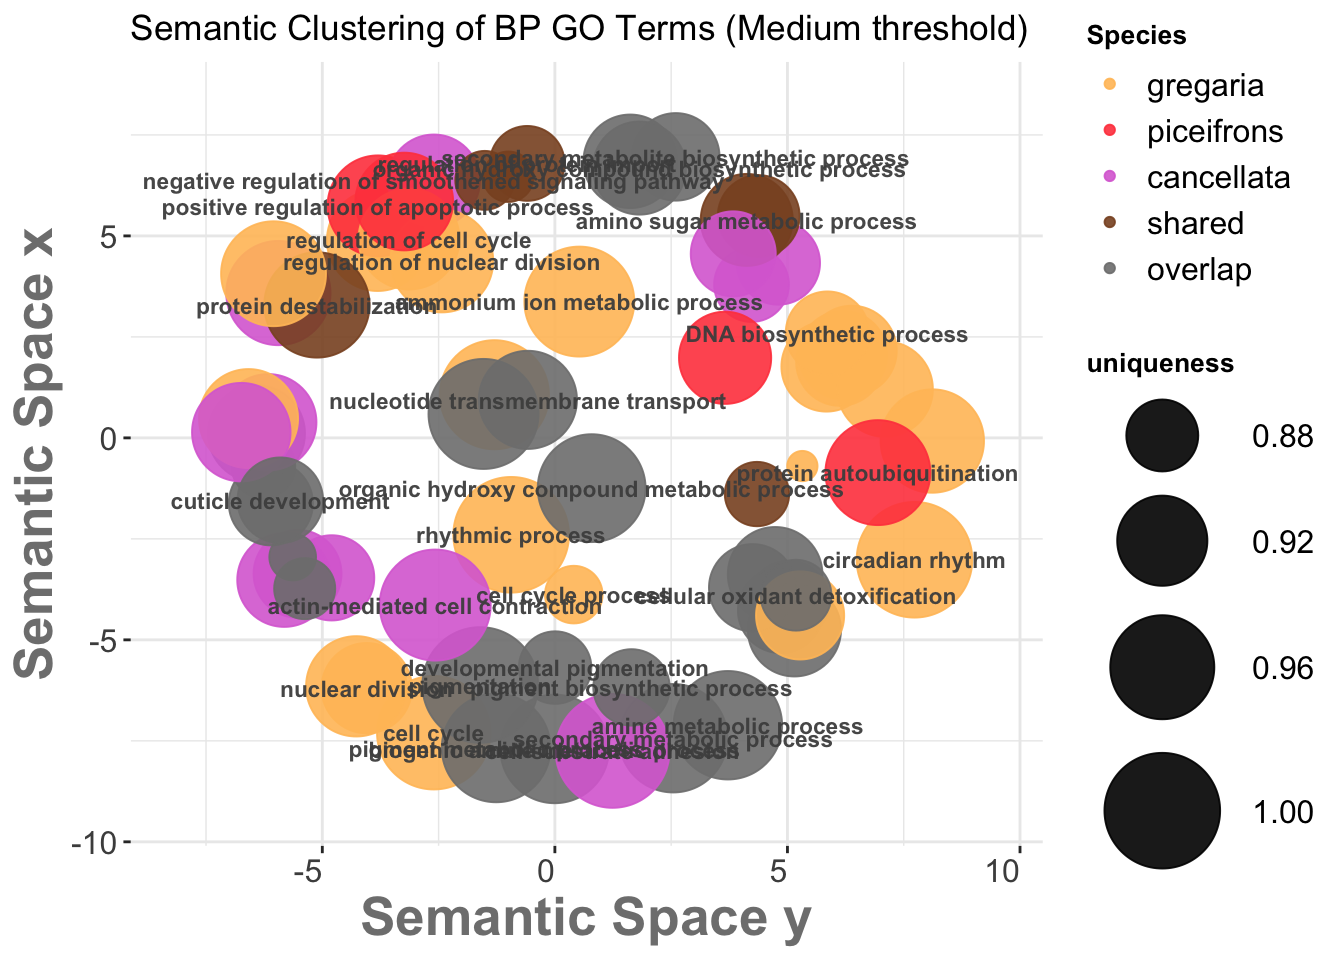
# Optional: Save to file
# ggsave("revigo-plot.pdf", plot = p1, width = 10, height = 8)
Below we do the Treemap view with Medium threshold, colored by Species Category instead of representative:
# A treemap R script produced by the Revigo server at http://revigo.irb.hr/
# If you found Revigo useful in your work, please cite the following reference:
# Supek F et al. "REVIGO summarizes and visualizes long lists of Gene Ontology
# terms" PLoS ONE 2011. doi:10.1371/journal.pone.0021800

# author: Anton Kratz <anton.kratz@gmail.com>, RIKEN Omics Science Center, Functional Genomics Technology Team, Japan
# created: Fri, Nov 02, 2012  7:25:52 PM
# last change: Fri, Nov 09, 2012  3:20:01 PM

# -----------------------------------------------------------------------------
# If you don't have the treemap package installed, uncomment the following line:
# install.packages( "treemap" );
library(treemap)                                # treemap package by Martijn Tennekes

# Set the working directory if necessary
# setwd("C:/Users/username/workingdir");

# --------------------------------------------------------------------------
# Here is your data from Revigo. Scroll down for plot configuration options.

revigo.names <- c("term_ID","description","frequency","value","uniqueness","dispensability","representative");
revigo.data <- rbind(c("GO:0000280","nuclear division",0.43374453844241945,1,0.9203633143023929,0.0145439,"nuclear division"),
c("GO:0048285","organelle fission",0.5008139448049479,1,0.9484833282072216,0.47432026,"nuclear division"),
c("GO:0006040","amino sugar metabolic process",0.3589095635425583,4,0.9249021956414294,0.04675586,"amino sugar metabolic process"),
c("GO:0006022","aminoglycan metabolic process",1.0723474823879122,3,0.9034636008747918,0.56823322,"amino sugar metabolic process"),
c("GO:0006026","aminoglycan catabolic process",0.23307781700244523,3,0.885217306898431,0.43359455,"amino sugar metabolic process"),
c("GO:0006515","protein quality control for misfolded or incompletely synthesized proteins",0.15183594039016676,2,0.9253356348813432,0.5151125,"amino sugar metabolic process"),
c("GO:1901071","glucosamine-containing compound metabolic process",0.16436668822647757,4,0.8998774553583297,0.42101696,"amino sugar metabolic process"),
c("GO:1901136","carbohydrate derivative catabolic process",1.245173840681842,3,0.9071567090256398,0.50613591,"amino sugar metabolic process"),
c("GO:0006576","biogenic amine metabolic process",0.5549686322719504,5,0.9750527320547442,0.04894618,"biogenic amine metabolic process"),
c("GO:0007049","cell cycle",2.051845347681118,1,0.9923269777276804,0.01898308,"cell cycle"),
c("GO:0007623","circadian rhythm",0.07992013008151853,1,1,-0,"circadian rhythm"),
c("GO:0009308","amine metabolic process",0.6775809291617207,5,0.9746183372601386,0.05001938,"amine metabolic process"),
c("GO:0019748","secondary metabolic process",0.6368553833554749,5,0.9747548268922844,0.04968112,"secondary metabolic process"),
c("GO:0022402","cell cycle process",1.8491578554743764,1,0.858638604260016,0.01693195,"cell cycle process"),
c("GO:0031589","cell-substrate adhesion",0.22749792987910672,3,0.9936653152233844,0.01368493,"cell-substrate adhesion"),
c("GO:0031648","protein destabilization",0.004789792828415001,4,0.9641496933951281,0.07874843,"protein destabilization"),
c("GO:0016476","regulation of embryonic cell shape",0.0005144227652305936,3,0.9607435392943682,0.30655905,"protein destabilization"),
c("GO:0045187","regulation of circadian sleep/wake cycle, sleep",0.0014817344720996044,1,0.9628036658511914,0.40477353,"protein destabilization"),
c("GO:0042335","cuticle development",0.0034680462976550545,5,0.9084619004205097,-0,"cuticle development"),
c("GO:0001736","establishment of planar polarity",0.012597204365790324,3,0.9142437325647337,0.34386795,"cuticle development"),
c("GO:0003383","apical constriction",0.0006399517653586332,3,0.9076691857816676,0.69789184,"cuticle development"),
c("GO:0007164","establishment of tissue polarity",0.01264397007172038,3,0.9299814494139796,0.46327057,"cuticle development"),
c("GO:0007304","chorion-containing eggshell formation",0.0025081186496171046,5,0.848294398106928,0.60600549,"cuticle development"),
c("GO:0007306","egg chorion assembly",0.0011346837070397304,5,0.8629891444201249,0.58221055,"cuticle development"),
c("GO:0007552","metamorphosis",0.00751943324296394,5,0.9051328026153795,0.39274887,"cuticle development"),
c("GO:0007610","behavior",0.1060966186376303,5,0.9383282967613209,0.37499273,"cuticle development"),
c("GO:0019098","reproductive behavior",0.014864110426926098,5,0.8664520083013199,0.40983691,"cuticle development"),
c("GO:0022404","molting cycle process",0.009198075950558507,3,0.9368476986264557,0.39765148,"cuticle development"),
c("GO:0030431","sleep",0.011191771834945019,1,0.9446904403651594,0.4025437,"cuticle development"),
c("GO:0042303","molting cycle",0.020793509668268203,3,0.9430435514770823,0.41881322,"cuticle development"),
c("GO:0042440","pigment metabolic process",0.481708923256049,5,0.9753519587674996,0.04821255,"pigment metabolic process"),
c("GO:0043473","pigmentation",0.043122903573397126,5,1,-0,"pigmentation"),
c("GO:0045879","negative regulation of smoothened signaling pathway",0.01173326948255617,3,0.9252037996614233,0.09661721,"negative regulation of smoothened signaling pathway"),
c("GO:0010564","regulation of cell cycle process",0.6468238627774074,1,0.9515886829663438,0.21679232,"negative regulation of smoothened signaling pathway"),
c("GO:0043065","positive regulation of apoptotic process",0.14442726802966876,2,0.9502843718096744,0.13443282,"negative regulation of smoothened signaling pathway"),
c("GO:0051726","regulation of cell cycle",0.9785034787039558,1,0.9502374701580993,0.1876856,"negative regulation of smoothened signaling pathway"),
c("GO:0051783","regulation of nuclear division",0.1342471122545791,1,0.9562060640831007,0.15934251,"negative regulation of smoothened signaling pathway"),
c("GO:1902533","positive regulation of intracellular signal transduction",0.412717200244501,2,0.9407528222932182,0.5502835,"negative regulation of smoothened signaling pathway"),
c("GO:0046148","pigment biosynthetic process",0.44087261656733717,5,0.8885215104661132,0.04776458,"pigment biosynthetic process"),
c("GO:0048066","developmental pigmentation",0.023939118730300253,5,0.8811300665639379,-0,"developmental pigmentation"),
c("GO:0048511","rhythmic process",0.13974577473077598,1,1,-0,"rhythmic process"),
c("GO:0051865","protein autoubiquitination",0.026011577908884753,2,0.9629166684099913,0.03683097,"protein autoubiquitination"),
c("GO:0070252","actin-mediated cell contraction",0.020682748785802285,3,0.9833712783489073,0.00961515,"actin-mediated cell contraction"),
c("GO:0097164","ammonium ion metabolic process",0.03849556003926547,1,0.9796960577886287,0.03803692,"ammonium ion metabolic process"),
c("GO:0098869","cellular oxidant detoxification",0.7902075171589529,5,0.8780144818940214,0.01255665,"cellular oxidant detoxification"),
c("GO:0009607","response to biotic stimulus",0.9712178739906423,5,0.9319879109296256,0.31714106,"cellular oxidant detoxification"),
c("GO:0009636","response to toxic substance",1.0264457113410923,5,0.8986402479626618,0.63919829,"cellular oxidant detoxification"),
c("GO:0045471","response to ethanol",0.004935012652092536,5,0.9278307329068086,0.40800794,"cellular oxidant detoxification"),
c("GO:0046677","response to antibiotic",0.32127301568063965,5,0.9078022559540678,0.56902982,"cellular oxidant detoxification"),
c("GO:0051707","response to other organism",0.9426071073732241,5,0.9125079064821305,0.31025914,"cellular oxidant detoxification"),
c("GO:0071630","nuclear protein quality control by the ubiquitin-proteasome system",0.005446974064379443,4,0.8675924895748699,0.23279871,"cellular oxidant detoxification"),
c("GO:0097305","response to alcohol",0.06957260230625817,1,0.91474391877154,0.54281438,"cellular oxidant detoxification"),
c("GO:1901615","organic hydroxy compound metabolic process",1.6412842926152864,5,0.9724988999886642,-0,"organic hydroxy compound metabolic process"),
c("GO:1901617","organic hydroxy compound biosynthetic process",0.8333107299088005,5,0.9277597821225819,0.05118243,"organic hydroxy compound biosynthetic process"),
c("GO:0006259","DNA metabolic process",5.572970721566783,1,0.9199632948846261,0.44921146,"organic hydroxy compound biosynthetic process"),
c("GO:0006260","DNA replication",1.4421509940592292,1,0.9156297053292961,0.66164169,"organic hydroxy compound biosynthetic process"),
c("GO:0006261","DNA-templated DNA replication",0.8777086143070274,1,0.9193041593736468,0.62403964,"organic hydroxy compound biosynthetic process"),
c("GO:0006302","double-strand break repair",0.7311276624516326,1,0.8424858862325634,0.5572529,"organic hydroxy compound biosynthetic process"),
c("GO:0006310","DNA recombination",1.827734239452524,1,0.913783022508282,0.61482406,"organic hydroxy compound biosynthetic process"),
c("GO:0006637","acyl-CoA metabolic process",0.4982787512729502,1,0.9345859103184873,0.27177693,"organic hydroxy compound biosynthetic process"),
c("GO:0035383","thioester metabolic process",0.4982787512729502,1,0.9579526250577883,0.68809034,"organic hydroxy compound biosynthetic process"),
c("GO:0044550","secondary metabolite biosynthetic process",0.46700972347634995,5,0.9133518702809249,0.17672197,"organic hydroxy compound biosynthetic process"),
c("GO:0046189","phenol-containing compound biosynthetic process",0.07071713142507265,5,0.9289008568177316,0.6713704,"organic hydroxy compound biosynthetic process"),
c("GO:0071897","DNA biosynthetic process",0.7699653505500705,1,0.9034078302127245,0.18587457,"organic hydroxy compound biosynthetic process"),
c("GO:1901679","nucleotide transmembrane transport",0.08522926838105149,5,0.9420536498650476,0,"nucleotide transmembrane transport"),
c("GO:0006811","monoatomic ion transport",4.917982551075166,1,0.9767174309447683,0.33192004,"nucleotide transmembrane transport"),
c("GO:0006820","monoatomic anion transport",0.5148633474075136,5,0.9799486131656947,0.22281075,"nucleotide transmembrane transport"),
c("GO:1904589","regulation of protein import",0.00015752658839597125,4,0.8854841358076434,-0,"regulation of protein import"),
c("GO:0042306","regulation of protein import into nucleus",0.005528198711521116,4,0.8513240574194825,0.68376658,"regulation of protein import"),
c("GO:1903828","negative regulation of protein localization",0.030806293443187124,4,0.8602349620563929,0.57032705,"regulation of protein import"));

stuff <- data.frame(revigo.data);
names(stuff) <- revigo.names;

#stuff$value <- as.numeric( as.character(stuff$value) );
stuff$frequency <- as.numeric( as.character(stuff$frequency) );
stuff$uniqueness <- as.numeric( as.character(stuff$uniqueness) );
stuff$dispensability <- as.numeric( as.character(stuff$dispensability) );

# Suppose your original 'value' column has numeric codes
stuff$value <- droplevels(factor(stuff$value,
                                 levels = c("1", "2", "3", "4", "5"),
                                 labels = c("gregaria", "piceifrons", "cancellata", "shared", "overlap")))

my_palette <- c(
  "gregaria" = "#FFC067",
  "piceifrons" = "#FF474C",
  "cancellata" = "orchid",
  "shared" = "gray20",
  "overlap" = "gray50"
)


# check the tmPlot command documentation for all possible parameters - there are a lot more
treemap(
  stuff,
  index = c("representative","description"),
  vSize = "uniqueness",
  type = "categorical",
  vColor = "value",

  # === Customization ===
  palette = my_palette,
  title = "Revigo BP Medium TreeMap",
  inflate.labels = FALSE,
  lowerbound.cex.labels = 0,
  bg.labels = "#CCCCCCAA",

  # === Add custom legend label ===
  position.legend = "right",  # optional: moves the legend
  title.legend = "Species Category"  # set your custom label
)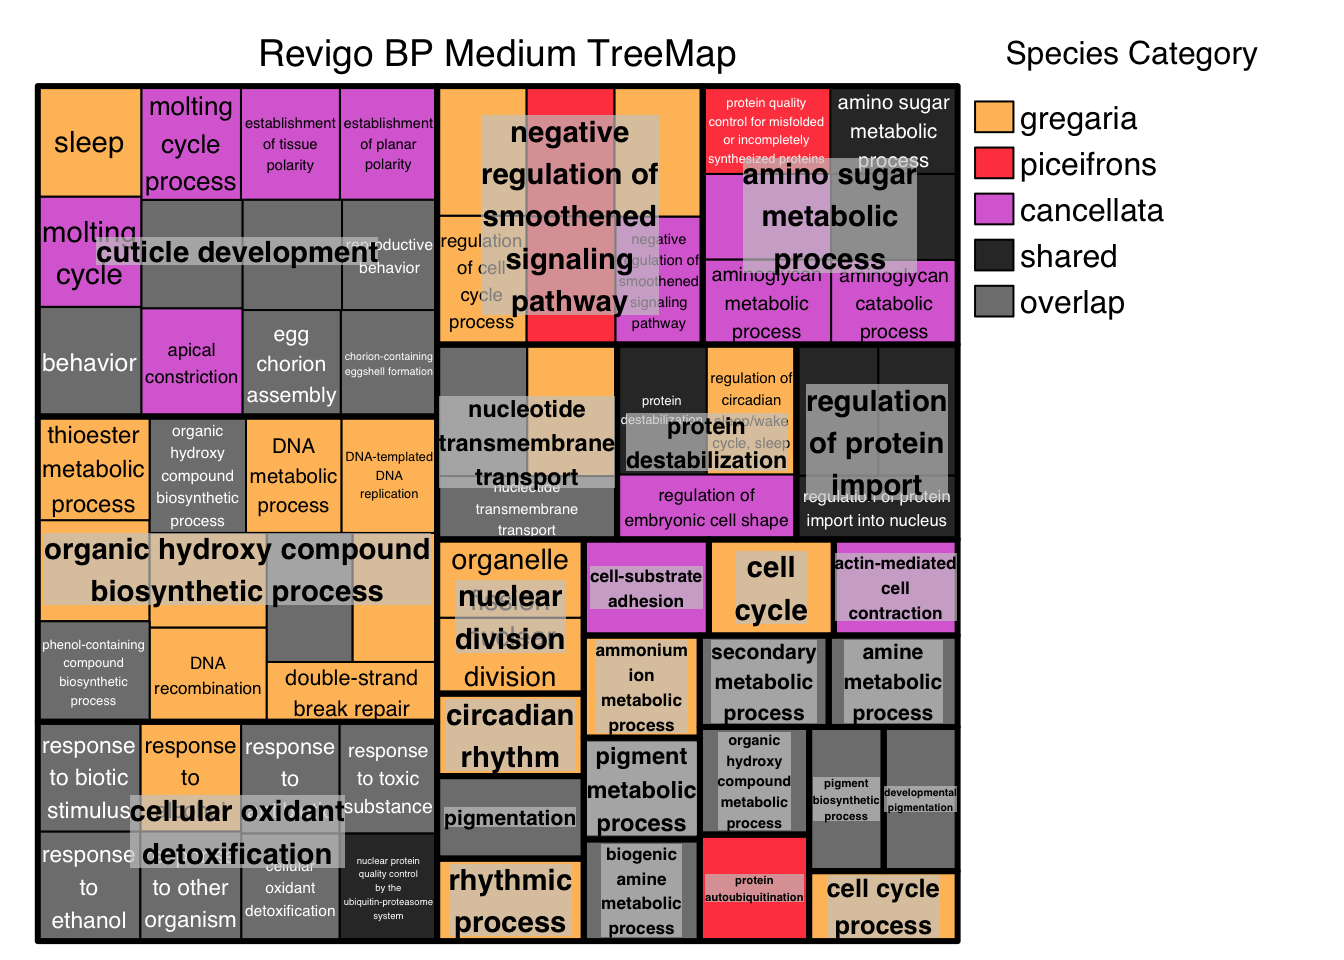
The following graph is with Small threshold:
# A plotting R script produced by the Revigo server at http://revigo.irb.hr/
# If you found Revigo useful in your work, please cite the following reference:
# Supek F et al. "REVIGO summarizes and visualizes long lists of Gene Ontology terms" PLoS ONE 2011. doi:10.1371/journal.pone.0021800

# Load required packages
library(ggplot2)
library(scales)

# Define column names and data matrix
revigo.names <- c("term_ID","description","frequency","plot_X","plot_Y","log_size","value","uniqueness","dispensability");
revigo.data <- rbind(c("GO:0000280","nuclear division",0.43374453844241945,3.020273438170237,-1.3636370004705325,5.24606259034848,1,0.9203633143023929,0.0145439),
c("GO:0001736","establishment of planar polarity",0.012597204365790324,-6.706792746581752,-2.6581466549006527,3.7091851295502454,3,0.9142437325647337,0.34386795),
c("GO:0006026","aminoglycan catabolic process",0.23307781700244523,4.411452696618355,4.946741722938621,4.976331634603942,3,0.885217306898431,0.43359455),
c("GO:0006040","amino sugar metabolic process",0.3589095635425583,4.806209311980951,5.458967661823292,5.163814115597508,4,0.9249021956414294,0.04675586),
c("GO:0006259","DNA metabolic process",5.572970721566783,5.67471379743604,2.609451110627576,6.3549130597720795,1,0.9199632948846261,0.44921146),
c("GO:0006576","biogenic amine metabolic process",0.5549686322719504,-6.643613383154529,4.8018896907851625,5.35309646946214,5,0.9750527320547442,0.04894618),
c("GO:0006637","acyl-CoA metabolic process",0.4982787512729502,6.452831605930198,2.403913903233453,5.306300619215061,1,0.9345859103184873,0.27177693),
c("GO:0006811","monoatomic ion transport",4.917982551075166,5.767679839600168,-3.289975033867287,6.300613307421874,1,0.9767174309447683,0.33192004),
c("GO:0006820","monoatomic anion transport",0.5148633474075136,5.61161054448117,-3.690825927161888,5.3205201586614885,5,0.9799486131656947,0.22281075),
c("GO:0007049","cell cycle",2.051845347681118,-5.379121851261656,6.196412016567335,5.920971251397435,1,0.9923269777276804,0.01898308),
c("GO:0007164","establishment of tissue polarity",0.01264397007172038,-6.400327640304291,-2.644790639513852,3.7107940999303275,3,0.9299814494139796,0.46327057),
c("GO:0007552","metamorphosis",0.00751943324296394,-6.603201763184551,-0.42634646555269884,3.485153349903652,5,0.9051328026153795,0.39274887),
c("GO:0007610","behavior",0.1060966186376303,-6.745908327292659,0.7249173429716872,4.6345377245814365,5,0.9383282967613209,0.37499273),
c("GO:0007623","circadian rhythm",0.07992013008151853,-3.8847917501934566,7.075204647058914,4.511495663673566,1,1,-0),
c("GO:0009308","amine metabolic process",0.6775809291617207,-4.449568147201794,-4.8317321862106555,5.439788858197747,5,0.9746183372601386,0.05001938),
c("GO:0009607","response to biotic stimulus",0.9712178739906423,1.4018864878656132,7.205613030541933,5.596143873584628,5,0.9319879109296256,0.31714106),
c("GO:0010564","regulation of cell cycle process",0.6468238627774074,0.5821558818789387,-6.457589943802141,5.4196137927680255,1,0.9515886829663438,0.21679232),
c("GO:0016476","regulation of embryonic cell shape",0.0005144227652305936,3.3336563275599995,-5.534267980848457,2.322219294733919,3,0.9607435392943682,0.30655905),
c("GO:0019098","reproductive behavior",0.014864110426926098,-6.69912209335084,1.371833389211555,3.7810369386211318,5,0.8664520083013199,0.40983691),
c("GO:0019748","secondary metabolic process",0.6368553833554749,-4.799569590480853,4.786959480226588,5.412868609276585,5,0.9747548268922844,0.04968112),
c("GO:0022402","cell cycle process",1.8491578554743764,-2.2747565144092303,7.7257831114676945,5.875800671392008,1,0.858638604260016,0.01693195),
c("GO:0022404","molting cycle process",0.009198075950558507,-6.3445601346270495,0.9729445630171666,3.572639297042813,3,0.9368476986264557,0.39765148),
c("GO:0030431","sleep",0.011191771834945019,-7.178379998083993,0.764028566939636,3.6578204560156973,1,0.9446904403651594,0.4025437),
c("GO:0031589","cell-substrate adhesion",0.22749792987910672,-5.8507265951335325,-5.12836360878247,4.965808254379985,3,0.9936653152233844,0.01368493),
c("GO:0031648","protein destabilization",0.004789792828415001,2.8143514298961194,-6.298027930572467,3.2893659515200318,4,0.9641496933951281,0.07874843),
c("GO:0042303","molting cycle",0.020793509668268203,-7.072031202844301,1.204379107861915,3.926805310111606,3,0.9430435514770823,0.41881322),
c("GO:0042335","cuticle development",0.0034680462976550545,-6.843049364233328,-0.5678040028998188,3.1492191126553797,5,0.9084619004205097,-0),
c("GO:0042440","pigment metabolic process",0.481708923256049,-2.305462029590756,-1.7110736411169627,5.29161301693988,5,0.9753519587674996,0.04821255),
c("GO:0043065","positive regulation of apoptotic process",0.14442726802966876,-0.3164686916515184,-6.893922686688279,4.768482704043391,2,0.9502843718096744,0.13443282),
c("GO:0043473","pigmentation",0.043122903573397126,-4.043590087772584,-6.393797809334259,4.24355888962248,5,1,-0),
c("GO:0044550","secondary metabolite biosynthetic process",0.46700972347634995,7.00426445446361,-0.08862170872082333,5.278154318435337,5,0.9133518702809249,0.17672197),
c("GO:0045187","regulation of circadian sleep/wake cycle, sleep",0.0014817344720996044,3.1061907163127325,-4.834616490977186,2.780317312140151,1,0.9628036658511914,0.40477353),
c("GO:0045471","response to ethanol",0.004935012652092536,0.1946761687308475,7.2732783548541065,3.302330928684399,5,0.9278307329068086,0.40800794),
c("GO:0045879","negative regulation of smoothened signaling pathway",0.01173326948255617,-1.8566239423144937,-6.739407478115141,3.67833624673218,3,0.9252037996614233,0.09661721),
c("GO:0046148","pigment biosynthetic process",0.44087261656733717,-2.536291378258223,5.8442493827553905,5.25314165596348,5,0.8885215104661132,0.04776458),
c("GO:0048066","developmental pigmentation",0.023939118730300253,-2.852906275685598,3.5589113518261626,3.987978915875482,5,0.8811300665639379,-0),
c("GO:0048285","organelle fission",0.5008139448049479,3.1587928041211115,-0.9798362365081354,5.3085046539438085,1,0.9484833282072216,0.47432026),
c("GO:0048511","rhythmic process",0.13974577473077598,0.16188711684326315,-1.8847028023387353,4.754172441415161,1,1,-0),
c("GO:0051707","response to other organism",0.9426071073732241,1.1460644499419035,6.713756644645466,5.58315795063656,5,0.9125079064821305,0.31025914),
c("GO:0051726","regulation of cell cycle",0.9785034787039558,0.4391639572728582,-5.70192443574808,5.5993895729336165,1,0.9502374701580993,0.1876856),
c("GO:0051783","regulation of nuclear division",0.1342471122545791,-0.6287900039866671,-5.713785225078754,4.736739021533997,1,0.9562060640831007,0.15934251),
c("GO:0051865","protein autoubiquitination",0.026011577908884753,2.939815457943458,2.807274415892108,4.024033897900905,2,0.9629166684099913,0.03683097),
c("GO:0070252","actin-mediated cell contraction",0.020682748785802285,-0.48937477147582453,3.3966589754598018,3.924486043733915,3,0.9833712783489073,0.00961515),
c("GO:0071630","nuclear protein quality control by the ubiquitin-proteasome system",0.005446974064379443,2.310178304684346,5.917816901662493,3.345177616542704,4,0.8675924895748699,0.23279871),
c("GO:0071897","DNA biosynthetic process",0.7699653505500705,6.136732365141303,1.6182779250708592,5.4952986766316325,1,0.9034078302127245,0.18587457),
c("GO:0097164","ammonium ion metabolic process",0.03849556003926547,0.8703786102642985,1.1039158082051435,4.194264516025517,1,0.9796960577886287,0.03803692),
c("GO:0098869","cellular oxidant detoxification",0.7902075171589529,0.7316456163872975,7.067967554269237,5.506568616038737,5,0.8780144818940214,0.01255665),
c("GO:1901071","glucosamine-containing compound metabolic process",0.16436668822647757,5.050740419873998,5.1791698648660045,4.824646414718352,4,0.8998774553583297,0.42101696),
c("GO:1901615","organic hydroxy compound metabolic process",1.6412842926152864,-1.7174093989643757,0.8908153999919155,5.82401057106121,5,0.9724988999886642,-0),
c("GO:1901617","organic hydroxy compound biosynthetic process",0.8333107299088005,6.293713475159695,-0.19300654983157356,5.529634363247561,5,0.9277597821225819,0.05118243),
c("GO:1901679","nucleotide transmembrane transport",0.08522926838105149,6.082312047572404,-2.833882140602723,4.539427408845252,5,0.9420536498650476,0),
c("GO:1904589","regulation of protein import",0.00015752658839597125,-2.425357636728141,-4.110022655819557,1.8129133566428555,4,0.8854841358076434,-0));

# Convert to data frame
one.data <- data.frame(revigo.data)
names(one.data) <- revigo.names

# Filter out rows with null coordinates
one.data <- one.data[one.data$plot_X != "null" & one.data$plot_Y != "null", ]

# Ensure numeric conversion
one.data$plot_X <- as.numeric(as.character(one.data$plot_X))
one.data$plot_Y <- as.numeric(as.character(one.data$plot_Y))
one.data$log_size <- as.numeric(as.character(one.data$log_size))
one.data$value <- as.factor(one.data$value)
one.data$frequency <- as.numeric(as.character(one.data$frequency))
one.data$uniqueness <- as.numeric(as.character(one.data$uniqueness))
one.data$dispensability <- as.numeric(as.character(one.data$dispensability))

# Base plot
p1 <- ggplot(data = one.data) +
geom_point(aes(plot_X, plot_Y, color = value, size = uniqueness), alpha = 0.9) +
  scale_color_manual(
    values = c(
      "1" = "#FFC067",   # gregaria
      "2" = "#FF474C",   # piceifrons
      "3" = "orchid",    # cancellata
      "4" = "#895129",     # shared
      "5" = "gray50"     # overlap
    ),
    labels = c(
      "1" = "gregaria",
      "2" = "piceifrons",
      "3" = "cancellata",
      "4" = "shared",
      "5" = "overlap"
    ),
    name = "Species"
  ) +
  scale_size(range = c(5, 20))

# Add labels for representative terms
ex <- one.data[one.data$dispensability < 0.05, ]
p1 <- p1 + geom_text(data = one.data, aes(plot_X, plot_Y, label = description),
                     colour = alpha("gray30", 0.95), fontface = "bold", size = 3)

# Customize axes and legend
p1 <- p1 +
  labs(x = "Semantic Space y", y = "Semantic Space x",
  title = "Semantic Clustering of BP GO Terms (Small threshold)") +
  theme_bw() +
  theme(
    panel.border = element_blank(),
    legend.key = element_blank(),
    axis.title.x = element_text(size = 20, face = "bold", family = "Arial", color = "gray50"),
    axis.title.y = element_text(size = 20, face = "bold", family = "Arial", color = "gray50"),
    axis.text.x  = element_text(size = 12, angle = 0, hjust = 1),
    axis.text.y  = element_text(size = 12),
    legend.title = element_text(size = 10, face = "bold"),
    legend.text  = element_text(size = 12)
  )

# Adjust plot limits
one.x_range <- max(one.data$plot_X) - min(one.data$plot_X)
one.y_range <- max(one.data$plot_Y) - min(one.data$plot_Y)
p1 <- p1 +
  xlim(min(one.data$plot_X) - one.x_range / 10, max(one.data$plot_X) + one.x_range / 10) +
  ylim(min(one.data$plot_Y) - one.y_range / 10, max(one.data$plot_Y) + one.y_range / 10)

# Show plot
p1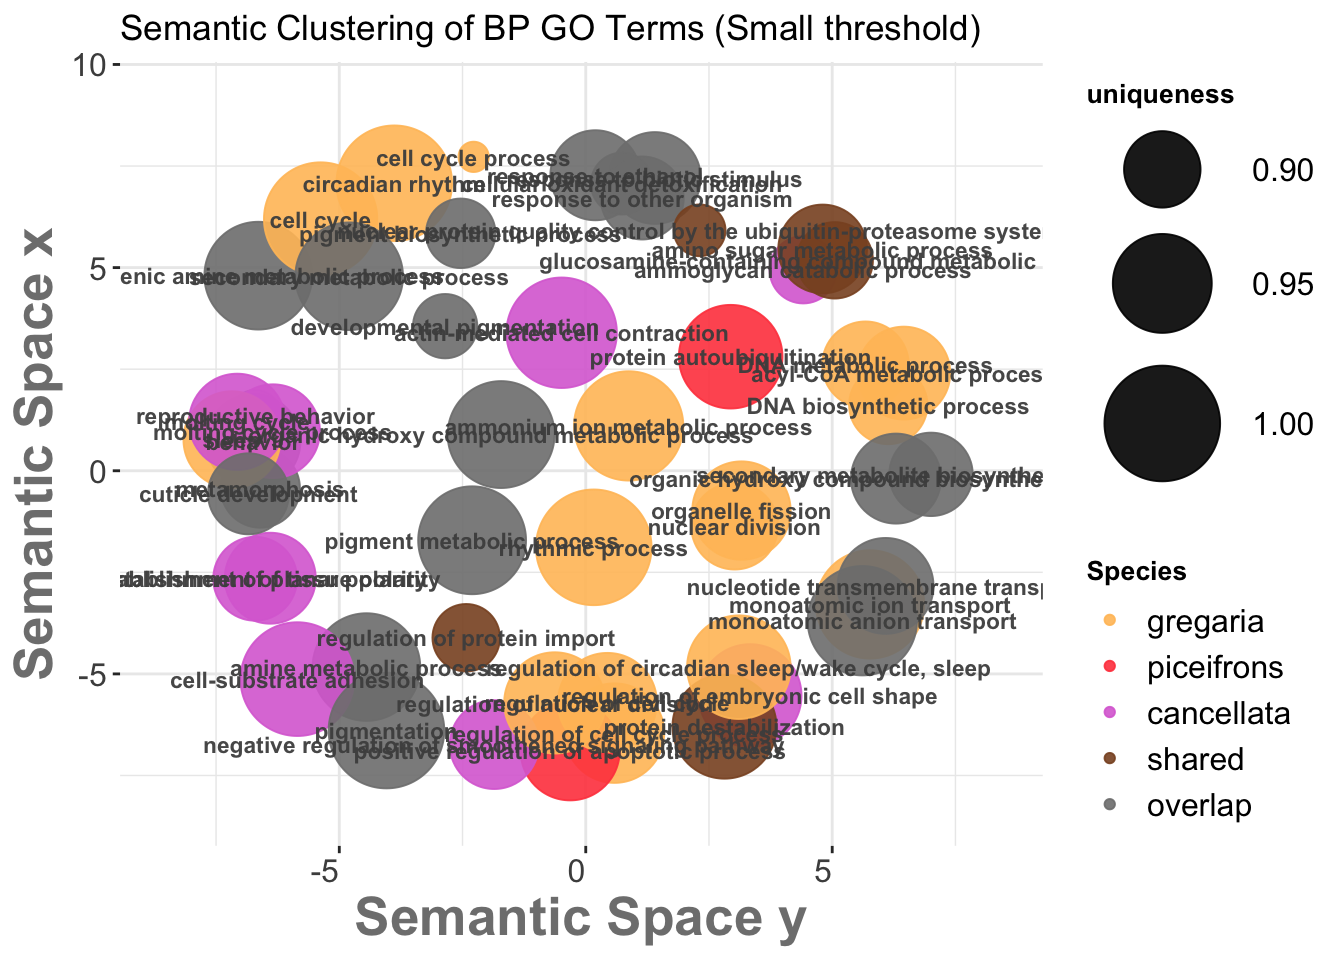
# Optional: Save to file
# ggsave("revigo-plot.pdf", plot = p1, width = 10, height = 8)
Below we do the Treemap view with Small threshold, colored by Species Category instead of representative:
revigo.names <- c("term_ID","description","frequency","value","uniqueness","dispensability","representative");
revigo.data <- rbind(c("GO:0000280","nuclear division",0.43374453844241945,1,0.9203633143023929,0.0145439,"nuclear division"),
c("GO:0048285","organelle fission",0.5008139448049479,1,0.9484833282072216,0.47432026,"nuclear division"),
c("GO:0006040","amino sugar metabolic process",0.3589095635425583,4,0.9249021956414294,0.04675586,"amino sugar metabolic process"),
c("GO:0006026","aminoglycan catabolic process",0.23307781700244523,3,0.885217306898431,0.43359455,"amino sugar metabolic process"),
c("GO:1901071","glucosamine-containing compound metabolic process",0.16436668822647757,4,0.8998774553583297,0.42101696,"amino sugar metabolic process"),
c("GO:0006576","biogenic amine metabolic process",0.5549686322719504,5,0.9750527320547442,0.04894618,"biogenic amine metabolic process"),
c("GO:0007049","cell cycle",2.051845347681118,1,0.9923269777276804,0.01898308,"cell cycle"),
c("GO:0007623","circadian rhythm",0.07992013008151853,1,1,-0,"circadian rhythm"),
c("GO:0009308","amine metabolic process",0.6775809291617207,5,0.9746183372601386,0.05001938,"amine metabolic process"),
c("GO:0019748","secondary metabolic process",0.6368553833554749,5,0.9747548268922844,0.04968112,"secondary metabolic process"),
c("GO:0022402","cell cycle process",1.8491578554743764,1,0.858638604260016,0.01693195,"cell cycle process"),
c("GO:0031589","cell-substrate adhesion",0.22749792987910672,3,0.9936653152233844,0.01368493,"cell-substrate adhesion"),
c("GO:0031648","protein destabilization",0.004789792828415001,4,0.9641496933951281,0.07874843,"protein destabilization"),
c("GO:0016476","regulation of embryonic cell shape",0.0005144227652305936,3,0.9607435392943682,0.30655905,"protein destabilization"),
c("GO:0045187","regulation of circadian sleep/wake cycle, sleep",0.0014817344720996044,1,0.9628036658511914,0.40477353,"protein destabilization"),
c("GO:0042335","cuticle development",0.0034680462976550545,5,0.9084619004205097,-0,"cuticle development"),
c("GO:0001736","establishment of planar polarity",0.012597204365790324,3,0.9142437325647337,0.34386795,"cuticle development"),
c("GO:0007164","establishment of tissue polarity",0.01264397007172038,3,0.9299814494139796,0.46327057,"cuticle development"),
c("GO:0007552","metamorphosis",0.00751943324296394,5,0.9051328026153795,0.39274887,"cuticle development"),
c("GO:0007610","behavior",0.1060966186376303,5,0.9383282967613209,0.37499273,"cuticle development"),
c("GO:0019098","reproductive behavior",0.014864110426926098,5,0.8664520083013199,0.40983691,"cuticle development"),
c("GO:0022404","molting cycle process",0.009198075950558507,3,0.9368476986264557,0.39765148,"cuticle development"),
c("GO:0030431","sleep",0.011191771834945019,1,0.9446904403651594,0.4025437,"cuticle development"),
c("GO:0042303","molting cycle",0.020793509668268203,3,0.9430435514770823,0.41881322,"cuticle development"),
c("GO:0042440","pigment metabolic process",0.481708923256049,5,0.9753519587674996,0.04821255,"pigment metabolic process"),
c("GO:0043473","pigmentation",0.043122903573397126,5,1,-0,"pigmentation"),
c("GO:0045879","negative regulation of smoothened signaling pathway",0.01173326948255617,3,0.9252037996614233,0.09661721,"negative regulation of smoothened signaling pathway"),
c("GO:0010564","regulation of cell cycle process",0.6468238627774074,1,0.9515886829663438,0.21679232,"negative regulation of smoothened signaling pathway"),
c("GO:0043065","positive regulation of apoptotic process",0.14442726802966876,2,0.9502843718096744,0.13443282,"negative regulation of smoothened signaling pathway"),
c("GO:0051726","regulation of cell cycle",0.9785034787039558,1,0.9502374701580993,0.1876856,"negative regulation of smoothened signaling pathway"),
c("GO:0051783","regulation of nuclear division",0.1342471122545791,1,0.9562060640831007,0.15934251,"negative regulation of smoothened signaling pathway"),
c("GO:0046148","pigment biosynthetic process",0.44087261656733717,5,0.8885215104661132,0.04776458,"pigment biosynthetic process"),
c("GO:0048066","developmental pigmentation",0.023939118730300253,5,0.8811300665639379,-0,"developmental pigmentation"),
c("GO:0048511","rhythmic process",0.13974577473077598,1,1,-0,"rhythmic process"),
c("GO:0051865","protein autoubiquitination",0.026011577908884753,2,0.9629166684099913,0.03683097,"protein autoubiquitination"),
c("GO:0070252","actin-mediated cell contraction",0.020682748785802285,3,0.9833712783489073,0.00961515,"actin-mediated cell contraction"),
c("GO:0097164","ammonium ion metabolic process",0.03849556003926547,1,0.9796960577886287,0.03803692,"ammonium ion metabolic process"),
c("GO:0098869","cellular oxidant detoxification",0.7902075171589529,5,0.8780144818940214,0.01255665,"cellular oxidant detoxification"),
c("GO:0009607","response to biotic stimulus",0.9712178739906423,5,0.9319879109296256,0.31714106,"cellular oxidant detoxification"),
c("GO:0045471","response to ethanol",0.004935012652092536,5,0.9278307329068086,0.40800794,"cellular oxidant detoxification"),
c("GO:0051707","response to other organism",0.9426071073732241,5,0.9125079064821305,0.31025914,"cellular oxidant detoxification"),
c("GO:0071630","nuclear protein quality control by the ubiquitin-proteasome system",0.005446974064379443,4,0.8675924895748699,0.23279871,"cellular oxidant detoxification"),
c("GO:1901615","organic hydroxy compound metabolic process",1.6412842926152864,5,0.9724988999886642,-0,"organic hydroxy compound metabolic process"),
c("GO:1901617","organic hydroxy compound biosynthetic process",0.8333107299088005,5,0.9277597821225819,0.05118243,"organic hydroxy compound biosynthetic process"),
c("GO:0006259","DNA metabolic process",5.572970721566783,1,0.9199632948846261,0.44921146,"organic hydroxy compound biosynthetic process"),
c("GO:0006637","acyl-CoA metabolic process",0.4982787512729502,1,0.9345859103184873,0.27177693,"organic hydroxy compound biosynthetic process"),
c("GO:0044550","secondary metabolite biosynthetic process",0.46700972347634995,5,0.9133518702809249,0.17672197,"organic hydroxy compound biosynthetic process"),
c("GO:0071897","DNA biosynthetic process",0.7699653505500705,1,0.9034078302127245,0.18587457,"organic hydroxy compound biosynthetic process"),
c("GO:1901679","nucleotide transmembrane transport",0.08522926838105149,5,0.9420536498650476,0,"nucleotide transmembrane transport"),
c("GO:0006811","monoatomic ion transport",4.917982551075166,1,0.9767174309447683,0.33192004,"nucleotide transmembrane transport"),
c("GO:0006820","monoatomic anion transport",0.5148633474075136,5,0.9799486131656947,0.22281075,"nucleotide transmembrane transport"),
c("GO:1904589","regulation of protein import",0.00015752658839597125,4,0.8854841358076434,-0,"regulation of protein import"));

stuff <- data.frame(revigo.data);
names(stuff) <- revigo.names;

#stuff$value <- as.numeric( as.character(stuff$value) );
stuff$frequency <- as.numeric( as.character(stuff$frequency) );
stuff$uniqueness <- as.numeric( as.character(stuff$uniqueness) );
stuff$dispensability <- as.numeric( as.character(stuff$dispensability) );

# Suppose your original 'value' column has numeric codes
stuff$value <- droplevels(factor(stuff$value,
                                 levels = c("1", "2", "3", "4", "5"),
                                 labels = c("gregaria", "piceifrons", "cancellata", "shared", "overlap")))

my_palette <- c(
  "gregaria" = "#FFC067",
  "piceifrons" = "#FF474C",
  "cancellata" = "orchid",
  "shared" = "gray20",
  "overlap" = "gray50"
)


# check the tmPlot command documentation for all possible parameters - there are a lot more
treemap(
  stuff,
  index = c("representative","description"),
  vSize = "uniqueness",
  type = "categorical",
  vColor = "value",

  # === Customization ===
  palette = my_palette,
  title = "Revigo BP Small TreeMap",
  inflate.labels = FALSE,
  lowerbound.cex.labels = 0,
  bg.labels = "#CCCCCCAA",

  # === Add custom legend label ===
  position.legend = "right",  # optional: moves the legend
  title.legend = "Species Category"  # set your custom label
)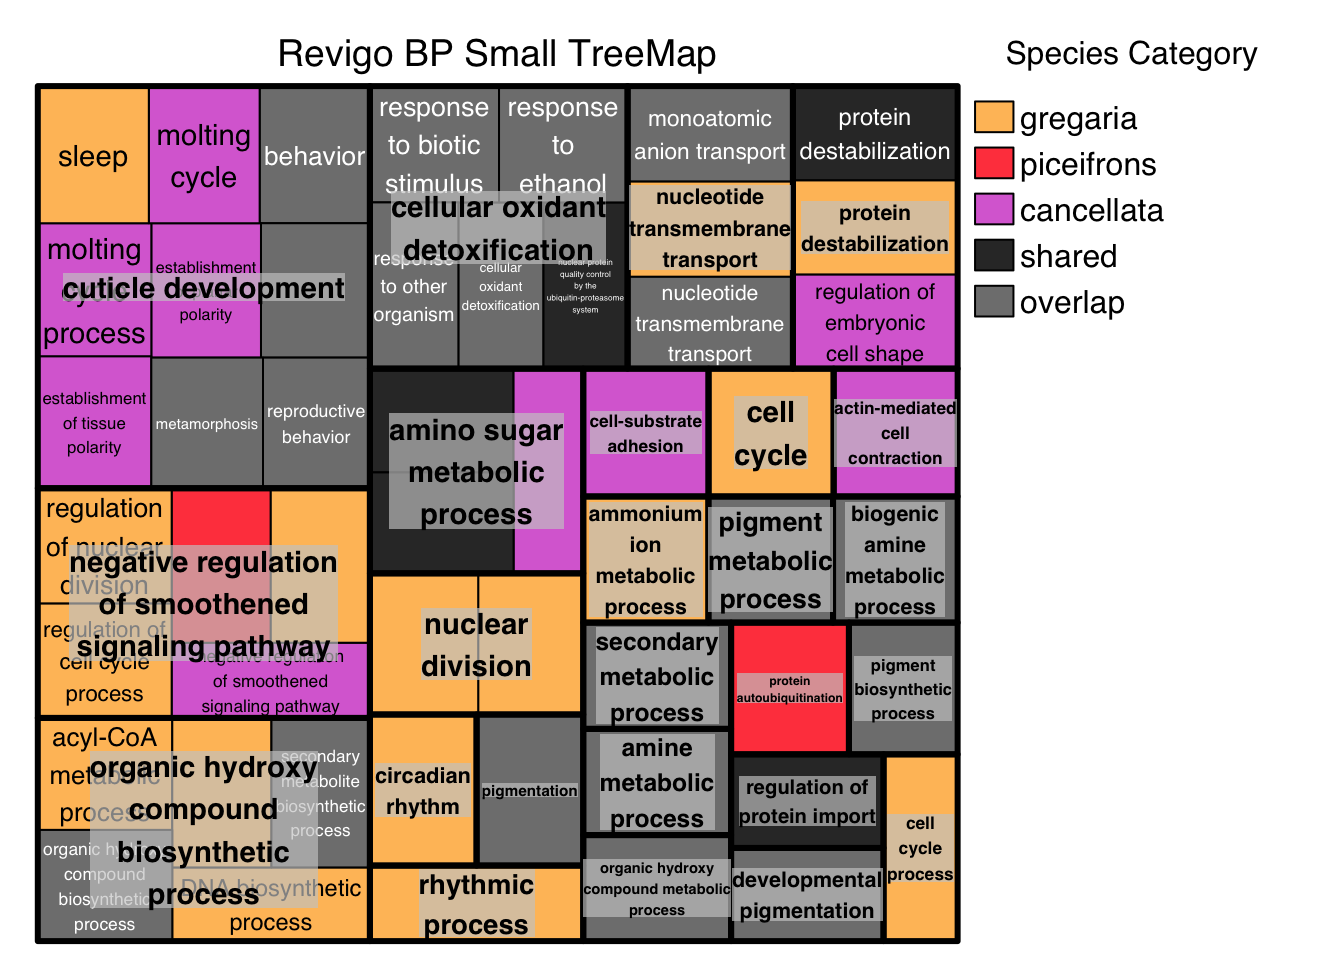
MF
Molecular Functions
Molecular-level activities performed by gene products. Molecular function terms describe activities that occur at the molecular level, such as “catalysis” or “transport”. GO molecular function terms represent activities rather than the entities (molecules or complexes) that perform the actions, and do not specify where, when, or in what context the action takes place. Molecular functions generally correspond to activities that can be performed by individual gene products (i.e. a protein or RNA), but some activities are performed by molecular complexes composed of multiple gene products. Examples of broad functional terms are catalytic activity and transporter activity; examples of narrower functional terms are adenylate cyclase activity or Toll-like receptor binding. To avoid confusion between gene product names and their molecular functions, GO molecular functions are often appended with the word “activity” (a protein kinase would have the GO molecular function protein kinase activity).
The following graph is with Medium threshold:
# A plotting R script produced by the Revigo server at http://revigo.irb.hr/
# If you found Revigo useful in your work, please cite the following reference:
# Supek F et al. "REVIGO summarizes and visualizes long lists of Gene Ontology terms" PLoS ONE 2011. doi:10.1371/journal.pone.0021800

# Load required packages
library(ggplot2)
library(scales)

# Define column names and data matrix
revigo.names <- c("term_ID","description","frequency","plot_X","plot_Y","log_size","value","uniqueness","dispensability");
revigo.data <- rbind(c("GO:0000166","nucleotide binding",18.306860962763057,-4.058170015008647,-5.662998246865609,6.9236120800790015,5,0.9384640140491738,0.47691452),
c("GO:0000217","DNA secondary structure binding",0.08966692774410648,-6.0816420772293975,-4.153060963664518,4.61364100671677,1,0.9662108499761245,0.2947705),
c("GO:0000400","four-way junction DNA binding",0.06567862355940028,-6.161806873384277,-3.7915432626265884,4.478436620683433,1,0.9669830319519069,0.28763667),
c("GO:0003697","single-stranded DNA binding",0.39424199501667534,-5.7153754696712085,-4.380712684054127,5.256763433469915,1,0.9620186243437256,0.11878505),
c("GO:0003774","cytoskeletal motor activity",0.38116520426412076,-3.7279986062327497,6.650466521879892,5.242113880094346,5,1,-0),
c("GO:0003777","microtubule motor activity",0.199336477831129,2.082866774761333,0.26377865521485827,4.960589680883954,5,0.9143088259155144,-0),
c("GO:0004177","aminopeptidase activity",0.3647422742654193,1.7416205628003703,-6.331618401738942,5.222986845806831,2,0.8979077240109671,0.59659955),
c("GO:0004197","cysteine-type endopeptidase activity",0.20777713045007887,1.9056697770900983,-6.550273844715404,4.978600451516357,3,0.9027862084861842,0.317331),
c("GO:0004364","glutathione transferase activity",0.15572971340873956,7.244922646348587,1.6987183214848427,4.853375716612023,4,0.9518175766136163,0.22117832),
c("GO:0004497","monooxygenase activity",1.324150025517313,6.0256235017170185,-4.090408819354133,5.7829360542600465,5,0.9071329236045428,0.45983527),
c("GO:0004553","hydrolase activity, hydrolyzing O-glycosyl compounds",1.5623305307616389,0.42327083856911996,-6.479359099576644,5.85477167163393,4,0.8989709573248049,0.04747689),
c("GO:0004568","chitinase activity",0.07329420074779336,0.01192031275493123,-6.740699748121721,4.52608069180203,4,0.9222257898066109,0.67702603),
c("GO:0004722","protein serine/threonine phosphatase activity",0.274745752896937,1.5876348849241562,-6.953455053184648,5.099932583098006,3,0.9073263186172956,0.23377277),
c("GO:0005198","structural molecule activity",3.0956240814896883,0.3321907955874922,7.471378260561974,6.151746667822227,5,1,-0),
c("GO:0005201","extracellular matrix structural constituent",0.07101760372644227,-3.382238870163824,4.5865842066889115,4.512377507312931,1,0.9737890692594061,0.45678621),
c("GO:0005272","sodium channel activity",0.09140875365305967,3.631034875789477,4.9244198651363496,4.621996302909695,1,0.8405823825938774,0.5182855),
c("GO:0005326","neurotransmitter transmembrane transporter activity",0.009783037248030313,3.5625707534443913,5.647223786352018,3.651568738865792,3,0.88467628339355,0.27436998),
c("GO:0005539","glycosaminoglycan binding",0.16800107338384584,-1.9016774716236748,7.082992724168474,4.886315844136417,2,0.9712292670307245,0.24326222),
c("GO:0005549","odorant binding",0.13424501112574927,-5.213230477031205,5.526568202763401,4.788903361652433,1,0.9796664103847584,0.04145723),
c("GO:0008010","structural constituent of chitin-based larval cuticle",0.018156024950717567,-3.6939861475882063,4.847878912934096,3.920071124297524,5,0.9657024348836419,0.41811004),
c("GO:0008061","chitin binding",0.1333151642119472,-1.2990129709259641,7.214819162724185,4.785884807638073,5,0.9717139938182623,0.04143037),
c("GO:0008066","glutamate receptor activity",0.06107522651430972,-5.909879319609866,4.5498915085125375,4.446878752254525,3,1,-0),
c("GO:0008094","ATP-dependent activity, acting on DNA",1.0453989461254773,3.331223481452411,0.058872624041435874,5.680281109863301,1,0.8364203237185991,0.6998087),
c("GO:0008237","metallopeptidase activity",1.359719944079094,1.4418879369618722,-6.336150524923135,5.794448310033199,2,0.8845467061345161,0.68497315),
c("GO:0008238","exopeptidase activity",1.020164297837999,1.4940147920660278,-6.513059409807973,5.6696691950288045,2,0.8877206910757622,0.5654035),
c("GO:0008483","transaminase activity",0.6879492036417783,7.338733303046371,1.1962303201255602,5.498555895327498,4,0.9451339770453477,0.04322827),
c("GO:0008509","monoatomic anion transmembrane transporter activity",0.3541145169337237,3.8529575868960766,5.11095292332478,5.210144553124945,5,0.8237442285548383,0.46169587),
c("GO:0008514","organic anion transmembrane transporter activity",0.9131293140067489,4.419538989654112,5.039945909228201,5.621531468340076,5,0.8351007644631914,0.51572243),
c("GO:0015075","monoatomic ion transmembrane transporter activity",3.3706579559655494,4.031355157768305,4.947042762115843,6.188713110254052,2,0.7878539879494861,0.66677437),
c("GO:0015605","organophosphate ester transmembrane transporter activity",0.1749967526297042,4.782591005820851,4.867032395691373,4.904033551734992,5,0.8306164285929529,0.33853904),
c("GO:0015645","fatty acid ligase activity",0.18793166533203076,2.1593304486803175,-0.09301987323480143,4.935003151453655,3,0.8743729487206431,0.40693071),
c("GO:0015932","nucleobase-containing compound transmembrane transporter activity",0.20710702950515578,4.295996249548645,5.393134006587869,4.977197561930761,5,0.8305023328860474,0.343228),
c("GO:0016209","antioxidant activity",0.6988585343346956,0.11929176626817019,5.767795262989234,5.505388774621988,5,0.9739437562746719,0.01365914),
c("GO:0016491","oxidoreductase activity",11.074819433442528,1.3720605030074082,7.453058112413461,6.705334884838153,5,0.9583078331438803,0.06841338),
c("GO:0016614","oxidoreductase activity, acting on CH-OH group of donors",1.9765118486834359,5.8165385656391395,-3.871377423992668,5.956898046912602,1,0.9033399687420666,0.48988668),
c("GO:0016616","oxidoreductase activity, acting on the CH-OH group of donors, NAD or NADP as acceptor",1.716418824266202,5.575668813781851,-4.007209977684556,5.895621966287966,1,0.9047051792459577,0.47429504),
c("GO:0016620","oxidoreductase activity, acting on the aldehyde or oxo group of donors, NAD or NADP as acceptor",0.5048850468021855,6.188946532366451,-3.4796897926411554,5.3641925310598335,4,0.9152688213406485,0.41304173),
c("GO:0016651","oxidoreductase activity, acting on NAD(P)H",0.7080937040349223,6.20181214718545,-3.788586350697443,5.511090216773934,5,0.9125660834529801,0.42833259),
c("GO:0016684","oxidoreductase activity, acting on peroxide as acceptor",0.4930131281069519,5.780313327466053,-3.545180269067467,5.353858551860327,5,0.9154531662377211,0.41200705),
c("GO:0016705","oxidoreductase activity, acting on paired donors, with incorporation or reduction of molecular oxygen",1.5200093997482385,5.810731744321132,-4.259175058584677,5.842845042414387,5,0.9058554786237373,-0),
c("GO:0016765","transferase activity, transferring alkyl or aryl (other than methyl) groups",0.9649344469930834,7.492098094107884,0.7203859703724959,5.645496937999086,4,0.9433677768772984,0.26378911),
c("GO:0016769","transferase activity, transferring nitrogenous groups",0.7051208131978367,7.4184477756127345,0.25413160781725225,5.509263023539896,4,0.9450086337975063,0.25480443),
c("GO:0016779","nucleotidyltransferase activity",1.752960061787236,7.0603291726889275,0.7542289501806717,5.904770707450465,1,0.9313391284396734,0.29145038),
c("GO:0016798","hydrolase activity, acting on glycosyl bonds",1.966951450837302,0.7905996345208781,-6.847629795062279,5.954792267676311,4,0.9056055746796973,0.29066882),
c("GO:0016817","hydrolase activity, acting on acid anhydrides",5.886841166627846,0.8769960656270408,-6.0699767801049305,6.430880624395314,5,0.8924182291279875,0.34769831),
c("GO:0016887","ATP hydrolysis activity",4.031207233999447,1.4898875341441997,-4.424591775778532,6.266433504976146,5,0.7791666731574686,0.68796146),
c("GO:0016903","oxidoreductase activity, acting on the aldehyde or oxo group of donors",0.6780264710827542,5.572174414397568,-4.3950755820634715,5.492246192885036,2,0.9129215671098837,0.42630808),
c("GO:0017022","myosin binding",0.06137207905017142,-6.461802446718779,-0.12296087780021783,4.4489844265948015,2,0.9204756914241056,0.31234086),
c("GO:0019842","vitamin binding",1.6333590481842524,-2.926449435262362,-6.961919292307764,5.87408038819682,3,0.9658596189800733,0.15853064),
c("GO:0019899","enzyme binding",1.4181256805098825,-6.16650549366045,0.4877896620736388,5.8127135352187285,5,0.8982069368108325,0.52546413),
c("GO:0022804","active transmembrane transporter activity",3.3408417380253232,4.205197571493033,4.800330527086144,6.184854331656157,5,0.8123219108170291,0.44495218),
c("GO:0030246","carbohydrate binding",0.9999543152678265,-0.6362307460887994,4.200629214934559,5.660979252046847,4,0.9752339141274818,0.05101246),
c("GO:0031625","ubiquitin protein ligase binding",0.17450345356275757,-6.56013053041332,0.33802330438261374,4.902807603794222,5,0.9083163955413013,0.42350099),
c("GO:0034061","DNA polymerase activity",0.44312225742907846,5.998135477938353,0.3883222613906281,5.307523848984616,1,0.8834596987399841,0.5638044),
c("GO:0036094","small molecule binding",36.07758878384602,-3.03791108338643,-4.475312457199408,7.218235675531778,5,0.9589144700626652,0.08669252),
c("GO:0042302","structural constituent of cuticle",0.05559873377550828,-3.334958382668261,4.9007892095297265,4.406080095600492,5,0.9740463867967059,-0),
c("GO:0042626","ATPase-coupled transmembrane transporter activity",1.530486548072769,3.6297596658379803,3.4891899946579867,5.845828281311532,5,0.741744430733172,0.550868),
c("GO:0042802","identical protein binding",0.4716899485272982,-5.93417391490888,0.2836776502438816,5.33465677657078,5,0.907195887938826,0.46645967),
c("GO:0042803","protein homodimerization activity",0.16143321102790584,-5.636843569678786,0.5993150278507455,4.868996902487136,5,0.9146601480409319,0.42046922),
c("GO:0042834","peptidoglycan binding",0.04558869164711314,-1.5312160558816195,6.7096976967588375,4.31987606673915,2,0.9737797144660709,0.22109503),
c("GO:0043168","anion binding",18.460209307667203,-3.279894023345628,-6.158645986559831,6.927234817369778,3,0.9520316649036655,0.24507523),
c("GO:0044183","protein folding chaperone",0.39308732596174273,1.2002074390250903,-1.746822618193469,5.2554895980755365,3,0.9780559719723032,0.01423747),
c("GO:0044389","ubiquitin-like protein ligase binding",0.1916117636810221,-6.5883920267928175,0.5515283707338732,4.943425260694872,5,0.9077057800177468,0.66550385),
c("GO:0045503","dynein light chain binding",0.021628763072452557,-5.967275449010429,-0.2471420150618103,3.9960736544852753,5,0.9259424603831329,0.29156983),
c("GO:0045505","dynein intermediate chain binding",0.09979047231268402,-5.819850398148879,1.1218302250077614,4.660096722614944,5,0.917651159459192,0.40265917),
c("GO:0046983","protein dimerization activity",1.172187720026936,-6.0943572928739815,0.7421617654434578,5.729996121186026,5,0.899866912362346,0.39115013),
c("GO:0050660","flavin adenine dinucleotide binding",1.6455911188531416,-4.004160888402853,-6.2370059264126,5.877320656022554,5,0.9541423997921271,0.03915362),
c("GO:0050839","cell adhesion molecule binding",0.3026913633133877,-6.416278797146413,0.9544136584557678,5.142001306282736,3,0.9104265359059435,0.44626496),
c("GO:0051959","dynein light intermediate chain binding",0.0714454206163606,-6.250084210530718,1.3247687472292997,4.514985810494037,5,0.9196129622169694,-0),
c("GO:0061134","peptidase regulator activity",0.2912210686372611,-1.1450545451240643,2.134430472865443,5.1252241913971694,3,0.9616823938318863,0.63894516),
c("GO:0061135","endopeptidase regulator activity",0.247821664442128,-0.9038012885140381,2.097270924964468,5.055141239751874,4,0.9486148227814237,-0),
c("GO:0061783","peptidoglycan muralytic activity",0.1852949163370239,-1.356912442280259,-0.2729937868439808,4.928866765396401,3,0.9736828718165141,0.03781613),
c("GO:0072341","modified amino acid binding",0.2351836042756631,-1.3546101119133755,-1.9958340825284795,5.032409217607479,2,0.978603409467484,0.04374521),
c("GO:0097367","carbohydrate derivative binding",15.405160165803492,-2.892342133338965,-3.364131620328507,6.848664424657691,4,0.9643723043166579,0.1537856),
c("GO:0140097","catalytic activity, acting on DNA",2.757074678035595,4.653129449033574,-0.026289971539094875,6.101447018509672,1,0.9235365386252591,0.05112468),
c("GO:1901265","nucleoside phosphate binding",18.352814171862295,-4.568337614562788,-5.030568701507719,6.924700864043428,5,0.9518198964769756,0.19740736),
c("GO:1901505","carbohydrate derivative transmembrane transporter activity",0.25198196542266027,4.521534006852502,4.580866418042698,5.062371366143577,5,0.8437556614856057,0));

# Convert to data frame
one.data <- data.frame(revigo.data)
names(one.data) <- revigo.names

# Filter out rows with null coordinates
one.data <- one.data[one.data$plot_X != "null" & one.data$plot_Y != "null", ]

# Ensure numeric conversion
one.data$plot_X <- as.numeric(as.character(one.data$plot_X))
one.data$plot_Y <- as.numeric(as.character(one.data$plot_Y))
one.data$log_size <- as.numeric(as.character(one.data$log_size))
one.data$value <- as.factor(one.data$value)
one.data$frequency <- as.numeric(as.character(one.data$frequency))
one.data$uniqueness <- as.numeric(as.character(one.data$uniqueness))
one.data$dispensability <- as.numeric(as.character(one.data$dispensability))

# Base plot
p1 <- ggplot(data = one.data) +
geom_point(aes(plot_X, plot_Y, color = value, size = uniqueness), alpha = 0.9) +
  scale_color_manual(
    values = c(
      "1" = "#FFC067",   # gregaria
      "2" = "#FF474C",   # piceifrons
      "3" = "orchid",    # cancellata
      "4" = "#895129",     # shared
      "5" = "gray50"     # overlap
    ),
    labels = c(
      "1" = "gregaria",
      "2" = "piceifrons",
      "3" = "cancellata",
      "4" = "shared",
      "5" = "overlap"
    ),
    name = "Species"
  ) +
  scale_size(range = c(5, 20))

# Add labels for representative terms
ex <- one.data[one.data$dispensability < 0.20, ]
p1 <- p1 + geom_text(data = ex, aes(plot_X, plot_Y, label = description),
                     colour = alpha("gray30", 0.95), fontface = "bold", size = 3)

#p1 + geom_text(data = one.data, aes(plot_X, plot_Y, label = description), colour = alpha("gray30", 0.95), fontface = "bold", size = 3)

# Customize axes and legend
p1 <- p1 +
  labs(x = "Semantic Space y", y = "Semantic Space x",
  title = "Semantic Clustering of MF GO Terms (Medium threshold)") +
  theme_bw() +
  theme(
    panel.border = element_blank(),
    legend.key = element_blank(),
    axis.title.x = element_text(size = 20, face = "bold", family = "Arial", color = "gray50"),
    axis.title.y = element_text(size = 20, face = "bold", family = "Arial", color = "gray50"),
    axis.text.x  = element_text(size = 12, angle = 0, hjust = 1),
    axis.text.y  = element_text(size = 12),
    legend.title = element_text(size = 10, face = "bold"),
    legend.text  = element_text(size = 12)
  )

# Adjust plot limits
one.x_range <- max(one.data$plot_X) - min(one.data$plot_X)
one.y_range <- max(one.data$plot_Y) - min(one.data$plot_Y)
p1 <- p1 +
  xlim(min(one.data$plot_X) - one.x_range / 10, max(one.data$plot_X) + one.x_range / 10) +
  ylim(min(one.data$plot_Y) - one.y_range / 10, max(one.data$plot_Y) + one.y_range / 10)

# Show plot
p1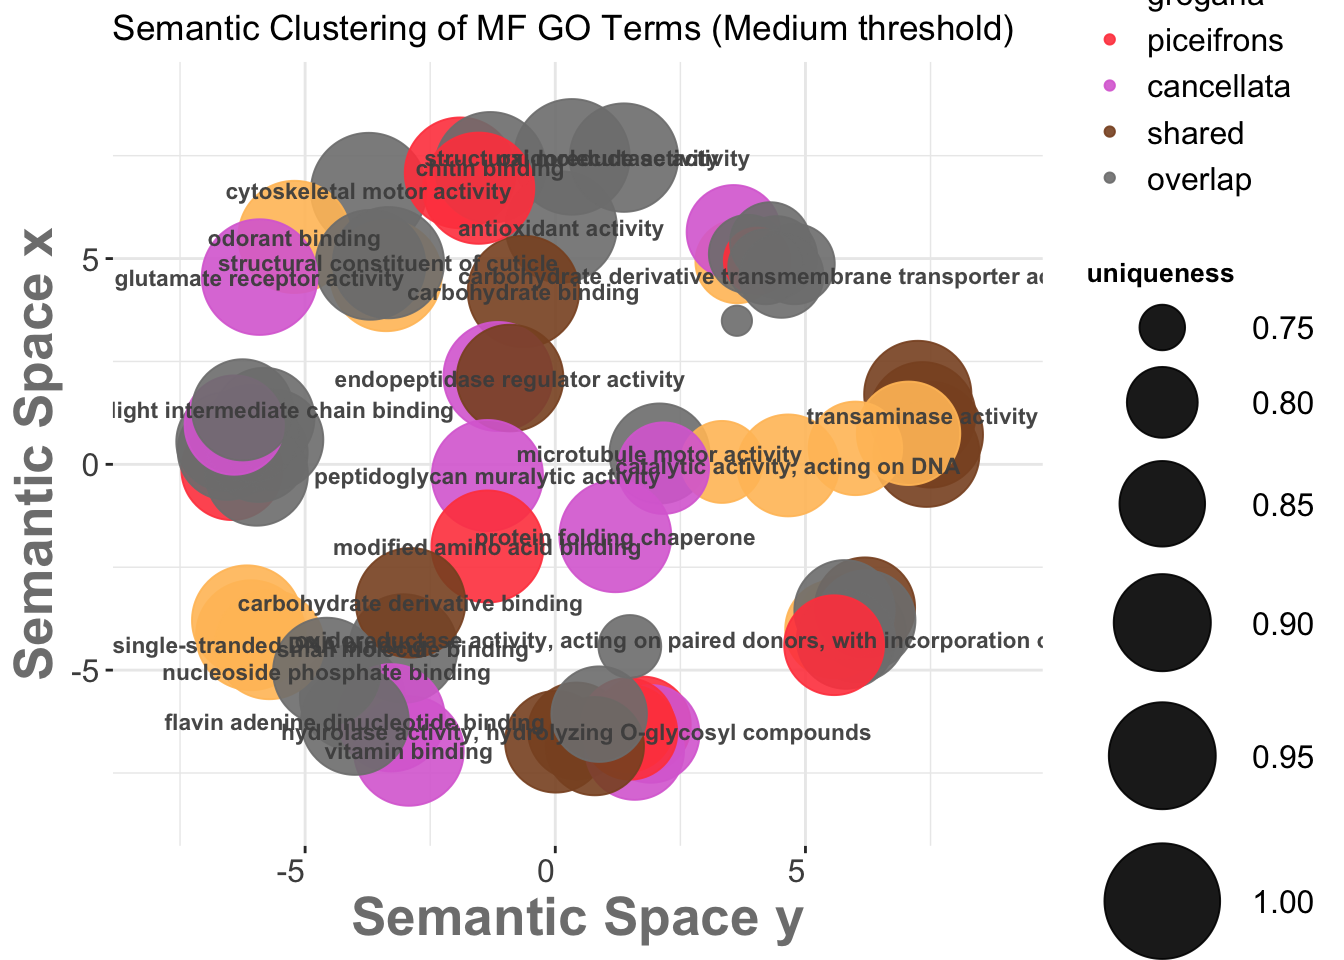
# Optional: Save to file
# ggsave("revigo-plot.pdf", plot = p1, width = 10, height = 8)
Below we do the Treemap view with Medium threshold, colored by Species Category instead of representative:
revigo.names <- c("term_ID","description","frequency","value","uniqueness","dispensability","representative");
revigo.data <- rbind(c("GO:0003774","cytoskeletal motor activity",0.38116520426412076,5,1,-0,"cytoskeletal motor activity"),
c("GO:0003777","microtubule motor activity",0.199336477831129,5,0.9143088259155144,-0,"microtubule motor activity"),
c("GO:0015645","fatty acid ligase activity",0.18793166533203076,3,0.8743729487206431,0.40693071,"microtubule motor activity"),
c("GO:0004553","hydrolase activity, hydrolyzing O-glycosyl compounds",1.5623305307616389,4,0.8989709573248049,0.04747689,"hydrolase activity, hydrolyzing O-glycosyl compounds"),
c("GO:0004177","aminopeptidase activity",0.3647422742654193,2,0.8979077240109671,0.59659955,"hydrolase activity, hydrolyzing O-glycosyl compounds"),
c("GO:0004197","cysteine-type endopeptidase activity",0.20777713045007887,3,0.9027862084861842,0.317331,"hydrolase activity, hydrolyzing O-glycosyl compounds"),
c("GO:0004568","chitinase activity",0.07329420074779336,4,0.9222257898066109,0.67702603,"hydrolase activity, hydrolyzing O-glycosyl compounds"),
c("GO:0004722","protein serine/threonine phosphatase activity",0.274745752896937,3,0.9073263186172956,0.23377277,"hydrolase activity, hydrolyzing O-glycosyl compounds"),
c("GO:0008237","metallopeptidase activity",1.359719944079094,2,0.8845467061345161,0.68497315,"hydrolase activity, hydrolyzing O-glycosyl compounds"),
c("GO:0008238","exopeptidase activity",1.020164297837999,2,0.8877206910757622,0.5654035,"hydrolase activity, hydrolyzing O-glycosyl compounds"),
c("GO:0016798","hydrolase activity, acting on glycosyl bonds",1.966951450837302,4,0.9056055746796973,0.29066882,"hydrolase activity, hydrolyzing O-glycosyl compounds"),
c("GO:0016817","hydrolase activity, acting on acid anhydrides",5.886841166627846,5,0.8924182291279875,0.34769831,"hydrolase activity, hydrolyzing O-glycosyl compounds"),
c("GO:0005198","structural molecule activity",3.0956240814896883,5,1,-0,"structural molecule activity"),
c("GO:0005549","odorant binding",0.13424501112574927,1,0.9796664103847584,0.04145723,"odorant binding"),
c("GO:0008061","chitin binding",0.1333151642119472,5,0.9717139938182623,0.04143037,"chitin binding"),
c("GO:0005539","glycosaminoglycan binding",0.16800107338384584,2,0.9712292670307245,0.24326222,"chitin binding"),
c("GO:0042834","peptidoglycan binding",0.04558869164711314,2,0.9737797144660709,0.22109503,"chitin binding"),
c("GO:0008066","glutamate receptor activity",0.06107522651430972,3,1,-0,"glutamate receptor activity"),
c("GO:0008483","transaminase activity",0.6879492036417783,4,0.9451339770453477,0.04322827,"transaminase activity"),
c("GO:0004364","glutathione transferase activity",0.15572971340873956,4,0.9518175766136163,0.22117832,"transaminase activity"),
c("GO:0016765","transferase activity, transferring alkyl or aryl (other than methyl) groups",0.9649344469930834,4,0.9433677768772984,0.26378911,"transaminase activity"),
c("GO:0016769","transferase activity, transferring nitrogenous groups",0.7051208131978367,4,0.9450086337975063,0.25480443,"transaminase activity"),
c("GO:0016779","nucleotidyltransferase activity",1.752960061787236,1,0.9313391284396734,0.29145038,"transaminase activity"),
c("GO:0016209","antioxidant activity",0.6988585343346956,5,0.9739437562746719,0.01365914,"antioxidant activity"),
c("GO:0016491","oxidoreductase activity",11.074819433442528,5,0.9583078331438803,0.06841338,"oxidoreductase activity"),
c("GO:0016705","oxidoreductase activity, acting on paired donors, with incorporation or reduction of molecular oxygen",1.5200093997482385,5,0.9058554786237373,-0,"oxidoreductase activity, acting on paired donors, with incorporation or reduction of molecular oxygen"),
c("GO:0004497","monooxygenase activity",1.324150025517313,5,0.9071329236045428,0.45983527,"oxidoreductase activity, acting on paired donors, with incorporation or reduction of molecular oxygen"),
c("GO:0016614","oxidoreductase activity, acting on CH-OH group of donors",1.9765118486834359,1,0.9033399687420666,0.48988668,"oxidoreductase activity, acting on paired donors, with incorporation or reduction of molecular oxygen"),
c("GO:0016616","oxidoreductase activity, acting on the CH-OH group of donors, NAD or NADP as acceptor",1.716418824266202,1,0.9047051792459577,0.47429504,"oxidoreductase activity, acting on paired donors, with incorporation or reduction of molecular oxygen"),
c("GO:0016620","oxidoreductase activity, acting on the aldehyde or oxo group of donors, NAD or NADP as acceptor",0.5048850468021855,4,0.9152688213406485,0.41304173,"oxidoreductase activity, acting on paired donors, with incorporation or reduction of molecular oxygen"),
c("GO:0016651","oxidoreductase activity, acting on NAD(P)H",0.7080937040349223,5,0.9125660834529801,0.42833259,"oxidoreductase activity, acting on paired donors, with incorporation or reduction of molecular oxygen"),
c("GO:0016684","oxidoreductase activity, acting on peroxide as acceptor",0.4930131281069519,5,0.9154531662377211,0.41200705,"oxidoreductase activity, acting on paired donors, with incorporation or reduction of molecular oxygen"),
c("GO:0016903","oxidoreductase activity, acting on the aldehyde or oxo group of donors",0.6780264710827542,2,0.9129215671098837,0.42630808,"oxidoreductase activity, acting on paired donors, with incorporation or reduction of molecular oxygen"),
c("GO:0030246","carbohydrate binding",0.9999543152678265,4,0.9752339141274818,0.05101246,"carbohydrate binding"),
c("GO:0036094","small molecule binding",36.07758878384602,5,0.9589144700626652,0.08669252,"small molecule binding"),
c("GO:0097367","carbohydrate derivative binding",15.405160165803492,4,0.9643723043166579,0.1537856,"small molecule binding"),
c("GO:0042302","structural constituent of cuticle",0.05559873377550828,5,0.9740463867967059,-0,"structural constituent of cuticle"),
c("GO:0005201","extracellular matrix structural constituent",0.07101760372644227,1,0.9737890692594061,0.45678621,"structural constituent of cuticle"),
c("GO:0008010","structural constituent of chitin-based larval cuticle",0.018156024950717567,5,0.9657024348836419,0.41811004,"structural constituent of cuticle"),
c("GO:0044183","protein folding chaperone",0.39308732596174273,3,0.9780559719723032,0.01423747,"protein folding chaperone"),
c("GO:0050660","flavin adenine dinucleotide binding",1.6455911188531416,5,0.9541423997921271,0.03915362,"flavin adenine dinucleotide binding"),
c("GO:0000166","nucleotide binding",18.306860962763057,5,0.9384640140491738,0.47691452,"flavin adenine dinucleotide binding"),
c("GO:0000217","DNA secondary structure binding",0.08966692774410648,1,0.9662108499761245,0.2947705,"flavin adenine dinucleotide binding"),
c("GO:0000400","four-way junction DNA binding",0.06567862355940028,1,0.9669830319519069,0.28763667,"flavin adenine dinucleotide binding"),
c("GO:0003697","single-stranded DNA binding",0.39424199501667534,1,0.9620186243437256,0.11878505,"flavin adenine dinucleotide binding"),
c("GO:0019842","vitamin binding",1.6333590481842524,3,0.9658596189800733,0.15853064,"flavin adenine dinucleotide binding"),
c("GO:0043168","anion binding",18.460209307667203,3,0.9520316649036655,0.24507523,"flavin adenine dinucleotide binding"),
c("GO:1901265","nucleoside phosphate binding",18.352814171862295,5,0.9518198964769756,0.19740736,"flavin adenine dinucleotide binding"),
c("GO:0051959","dynein light intermediate chain binding",0.0714454206163606,5,0.9196129622169694,-0,"dynein light intermediate chain binding"),
c("GO:0017022","myosin binding",0.06137207905017142,2,0.9204756914241056,0.31234086,"dynein light intermediate chain binding"),
c("GO:0019899","enzyme binding",1.4181256805098825,5,0.8982069368108325,0.52546413,"dynein light intermediate chain binding"),
c("GO:0031625","ubiquitin protein ligase binding",0.17450345356275757,5,0.9083163955413013,0.42350099,"dynein light intermediate chain binding"),
c("GO:0042802","identical protein binding",0.4716899485272982,5,0.907195887938826,0.46645967,"dynein light intermediate chain binding"),
c("GO:0042803","protein homodimerization activity",0.16143321102790584,5,0.9146601480409319,0.42046922,"dynein light intermediate chain binding"),
c("GO:0044389","ubiquitin-like protein ligase binding",0.1916117636810221,5,0.9077057800177468,0.66550385,"dynein light intermediate chain binding"),
c("GO:0045503","dynein light chain binding",0.021628763072452557,5,0.9259424603831329,0.29156983,"dynein light intermediate chain binding"),
c("GO:0045505","dynein intermediate chain binding",0.09979047231268402,5,0.917651159459192,0.40265917,"dynein light intermediate chain binding"),
c("GO:0046983","protein dimerization activity",1.172187720026936,5,0.899866912362346,0.39115013,"dynein light intermediate chain binding"),
c("GO:0050839","cell adhesion molecule binding",0.3026913633133877,3,0.9104265359059435,0.44626496,"dynein light intermediate chain binding"),
c("GO:0061135","endopeptidase regulator activity",0.247821664442128,4,0.9486148227814237,-0,"endopeptidase regulator activity"),
c("GO:0061134","peptidase regulator activity",0.2912210686372611,3,0.9616823938318863,0.63894516,"endopeptidase regulator activity"),
c("GO:0061783","peptidoglycan muralytic activity",0.1852949163370239,3,0.9736828718165141,0.03781613,"peptidoglycan muralytic activity"),
c("GO:0072341","modified amino acid binding",0.2351836042756631,2,0.978603409467484,0.04374521,"modified amino acid binding"),
c("GO:0140097","catalytic activity, acting on DNA",2.757074678035595,1,0.9235365386252591,0.05112468,"catalytic activity, acting on DNA"),
c("GO:0008094","ATP-dependent activity, acting on DNA",1.0453989461254773,1,0.8364203237185991,0.6998087,"catalytic activity, acting on DNA"),
c("GO:0034061","DNA polymerase activity",0.44312225742907846,1,0.8834596987399841,0.5638044,"catalytic activity, acting on DNA"),
c("GO:1901505","carbohydrate derivative transmembrane transporter activity",0.25198196542266027,5,0.8437556614856057,0,"carbohydrate derivative transmembrane transporter activity"),
c("GO:0005272","sodium channel activity",0.09140875365305967,1,0.8405823825938774,0.5182855,"carbohydrate derivative transmembrane transporter activity"),
c("GO:0005326","neurotransmitter transmembrane transporter activity",0.009783037248030313,3,0.88467628339355,0.27436998,"carbohydrate derivative transmembrane transporter activity"),
c("GO:0008509","monoatomic anion transmembrane transporter activity",0.3541145169337237,5,0.8237442285548383,0.46169587,"carbohydrate derivative transmembrane transporter activity"),
c("GO:0008514","organic anion transmembrane transporter activity",0.9131293140067489,5,0.8351007644631914,0.51572243,"carbohydrate derivative transmembrane transporter activity"),
c("GO:0015075","monoatomic ion transmembrane transporter activity",3.3706579559655494,2,0.7878539879494861,0.66677437,"carbohydrate derivative transmembrane transporter activity"),
c("GO:0015605","organophosphate ester transmembrane transporter activity",0.1749967526297042,5,0.8306164285929529,0.33853904,"carbohydrate derivative transmembrane transporter activity"),
c("GO:0015932","nucleobase-containing compound transmembrane transporter activity",0.20710702950515578,5,0.8305023328860474,0.343228,"carbohydrate derivative transmembrane transporter activity"),
c("GO:0016887","ATP hydrolysis activity",4.031207233999447,5,0.7791666731574686,0.68796146,"carbohydrate derivative transmembrane transporter activity"),
c("GO:0022804","active transmembrane transporter activity",3.3408417380253232,5,0.8123219108170291,0.44495218,"carbohydrate derivative transmembrane transporter activity"),
c("GO:0042626","ATPase-coupled transmembrane transporter activity",1.530486548072769,5,0.741744430733172,0.550868,"carbohydrate derivative transmembrane transporter activity"));


stuff <- data.frame(revigo.data);
names(stuff) <- revigo.names;

#stuff$value <- as.numeric( as.character(stuff$value) );
stuff$frequency <- as.numeric( as.character(stuff$frequency) );
stuff$uniqueness <- as.numeric( as.character(stuff$uniqueness) );
stuff$dispensability <- as.numeric( as.character(stuff$dispensability) );

# Suppose your original 'value' column has numeric codes
stuff$value <- droplevels(factor(stuff$value,
                                 levels = c("1", "2", "3", "4", "5"),
                                 labels = c("gregaria", "piceifrons", "cancellata", "shared", "overlap")))

my_palette <- c(
  "gregaria" = "#FFC067",
  "piceifrons" = "#FF474C",
  "cancellata" = "orchid",
  "shared" = "gray20",
  "overlap" = "gray50"
)


# check the tmPlot command documentation for all possible parameters - there are a lot more
treemap(
  stuff,
  index = c("representative","description"),
  vSize = "uniqueness",
  type = "categorical",
  vColor = "value",

  # === Customization ===
  palette = my_palette,
  title = "Revigo MF Medium TreeMap",
  inflate.labels = FALSE,
  lowerbound.cex.labels = 0,
  bg.labels = "#CCCCCCAA",

  # === Add custom legend label ===
  position.legend = "right",  # optional: moves the legend
  title.legend = "Species Category"  # set your custom label
)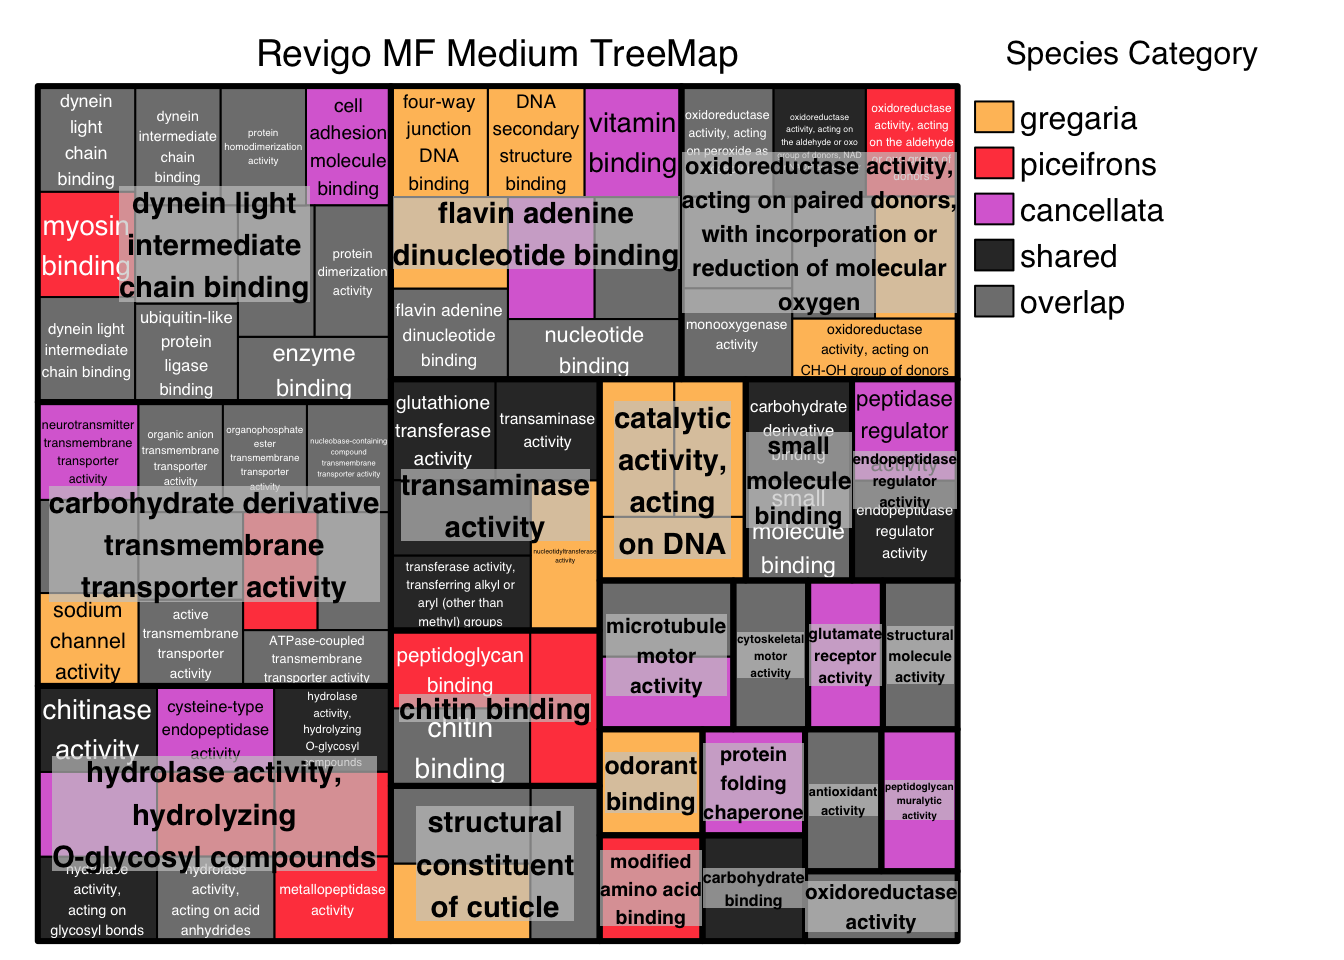
The following graph is with Small threshold:
# A plotting R script produced by the Revigo server at http://revigo.irb.hr/
# If you found Revigo useful in your work, please cite the following reference:
# Supek F et al. "REVIGO summarizes and visualizes long lists of Gene Ontology terms" PLoS ONE 2011. doi:10.1371/journal.pone.0021800

# Load required packages
library(ggplot2)
library(scales)

# Define column names and data matrix
revigo.names <- c("term_ID","description","frequency","plot_X","plot_Y","log_size","value","uniqueness","dispensability");
revigo.data <- rbind(c("GO:0000166","nucleotide binding",18.306860962763057,-6.166019207757083,1.0344483857477995,6.9236120800790015,5,0.9384640140491738,0.47691452),
c("GO:0000217","DNA secondary structure binding",0.08966692774410648,-5.250004657435401,3.73299050866224,4.61364100671677,1,0.9662108499761245,0.2947705),
c("GO:0000400","four-way junction DNA binding",0.06567862355940028,-5.57732345649082,4.080060295532646,4.478436620683433,1,0.9669830319519069,0.28763667),
c("GO:0003697","single-stranded DNA binding",0.39424199501667534,-5.76777412408896,3.3785645377453397,5.256763433469915,1,0.9620186243437256,0.11878505),
c("GO:0003774","cytoskeletal motor activity",0.38116520426412076,0.21069129795277736,-1.8870262097672212,5.242113880094346,5,1,-0),
c("GO:0003777","microtubule motor activity",0.199336477831129,3.5528652401986056,-6.9985652064543835,4.960589680883954,5,0.9143088259155144,-0),
c("GO:0004197","cysteine-type endopeptidase activity",0.20777713045007887,1.283503950188117,6.278016015692366,4.978600451516357,3,0.9027862084861842,0.317331),
c("GO:0004364","glutathione transferase activity",0.15572971340873956,-1.8642684326450791,6.400502982813087,4.853375716612023,4,0.9518175766136163,0.22117832),
c("GO:0004497","monooxygenase activity",1.324150025517313,-1.327783634565009,-7.037637541381393,5.7829360542600465,5,0.9071329236045428,0.45983527),
c("GO:0004553","hydrolase activity, hydrolyzing O-glycosyl compounds",1.5623305307616389,2.077053172945376,5.932351350320358,5.85477167163393,4,0.8989709573248049,0.04747689),
c("GO:0004722","protein serine/threonine phosphatase activity",0.274745752896937,1.422121091649169,6.676386846195583,5.099932583098006,3,0.9073263186172956,0.23377277),
c("GO:0005198","structural molecule activity",3.0956240814896883,2.653683361366452,-5.203790050064718,6.151746667822227,5,1,-0),
c("GO:0005201","extracellular matrix structural constituent",0.07101760372644227,-6.097046001747512,-3.817247193472764,4.512377507312931,1,0.9737890692594061,0.45678621),
c("GO:0005326","neurotransmitter transmembrane transporter activity",0.009783037248030313,5.194501826932789,4.3655113298794985,3.651568738865792,3,0.88467628339355,0.27436998),
c("GO:0005539","glycosaminoglycan binding",0.16800107338384584,1.7658756554125514,1.678422386408637,4.886315844136417,2,0.9712292670307245,0.24326222),
c("GO:0005549","odorant binding",0.13424501112574927,1.653274995216632,-3.231023567442697,4.788903361652433,1,0.9796664103847584,0.04145723),
c("GO:0008010","structural constituent of chitin-based larval cuticle",0.018156024950717567,-5.842570840183214,-4.125883765175455,3.920071124297524,5,0.9657024348836419,0.41811004),
c("GO:0008061","chitin binding",0.1333151642119472,2.1865276034184733,0.9081301995677111,4.785884807638073,5,0.9717139938182623,0.04143037),
c("GO:0008066","glutamate receptor activity",0.06107522651430972,-3.7593936654876985,-2.895419807927129,4.446878752254525,3,1,-0),
c("GO:0008483","transaminase activity",0.6879492036417783,-2.1345806774085707,5.727251538742545,5.498555895327498,4,0.9451339770453477,0.04322827),
c("GO:0008509","monoatomic anion transmembrane transporter activity",0.3541145169337237,5.244353616786585,3.717275470983357,5.210144553124945,5,0.8237442285548383,0.46169587),
c("GO:0015605","organophosphate ester transmembrane transporter activity",0.1749967526297042,5.999658290793791,3.4770226572932166,4.904033551734992,5,0.8306164285929529,0.33853904),
c("GO:0015645","fatty acid ligase activity",0.18793166533203076,3.789778443834059,-6.856970332850818,4.935003151453655,3,0.8743729487206431,0.40693071),
c("GO:0015932","nucleobase-containing compound transmembrane transporter activity",0.20710702950515578,5.759348514367572,4.026567130282069,4.977197561930761,5,0.8305023328860474,0.343228),
c("GO:0016209","antioxidant activity",0.6988585343346956,5.175926562756775,-6.2003013991089855,5.505388774621988,5,0.9739437562746719,0.01365914),
c("GO:0016491","oxidoreductase activity",11.074819433442528,2.205438808131288,-7.758532483262516,6.705334884838153,5,0.9583078331438803,0.06841338),
c("GO:0016614","oxidoreductase activity, acting on CH-OH group of donors",1.9765118486834359,-1.326601264369203,-6.684830243746808,5.956898046912602,1,0.9033399687420666,0.48988668),
c("GO:0016616","oxidoreductase activity, acting on the CH-OH group of donors, NAD or NADP as acceptor",1.716418824266202,-1.4067150106687032,-6.393508198891303,5.895621966287966,1,0.9047051792459577,0.47429504),
c("GO:0016620","oxidoreductase activity, acting on the aldehyde or oxo group of donors, NAD or NADP as acceptor",0.5048850468021855,-1.8450270711153096,-6.3551390816700914,5.3641925310598335,4,0.9152688213406485,0.41304173),
c("GO:0016651","oxidoreductase activity, acting on NAD(P)H",0.7080937040349223,-1.9554182971707477,-6.745344952309763,5.511090216773934,5,0.9125660834529801,0.42833259),
c("GO:0016684","oxidoreductase activity, acting on peroxide as acceptor",0.4930131281069519,-0.9035265730351119,-6.543454007051701,5.353858551860327,5,0.9154531662377211,0.41200705),
c("GO:0016705","oxidoreductase activity, acting on paired donors, with incorporation or reduction of molecular oxygen",1.5200093997482385,-1.64043390945899,-6.890931254280247,5.842845042414387,5,0.9058554786237373,-0),
c("GO:0016765","transferase activity, transferring alkyl or aryl (other than methyl) groups",0.9649344469930834,-2.583085912172032,6.24918375642444,5.645496937999086,4,0.9433677768772984,0.26378911),
c("GO:0016769","transferase activity, transferring nitrogenous groups",0.7051208131978367,-3.0995014384075255,5.860019606282201,5.509263023539896,4,0.9450086337975063,0.25480443),
c("GO:0016779","nucleotidyltransferase activity",1.752960061787236,-2.654814388714235,5.667238553037513,5.904770707450465,1,0.9313391284396734,0.29145038),
c("GO:0016798","hydrolase activity, acting on glycosyl bonds",1.966951450837302,2.422256985398547,6.370810964838175,5.954792267676311,4,0.9056055746796973,0.29066882),
c("GO:0016817","hydrolase activity, acting on acid anhydrides",5.886841166627846,2.0111726782595265,6.428900729649209,6.430880624395314,5,0.8924182291279875,0.34769831),
c("GO:0016903","oxidoreductase activity, acting on the aldehyde or oxo group of donors",0.6780264710827542,-0.9337821436586446,-6.979661356954149,5.492246192885036,2,0.9129215671098837,0.42630808),
c("GO:0017022","myosin binding",0.06137207905017142,6.7936370228020415,-1.9008918826771404,4.4489844265948015,2,0.9204756914241056,0.31234086),
c("GO:0019842","vitamin binding",1.6333590481842524,-4.811274108323596,-0.23817118179142496,5.87408038819682,3,0.9658596189800733,0.15853064),
c("GO:0022804","active transmembrane transporter activity",3.3408417380253232,5.601637676423435,3.7376525583708577,6.184854331656157,5,0.8123219108170291,0.44495218),
c("GO:0030246","carbohydrate binding",0.9999543152678265,-2.0048306025729627,-1.8979597491922526,5.660979252046847,4,0.9752339141274818,0.05101246),
c("GO:0031625","ubiquitin protein ligase binding",0.17450345356275757,6.701107398956691,-2.4788645891504673,4.902807603794222,5,0.9083163955413013,0.42350099),
c("GO:0036094","small molecule binding",36.07758878384602,-7.2607067623983355,-0.5366873409501115,7.218235675531778,5,0.9589144700626652,0.08669252),
c("GO:0042302","structural constituent of cuticle",0.05559873377550828,-6.147850839408622,-4.090825253705897,4.406080095600492,5,0.9740463867967059,-0),
c("GO:0042802","identical protein binding",0.4716899485272982,6.315278811238851,-2.084474753554402,5.33465677657078,5,0.907195887938826,0.46645967),
c("GO:0042803","protein homodimerization activity",0.16143321102790584,6.433990926825673,-2.9004136566540852,4.868996902487136,5,0.9146601480409319,0.42046922),
c("GO:0042834","peptidoglycan binding",0.04558869164711314,1.2693312090657418,0.8064900109414695,4.31987606673915,2,0.9737797144660709,0.22109503),
c("GO:0043168","anion binding",18.460209307667203,-6.118763998088452,-0.01552065055635672,6.927234817369778,3,0.9520316649036655,0.24507523),
c("GO:0044183","protein folding chaperone",0.39308732596174273,-1.7160434542394003,0.3070507676657476,5.2554895980755365,3,0.9780559719723032,0.01423747),
c("GO:0045503","dynein light chain binding",0.021628763072452557,6.401842621287333,-1.4894315439768033,3.9960736544852753,5,0.9259424603831329,0.29156983),
c("GO:0045505","dynein intermediate chain binding",0.09979047231268402,5.811080317801577,-2.0443447772659415,4.660096722614944,5,0.917651159459192,0.40265917),
c("GO:0046983","protein dimerization activity",1.172187720026936,6.290950986918404,-2.4323370571211735,5.729996121186026,5,0.899866912362346,0.39115013),
c("GO:0050660","flavin adenine dinucleotide binding",1.6455911188531416,-5.696559415127466,1.0602050595173869,5.877320656022554,5,0.9541423997921271,0.03915362),
c("GO:0050839","cell adhesion molecule binding",0.3026913633133877,5.896410246605711,-2.562252781920344,5.142001306282736,3,0.9104265359059435,0.44626496),
c("GO:0051959","dynein light intermediate chain binding",0.0714454206163606,6.000372090370421,-3.0597020475961325,4.514985810494037,5,0.9196129622169694,-0),
c("GO:0061135","endopeptidase regulator activity",0.247821664442128,-2.259688508409582,2.387247396882732,5.055141239751874,4,0.9486148227814237,-0),
c("GO:0061783","peptidoglycan muralytic activity",0.1852949163370239,7.6318378766800485,1.4315273258627697,4.928866765396401,3,0.9736828718165141,0.03781613),
c("GO:0072341","modified amino acid binding",0.2351836042756631,-0.1865240443470377,3.426589784601803,5.032409217607479,2,0.978603409467484,0.04374521),
c("GO:0097367","carbohydrate derivative binding",15.405160165803492,-7.0463419114346895,-1.6858338346742447,6.848664424657691,4,0.9643723043166579,0.1537856),
c("GO:0140097","catalytic activity, acting on DNA",2.757074678035595,-5.067648726908721,-5.851876110817095,6.101447018509672,1,0.9235365386252591,0.05112468),
c("GO:1901265","nucleoside phosphate binding",18.352814171862295,-6.586159776939326,1.7770696365466563,6.924700864043428,5,0.9518198964769756,0.19740736),
c("GO:1901505","carbohydrate derivative transmembrane transporter activity",0.25198196542266027,5.587546247114569,3.3175536997698662,5.062371366143577,5,0.8437556614856057,0));

# Convert to data frame
one.data <- data.frame(revigo.data)
names(one.data) <- revigo.names

# Filter out rows with null coordinates
one.data <- one.data[one.data$plot_X != "null" & one.data$plot_Y != "null", ]

# Ensure numeric conversion
one.data$plot_X <- as.numeric(as.character(one.data$plot_X))
one.data$plot_Y <- as.numeric(as.character(one.data$plot_Y))
one.data$log_size <- as.numeric(as.character(one.data$log_size))
one.data$value <- as.factor(one.data$value)
one.data$frequency <- as.numeric(as.character(one.data$frequency))
one.data$uniqueness <- as.numeric(as.character(one.data$uniqueness))
one.data$dispensability <- as.numeric(as.character(one.data$dispensability))

# Base plot
p1 <- ggplot(data = one.data) +
geom_point(aes(plot_X, plot_Y, color = value, size = uniqueness), alpha = 0.9) +
  scale_color_manual(
    values = c(
      "1" = "#FFC067",   # gregaria
      "2" = "#FF474C",   # piceifrons
      "3" = "orchid",    # cancellata
      "4" = "#895129",     # shared
      "5" = "gray50"     # overlap
    ),
    labels = c(
      "1" = "gregaria",
      "2" = "piceifrons",
      "3" = "cancellata",
      "4" = "shared",
      "5" = "overlap"
    ),
    name = "Species"
  ) +
  scale_size(range = c(5, 20))

# Add labels for representative terms
ex <- one.data[one.data$dispensability < 0.05, ]
p1 <- p1 + geom_text(data = ex, aes(plot_X, plot_Y, label = description),
                     colour = alpha("gray30", 0.95), fontface = "bold", size = 3)

# Customize axes and legend
p1 <- p1 +
  labs(x = "Semantic Space y", y = "Semantic Space x",
  title = "Semantic Clustering of MF GO Terms (Small threshold)") +
  theme_bw() +
  theme(
    panel.border = element_blank(),
    legend.key = element_blank(),
    axis.title.x = element_text(size = 20, face = "bold", family = "Arial", color = "gray50"),
    axis.title.y = element_text(size = 20, face = "bold", family = "Arial", color = "gray50"),
    axis.text.x  = element_text(size = 12, angle = 0, hjust = 1),
    axis.text.y  = element_text(size = 12),
    legend.title = element_text(size = 10, face = "bold"),
    legend.text  = element_text(size = 12)
  )

# Adjust plot limits
one.x_range <- max(one.data$plot_X) - min(one.data$plot_X)
one.y_range <- max(one.data$plot_Y) - min(one.data$plot_Y)
p1 <- p1 +
  xlim(min(one.data$plot_X) - one.x_range / 10, max(one.data$plot_X) + one.x_range / 10) +
  ylim(min(one.data$plot_Y) - one.y_range / 10, max(one.data$plot_Y) + one.y_range / 10)

# Show plot
p1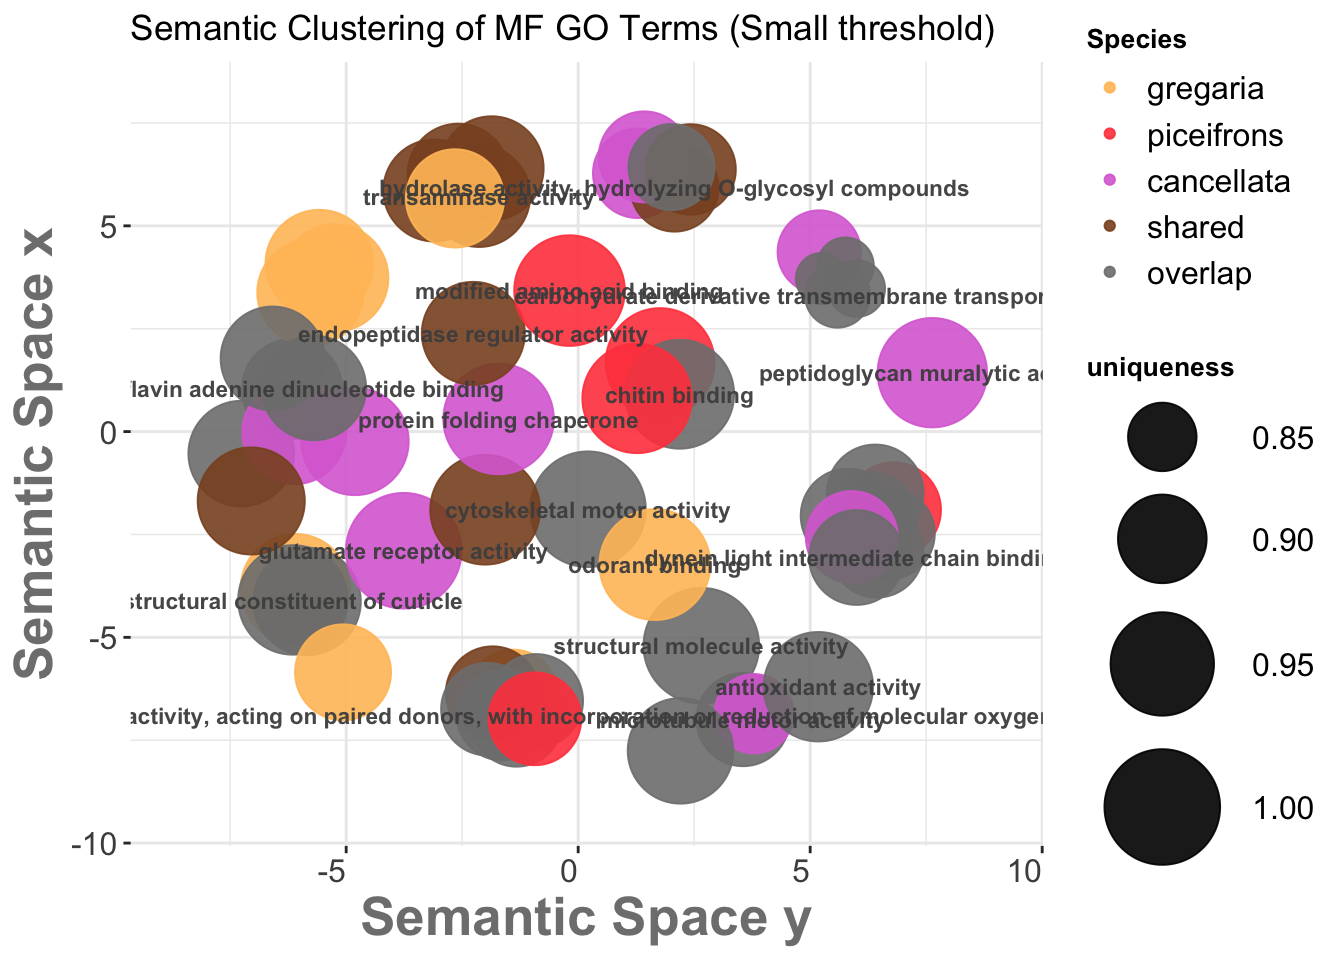
# Optional: Save to file
# ggsave("revigo-plot.pdf", plot = p1, width = 10, height = 8)
Below we do the Treemap view with Small threshold, colored by Species Category instead of representative:
revigo.names <- c("term_ID","description","frequency","value","uniqueness","dispensability","representative");
revigo.data <- rbind(c("GO:0003774","cytoskeletal motor activity",0.38116520426412076,5,1,-0,"cytoskeletal motor activity"),
c("GO:0003777","microtubule motor activity",0.199336477831129,5,0.9143088259155144,-0,"microtubule motor activity"),
c("GO:0015645","fatty acid ligase activity",0.18793166533203076,3,0.8743729487206431,0.40693071,"microtubule motor activity"),
c("GO:0004553","hydrolase activity, hydrolyzing O-glycosyl compounds",1.5623305307616389,4,0.8989709573248049,0.04747689,"hydrolase activity, hydrolyzing O-glycosyl compounds"),
c("GO:0004197","cysteine-type endopeptidase activity",0.20777713045007887,3,0.9027862084861842,0.317331,"hydrolase activity, hydrolyzing O-glycosyl compounds"),
c("GO:0004722","protein serine/threonine phosphatase activity",0.274745752896937,3,0.9073263186172956,0.23377277,"hydrolase activity, hydrolyzing O-glycosyl compounds"),
c("GO:0016798","hydrolase activity, acting on glycosyl bonds",1.966951450837302,4,0.9056055746796973,0.29066882,"hydrolase activity, hydrolyzing O-glycosyl compounds"),
c("GO:0016817","hydrolase activity, acting on acid anhydrides",5.886841166627846,5,0.8924182291279875,0.34769831,"hydrolase activity, hydrolyzing O-glycosyl compounds"),
c("GO:0005198","structural molecule activity",3.0956240814896883,5,1,-0,"structural molecule activity"),
c("GO:0005549","odorant binding",0.13424501112574927,1,0.9796664103847584,0.04145723,"odorant binding"),
c("GO:0008061","chitin binding",0.1333151642119472,5,0.9717139938182623,0.04143037,"chitin binding"),
c("GO:0005539","glycosaminoglycan binding",0.16800107338384584,2,0.9712292670307245,0.24326222,"chitin binding"),
c("GO:0042834","peptidoglycan binding",0.04558869164711314,2,0.9737797144660709,0.22109503,"chitin binding"),
c("GO:0008066","glutamate receptor activity",0.06107522651430972,3,1,-0,"glutamate receptor activity"),
c("GO:0008483","transaminase activity",0.6879492036417783,4,0.9451339770453477,0.04322827,"transaminase activity"),
c("GO:0004364","glutathione transferase activity",0.15572971340873956,4,0.9518175766136163,0.22117832,"transaminase activity"),
c("GO:0016765","transferase activity, transferring alkyl or aryl (other than methyl) groups",0.9649344469930834,4,0.9433677768772984,0.26378911,"transaminase activity"),
c("GO:0016769","transferase activity, transferring nitrogenous groups",0.7051208131978367,4,0.9450086337975063,0.25480443,"transaminase activity"),
c("GO:0016779","nucleotidyltransferase activity",1.752960061787236,1,0.9313391284396734,0.29145038,"transaminase activity"),
c("GO:0016209","antioxidant activity",0.6988585343346956,5,0.9739437562746719,0.01365914,"antioxidant activity"),
c("GO:0016491","oxidoreductase activity",11.074819433442528,5,0.9583078331438803,0.06841338,"oxidoreductase activity"),
c("GO:0016705","oxidoreductase activity, acting on paired donors, with incorporation or reduction of molecular oxygen",1.5200093997482385,5,0.9058554786237373,-0,"oxidoreductase activity, acting on paired donors, with incorporation or reduction of molecular oxygen"),
c("GO:0004497","monooxygenase activity",1.324150025517313,5,0.9071329236045428,0.45983527,"oxidoreductase activity, acting on paired donors, with incorporation or reduction of molecular oxygen"),
c("GO:0016614","oxidoreductase activity, acting on CH-OH group of donors",1.9765118486834359,1,0.9033399687420666,0.48988668,"oxidoreductase activity, acting on paired donors, with incorporation or reduction of molecular oxygen"),
c("GO:0016616","oxidoreductase activity, acting on the CH-OH group of donors, NAD or NADP as acceptor",1.716418824266202,1,0.9047051792459577,0.47429504,"oxidoreductase activity, acting on paired donors, with incorporation or reduction of molecular oxygen"),
c("GO:0016620","oxidoreductase activity, acting on the aldehyde or oxo group of donors, NAD or NADP as acceptor",0.5048850468021855,4,0.9152688213406485,0.41304173,"oxidoreductase activity, acting on paired donors, with incorporation or reduction of molecular oxygen"),
c("GO:0016651","oxidoreductase activity, acting on NAD(P)H",0.7080937040349223,5,0.9125660834529801,0.42833259,"oxidoreductase activity, acting on paired donors, with incorporation or reduction of molecular oxygen"),
c("GO:0016684","oxidoreductase activity, acting on peroxide as acceptor",0.4930131281069519,5,0.9154531662377211,0.41200705,"oxidoreductase activity, acting on paired donors, with incorporation or reduction of molecular oxygen"),
c("GO:0016903","oxidoreductase activity, acting on the aldehyde or oxo group of donors",0.6780264710827542,2,0.9129215671098837,0.42630808,"oxidoreductase activity, acting on paired donors, with incorporation or reduction of molecular oxygen"),
c("GO:0030246","carbohydrate binding",0.9999543152678265,4,0.9752339141274818,0.05101246,"carbohydrate binding"),
c("GO:0036094","small molecule binding",36.07758878384602,5,0.9589144700626652,0.08669252,"small molecule binding"),
c("GO:0097367","carbohydrate derivative binding",15.405160165803492,4,0.9643723043166579,0.1537856,"small molecule binding"),
c("GO:0042302","structural constituent of cuticle",0.05559873377550828,5,0.9740463867967059,-0,"structural constituent of cuticle"),
c("GO:0005201","extracellular matrix structural constituent",0.07101760372644227,1,0.9737890692594061,0.45678621,"structural constituent of cuticle"),
c("GO:0008010","structural constituent of chitin-based larval cuticle",0.018156024950717567,5,0.9657024348836419,0.41811004,"structural constituent of cuticle"),
c("GO:0044183","protein folding chaperone",0.39308732596174273,3,0.9780559719723032,0.01423747,"protein folding chaperone"),
c("GO:0050660","flavin adenine dinucleotide binding",1.6455911188531416,5,0.9541423997921271,0.03915362,"flavin adenine dinucleotide binding"),
c("GO:0000166","nucleotide binding",18.306860962763057,5,0.9384640140491738,0.47691452,"flavin adenine dinucleotide binding"),
c("GO:0000217","DNA secondary structure binding",0.08966692774410648,1,0.9662108499761245,0.2947705,"flavin adenine dinucleotide binding"),
c("GO:0000400","four-way junction DNA binding",0.06567862355940028,1,0.9669830319519069,0.28763667,"flavin adenine dinucleotide binding"),
c("GO:0003697","single-stranded DNA binding",0.39424199501667534,1,0.9620186243437256,0.11878505,"flavin adenine dinucleotide binding"),
c("GO:0019842","vitamin binding",1.6333590481842524,3,0.9658596189800733,0.15853064,"flavin adenine dinucleotide binding"),
c("GO:0043168","anion binding",18.460209307667203,3,0.9520316649036655,0.24507523,"flavin adenine dinucleotide binding"),
c("GO:1901265","nucleoside phosphate binding",18.352814171862295,5,0.9518198964769756,0.19740736,"flavin adenine dinucleotide binding"),
c("GO:0051959","dynein light intermediate chain binding",0.0714454206163606,5,0.9196129622169694,-0,"dynein light intermediate chain binding"),
c("GO:0017022","myosin binding",0.06137207905017142,2,0.9204756914241056,0.31234086,"dynein light intermediate chain binding"),
c("GO:0031625","ubiquitin protein ligase binding",0.17450345356275757,5,0.9083163955413013,0.42350099,"dynein light intermediate chain binding"),
c("GO:0042802","identical protein binding",0.4716899485272982,5,0.907195887938826,0.46645967,"dynein light intermediate chain binding"),
c("GO:0042803","protein homodimerization activity",0.16143321102790584,5,0.9146601480409319,0.42046922,"dynein light intermediate chain binding"),
c("GO:0045503","dynein light chain binding",0.021628763072452557,5,0.9259424603831329,0.29156983,"dynein light intermediate chain binding"),
c("GO:0045505","dynein intermediate chain binding",0.09979047231268402,5,0.917651159459192,0.40265917,"dynein light intermediate chain binding"),
c("GO:0046983","protein dimerization activity",1.172187720026936,5,0.899866912362346,0.39115013,"dynein light intermediate chain binding"),
c("GO:0050839","cell adhesion molecule binding",0.3026913633133877,3,0.9104265359059435,0.44626496,"dynein light intermediate chain binding"),
c("GO:0061135","endopeptidase regulator activity",0.247821664442128,4,0.9486148227814237,-0,"endopeptidase regulator activity"),
c("GO:0061783","peptidoglycan muralytic activity",0.1852949163370239,3,0.9736828718165141,0.03781613,"peptidoglycan muralytic activity"),
c("GO:0072341","modified amino acid binding",0.2351836042756631,2,0.978603409467484,0.04374521,"modified amino acid binding"),
c("GO:0140097","catalytic activity, acting on DNA",2.757074678035595,1,0.9235365386252591,0.05112468,"catalytic activity, acting on DNA"),
c("GO:1901505","carbohydrate derivative transmembrane transporter activity",0.25198196542266027,5,0.8437556614856057,0,"carbohydrate derivative transmembrane transporter activity"),
c("GO:0005326","neurotransmitter transmembrane transporter activity",0.009783037248030313,3,0.88467628339355,0.27436998,"carbohydrate derivative transmembrane transporter activity"),
c("GO:0008509","monoatomic anion transmembrane transporter activity",0.3541145169337237,5,0.8237442285548383,0.46169587,"carbohydrate derivative transmembrane transporter activity"),
c("GO:0015605","organophosphate ester transmembrane transporter activity",0.1749967526297042,5,0.8306164285929529,0.33853904,"carbohydrate derivative transmembrane transporter activity"),
c("GO:0015932","nucleobase-containing compound transmembrane transporter activity",0.20710702950515578,5,0.8305023328860474,0.343228,"carbohydrate derivative transmembrane transporter activity"),
c("GO:0022804","active transmembrane transporter activity",3.3408417380253232,5,0.8123219108170291,0.44495218,"carbohydrate derivative transmembrane transporter activity"));


stuff <- data.frame(revigo.data);
names(stuff) <- revigo.names;

#stuff$value <- as.numeric( as.character(stuff$value) );
stuff$frequency <- as.numeric( as.character(stuff$frequency) );
stuff$uniqueness <- as.numeric( as.character(stuff$uniqueness) );
stuff$dispensability <- as.numeric( as.character(stuff$dispensability) );

# Suppose your original 'value' column has numeric codes
stuff$value <- droplevels(factor(stuff$value,
                                 levels = c("1", "2", "3", "4", "5"),
                                 labels = c("gregaria", "piceifrons", "cancellata", "shared", "overlap")))

my_palette <- c(
  "gregaria" = "#FFC067",
  "piceifrons" = "#FF474C",
  "cancellata" = "orchid",
  "shared" = "gray20",
  "overlap" = "gray50"
)


# check the tmPlot command documentation for all possible parameters - there are a lot more
treemap(
  stuff,
  index = c("representative","description"),
  vSize = "uniqueness",
  type = "categorical",
  vColor = "value",

  # === Customization ===
  palette = my_palette,
  title = "Revigo MF Small TreeMap",
  inflate.labels = FALSE,
  lowerbound.cex.labels = 0,
  bg.labels = "#CCCCCCAA",

  # === Add custom legend label ===
  position.legend = "right",  # optional: moves the legend
  title.legend = "Species Category"  # set your custom label
)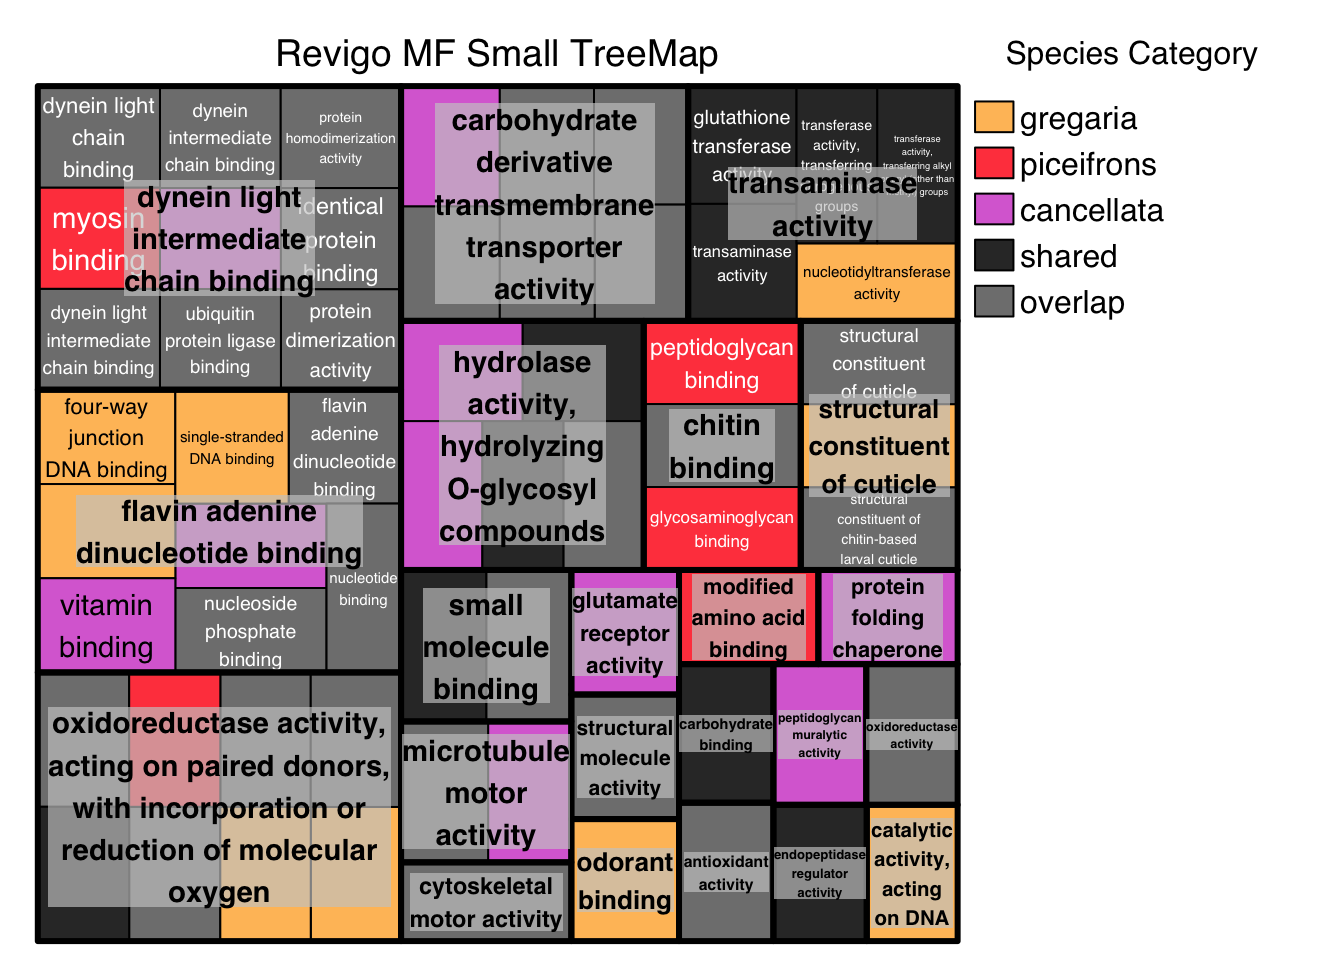
CC
Cellular Components
The locations relative to cellular structures in which a gene product performs a function, either cellular compartments (e.g., mitochondrion), or stable macromolecular complexes of which they are parts (e.g., the ribosome). Unlike the other aspects of GO, cellular component classes refer not to processes but rather a cellular anatomy.
The following graph is with Medium threshold:
# A plotting R script produced by the Revigo server at http://revigo.irb.hr/
# If you found Revigo useful in your work, please cite the following reference:
# Supek F et al. "REVIGO summarizes and visualizes long lists of Gene Ontology terms" PLoS ONE 2011. doi:10.1371/journal.pone.0021800

# Load required packages
library(ggplot2)
library(scales)

# Define column names and data matrix
revigo.names <- c("term_ID","description","frequency","plot_X","plot_Y","log_size","value","uniqueness","dispensability");
revigo.data <- rbind(c("GO:0000151","ubiquitin ligase complex",0.6489384836950033,2.2426800328438365,6.515436372632418,5.415078568117199,5,0.8555988615885974,-0),
c("GO:0000228","nuclear chromosome",0.5063582681316038,-4.851604000066381,4.045224762286451,5.307333414461482,1,0.6637479495177067,0.67481231),
c("GO:0000775","chromosome, centromeric region",0.347892831400935,-5.023217000708416,5.519882622630157,5.14432196338084,4,0.6810407475030481,0.64256047),
c("GO:0000793","condensed chromosome",0.39171817531559905,-5.388882839129091,5.361925656340504,5.195849857830673,4,0.693225129972277,0.45410983),
c("GO:0000794","condensed nuclear chromosome",0.07330258514132944,-4.560360874153439,4.385277059023914,4.4680074432592365,4,0.6938323541400554,0.56414334),
c("GO:0005576","extracellular region",3.728201021160707,6.9099199647069804,2.260416779609363,6.174372980219259,5,0.9999302039648567,4.906E-05),
c("GO:0005615","extracellular space",1.906263969905416,6.634640526395799,3.65063604419048,5.883056976362223,5,0.9999350812453305,4.364E-05),
c("GO:0005657","replication fork",0.3308597620186258,-5.229408476113165,5.590094108682844,5.122520596907223,1,0.6971985701571811,0.63969416),
c("GO:0005694","chromosome",2.4935006213976125,-5.476530822633389,4.533383292763286,5.99968328386563,1,0.6897226791989206,0.57148838),
c("GO:0005774","vacuolar membrane",0.6988798623380645,-6.817020648303892,0.4655037950621372,5.447277445905993,3,0.7311377075106759,0.66001412),
c("GO:0005856","cytoskeleton",3.1141546278807093,-5.326312456981579,4.366651949305802,6.096213889361101,5,0.6831636768543166,0.18722925),
c("GO:0005875","microtubule associated complex",0.3539489783963737,-2.1714495834161336,5.772910261335346,5.151817093375288,5,0.5963764523691488,0.65846891),
c("GO:0005918","septate junction",0.002417967218203575,1.2048711769305007,-5.4810222643457385,2.9867717342662448,3,0.9148710128492464,0.59606825),
c("GO:0008074","guanylate cyclase complex, soluble",0.01256145198806687,3.373844547292616,5.73059039814045,3.7019994748896368,3,0.8573435804190799,0.35480592),
c("GO:0009986","cell surface",0.6195435881011558,6.783837551838846,0.370100148896147,5.394946984319184,4,0.9999418867418022,3.818E-05),
c("GO:0016028","rhabdomere",0.004039926652499059,-3.345237473607005,-4.686050025786406,3.2095150145426308,3,0.8628407267101723,0.51584367),
c("GO:0016324","apical plasma membrane",0.18284473468923318,2.0055928884165724,-2.047936035540394,4.8649617539821,5,0.9003924300224494,0.26935919),
c("GO:0016607","nuclear speck",0.1457268168659327,-4.025122954133858,0.4624164307066332,4.7664202835980785,3,0.8352051416124956,0.16571565),
c("GO:0019867","outer membrane",1.1089960482829875,6.013068703422308,-2.433804064153154,5.647804344281853,5,0.9746495861342663,0.08686934),
c("GO:0030286","dynein complex",0.16402251928478576,-1.4945257404795438,5.9233037617717885,4.817783453575271,5,0.57841622653042,0.66691576),
c("GO:0030312","external encapsulating structure",1.3664334496943666,2.9955670166060338,-2.421160438433705,5.7384626463741535,5,0.9514401410816343,0.3041977),
c("GO:0030427","site of polarized growth",0.13847041988911535,4.353729765719461,0.6127788794517985,4.74423820378745,2,0.9999490037454304,3.273E-05),
c("GO:0030496","midbody",0.07692329766311827,6.264943086102114,-0.9282453080591541,4.488945350313971,4,0.9999513386488801,3.099E-05),
c("GO:0031012","extracellular matrix",0.607880452107468,3.5187277001163473,-2.879701636399464,5.386693329027072,5,0.9362781078494774,0.5359448),
c("GO:0031090","organelle membrane",5.734140636609097,-5.709456470465405,1.9436977052685227,6.361341897791151,5,0.7964596488938447,0.26098095),
c("GO:0031410","cytoplasmic vesicle",2.3616677585780756,-6.609013203905268,1.9156562679483187,5.97609262800176,5,0.7815722250240331,0.22916015),
c("GO:0031461","cullin-RING ubiquitin ligase complex",0.38220600706400765,2.4630165023855697,6.558303145775024,5.1851737123573365,5,0.8560094575648142,0.64240848),
c("GO:0031519","PcG protein complex",0.08166440985567432,-0.23276079280980377,4.527510578683516,4.514919466490317,3,0.8023742023934749,0.22171291),
c("GO:0031967","organelle envelope",2.2129490503864195,-7.162029018582746,2.2468263721218245,5.947845273287176,5,0.8228104982358275,0.22712961),
c("GO:0031968","organelle outer membrane",0.44340378418107956,-6.946846429825773,0.14879592690814278,5.249675207754881,5,0.7595111120174636,0.60232512),
c("GO:0031982","vesicle",2.559826285649265,-5.427964852064421,1.126356804048262,6.011084286139367,5,0.8259793593556993,0.23172641),
c("GO:0032590","dendrite membrane",0.042859654220706506,-1.0501534865043856,-3.5040438919466994,4.234947315652686,2,0.7524246417466169,0.67371206),
c("GO:0032993","protein-DNA complex",0.9336672240800589,1.8448823614603311,7.545622803535844,5.573066642550204,4,0.910275098937431,0.2773387),
c("GO:0033178","proton-transporting two-sector ATPase complex, catalytic domain",0.23308305667488083,1.1837178491475668,7.787626975836784,4.970388722718647,1,0.8820929330772421,0.61431071),
c("GO:0042600","egg chorion",0.002258266596980635,4.001779053835029,-3.2463045233211516,2.957128197676813,5,0.9539237950496234,0.17828139),
c("GO:0042995","cell projection",2.454214268576769,5.742417671941902,1.6044826116172737,5.9927862867668535,5,0.9999333257769809,4.509E-05),
c("GO:0044306","neuron projection terminus",0.07652654143226753,-2.957035002597554,-4.739597033936323,4.486699615514205,2,0.8288608841747606,0.6527873),
c("GO:0045177","apical part of cell",0.20759583565658227,-6.075557003186815,-4.224070268982826,4.920097226078456,5,0.9999472593862088,3.404E-05),
c("GO:0045239","tricarboxylic acid cycle heteromeric enzyme complex",0.11870497269056994,2.9583121451830436,6.559328848916133,4.677351410211265,2,0.8343606523807369,0.42248944),
c("GO:0048786","presynaptic active zone",0.06928761171089647,0.5101301690885934,-5.617807856494951,4.443544600663356,2,0.8809760803004324,0.69089197),
c("GO:0051233","spindle midzone",0.06501562009318282,-4.53569618543353,6.438795777448248,4.415907745556817,5,0.6750946558544273,0.56473314),
c("GO:0070160","tight junction",0.11081725919548067,0.9376410169587958,-5.5187349050556485,4.6474905522683025,3,0.8949084585084315,3.205E-05),
c("GO:0071212","subsynaptic reticulum",0.00018964448770224118,-1.3012351138268075,-4.971038995809656,1.8864907251724818,3,0.7269699788991519,0.42346226),
c("GO:0098588","bounding membrane of organelle",2.931736593288806,-6.528039875841401,1.0472441380212865,6.069998685933977,5,0.7568693236314283,0.08399845),
c("GO:0098590","plasma membrane region",0.8427900846375862,2.8312173493776496,-1.9224132112418908,5.528594071846178,5,0.9334336301810461,3.954E-05),
c("GO:0098687","chromosomal region",0.4597331727011251,-5.222088655744155,5.215447216284283,5.265381567728317,1,0.6893645556831427,0.65895594),
c("GO:0098793","presynapse",0.45147615151945786,0.6996385504042386,-5.541974845512618,5.257510583190615,2,0.8776995511018,0.63864175),
c("GO:0099513","polymeric cytoskeletal fiber",1.040684107554875,-4.708047983420272,5.045983088713542,5.620193332243336,5,0.6293270705250845,0.50933497),
c("GO:0099568","cytoplasmic region",0.28685475490508605,-7.0317525070365665,-3.2799007122067416,5.060539199484907,5,0.9355028107317533,3.517E-05),
c("GO:0120025","plasma membrane bounded cell projection",2.0150749900467835,-3.0292893658332383,-4.477425332149574,5.907165119107034,5,0.8038083853075426,0),
c("GO:0150034","distal axon",0.1300761559860846,-2.808971372436983,-4.521693575265628,4.7170793938576265,2,0.818210745240969,0.68561332),
c("GO:1902495","transmembrane transporter complex",2.0353020718535517,1.377749087958394,7.270197435678606,5.911502775617301,1,0.8659161837227373,0.31433718),
c("GO:1902555","endoribonuclease complex",0.12601377143372605,2.76850616572472,6.150358641143436,4.703299977924246,1,0.8728984886983244,0.54944717),
c("GO:1905348","endonuclease complex",0.283700667635933,2.384629797997485,6.1009451120108,5.055737546168407,1,0.8654032837378319,0.59034496),
c("GO:1990204","oxidoreductase complex",0.5745778819380719,2.016944256238251,6.2848038445094385,5.36222415860347,1,0.8683732437197166,0.48782939),
c("GO:1990391","DNA repair complex",0.09873241374887601,2.6522126149393355,5.612487850008776,4.597344099017222,3,0.884165427431882,0.41598051));

# Convert to data frame
one.data <- data.frame(revigo.data)
names(one.data) <- revigo.names

# Filter out rows with null coordinates
one.data <- one.data[one.data$plot_X != "null" & one.data$plot_Y != "null", ]

# Ensure numeric conversion
one.data$plot_X <- as.numeric(as.character(one.data$plot_X))
one.data$plot_Y <- as.numeric(as.character(one.data$plot_Y))
one.data$log_size <- as.numeric(as.character(one.data$log_size))
one.data$value <- as.factor(one.data$value)
one.data$frequency <- as.numeric(as.character(one.data$frequency))
one.data$uniqueness <- as.numeric(as.character(one.data$uniqueness))
one.data$dispensability <- as.numeric(as.character(one.data$dispensability))

# Base plot
p1 <- ggplot(data = one.data) +
geom_point(aes(plot_X, plot_Y, color = value, size = uniqueness), alpha = 0.9) +
  scale_color_manual(
    values = c(
      "1" = "#FFC067",   # gregaria
      "2" = "#FF474C",   # piceifrons
      "3" = "orchid",    # cancellata
      "4" = "#895129",     # shared
      "5" = "gray50"     # overlap
    ),
    labels = c(
      "1" = "gregaria",
      "2" = "piceifrons",
      "3" = "cancellata",
      "4" = "shared",
      "5" = "overlap"
    ),
    name = "Species"
  ) +
  scale_size(range = c(5, 20))

# Add labels for representative terms
ex <- one.data[one.data$dispensability < 0.20, ]
p1 <- p1 + geom_text(data = ex, aes(plot_X, plot_Y, label = description),
                     colour = alpha("gray30", 0.95), fontface = "bold", size = 3)

#p1 + geom_text(data = one.data, aes(plot_X, plot_Y, label = description), colour = alpha("gray30", 0.95), fontface = "bold", size = 3)

# Customize axes and legend
p1 <- p1 +
  labs(x = "Semantic Space y", y = "Semantic Space x",
  title = "Semantic Clustering of CC GO Terms (Medium threshold)") +
  theme_bw() +
  theme(
    panel.border = element_blank(),
    legend.key = element_blank(),
    axis.title.x = element_text(size = 20, face = "bold", family = "Arial", color = "gray50"),
    axis.title.y = element_text(size = 20, face = "bold", family = "Arial", color = "gray50"),
    axis.text.x  = element_text(size = 12, angle = 0, hjust = 1),
    axis.text.y  = element_text(size = 12),
    legend.title = element_text(size = 10, face = "bold"),
    legend.text  = element_text(size = 12)
  )

# Adjust plot limits
one.x_range <- max(one.data$plot_X) - min(one.data$plot_X)
one.y_range <- max(one.data$plot_Y) - min(one.data$plot_Y)
p1 <- p1 +
  xlim(min(one.data$plot_X) - one.x_range / 10, max(one.data$plot_X) + one.x_range / 10) +
  ylim(min(one.data$plot_Y) - one.y_range / 10, max(one.data$plot_Y) + one.y_range / 10)

# Show plot
p1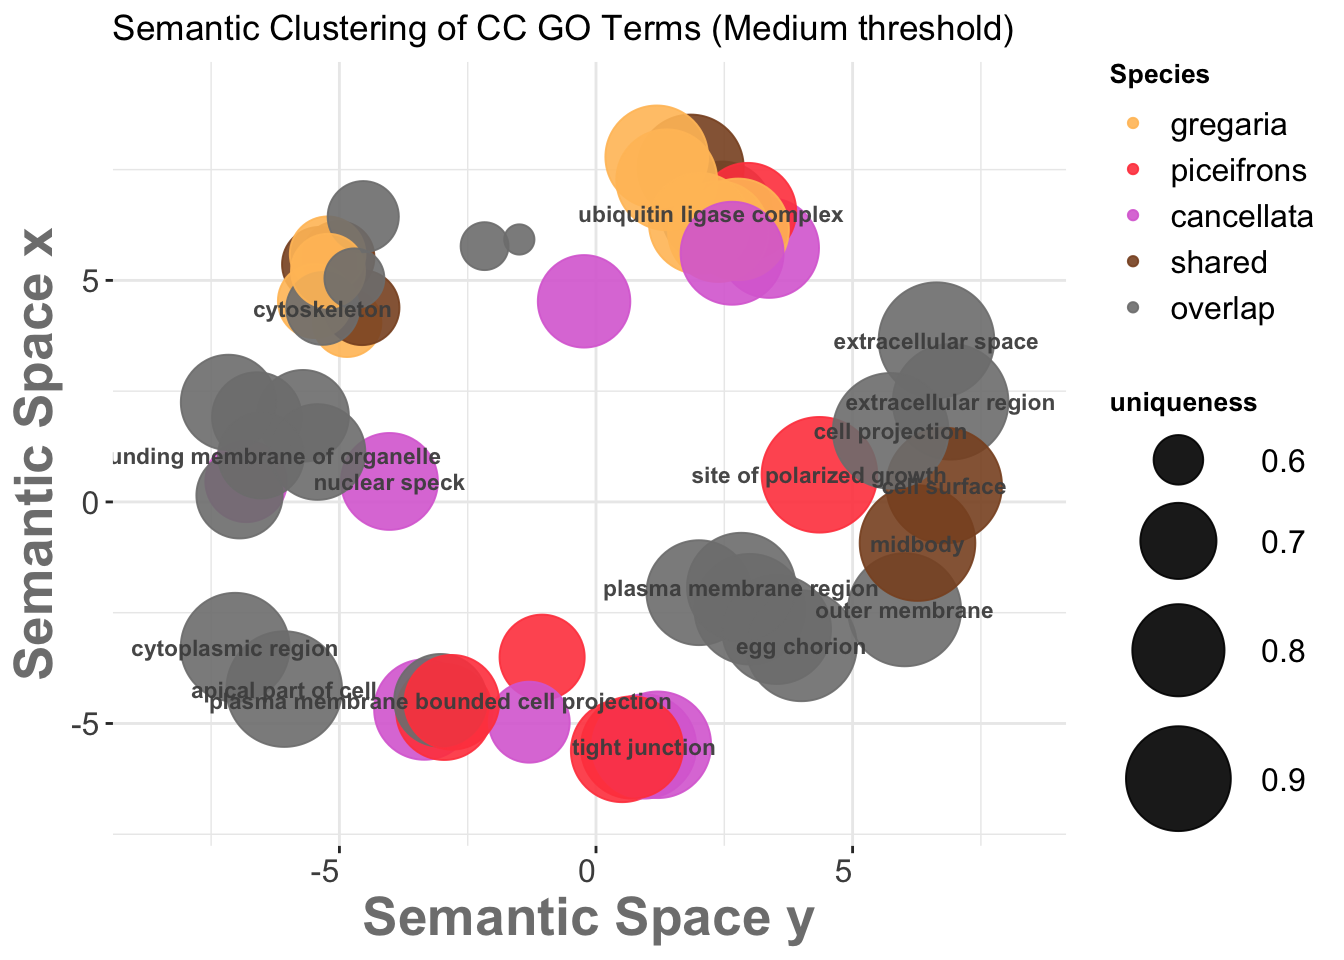
# Optional: Save to file
# ggsave("revigo-plot.pdf", plot = p1, width = 10, height = 8)
Below we do the Treemap view with Medium threshold, colored by Species Category instead of representative:
revigo.names <- c("term_ID","description","frequency","value","uniqueness","dispensability","representative");
revigo.data <- rbind(c("GO:0000151","ubiquitin ligase complex",0.6489384836950033,5,0.8555988615885974,-0,"ubiquitin ligase complex"),
c("GO:0008074","guanylate cyclase complex, soluble",0.01256145198806687,3,0.8573435804190799,0.35480592,"ubiquitin ligase complex"),
c("GO:0031461","cullin-RING ubiquitin ligase complex",0.38220600706400765,5,0.8560094575648142,0.64240848,"ubiquitin ligase complex"),
c("GO:0031519","PcG protein complex",0.08166440985567432,3,0.8023742023934749,0.22171291,"ubiquitin ligase complex"),
c("GO:0032993","protein-DNA complex",0.9336672240800589,4,0.910275098937431,0.2773387,"ubiquitin ligase complex"),
c("GO:0033178","proton-transporting two-sector ATPase complex, catalytic domain",0.23308305667488083,1,0.8820929330772421,0.61431071,"ubiquitin ligase complex"),
c("GO:0045239","tricarboxylic acid cycle heteromeric enzyme complex",0.11870497269056994,2,0.8343606523807369,0.42248944,"ubiquitin ligase complex"),
c("GO:1902495","transmembrane transporter complex",2.0353020718535517,1,0.8659161837227373,0.31433718,"ubiquitin ligase complex"),
c("GO:1902555","endoribonuclease complex",0.12601377143372605,1,0.8728984886983244,0.54944717,"ubiquitin ligase complex"),
c("GO:1905348","endonuclease complex",0.283700667635933,1,0.8654032837378319,0.59034496,"ubiquitin ligase complex"),
c("GO:1990204","oxidoreductase complex",0.5745778819380719,1,0.8683732437197166,0.48782939,"ubiquitin ligase complex"),
c("GO:1990391","DNA repair complex",0.09873241374887601,3,0.884165427431882,0.41598051,"ubiquitin ligase complex"),
c("GO:0005576","extracellular region",3.728201021160707,5,0.9999302039648567,4.906E-05,"extracellular region"),
c("GO:0005615","extracellular space",1.906263969905416,5,0.9999350812453305,4.364E-05,"extracellular space"),
c("GO:0009986","cell surface",0.6195435881011558,4,0.9999418867418022,3.818E-05,"cell surface"),
c("GO:0019867","outer membrane",1.1089960482829875,5,0.9746495861342663,0.08686934,"outer membrane"),
c("GO:0030427","site of polarized growth",0.13847041988911535,2,0.9999490037454304,3.273E-05,"site of polarized growth"),
c("GO:0030496","midbody",0.07692329766311827,4,0.9999513386488801,3.099E-05,"midbody"),
c("GO:0042995","cell projection",2.454214268576769,5,0.9999333257769809,4.509E-05,"cell projection"),
c("GO:0045177","apical part of cell",0.20759583565658227,5,0.9999472593862088,3.404E-05,"apical part of cell"),
c("GO:0070160","tight junction",0.11081725919548067,3,0.8949084585084315,3.205E-05,"tight junction"),
c("GO:0005918","septate junction",0.002417967218203575,3,0.9148710128492464,0.59606825,"tight junction"),
c("GO:0048786","presynaptic active zone",0.06928761171089647,2,0.8809760803004324,0.69089197,"tight junction"),
c("GO:0098793","presynapse",0.45147615151945786,2,0.8776995511018,0.63864175,"tight junction"),
c("GO:0098588","bounding membrane of organelle",2.931736593288806,5,0.7568693236314283,0.08399845,"bounding membrane of organelle"),
c("GO:0000228","nuclear chromosome",0.5063582681316038,1,0.6637479495177067,0.67481231,"bounding membrane of organelle"),
c("GO:0000775","chromosome, centromeric region",0.347892831400935,4,0.6810407475030481,0.64256047,"bounding membrane of organelle"),
c("GO:0000793","condensed chromosome",0.39171817531559905,4,0.693225129972277,0.45410983,"bounding membrane of organelle"),
c("GO:0000794","condensed nuclear chromosome",0.07330258514132944,4,0.6938323541400554,0.56414334,"bounding membrane of organelle"),
c("GO:0005657","replication fork",0.3308597620186258,1,0.6971985701571811,0.63969416,"bounding membrane of organelle"),
c("GO:0005694","chromosome",2.4935006213976125,1,0.6897226791989206,0.57148838,"bounding membrane of organelle"),
c("GO:0005774","vacuolar membrane",0.6988798623380645,3,0.7311377075106759,0.66001412,"bounding membrane of organelle"),
c("GO:0005856","cytoskeleton",3.1141546278807093,5,0.6831636768543166,0.18722925,"bounding membrane of organelle"),
c("GO:0005875","microtubule associated complex",0.3539489783963737,5,0.5963764523691488,0.65846891,"bounding membrane of organelle"),
c("GO:0016607","nuclear speck",0.1457268168659327,3,0.8352051416124956,0.16571565,"bounding membrane of organelle"),
c("GO:0030286","dynein complex",0.16402251928478576,5,0.57841622653042,0.66691576,"bounding membrane of organelle"),
c("GO:0031090","organelle membrane",5.734140636609097,5,0.7964596488938447,0.26098095,"bounding membrane of organelle"),
c("GO:0031410","cytoplasmic vesicle",2.3616677585780756,5,0.7815722250240331,0.22916015,"bounding membrane of organelle"),
c("GO:0031967","organelle envelope",2.2129490503864195,5,0.8228104982358275,0.22712961,"bounding membrane of organelle"),
c("GO:0031968","organelle outer membrane",0.44340378418107956,5,0.7595111120174636,0.60232512,"bounding membrane of organelle"),
c("GO:0031982","vesicle",2.559826285649265,5,0.8259793593556993,0.23172641,"bounding membrane of organelle"),
c("GO:0051233","spindle midzone",0.06501562009318282,5,0.6750946558544273,0.56473314,"bounding membrane of organelle"),
c("GO:0098687","chromosomal region",0.4597331727011251,1,0.6893645556831427,0.65895594,"bounding membrane of organelle"),
c("GO:0099513","polymeric cytoskeletal fiber",1.040684107554875,5,0.6293270705250845,0.50933497,"bounding membrane of organelle"),
c("GO:0098590","plasma membrane region",0.8427900846375862,5,0.9334336301810461,3.954E-05,"plasma membrane region"),
c("GO:0016324","apical plasma membrane",0.18284473468923318,5,0.9003924300224494,0.26935919,"plasma membrane region"),
c("GO:0030312","external encapsulating structure",1.3664334496943666,5,0.9514401410816343,0.3041977,"plasma membrane region"),
c("GO:0031012","extracellular matrix",0.607880452107468,5,0.9362781078494774,0.5359448,"plasma membrane region"),
c("GO:0032590","dendrite membrane",0.042859654220706506,2,0.7524246417466169,0.67371206,"plasma membrane region"),
c("GO:0042600","egg chorion",0.002258266596980635,5,0.9539237950496234,0.17828139,"plasma membrane region"),
c("GO:0099568","cytoplasmic region",0.28685475490508605,5,0.9355028107317533,3.517E-05,"cytoplasmic region"),
c("GO:0120025","plasma membrane bounded cell projection",2.0150749900467835,5,0.8038083853075426,0,"plasma membrane bounded cell projection"),
c("GO:0016028","rhabdomere",0.004039926652499059,3,0.8628407267101723,0.51584367,"plasma membrane bounded cell projection"),
c("GO:0044306","neuron projection terminus",0.07652654143226753,2,0.8288608841747606,0.6527873,"plasma membrane bounded cell projection"),
c("GO:0071212","subsynaptic reticulum",0.00018964448770224118,3,0.7269699788991519,0.42346226,"plasma membrane bounded cell projection"),
c("GO:0150034","distal axon",0.1300761559860846,2,0.818210745240969,0.68561332,"plasma membrane bounded cell projection"));

stuff <- data.frame(revigo.data);
names(stuff) <- revigo.names;

#stuff$value <- as.numeric( as.character(stuff$value) );
stuff$frequency <- as.numeric( as.character(stuff$frequency) );
stuff$uniqueness <- as.numeric( as.character(stuff$uniqueness) );
stuff$dispensability <- as.numeric( as.character(stuff$dispensability) );

# Suppose your original 'value' column has numeric codes
stuff$value <- droplevels(factor(stuff$value,
                                 levels = c("1", "2", "3", "4", "5"),
                                 labels = c("gregaria", "piceifrons", "cancellata", "shared", "overlap")))

my_palette <- c(
  "gregaria" = "#FFC067",
  "piceifrons" = "#FF474C",
  "cancellata" = "orchid",
  "shared" = "gray20",
  "overlap" = "gray50"
)


# check the tmPlot command documentation for all possible parameters - there are a lot more
treemap(
  stuff,
  index = c("representative","description"),
  vSize = "uniqueness",
  type = "categorical",
  vColor = "value",

  # === Customization ===
  palette = my_palette,
  title = "Revigo CC Medium TreeMap",
  inflate.labels = FALSE,
  lowerbound.cex.labels = 0,
  bg.labels = "#CCCCCCAA",

  # === Add custom legend label ===
  position.legend = "right",  # optional: moves the legend
  title.legend = "Species Category"  # set your custom label
)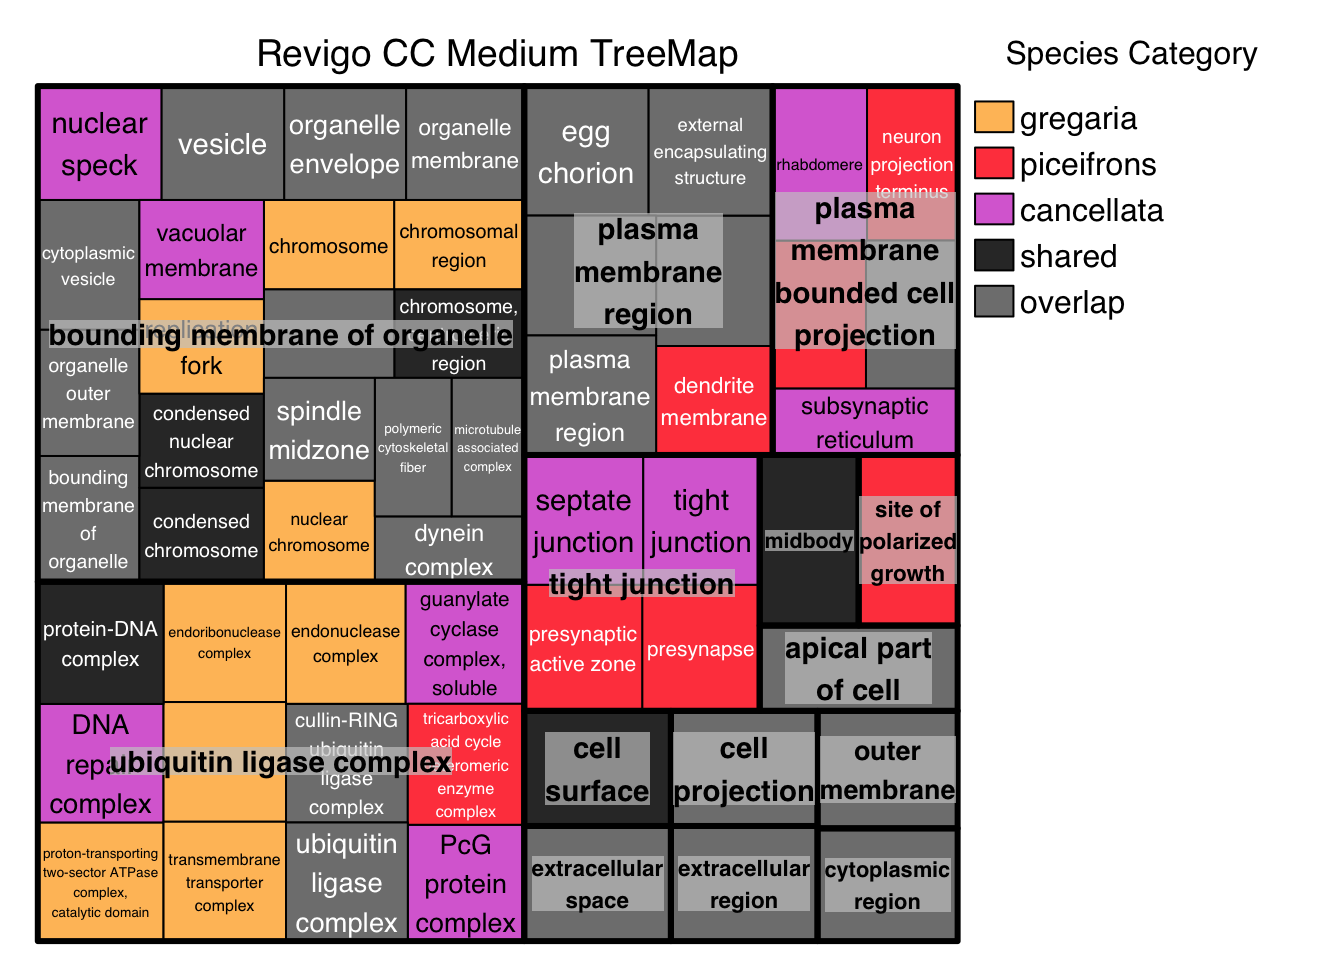
The following graph is with Small threshold:
# A plotting R script produced by the Revigo server at http://revigo.irb.hr/
# If you found Revigo useful in your work, please cite the following reference:
# Supek F et al. "REVIGO summarizes and visualizes long lists of Gene Ontology terms" PLoS ONE 2011. doi:10.1371/journal.pone.0021800

# Load required packages
library(ggplot2)
library(scales)

# Define column names and data matrix
revigo.names <- c("term_ID","description","frequency","plot_X","plot_Y","log_size","value","uniqueness","dispensability");
revigo.data <- rbind(c("GO:0000151","ubiquitin ligase complex",0.6489384836950033,-5.439572387206676,3.896099914226904,5.415078568117199,5,0.8555988615885974,-0),
c("GO:0000793","condensed chromosome",0.39171817531559905,5.622691899713606,3.6780779001579718,5.195849857830673,4,0.693225129972277,0.45410983),
c("GO:0005576","extracellular region",3.728201021160707,-4.830159086957435,-4.8603992152689015,6.174372980219259,5,0.9999302039648567,4.906E-05),
c("GO:0005615","extracellular space",1.906263969905416,-1.9544401855048523,8.868868608530677,5.883056976362223,5,0.9999350812453305,4.364E-05),
c("GO:0005856","cytoskeleton",3.1141546278807093,4.832570264485936,4.233001521327997,6.096213889361101,5,0.6831636768543166,0.18722925),
c("GO:0008074","guanylate cyclase complex, soluble",0.01256145198806687,-6.025594560750206,2.657424997727848,3.7019994748896368,3,0.8573435804190799,0.35480592),
c("GO:0009986","cell surface",0.6195435881011558,-7.431760577363063,-1.3721956938002988,5.394946984319184,4,0.9999418867418022,3.818E-05),
c("GO:0016324","apical plasma membrane",0.18284473468923318,0.21368562181725556,-5.576761457056052,4.8649617539821,5,0.9003924300224494,0.26935919),
c("GO:0016607","nuclear speck",0.1457268168659327,1.0824927056740772,7.136781616412854,4.7664202835980785,3,0.8352051416124956,0.16571565),
c("GO:0019867","outer membrane",1.1089960482829875,-1.1429401033874351,-1.5781381832446535,5.647804344281853,5,0.9746495861342663,0.08686934),
c("GO:0030312","external encapsulating structure",1.3664334496943666,1.0766027109861753,-5.025812112755733,5.7384626463741535,5,0.9514401410816343,0.3041977),
c("GO:0030427","site of polarized growth",0.13847041988911535,-2.8739480343260917,-5.796996186249465,4.74423820378745,2,0.9999490037454304,3.273E-05),
c("GO:0030496","midbody",0.07692329766311827,-6.354881659494129,-3.079350228438326,4.488945350313971,4,0.9999513386488801,3.099E-05),
c("GO:0031090","organelle membrane",5.734140636609097,3.0333925719263615,5.16926068168171,6.361341897791151,5,0.7964596488938447,0.26098095),
c("GO:0031410","cytoplasmic vesicle",2.3616677585780756,3.940253272877247,5.718304682058594,5.97609262800176,5,0.7815722250240331,0.22916015),
c("GO:0031519","PcG protein complex",0.08166440985567432,-1.9014808159554304,4.918385649507384,4.514919466490317,3,0.8023742023934749,0.22171291),
c("GO:0031967","organelle envelope",2.2129490503864195,2.7402129738975147,4.264013620575546,5.947845273287176,5,0.8228104982358275,0.22712961),
c("GO:0031982","vesicle",2.559826285649265,3.1535851368044536,6.5674597859867605,6.011084286139367,5,0.8259793593556993,0.23172641),
c("GO:0032993","protein-DNA complex",0.9336672240800589,-5.060349815196646,5.172833068404718,5.573066642550204,4,0.910275098937431,0.2773387),
c("GO:0042600","egg chorion",0.002258266596980635,2.5571976667543113,-5.193042001937012,2.957128197676813,5,0.9539237950496234,0.17828139),
c("GO:0042995","cell projection",2.454214268576769,-3.799722445426416,-2.744341953816898,5.9927862867668535,5,0.9999333257769809,4.509E-05),
c("GO:0045177","apical part of cell",0.20759583565658227,2.211327226055418,-0.9997938191754449,4.920097226078456,5,0.9999472593862088,3.404E-05),
c("GO:0045239","tricarboxylic acid cycle heteromeric enzyme complex",0.11870497269056994,-5.933902364152125,3.5809293958578308,4.677351410211265,2,0.8343606523807369,0.42248944),
c("GO:0070160","tight junction",0.11081725919548067,6.195587205348991,-1.3790759843658595,4.6474905522683025,3,0.8949084585084315,3.205E-05),
c("GO:0071212","subsynaptic reticulum",0.00018964448770224118,5.731327298718121,-2.3048070385227084,1.8864907251724818,3,0.7269699788991519,0.42346226),
c("GO:0098588","bounding membrane of organelle",2.931736593288806,2.3966760234916493,5.866052556884275,6.069998685933977,5,0.7568693236314283,0.08399845),
c("GO:0098590","plasma membrane region",0.8427900846375862,1.090203593135569,-5.746194472950901,5.528594071846178,5,0.9334336301810461,3.954E-05),
c("GO:0099568","cytoplasmic region",0.28685475490508605,7.273297955308099,0.8626097090513387,5.060539199484907,5,0.9355028107317533,3.517E-05),
c("GO:0120025","plasma membrane bounded cell projection",2.0150749900467835,5.335979901228912,-3.3130682415339874,5.907165119107034,5,0.8038083853075426,0),
c("GO:1902495","transmembrane transporter complex",2.0353020718535517,-4.522543137833106,4.63862618051273,5.911502775617301,1,0.8659161837227373,0.31433718),
c("GO:1990204","oxidoreductase complex",0.5745778819380719,-5.086369808001629,3.5621919977021945,5.36222415860347,1,0.8683732437197166,0.48782939),
c("GO:1990391","DNA repair complex",0.09873241374887601,-5.178129473417415,2.928630157861402,4.597344099017222,3,0.884165427431882,0.41598051));

# Convert to data frame
one.data <- data.frame(revigo.data)
names(one.data) <- revigo.names

# Filter out rows with null coordinates
one.data <- one.data[one.data$plot_X != "null" & one.data$plot_Y != "null", ]

# Ensure numeric conversion
one.data$plot_X <- as.numeric(as.character(one.data$plot_X))
one.data$plot_Y <- as.numeric(as.character(one.data$plot_Y))
one.data$log_size <- as.numeric(as.character(one.data$log_size))
one.data$value <- as.factor(one.data$value)
one.data$frequency <- as.numeric(as.character(one.data$frequency))
one.data$uniqueness <- as.numeric(as.character(one.data$uniqueness))
one.data$dispensability <- as.numeric(as.character(one.data$dispensability))

# Base plot
p1 <- ggplot(data = one.data) +
geom_point(aes(plot_X, plot_Y, color = value, size = uniqueness), alpha = 0.9) +
  scale_color_manual(
    values = c(
      "1" = "#FFC067",   # gregaria
      "2" = "#FF474C",   # piceifrons
      "3" = "orchid",    # cancellata
      "4" = "#895129",     # shared
      "5" = "gray50"     # overlap
    ),
    labels = c(
      "1" = "gregaria",
      "2" = "piceifrons",
      "3" = "cancellata",
      "4" = "shared",
      "5" = "overlap"
    ),
    name = "Species"
  ) +
  scale_size(range = c(5, 20))

# Add labels for representative terms
ex <- one.data[one.data$dispensability < 0.05, ]
p1 <- p1 + geom_text(data = ex, aes(plot_X, plot_Y, label = description),
                     colour = alpha("gray30", 0.95), fontface = "bold", size = 3)

# Customize axes and legend
p1 <- p1 +
  labs(x = "Semantic Space y", y = "Semantic Space x",
  title = "Semantic Clustering of CC GO Terms (Small threshold)") +
  theme_bw() +
  theme(
    panel.border = element_blank(),
    legend.key = element_blank(),
    axis.title.x = element_text(size = 20, face = "bold", family = "Arial", color = "gray50"),
    axis.title.y = element_text(size = 20, face = "bold", family = "Arial", color = "gray50"),
    axis.text.x  = element_text(size = 12, angle = 0, hjust = 1),
    axis.text.y  = element_text(size = 12),
    legend.title = element_text(size = 10, face = "bold"),
    legend.text  = element_text(size = 12)
  )

# Adjust plot limits
one.x_range <- max(one.data$plot_X) - min(one.data$plot_X)
one.y_range <- max(one.data$plot_Y) - min(one.data$plot_Y)
p1 <- p1 +
  xlim(min(one.data$plot_X) - one.x_range / 10, max(one.data$plot_X) + one.x_range / 10) +
  ylim(min(one.data$plot_Y) - one.y_range / 10, max(one.data$plot_Y) + one.y_range / 10)

# Show plot
p1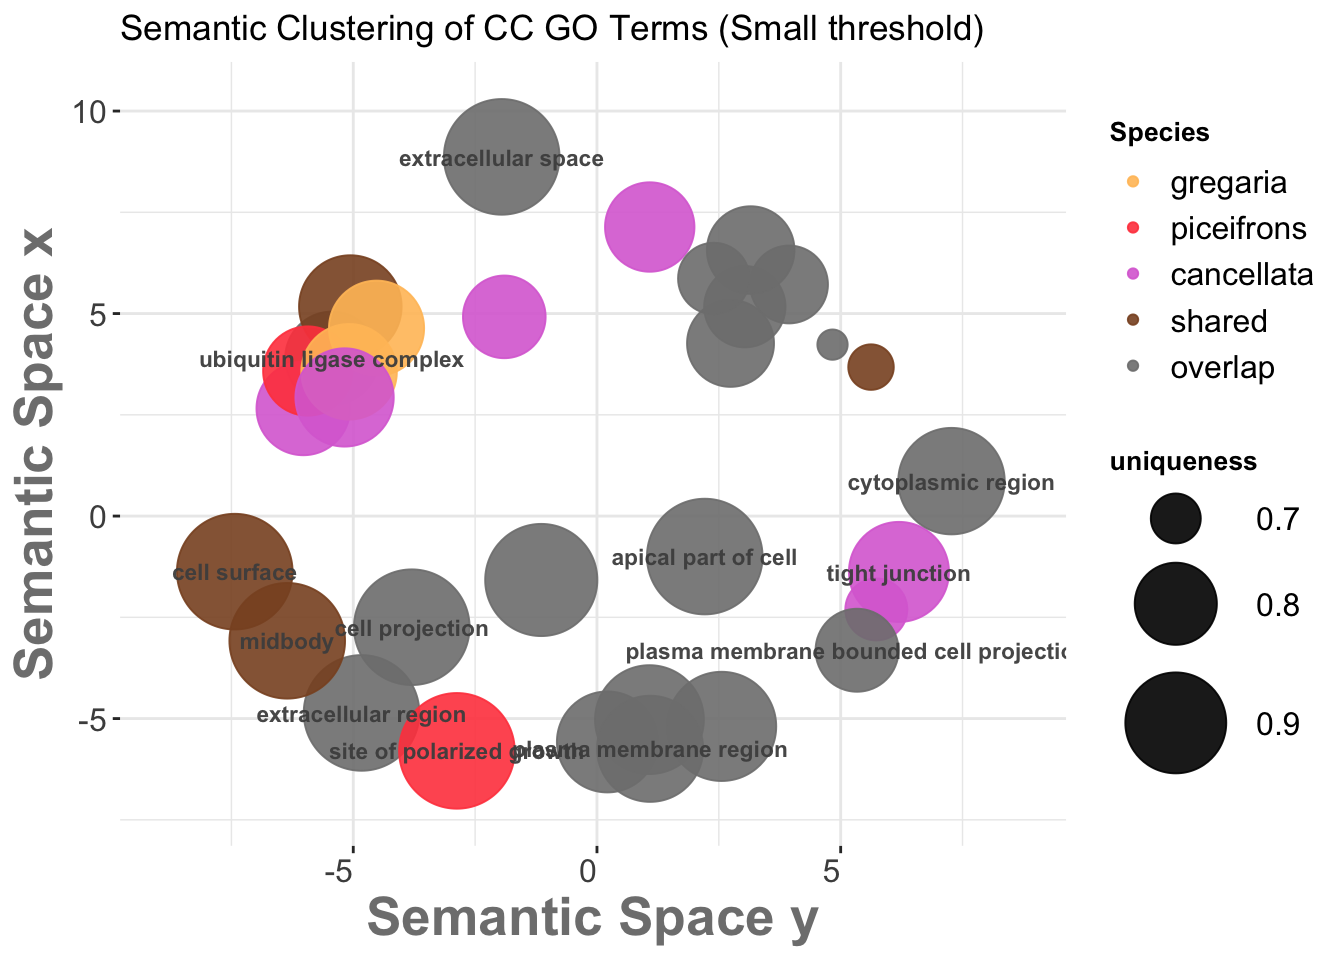
# Optional: Save to file
# ggsave("revigo-plot.pdf", plot = p1, width = 10, height = 8)
Below we do the Treemap view with Small threshold, colored by Species Category instead of representative:
revigo.names <- c("term_ID","description","frequency","value","uniqueness","dispensability","representative");
revigo.data <- rbind(c("GO:0000151","ubiquitin ligase complex",0.6489384836950033,5,0.8555988615885974,-0,"ubiquitin ligase complex"),
c("GO:0008074","guanylate cyclase complex, soluble",0.01256145198806687,3,0.8573435804190799,0.35480592,"ubiquitin ligase complex"),
c("GO:0031519","PcG protein complex",0.08166440985567432,3,0.8023742023934749,0.22171291,"ubiquitin ligase complex"),
c("GO:0032993","protein-DNA complex",0.9336672240800589,4,0.910275098937431,0.2773387,"ubiquitin ligase complex"),
c("GO:0045239","tricarboxylic acid cycle heteromeric enzyme complex",0.11870497269056994,2,0.8343606523807369,0.42248944,"ubiquitin ligase complex"),
c("GO:1902495","transmembrane transporter complex",2.0353020718535517,1,0.8659161837227373,0.31433718,"ubiquitin ligase complex"),
c("GO:1990204","oxidoreductase complex",0.5745778819380719,1,0.8683732437197166,0.48782939,"ubiquitin ligase complex"),
c("GO:1990391","DNA repair complex",0.09873241374887601,3,0.884165427431882,0.41598051,"ubiquitin ligase complex"),
c("GO:0005576","extracellular region",3.728201021160707,5,0.9999302039648567,4.906E-05,"extracellular region"),
c("GO:0005615","extracellular space",1.906263969905416,5,0.9999350812453305,4.364E-05,"extracellular space"),
c("GO:0009986","cell surface",0.6195435881011558,4,0.9999418867418022,3.818E-05,"cell surface"),
c("GO:0019867","outer membrane",1.1089960482829875,5,0.9746495861342663,0.08686934,"outer membrane"),
c("GO:0030427","site of polarized growth",0.13847041988911535,2,0.9999490037454304,3.273E-05,"site of polarized growth"),
c("GO:0030496","midbody",0.07692329766311827,4,0.9999513386488801,3.099E-05,"midbody"),
c("GO:0042995","cell projection",2.454214268576769,5,0.9999333257769809,4.509E-05,"cell projection"),
c("GO:0045177","apical part of cell",0.20759583565658227,5,0.9999472593862088,3.404E-05,"apical part of cell"),
c("GO:0070160","tight junction",0.11081725919548067,3,0.8949084585084315,3.205E-05,"tight junction"),
c("GO:0098588","bounding membrane of organelle",2.931736593288806,5,0.7568693236314283,0.08399845,"bounding membrane of organelle"),
c("GO:0000793","condensed chromosome",0.39171817531559905,4,0.693225129972277,0.45410983,"bounding membrane of organelle"),
c("GO:0005856","cytoskeleton",3.1141546278807093,5,0.6831636768543166,0.18722925,"bounding membrane of organelle"),
c("GO:0016607","nuclear speck",0.1457268168659327,3,0.8352051416124956,0.16571565,"bounding membrane of organelle"),
c("GO:0031090","organelle membrane",5.734140636609097,5,0.7964596488938447,0.26098095,"bounding membrane of organelle"),
c("GO:0031410","cytoplasmic vesicle",2.3616677585780756,5,0.7815722250240331,0.22916015,"bounding membrane of organelle"),
c("GO:0031967","organelle envelope",2.2129490503864195,5,0.8228104982358275,0.22712961,"bounding membrane of organelle"),
c("GO:0031982","vesicle",2.559826285649265,5,0.8259793593556993,0.23172641,"bounding membrane of organelle"),
c("GO:0098590","plasma membrane region",0.8427900846375862,5,0.9334336301810461,3.954E-05,"plasma membrane region"),
c("GO:0016324","apical plasma membrane",0.18284473468923318,5,0.9003924300224494,0.26935919,"plasma membrane region"),
c("GO:0030312","external encapsulating structure",1.3664334496943666,5,0.9514401410816343,0.3041977,"plasma membrane region"),
c("GO:0042600","egg chorion",0.002258266596980635,5,0.9539237950496234,0.17828139,"plasma membrane region"),
c("GO:0099568","cytoplasmic region",0.28685475490508605,5,0.9355028107317533,3.517E-05,"cytoplasmic region"),
c("GO:0120025","plasma membrane bounded cell projection",2.0150749900467835,5,0.8038083853075426,0,"plasma membrane bounded cell projection"),
c("GO:0071212","subsynaptic reticulum",0.00018964448770224118,3,0.7269699788991519,0.42346226,"plasma membrane bounded cell projection"));

stuff <- data.frame(revigo.data);
names(stuff) <- revigo.names;

#stuff$value <- as.numeric( as.character(stuff$value) );
stuff$frequency <- as.numeric( as.character(stuff$frequency) );
stuff$uniqueness <- as.numeric( as.character(stuff$uniqueness) );
stuff$dispensability <- as.numeric( as.character(stuff$dispensability) );

# Suppose your original 'value' column has numeric codes
stuff$value <- droplevels(factor(stuff$value,
                                 levels = c("1", "2", "3", "4", "5"),
                                 labels = c("gregaria", "piceifrons", "cancellata", "shared", "overlap")))

my_palette <- c(
  "gregaria" = "#FFC067",
  "piceifrons" = "#FF474C",
  "cancellata" = "orchid",
  "shared" = "gray20",
  "overlap" = "gray50"
)


# check the tmPlot command documentation for all possible parameters - there are a lot more
treemap(
  stuff,
  index = c("representative","description"),
  vSize = "uniqueness",
  type = "categorical",
  vColor = "value",

  # === Customization ===
  palette = my_palette,
  title = "Revigo CC Small TreeMap",
  inflate.labels = FALSE,
  lowerbound.cex.labels = 0,
  bg.labels = "#CCCCCCAA",

  # === Add custom legend label ===
  position.legend = "right",  # optional: moves the legend
  title.legend = "Species Category"  # set your custom label
)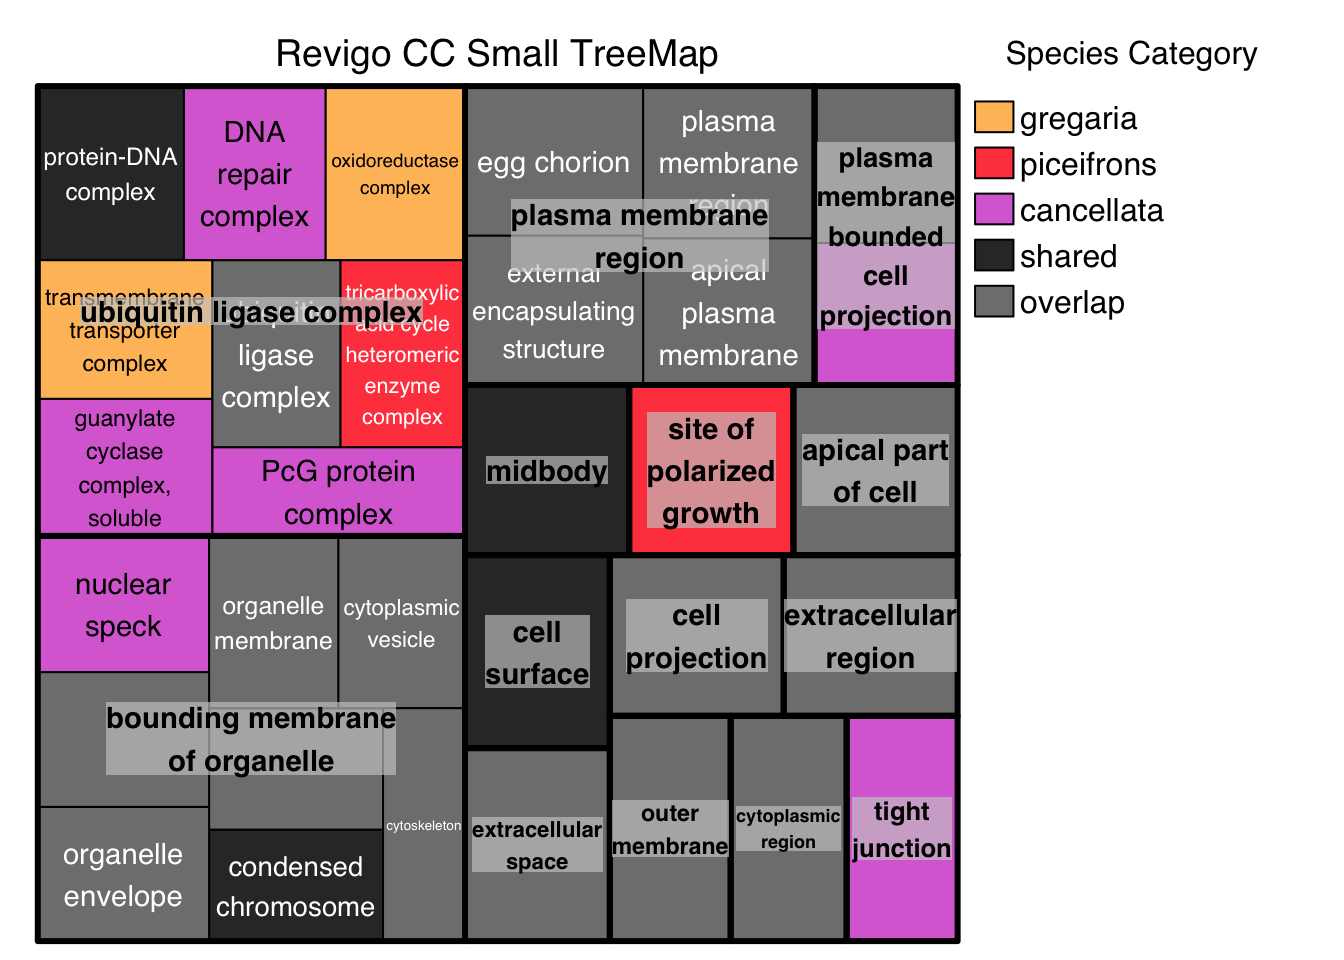
3.4. KEGG heatmap
library(janitor)
library(glue)
library(pheatmap)

# === Define KEGG input paths ===
enrichDir <- "/Users/maevatecher/Documents/GitHub/locust-comparative-genomics/data/pathway_enrichment"
species_list <- c("gregaria", "cancellata", "piceifrons")
tissues <- c("Head", "Thorax")
directions <- c("UP", "DOWN")

# === Step 1: Read and filter significant KEGG pathways for UP and DOWN ===
kegg_all <- map_dfr(tissues, function(tissue) {
  map_dfr(species_list, function(sp) {
    map_dfr(directions, function(dir) {
      file_path <- file.path(enrichDir, sp, tissue, paste0("KEGG_enrichment_", sp, "_", tissue, "_", dir, ".csv"))

      if (file.exists(file_path)) {
        df <- read_csv(file_path, show_col_types = FALSE) %>%
          janitor::clean_names()

        if (all(c("id", "description", "p_adjust", "count") %in% colnames(df))) {
          df %>%
            filter(as.numeric(p_adjust) < 0.05) %>%
            mutate(
  species = sp,
  tissue = tissue,
  direction = dir,
  count = as.numeric(count),
  value = ifelse(dir == "DOWN", -count, count),
  label = paste0(sp, "_", tissue, "_", dir)
)
        } else {
          message("⚠️ Required columns not found in file: ", file_path)
          NULL
        }
      } else {
        message("⚠️ Missing file: ", file_path)
        NULL
      }
    })
  })
})

# Only continue if we have valid data
if (nrow(kegg_all) == 0) stop("❌ No significant KEGG entries found!")

# Combine row labels
kegg_all <- kegg_all %>%
  mutate(row_label = paste0(id, ": ", description))

kegg_all <- kegg_all %>%
  mutate(
    value = pmax(pmin(value, 6), -6)  # cap between -10 and 10
  )

# Define desired column order: species > tissue > direction
ordered_labels <- expand_grid(
  species = species_list,
  tissue = tissues,
  direction = directions
) %>%
  mutate(label = paste0(species, "_", tissue, "_", direction)) %>%
  pull(label)

# Reorder factor levels in 'label' column
kegg_all <- kegg_all %>%
  mutate(label = factor(label, levels = ordered_labels))

# Step 2: Pivot to wide format
kegg_matrix <- kegg_all %>%
  select(row_label, label, value) %>%
  pivot_wider(names_from = label, values_from = value, values_fill = 0) %>%
  column_to_rownames("row_label")

# Desired column order
desired_order <- c(
  "gregaria_Head_UP", "gregaria_Head_DOWN",
  "cancellata_Head_UP", "cancellata_Head_DOWN",
  "piceifrons_Head_UP", "piceifrons_Head_DOWN",
  "gregaria_Thorax_UP", "gregaria_Thorax_DOWN",
  "cancellata_Thorax_UP", "cancellata_Thorax_DOWN",
  "piceifrons_Thorax_UP", "piceifrons_Thorax_DOWN"
)

# Reorder columns if they exist in the matrix
existing_order <- desired_order[desired_order %in% colnames(kegg_matrix)]
kegg_matrix <- kegg_matrix[, existing_order]

# Step 3: Custom blue-white-red palette
#custom_palette <- colorRampPalette(c("blue", "white", "red"))(200)

# Named vector of colors for values -10 to +10
manual_colors <- c(
  "-6" = "#08306B",  # darkest blue
  "-5" = "#2171B5",
  "-4" = "#4292C6",
  "-3" = "#6BAED6",
  "-2" = "#9ECAE1",
  "-1" = "#DEEBF7",
   "0" = "#FFFFFF",  # white
   "1" = "#FEE0D2",
   "2" = "#FCBBA1",
   "3" = "#FC9272",
   "4" = "#FB6A4A",
   "5" = "#EF3B2C",
   "6" = "#CB181D"   # darkest red
)

# Create breaks from -6 to 6 and match to manual_colors
breaks <- -6:6
color_vector <- unname(manual_colors[as.character(breaks)])

# Extract description for labeling only
row_descriptions <- kegg_all %>%
  distinct(row_label, description) %>%
  column_to_rownames("row_label") %>%
  .[rownames(kegg_matrix), , drop = FALSE] %>%
  pull(description)

row_annot <- kegg_all %>%
  distinct(row_label, category) %>%
  column_to_rownames("row_label") %>%
  .[rownames(kegg_matrix), , drop = FALSE]

# Ensure unique (row_label, category) pairing
row_order <- kegg_all %>%
  distinct(row_label, category) %>%
  arrange(category) %>%
  pull(row_label)

# Reorder kegg_matrix rows by category
kegg_matrix <- kegg_matrix[row_order[row_order %in% rownames(kegg_matrix)], ]

category_colors <- setNames(RColorBrewer::brewer.pal(length(unique(row_annot$category)), "Set3"),
                            unique(row_annot$category))
annotation_colors <- list(category = category_colors)

pheatmap(
  kegg_matrix,
  cluster_rows = FALSE,
  cluster_cols = FALSE,
  color = color_vector,
  breaks = breaks - 0.5,
  fontsize_row = 16,
  fontsize_col = 9,
  main = "KEGG Pathway Enrichment (UP = Red, DOWN = Blue by Gene Count)",
  border_color = "#DDDDDD",
  labels_row = row_descriptions,
  annotation_row = row_annot,
  annotation_colors = annotation_colors
)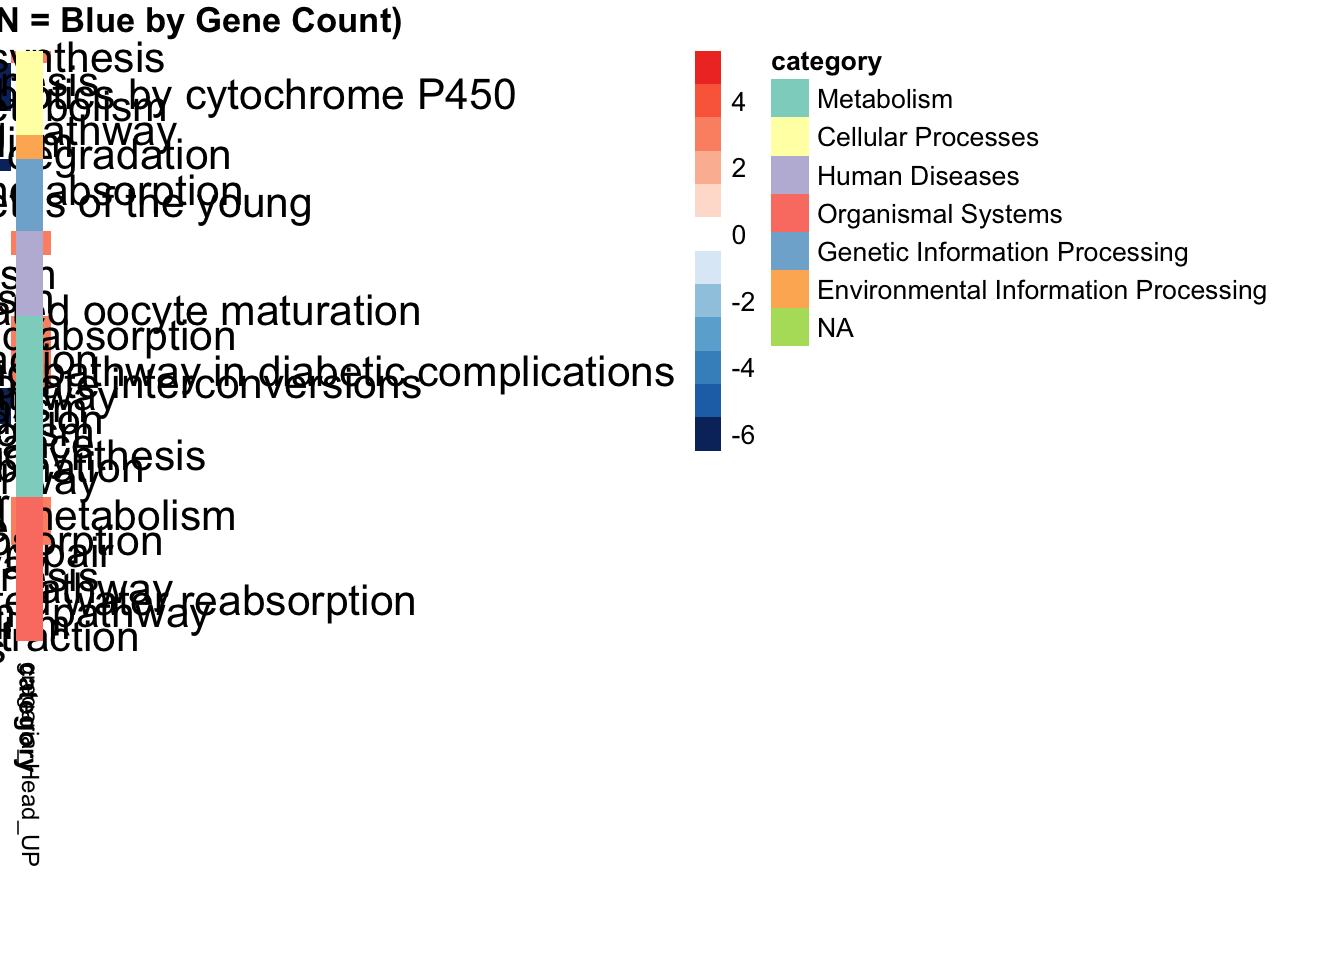
## Other option

# Join the category info to the matrix rownames
row_to_cat <- kegg_all %>%
  distinct(row_label, category)

# Split matrix by category
split_matrices <- split(rownames(kegg_matrix), row_to_cat$category[match(rownames(kegg_matrix), row_to_cat$row_label)])

# Create named list of matrices per category
matrix_by_category <- lapply(split_matrices, function(rows) {
  kegg_matrix[rows, , drop = FALSE]
})

# Loop over each category and draw a heatmap
for (cat_name in names(matrix_by_category)) {
  cat_matrix <- matrix_by_category[[cat_name]]
  pheatmap(
    cat_matrix,
    cluster_rows = FALSE,
    cluster_cols = FALSE,
    color = color_vector,
    breaks = breaks - 0.5,
    fontsize_row = 16,
    fontsize_col = 9,
    main = glue::glue("KEGG Enrichment: {cat_name}"),
    border_color = "#DDDDDD"
  )
}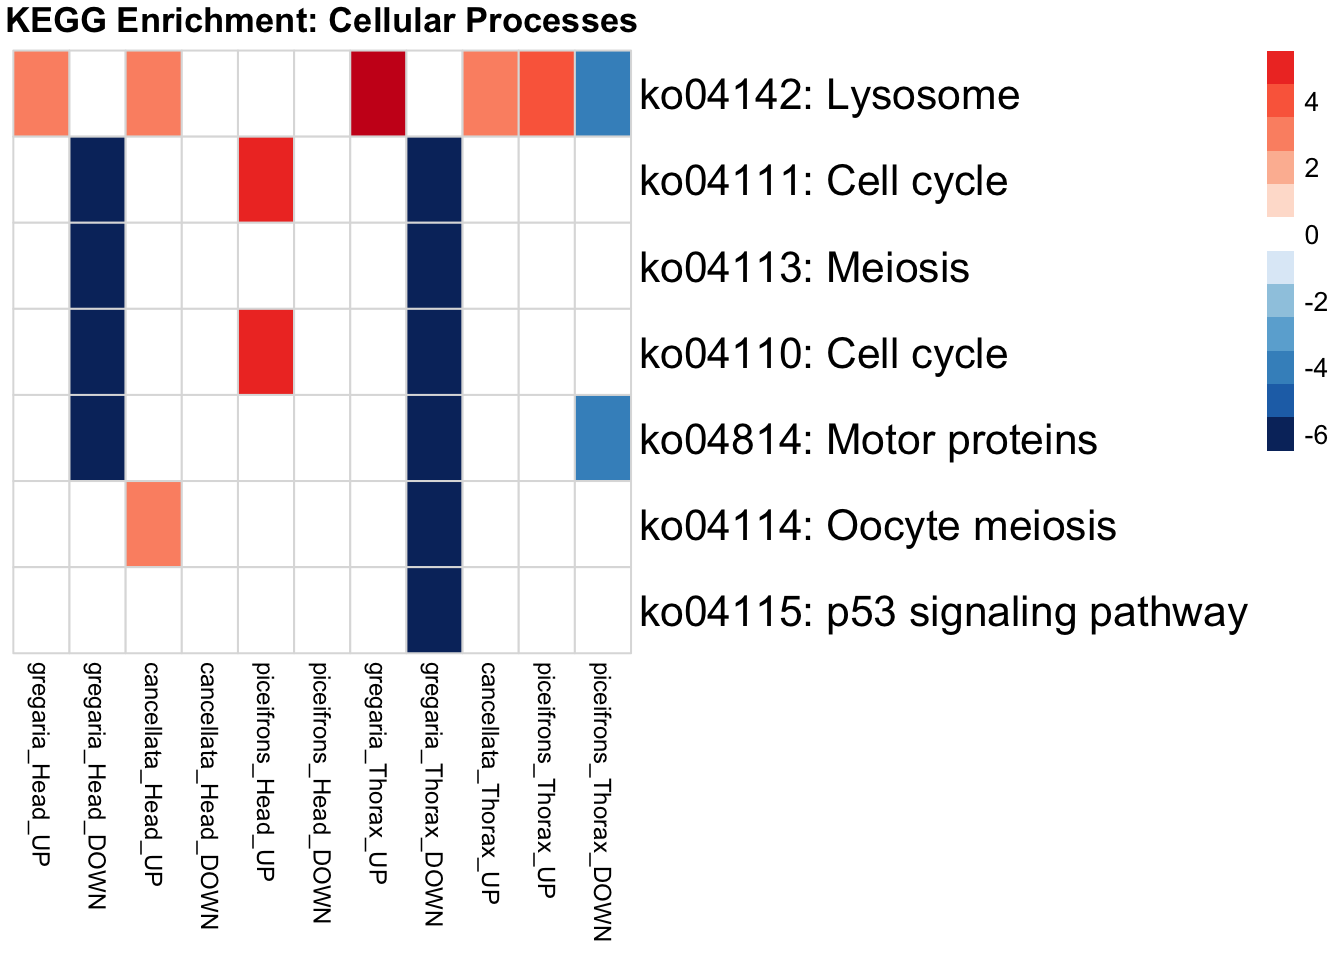
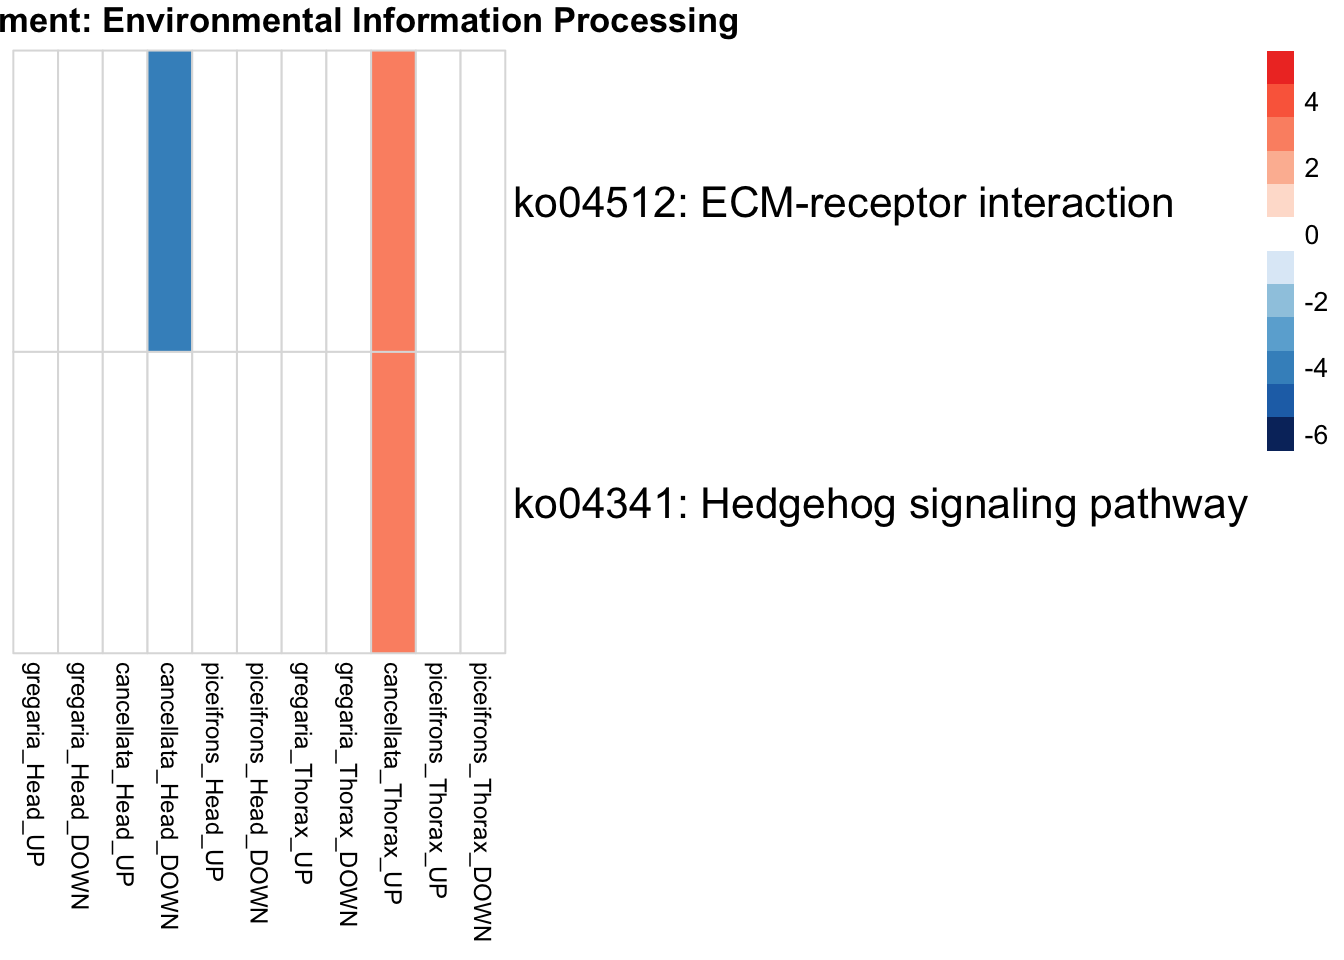
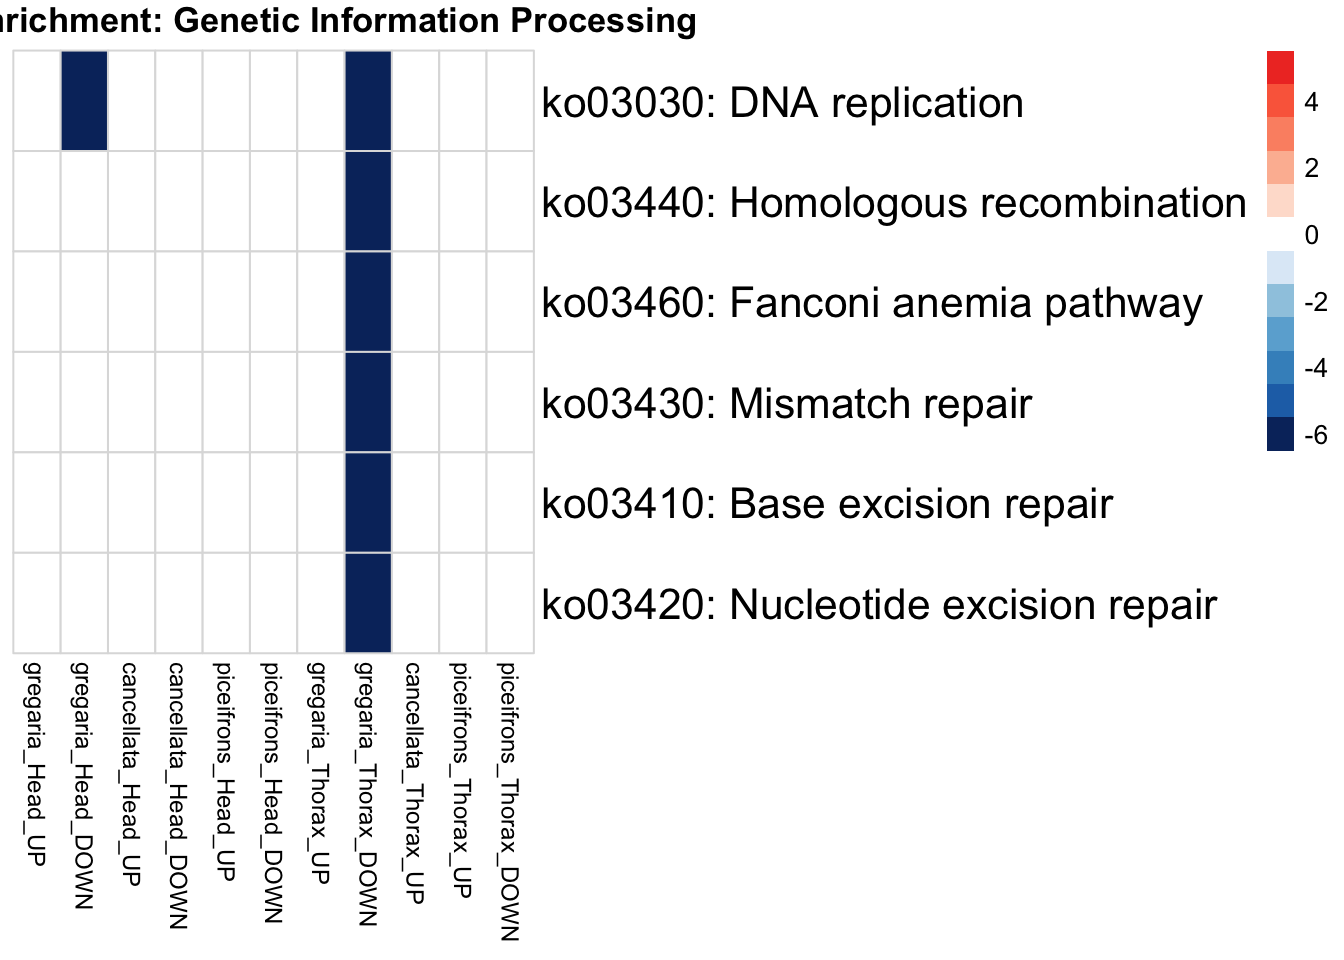
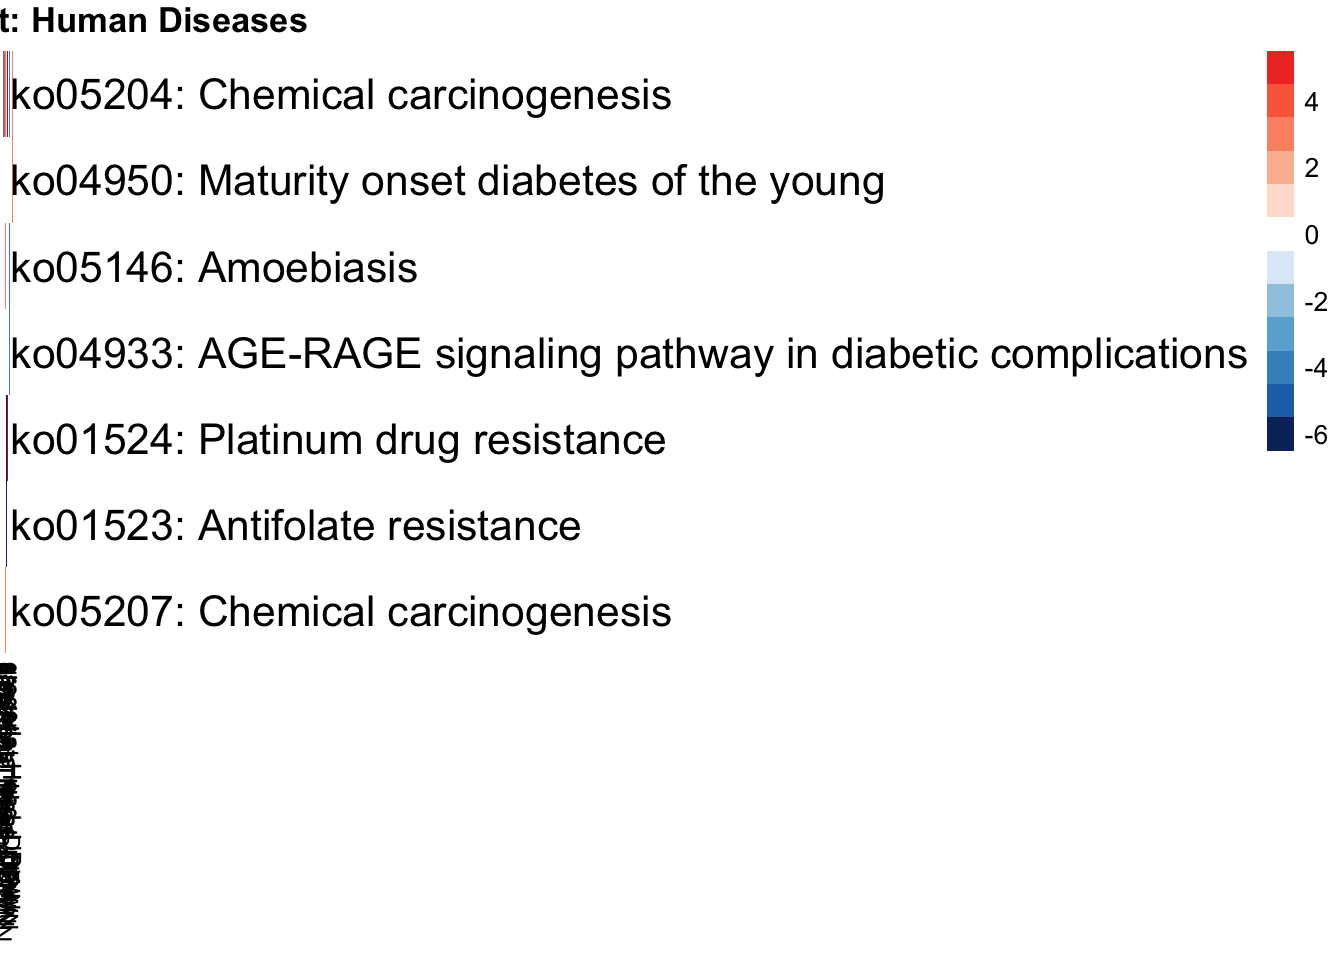
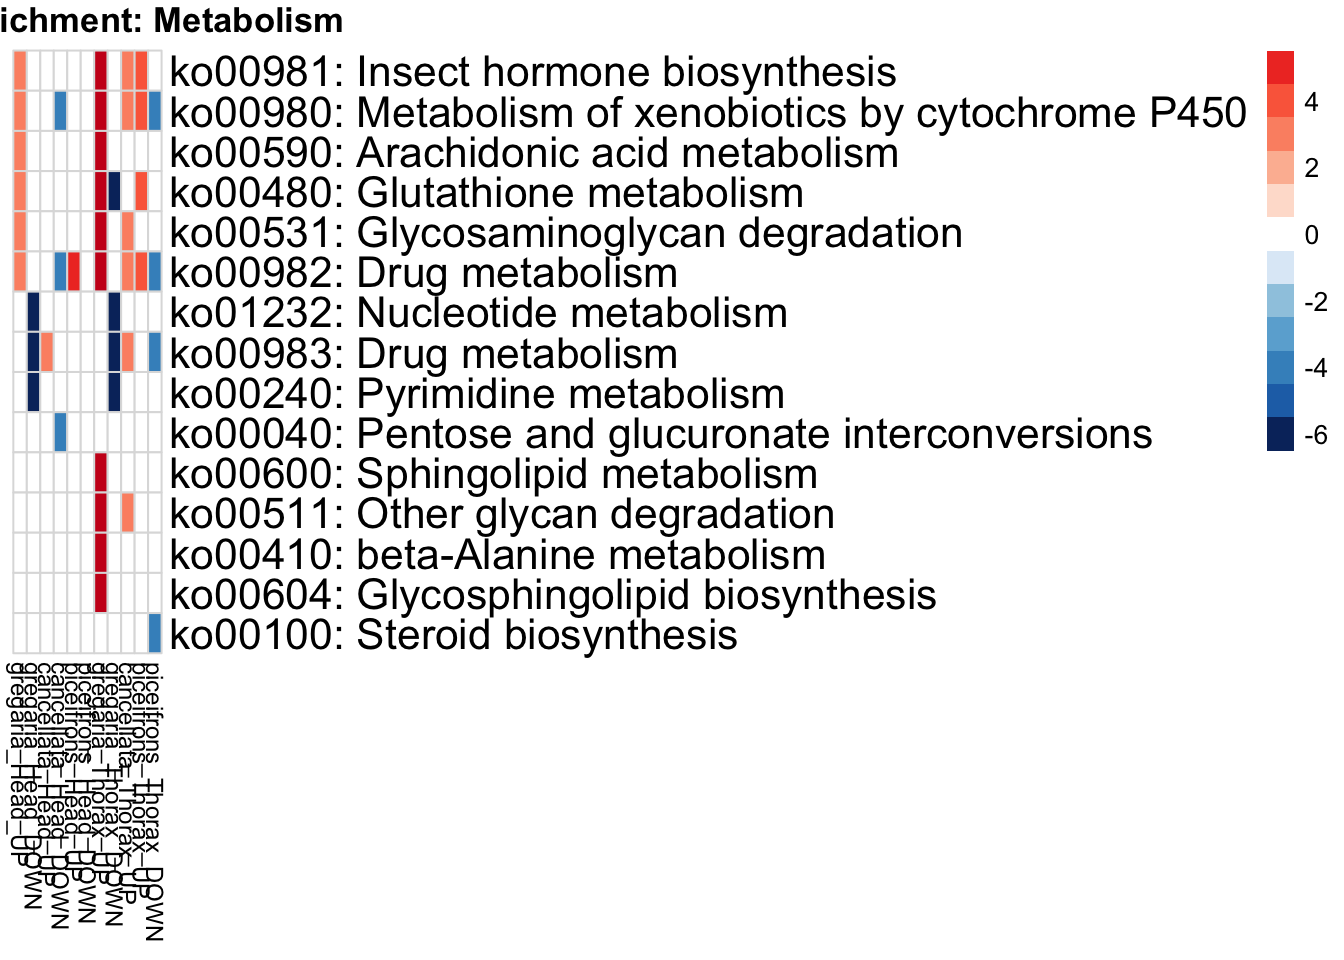
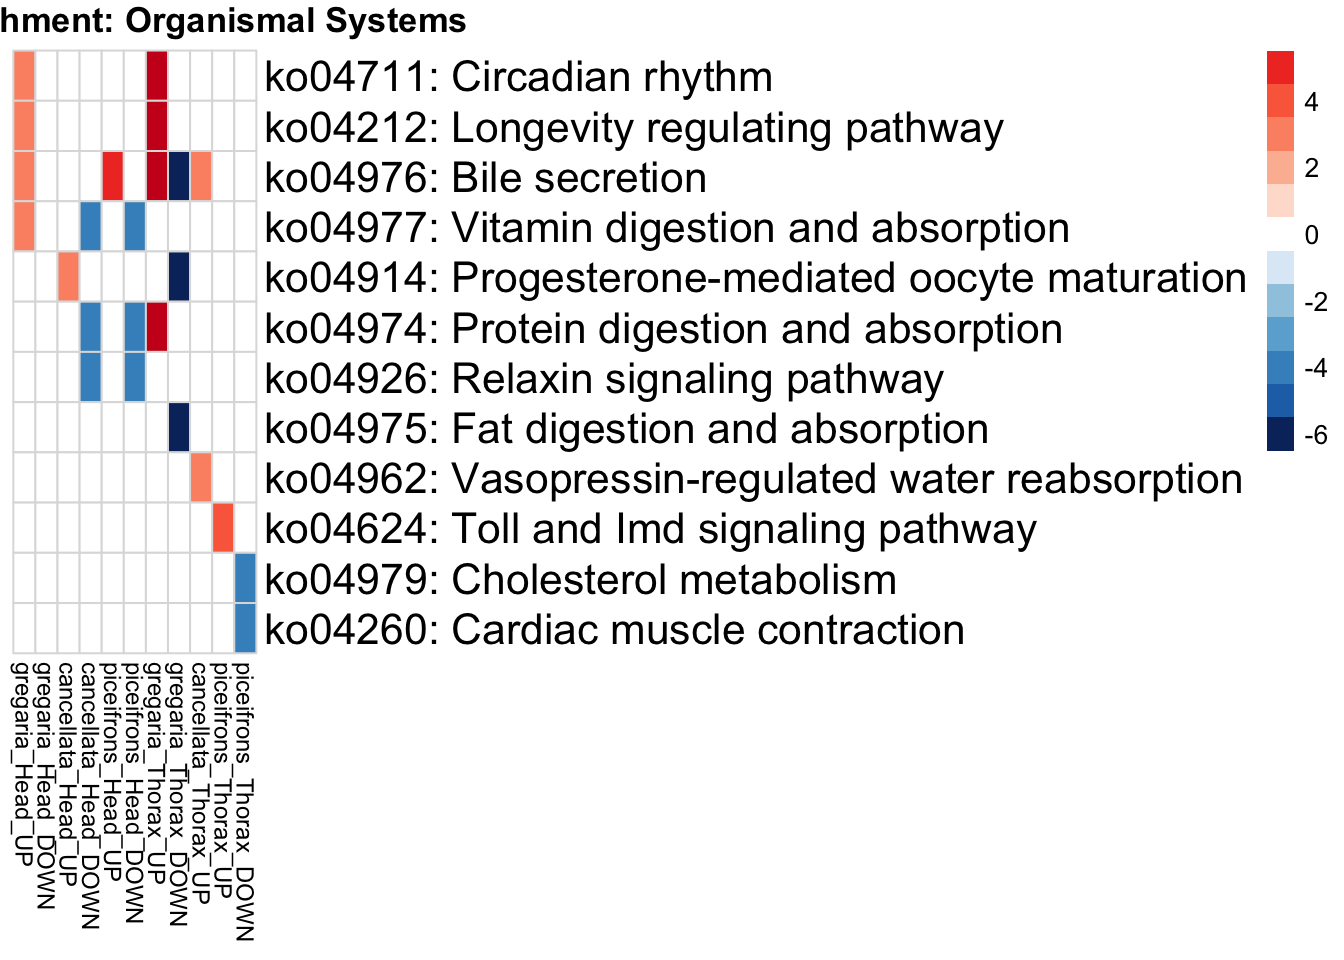
sessionInfo()R version 4.4.2 (2024-10-31)
Platform: aarch64-apple-darwin20
Running under: macOS Sequoia 15.5
Matrix products: default
BLAS: /Library/Frameworks/R.framework/Versions/4.4-arm64/Resources/lib/libRblas.0.dylib
LAPACK: /Library/Frameworks/R.framework/Versions/4.4-arm64/Resources/lib/libRlapack.dylib; LAPACK version 3.12.0
locale:
[1] en_US.UTF-8/en_US.UTF-8/en_US.UTF-8/C/en_US.UTF-8/en_US.UTF-8
time zone: Asia/Tokyo
tzcode source: internal
attached base packages:
[1] stats4 stats graphics grDevices utils datasets methods
[8] base
other attached packages:
[1] glue_1.8.0 janitor_2.2.1 treemap_2.4-4
[4] scales_1.4.0 DesertLocustR_0.1.0 remotes_2.5.0
[7] stringr_1.5.1 patchwork_1.3.1 purrr_1.0.4
[10] enrichplot_1.26.6 forcats_1.0.0 readr_2.1.5
[13] Biostrings_2.74.1 XVector_0.46.0 rtracklayer_1.66.0
[16] GenomicRanges_1.58.0 GenomeInfoDb_1.42.3 clusterProfiler_4.14.6
[19] AnnotationHub_3.14.0 BiocFileCache_2.14.0 dbplyr_2.5.0
[22] DiagrammeR_1.0.11 data.table_1.17.6 pheatmap_1.0.13
[25] tibble_3.3.0 tidyr_1.3.1 ggplot2_3.5.2
[28] dplyr_1.1.4 topGO_2.58.0 SparseM_1.84-2
[31] GO.db_3.20.0 AnnotationDbi_1.68.0 IRanges_2.40.1
[34] S4Vectors_0.44.0 Biobase_2.66.0 graph_1.84.1
[37] BiocGenerics_0.52.0 workflowr_1.7.1
loaded via a namespace (and not attached):
[1] splines_4.4.2 later_1.4.2
[3] BiocIO_1.16.0 bitops_1.0-9
[5] ggplotify_0.1.2 filelock_1.0.3
[7] R.oo_1.27.1 XML_3.99-0.18
[9] lifecycle_1.0.4 rprojroot_2.0.4
[11] vroom_1.6.5 processx_3.8.6
[13] lattice_0.22-7 magrittr_2.0.3
[15] sass_0.4.10 rmarkdown_2.29
[17] jquerylib_0.1.4 yaml_2.3.10
[19] httpuv_1.6.16 ggtangle_0.0.6
[21] cowplot_1.1.3 DBI_1.2.3
[23] RColorBrewer_1.1-3 lubridate_1.9.4
[25] abind_1.4-8 zlibbioc_1.52.0
[27] R.utils_2.13.0 RCurl_1.98-1.17
[29] yulab.utils_0.2.0 rappdirs_0.3.3
[31] git2r_0.36.2 GenomeInfoDbData_1.2.13
[33] ggrepel_0.9.6 tidytree_0.4.6
[35] codetools_0.2-20 DelayedArray_0.32.0
[37] DOSE_4.0.1 tidyselect_1.2.1
[39] aplot_0.2.7 UCSC.utils_1.2.0
[41] farver_2.1.2 matrixStats_1.5.0
[43] GenomicAlignments_1.42.0 jsonlite_2.0.0
[45] systemfonts_1.2.3 tools_4.4.2
[47] ragg_1.4.0 treeio_1.30.0
[49] Rcpp_1.0.14 SparseArray_1.6.2
[51] xfun_0.52 qvalue_2.38.0
[53] MatrixGenerics_1.18.1 withr_3.0.2
[55] BiocManager_1.30.26 fastmap_1.2.0
[57] callr_3.7.6 digest_0.6.37
[59] timechange_0.3.0 mime_0.13
[61] R6_2.6.1 gridGraphics_0.5-1
[63] textshaping_1.0.1 colorspace_2.1-1
[65] dichromat_2.0-0.1 RSQLite_2.4.1
[67] R.methodsS3_1.8.2 generics_0.1.4
[69] httr_1.4.7 htmlwidgets_1.6.4
[71] S4Arrays_1.6.0 whisker_0.4.1
[73] pkgconfig_2.0.3 gtable_0.3.6
[75] blob_1.2.4 htmltools_0.5.8.1
[77] fgsea_1.32.4 png_0.1-8
[79] snakecase_0.11.1 ggfun_0.1.9
[81] knitr_1.50 rstudioapi_0.17.1
[83] tzdb_0.5.0 reshape2_1.4.4
[85] rjson_0.2.23 visNetwork_2.1.3
[87] nlme_3.1-168 curl_6.4.0
[89] cachem_1.1.0 BiocVersion_3.20.0
[91] parallel_4.4.2 restfulr_0.0.15
[93] pillar_1.10.2 grid_4.4.2
[95] vctrs_0.6.5 promises_1.3.3
[97] xtable_1.8-4 evaluate_1.0.4
[99] cli_3.6.5 compiler_4.4.2
[101] Rsamtools_2.22.0 rlang_1.1.6
[103] crayon_1.5.3 labeling_0.4.3
[105] ps_1.9.1 getPass_0.2-4
[107] plyr_1.8.9 fs_1.6.6
[109] stringi_1.8.7 gridBase_0.4-7
[111] viridisLite_0.4.2 BiocParallel_1.40.2
[113] lazyeval_0.2.2 GOSemSim_2.32.0
[115] Matrix_1.7-3 hms_1.1.3
[117] bit64_4.6.0-1 shiny_1.10.0
[119] KEGGREST_1.46.0 SummarizedExperiment_1.36.0
[121] igraph_2.1.4 memoise_2.0.1
[123] bslib_0.9.0 ggtree_3.14.0
[125] fastmatch_1.1-6 bit_4.6.0
[127] ape_5.8-1 gson_0.1.0