Behavior and transcriptomics following RNAi
Audélia Mechti and Maeva Techer
2026-02-25
Last updated: 2026-02-25
Checks: 5 2
Knit directory:
locust-comparative-genomics/
This reproducible R Markdown analysis was created with workflowr (version 1.7.2). The Checks tab describes the reproducibility checks that were applied when the results were created. The Past versions tab lists the development history.
The R Markdown file has unstaged changes. To know which version of
the R Markdown file created these results, you’ll want to first commit
it to the Git repo. If you’re still working on the analysis, you can
ignore this warning. When you’re finished, you can run
wflow_publish to commit the R Markdown file and build the
HTML.
Great job! The global environment was empty. Objects defined in the global environment can affect the analysis in your R Markdown file in unknown ways. For reproduciblity it’s best to always run the code in an empty environment.
The command set.seed(20221025) was run prior to running
the code in the R Markdown file. Setting a seed ensures that any results
that rely on randomness, e.g. subsampling or permutations, are
reproducible.
Great job! Recording the operating system, R version, and package versions is critical for reproducibility.
Nice! There were no cached chunks for this analysis, so you can be confident that you successfully produced the results during this run.
Using absolute paths to the files within your workflowr project makes it difficult for you and others to run your code on a different machine. Change the absolute path(s) below to the suggested relative path(s) to make your code more reproducible.
| absolute | relative |
|---|---|
| /Users/maevatecher/Documents/GitHub/locust-comparative-genomics/data | data |
Great! You are using Git for version control. Tracking code development and connecting the code version to the results is critical for reproducibility.
The results in this page were generated with repository version a77d8e5. See the Past versions tab to see a history of the changes made to the R Markdown and HTML files.
Note that you need to be careful to ensure that all relevant files for
the analysis have been committed to Git prior to generating the results
(you can use wflow_publish or
wflow_git_commit). workflowr only checks the R Markdown
file, but you know if there are other scripts or data files that it
depends on. Below is the status of the Git repository when the results
were generated:
Ignored files:
    Ignored:    .DS_Store
    Ignored:    .Rhistory
    Ignored:    analysis/.DS_Store
    Ignored:    analysis/.Rhistory
    Ignored:    analysis/2_signatures-selection_cache/
    Ignored:    analysis/3_gcn-grn_cache/
    Ignored:    analysis/3_wgcna-network_cache/
    Ignored:    analysis/figure/
    Ignored:    code/.DS_Store
    Ignored:    code/scripts/.DS_Store
    Ignored:    code/scripts/pal2nal.v14/.DS_Store
    Ignored:    data/.DS_Store
    Ignored:    data/DEG_results/.DS_Store
    Ignored:    data/DEG_results/Bulk_RNAseq/.DS_Store
    Ignored:    data/DEG_results/Bulk_RNAseq/americana/.DS_Store
    Ignored:    data/DEG_results/Bulk_RNAseq/cancellata/.DS_Store
    Ignored:    data/DEG_results/Bulk_RNAseq/cubense/.DS_Store
    Ignored:    data/DEG_results/Bulk_RNAseq/gregaria/.DS_Store
    Ignored:    data/DEG_results/Bulk_RNAseq/nitens/.DS_Store
    Ignored:    data/DEG_results/RNAi/.DS_Store
    Ignored:    data/DEG_results/RNAi/Head_control/
    Ignored:    data/DEG_results/RNAi/Head_no_rRNA/
    Ignored:    data/DEG_results/RNAi/Thorax/
    Ignored:    data/HYPHY_selection/.DS_Store
    Ignored:    data/HYPHY_selection/ParsedABSRELResults_unlabeled/.DS_Store
    Ignored:    data/HYPHY_selection/functional_pathways/.DS_Store
    Ignored:    data/HYPHY_selection/functional_pathways/BUSTED_unlabeled/
    Ignored:    data/HYPHY_selection/functional_pathways/aBSREL/.DS_Store
    Ignored:    data/HYPHY_selection/pathway_enrichment/.DS_Store
    Ignored:    data/HYPHY_selection/pathway_enrichment/americana/
    Ignored:    data/HYPHY_selection/pathway_enrichment/cancellata/
    Ignored:    data/HYPHY_selection/pathway_enrichment/cubense/
    Ignored:    data/HYPHY_selection/pathway_enrichment/nitens/
    Ignored:    data/HYPHY_selection/pathway_enrichment/piceifrons/
    Ignored:    data/WGCNA/.DS_Store
    Ignored:    data/WGCNA/input/.DS_Store
    Ignored:    data/WGCNA/input/Bulk_RNAseq/.DS_Store
    Ignored:    data/WGCNA/input/GRNs/.DS_Store
    Ignored:    data/WGCNA/output/.DS_Store
    Ignored:    data/WGCNA/output/Bulk_RNAseq/.DS_Store
    Ignored:    data/WGCNA/output/Bulk_RNAseq/americana/
    Ignored:    data/WGCNA/output/Bulk_RNAseq/cancellata/
    Ignored:    data/WGCNA/output/Bulk_RNAseq/gregaria/.DS_Store
    Ignored:    data/WGCNA/output/Bulk_RNAseq/gregaria/Head/
    Ignored:    data/WGCNA/output/Bulk_RNAseq/gregaria/Thorax/
    Ignored:    data/WGCNA/output/Bulk_RNAseq/piceifrons/
    Ignored:    data/behavioral_data/.DS_Store
    Ignored:    data/behavioral_data/Raw_data/.DS_Store
    Ignored:    data/cafe5_results/.DS_Store
    Ignored:    data/cafe5_results/Base_change_FILE/.DS_Store
    Ignored:    data/cafe5_results/Base_change_FILE/americana/.DS_Store
    Ignored:    data/cafe5_results/Base_change_FILE/gregaria/.DS_Store
    Ignored:    data/cafe5_results/Base_change_FILE/locusta/.DS_Store
    Ignored:    data/cafe5_results/Gene_count_FILE/.DS_Store
    Ignored:    data/list/.DS_Store
    Ignored:    data/list/Bulk_RNAseq/.DS_Store
    Ignored:    data/list/GO_Annotations/.DS_Store
    Ignored:    data/list/GO_Annotations/DesertLocustR/.DS_Store
    Ignored:    data/list/excluded_loci/.DS_Store
    Ignored:    data/orthofinder/.DS_Store
    Ignored:    data/orthofinder/Polyneoptera/.DS_Store
    Ignored:    data/orthofinder/Polyneoptera/Results_I2_iqtree/.DS_Store
    Ignored:    data/orthofinder/Polyneoptera/Results_I2_iqtree/Orthogroups/.DS_Store
    Ignored:    data/orthofinder/Polyneoptera/Results_I2_withDaust/.DS_Store
    Ignored:    data/orthofinder/Polyneoptera/Results_I2_withDaust/Orthogroups/.DS_Store
    Ignored:    data/orthofinder/Schistocerca/.DS_Store
    Ignored:    data/orthofinder/Schistocerca/Results_I2/.DS_Store
    Ignored:    data/orthofinder/Schistocerca/Results_I2/Orthogroups/.DS_Store
    Ignored:    data/overlap/.DS_Store
    Ignored:    data/pathway_enrichment/.DS_Store
    Ignored:    data/pathway_enrichment/OLD/.DS_Store
    Ignored:    data/pathway_enrichment/OLD/custom_sgregaria_orgdb/.DS_Store
    Ignored:    data/pathway_enrichment/REVIGO_results/.DS_Store
    Ignored:    data/pathway_enrichment/REVIGO_results/BP/.DS_Store
    Ignored:    data/pathway_enrichment/REVIGO_results/CC/.DS_Store
    Ignored:    data/pathway_enrichment/REVIGO_results/MF/.DS_Store
    Ignored:    data/pathway_enrichment/americana/.DS_Store
    Ignored:    data/pathway_enrichment/cancellata/.DS_Store
    Ignored:    data/pathway_enrichment/gregaria/.DS_Store
    Ignored:    data/pathway_enrichment/nitens/Thorax/
    Ignored:    data/pathway_enrichment/piceifrons/.DS_Store
    Ignored:    data/readcounts/.DS_Store
    Ignored:    data/readcounts/Bulk_RNAseq/.DS_Store
    Ignored:    data/readcounts/RNAi/.DS_Store

Untracked files:
    Untracked:  data/RefSeq/

Unstaged changes:
    Modified:   analysis/4_RNAi_behavior.Rmd
Note that any generated files, e.g. HTML, png, CSS, etc., are not included in this status report because it is ok for generated content to have uncommitted changes.
These are the previous versions of the repository in which changes were
made to the R Markdown (analysis/4_RNAi_behavior.Rmd) and
HTML (docs/4_RNAi_behavior.html) files. If you’ve
configured a remote Git repository (see ?wflow_git_remote),
click on the hyperlinks in the table below to view the files as they
were in that past version.
| File | Version | Author | Date | Message |
|---|---|---|---|---|
| Rmd | a77d8e5 | Maeva TECHER | 2026-02-24 | adding RNAi behavior |
| html | a77d8e5 | Maeva TECHER | 2026-02-24 | adding RNAi behavior |
Following the overlap analysis of bulk tissue RNA-seq data from the whole head and thorax across all species, we selected a subset of differentially expressed genes between isolated and crowded individuals. The selection criteria were as follows:
- Genes must be shared by at least two or three locust species.
- Genes were ranked based on log fold change, prioritizing those with the highest absolute values (whether upregulated or downregulated in gregarious nymphs), and only genes with a significant corrected p-value were considered.
- Genes with functional descriptions suggesting a role in phenotypic plasticity in other arthropods were prioritized.
A total of X genes were included in this list and used for functional validation to assess their impact on collective behavior and the transcriptome landscape of gregarious nymphs in the Desert Locust S. gregaria. Following RNAi probes engineering, only genes with a knockdown efficacy exceeding X% in both males and females were kept for further analysis.
Hypothesis: Genes that are highly differentiated between phases are part of the downstream molecular machinery responding to density changes. If these genes do not directly drive rapid behavioral changes, they may instead contribute to the maintenance of phase-specific traits. Disrupting their function could interfere with gene-gene interactions essential for stabilizing either the solitarious or gregarious phase, triggering compensatory maintenance mechanism.
1. Behavioral assays
8 “treatments” were conducted for which behavioral assay were done:
- hexamerin1 (hexamerin1)
- hexamerin2 (hexamerin2)
- juvenile hormone acid methyltransferase (JHMT)
- inositol oxygenase (IOX) - miniature (miniature, UNCH)
- saline-injected controls (saline)
- non-injected controls (uninjected)
- GFP (GFP)
A quick summary of the results are described below. Audélia reported behavioral differences between treatments vs saline control with the following results for each parameter:
Distance moved:
- uninjected is significant, p-value = 0.01473 (uninjected 166.39768, saline 81.10885)
- JHMT borderline (p-value = 0.05821 (JHMT 129.69109, saline 81.10885))
Time spent moving:
- JHMT is significant, p-value = 0.03652 (JHMT 148.29638, saline 93.54345)
- uninjected is significant, p-value = 0.01466 (uninjected 168.33159, saline 93.54345)
Time spent in stimulus zone:
- Nothing is significant!
Time spent in non-stimulus zone:
- Nothing is significant!
Time spent in middle zone:
- Nothing is significant!
Time spent in non-stimulus zone and middle zone combined:
- Nothing is significant!
Time spent on stimulus wall:
- Nothing is significant!
Time spent on non-stimulus wall:
- Nothing is significant!
Velocity:
- GFP borderline: W = 66, p-value = 0.05553
Rotations:
- IOX is significant, p-value = 0.006698 (IOX 24.73333, saline 10.93333)
- uninjected is significant, p-value = 0.0003698 (uninjected 26.93333, saline 10.93333)
#### INSTALL PACKAGES ####
#install.packages(c("ggplot2", "ggpubr", "tidyverse", "broom", "AICcmodavg"))

library(ggplot2)
library(ggpubr)
library(tidyverse)
library(broom)
library(AICcmodavg)
library(readr)
library(ggraptR)
library(plotrix)
library(car)
library(dplyr)
1.1. Importing RNAi affected behavior data
workDir <- "/Users/maevatecher/Documents/GitHub/locust-comparative-genomics/data"
setwd(workDir)
rnai_file <- file.path(workDir, "behavioral_data/RNAi/RNAi_behavior_2.csv")
RNAi_behavior_2 <- read.csv(rnai_file, stringsAsFactors = FALSE)


#### Checking basic things ####
#Number of replicate per treatment (15 for each of the 8 treatments)

treats <- c("hexamerin1", "hexamerin2", "JHMT", "IOX",
                "miniature", "GFP", "saline", "uninjected")

for (treatment in treats) {
  count <- sum(RNAi_behavior_2$Treatment == treatment)
  cat(treatment, ":", count, "\n")
}
hexamerin1 : 15
hexamerin2 : 15
JHMT : 15
IOX : 15
miniature : 15
GFP : 15
saline : 15
uninjected : 15 #Checking sex ratio and stimulus side ratio for each treatment
#Ideally, half males half females, and half left half right, per treatment
#So ideally per treatment: 7-8M and 7-8F, 7-8left and 7-8right
#Which means 3-4M left, 3-4M right, 3-4F left, 3-4F right
treatments <- unique(RNAi_behavior_2$Treatment)
results <- list()
for (t in treatments) {
subset_data <- RNAi_behavior_2[RNAi_behavior_2$Treatment == t, ]
male_left <- sum(subset_data$Sex == "male" & subset_data$StimulusSide == "left")
male_right <- sum(subset_data$Sex == "male" & subset_data$StimulusSide == "right")
female_left <- sum(subset_data$Sex == "female" & subset_data$StimulusSide == "left")
female_right<- sum(subset_data$Sex == "female" & subset_data$StimulusSide == "right")
results[[t]] <- c(
male_left = male_left,
male_right = male_right,
female_left = female_left,
female_right = female_right
)
}
results_df <- do.call(rbind, results)
print(results_df) male_left male_right female_left female_right
hexamerin1 5 4 3 3
JHMT 3 5 0 7
uninjected 0 7 0 8
hexamerin2 5 3 3 4
IOX 2 7 4 2
miniature 7 0 8 0
saline 5 3 3 4
GFP 2 3 4 61.2. Statistics on each parameter
#DISTANCE MOVED
#This is checking for normal distribution or not
shapiro_results_DistanceMoved <- RNAi_behavior_2 %>%
  group_by(Treatment) %>%
  summarise(shapiro_p_value = shapiro.test(DistanceMoved)$p.value)

#This is taking apart what is normally distributed
treatments_parametric_DistanceMoved <- shapiro_results_DistanceMoved %>%
  filter(shapiro_p_value > 0.05, Treatment != "saline") %>%
  pull(Treatment)

#This is taking apart what is not normally distributed
treatments_non_parametric_DistanceMoved <- shapiro_results_DistanceMoved %>%
  filter(shapiro_p_value <= 0.05, Treatment != "saline") %>%
  pull(Treatment)

#Loop to run suitable test (normal distribution gets a t-test)
for (treatment in treatments_parametric_DistanceMoved) {
  cat("\nRunning t-test for", treatment, "vs saline (variable: DistanceMoved)\n")
  print(t.test(DistanceMoved ~ Treatment, data = RNAi_behavior_2 %>% filter(Treatment %in% c(treatment, "saline"))))
}
Running t-test for JHMT vs saline (variable: DistanceMoved)

    Welch Two Sample t-test

data:  DistanceMoved by Treatment
t = 2.0091, df = 20.017, p-value = 0.05821
alternative hypothesis: true difference in means between group JHMT and group saline is not equal to 0
95 percent confidence interval:
 -1.857067 99.021560
sample estimates:
  mean in group JHMT mean in group saline
           129.69109             81.10885


Running t-test for hexamerin1 vs saline (variable: DistanceMoved)

    Welch Two Sample t-test

data:  DistanceMoved by Treatment
t = 0.81782, df = 20.144, p-value = 0.423
alternative hypothesis: true difference in means between group hexamerin1 and group saline is not equal to 0
95 percent confidence interval:
 -30.3549  69.5359
sample estimates:
mean in group hexamerin1     mean in group saline
               100.69935                 81.10885


Running t-test for hexamerin2 vs saline (variable: DistanceMoved)

    Welch Two Sample t-test

data:  DistanceMoved by Treatment
t = 1.7236, df = 18.641, p-value = 0.1013
alternative hypothesis: true difference in means between group hexamerin2 and group saline is not equal to 0
95 percent confidence interval:
 -10.12006 103.84788
sample estimates:
mean in group hexamerin2     mean in group saline
               127.97275                 81.10885


Running t-test for uninjected vs saline (variable: DistanceMoved)

    Welch Two Sample t-test

data:  DistanceMoved by Treatment
t = -2.708, df = 17.362, p-value = 0.01473
alternative hypothesis: true difference in means between group saline and group uninjected is not equal to 0
95 percent confidence interval:
 -151.63309  -18.94457
sample estimates:
    mean in group saline mean in group uninjected
                81.10885                166.39768
#hexamerin1 vs saline: t = 0.81782, df = 20.144, p-value = 0.423 (hex1 100.69935, saline 81.10885)
#hexamerin2 vs saline: t = 1.7236, df = 18.641, p-value = 0.1013 (hex2 127.97275, saline 81.10885)
#JHMT vs saline: t = 2.0091, df = 20.017, p-value = 0.05821 (JHMT 129.69109, saline 81.10885)
#uninjected vs saline: t = -2.708, df = 17.362, p-value = 0.01473 (uninjected 166.39768, saline 81.10885)
#Loop to run suitable test (not normal distribution gets a wilcoxon test)
for (treatment in treatments_non_parametric_DistanceMoved) {
cat("\nRunning Wilcoxon test for", treatment, "vs saline (variable: DistanceMoved)\n")
print(wilcox.test(DistanceMoved ~ Treatment, data = RNAi_behavior_2 %>% filter(Treatment %in% c(treatment, "saline"))))
}
Running Wilcoxon test for GFP vs saline (variable: DistanceMoved)

    Wilcoxon rank sum exact test

data:  DistanceMoved by Treatment
W = 76, p-value = 0.137
alternative hypothesis: true location shift is not equal to 0


Running Wilcoxon test for IOX vs saline (variable: DistanceMoved)

    Wilcoxon rank sum exact test

data:  DistanceMoved by Treatment
W = 145, p-value = 0.1873
alternative hypothesis: true location shift is not equal to 0


Running Wilcoxon test for miniature vs saline (variable: DistanceMoved)

    Wilcoxon rank sum exact test

data:  DistanceMoved by Treatment
W = 119, p-value = 0.8063
alternative hypothesis: true location shift is not equal to 0
#IOX vs saline: W = 145, p-value = 0.1873
#miniature vs saline: W = 119, p-value = 0.8063
#GFP vs saline: W = 76, p-value = 0.137
#Just checking...
shapiro_results_DistanceMoved# A tibble: 8 × 2
Treatment shapiro_p_value
<chr> <dbl>
1 GFP 0.00136
2 IOX 0.0000347
3 JHMT 0.0852
4 hexamerin1 0.109
5 hexamerin2 0.0592
6 miniature 0.000827
7 saline 0.0371
8 uninjected 0.120 treatments_parametric_DistanceMoved[1] "JHMT" "hexamerin1" "hexamerin2" "uninjected"#hexamerin1 hexamerin2 JHMT uninjected
treatments_non_parametric_DistanceMoved[1] "GFP" "IOX" "miniature"#IOX miniature GFP salineTime spent moving
#TIME SPENT MOVING
shapiro_results_TimeMoving <- RNAi_behavior_2 %>%
  group_by(Treatment) %>%
  summarise(shapiro_p_value = shapiro.test(TimeMoving)$p.value)

treatments_parametric_TimeMoving <- shapiro_results_TimeMoving %>%
  filter(shapiro_p_value > 0.05, Treatment != "saline") %>%
  pull(Treatment)

treatments_non_parametric_TimeMoving <- shapiro_results_TimeMoving %>%
  filter(shapiro_p_value <= 0.05, Treatment != "saline") %>%
  pull(Treatment)

for (treatment in treatments_parametric_TimeMoving) {
  cat("\nRunning t-test for", treatment, "vs saline (variable: TimeMoving)\n")
  print(t.test(TimeMoving ~ Treatment, data = RNAi_behavior_2 %>% filter(Treatment %in% c(treatment, "saline"))))
}
Running t-test for JHMT vs saline (variable: TimeMoving)

    Welch Two Sample t-test

data:  TimeMoving by Treatment
t = 2.2449, df = 19.55, p-value = 0.03652
alternative hypothesis: true difference in means between group JHMT and group saline is not equal to 0
95 percent confidence interval:
   3.801685 105.704182
sample estimates:
  mean in group JHMT mean in group saline
           148.29638             93.54345


Running t-test for hexamerin1 vs saline (variable: TimeMoving)

    Welch Two Sample t-test

data:  TimeMoving by Treatment
t = 0.61765, df = 18.899, p-value = 0.5442
alternative hypothesis: true difference in means between group hexamerin1 and group saline is not equal to 0
95 percent confidence interval:
 -38.08946  69.96478
sample estimates:
mean in group hexamerin1     mean in group saline
               109.48110                 93.54345


Running t-test for hexamerin2 vs saline (variable: TimeMoving)

    Welch Two Sample t-test

data:  TimeMoving by Treatment
t = 1.4375, df = 19.748, p-value = 0.1662
alternative hypothesis: true difference in means between group hexamerin2 and group saline is not equal to 0
95 percent confidence interval:
 -15.60759  84.62466
sample estimates:
mean in group hexamerin2     mean in group saline
               128.05198                 93.54345


Running t-test for uninjected vs saline (variable: TimeMoving)

    Welch Two Sample t-test

data:  TimeMoving by Treatment
t = -2.697, df = 18.179, p-value = 0.01466
alternative hypothesis: true difference in means between group saline and group uninjected is not equal to 0
95 percent confidence interval:
 -133.00614  -16.57014
sample estimates:
    mean in group saline mean in group uninjected
                93.54345                168.33159
#hex1 vs saline: t = 0.61765, df = 18.899, p-value = 0.5442 (hexamerin1 109.48110, saline 93.54345)
#hex2 vs saline: t = 1.4375, df = 19.748, p-value = 0.1662 (hexamerin2 128.05198, saline 93.54345)
#JHMT vs saline: t = 2.2449, df = 19.55, p-value = 0.03652 (JHMT 148.29638, saline 93.54345)
#uninjected vs saline: t = -2.697, df = 18.179, p-value = 0.01466 (uninjected 168.33159, saline 93.54345)
for (treatment in treatments_non_parametric_TimeMoving) {
cat("\nRunning Wilcoxon test for", treatment, "vs saline (variable: TimeMoving)\n")
print(wilcox.test(TimeMoving ~ Treatment, data = RNAi_behavior_2 %>% filter(Treatment %in% c(treatment, "saline"))))
}
Running Wilcoxon test for GFP vs saline (variable: TimeMoving)

    Wilcoxon rank sum exact test

data:  TimeMoving by Treatment
W = 79, p-value = 0.1736
alternative hypothesis: true location shift is not equal to 0


Running Wilcoxon test for IOX vs saline (variable: TimeMoving)

    Wilcoxon rank sum exact test

data:  TimeMoving by Treatment
W = 142, p-value = 0.2328
alternative hypothesis: true location shift is not equal to 0


Running Wilcoxon test for miniature vs saline (variable: TimeMoving)

    Wilcoxon rank sum exact test

data:  TimeMoving by Treatment
W = 115, p-value = 0.9349
alternative hypothesis: true location shift is not equal to 0
#IOX vs saline: W = 142, p-value = 0.2328
#miniature vs saline:W = 115, p-value = 0.9349
#GFP vs saline:W = 79, p-value = 0.1736
shapiro_results_TimeMoving# A tibble: 8 × 2
Treatment shapiro_p_value
<chr> <dbl>
1 GFP 0.0121
2 IOX 0.0339
3 JHMT 0.0657
4 hexamerin1 0.0564
5 hexamerin2 0.0970
6 miniature 0.0146
7 saline 0.0562
8 uninjected 0.361 treatments_parametric_TimeMoving[1] "JHMT" "hexamerin1" "hexamerin2" "uninjected"#hexamerin1 hexamerin2 JHMT uninjected
treatments_non_parametric_TimeMoving[1] "GFP" "IOX" "miniature"#IOX miniature GFPTime spent in stimulus zone
#TIME SPENT IN STIMULUS ZONE
shapiro_results_StimulusZone <- RNAi_behavior_2 %>%
  group_by(Treatment) %>%
  summarise(shapiro_p_value = shapiro.test(StimulusZone)$p.value)

treatments_parametric_StimulusZone <- shapiro_results_StimulusZone %>%
  filter(shapiro_p_value > 0.05, Treatment != "saline") %>%
  pull(Treatment)

treatments_non_parametric_StimulusZone <- shapiro_results_StimulusZone %>%
  filter(shapiro_p_value <= 0.05, Treatment != "saline") %>%
  pull(Treatment)

for (treatment in treatments_parametric_StimulusZone) {
  cat("\nRunning t-test for", treatment, "vs saline (variable: StimulusZone)\n")
  print(t.test(StimulusZone ~ Treatment, data = RNAi_behavior_2 %>% filter(Treatment %in% c(treatment, "saline"))))
}
Running t-test for IOX vs saline (variable: StimulusZone)

    Welch Two Sample t-test

data:  StimulusZone by Treatment
t = 0.63594, df = 26.009, p-value = 0.5304
alternative hypothesis: true difference in means between group IOX and group saline is not equal to 0
95 percent confidence interval:
 -118.5501  224.7667
sample estimates:
   mean in group IOX mean in group saline
            306.5302             253.4219


Running t-test for hexamerin1 vs saline (variable: StimulusZone)

    Welch Two Sample t-test

data:  StimulusZone by Treatment
t = 0.17338, df = 27.466, p-value = 0.8636
alternative hypothesis: true difference in means between group hexamerin1 and group saline is not equal to 0
95 percent confidence interval:
 -165.9063  196.5594
sample estimates:
mean in group hexamerin1     mean in group saline
                268.7485                 253.4219


Running t-test for miniature vs saline (variable: StimulusZone)

    Welch Two Sample t-test

data:  StimulusZone by Treatment
t = -0.12406, df = 27.178, p-value = 0.9022
alternative hypothesis: true difference in means between group miniature and group saline is not equal to 0
95 percent confidence interval:
 -189.4437  167.8349
sample estimates:
mean in group miniature    mean in group saline
               242.6175                253.4219
#hex1 vs saline: t = 0.17338, df = 27.466, p-value = 0.8636 (hexamerin1 268.7485, saline 253.4219 )
#IOX vs saline: t = 0.63594, df = 26.009, p-value = 0.5304 (IOX 306.5302, saline 253.4219)
#miniature vs saline: t = -0.12406, df = 27.178, p-value = 0.9022 (miniature 242.6175, saline 253.4219)
for (treatment in treatments_non_parametric_StimulusZone) {
cat("\nRunning Wilcoxon test for", treatment, "vs saline (variable: StimulusZone)\n")
print(wilcox.test(StimulusZone ~ Treatment, data = RNAi_behavior_2 %>% filter(Treatment %in% c(treatment, "saline"))))
}
Running Wilcoxon test for GFP vs saline (variable: StimulusZone)
    Wilcoxon rank sum test with continuity correction

data:  StimulusZone by Treatment
W = 73, p-value = 0.08779
alternative hypothesis: true location shift is not equal to 0


Running Wilcoxon test for JHMT vs saline (variable: StimulusZone)
    Wilcoxon rank sum test with continuity correction

data:  StimulusZone by Treatment
W = 95.5, p-value = 0.4896
alternative hypothesis: true location shift is not equal to 0


Running Wilcoxon test for hexamerin2 vs saline (variable: StimulusZone)
    Wilcoxon rank sum test with continuity correction

data:  StimulusZone by Treatment
W = 117.5, p-value = 0.851
alternative hypothesis: true location shift is not equal to 0


Running Wilcoxon test for uninjected vs saline (variable: StimulusZone)
    Wilcoxon rank sum test with continuity correction

data:  StimulusZone by Treatment
W = 115.5, p-value = 0.9169
alternative hypothesis: true location shift is not equal to 0
#hex2 vs saline: W = 117.5, p-value = 0.851
#JHMT vs saline: W = 95.5, p-value = 0.4896
#GFP vs saline: W = 73, p-value = 0.08779
#uninjected vs saline: W = 115.5, p-value = 0.9169
shapiro_results_StimulusZone# A tibble: 8 × 2
Treatment shapiro_p_value
<chr> <dbl>
1 GFP 0.0000403
2 IOX 0.361
3 JHMT 0.00819
4 hexamerin1 0.0502
5 hexamerin2 0.0425
6 miniature 0.0579
7 saline 0.00358
8 uninjected 0.0319 treatments_parametric_StimulusZone[1] "IOX" "hexamerin1" "miniature" #hexamerin1 IOX miniature
treatments_non_parametric_StimulusZone[1] "GFP" "JHMT" "hexamerin2" "uninjected"#hexamerin2 JHMT GFP saline uninjectedTime spent in non-stimulus zone
#TIME SPENT IN NON-STIMULUS ZONE
shapiro_results_NonStimulusZone <- RNAi_behavior_2 %>%
  group_by(Treatment) %>%
  summarise(shapiro_p_value = shapiro.test(NonStimulusZone)$p.value)

treatments_parametric_NonStimulusZone <- shapiro_results_NonStimulusZone %>%
  filter(shapiro_p_value > 0.05, Treatment != "saline") %>%
  pull(Treatment)

treatments_non_parametric_NonStimulusZone <- shapiro_results_NonStimulusZone %>%
  filter(shapiro_p_value <= 0.05, Treatment != "saline") %>%
  pull(Treatment)

for (treatment in treatments_parametric_NonStimulusZone) {
  cat("\nRunning t-test for", treatment, "vs saline (variable: NonStimulusZone)\n")
  print(t.test(NonStimulusZone ~ Treatment, data = RNAi_behavior_2 %>% filter(Treatment %in% c(treatment, "saline"))))
}
Running t-test for JHMT vs saline (variable: NonStimulusZone)

    Welch Two Sample t-test

data:  NonStimulusZone by Treatment
t = 0.95669, df = 23.562, p-value = 0.3484
alternative hypothesis: true difference in means between group JHMT and group saline is not equal to 0
95 percent confidence interval:
 -79.45843 216.51936
sample estimates:
  mean in group JHMT mean in group saline
            349.6877             281.1573
#JHMT vs saline: t = 0.95669, df = 23.562, p-value = 0.3484 (JHMT 349.6877, saline 281.1573)
for (treatment in treatments_non_parametric_NonStimulusZone) {
cat("\nRunning Wilcoxon test for", treatment, "vs saline (variable: NonStimulusZone)\n")
print(wilcox.test(NonStimulusZone ~ Treatment, data = RNAi_behavior_2 %>% filter(Treatment %in% c(treatment, "saline"))))
}
Running Wilcoxon test for GFP vs saline (variable: NonStimulusZone)
    Wilcoxon rank sum test with continuity correction

data:  NonStimulusZone by Treatment
W = 133, p-value = 0.4002
alternative hypothesis: true location shift is not equal to 0


Running Wilcoxon test for IOX vs saline (variable: NonStimulusZone)
    Wilcoxon rank sum test with continuity correction

data:  NonStimulusZone by Treatment
W = 89.5, p-value = 0.3417
alternative hypothesis: true location shift is not equal to 0


Running Wilcoxon test for hexamerin1 vs saline (variable: NonStimulusZone)
    Wilcoxon rank sum test with continuity correction

data:  NonStimulusZone by Treatment
W = 100.5, p-value = 0.6268
alternative hypothesis: true location shift is not equal to 0


Running Wilcoxon test for hexamerin2 vs saline (variable: NonStimulusZone)
    Wilcoxon rank sum test with continuity correction

data:  NonStimulusZone by Treatment
W = 102.5, p-value = 0.6881
alternative hypothesis: true location shift is not equal to 0


Running Wilcoxon test for miniature vs saline (variable: NonStimulusZone)
    Wilcoxon rank sum test with continuity correction

data:  NonStimulusZone by Treatment
W = 116, p-value = 0.8999
alternative hypothesis: true location shift is not equal to 0


Running Wilcoxon test for uninjected vs saline (variable: NonStimulusZone)
    Wilcoxon rank sum test with continuity correction

data:  NonStimulusZone by Treatment
W = 126.5, p-value = 0.5719
alternative hypothesis: true location shift is not equal to 0
#hex1 vs saline: W = 100.5, p-value = 0.6268
#hex2 vs saline: W = 102.5, p-value = 0.6881
#IOX vs saline: W = 89.5, p-value = 0.3417
#miniature vs saline: W = 116, p-value = 0.8999
#GFP vs saline: W = 133, p-value = 0.4002
#uninjected vs saline: W = 126.5, p-value = 0.5719
shapiro_results_NonStimulusZone# A tibble: 8 × 2
Treatment shapiro_p_value
<chr> <dbl>
1 GFP 0.00473
2 IOX 0.0337
3 JHMT 0.146
4 hexamerin1 0.00776
5 hexamerin2 0.0334
6 miniature 0.0452
7 saline 0.0232
8 uninjected 0.0419 treatments_parametric_NonStimulusZone[1] "JHMT"#JHMT
treatments_non_parametric_NonStimulusZone[1] "GFP" "IOX" "hexamerin1" "hexamerin2" "miniature"
[6] "uninjected"#hexamerin1 hexamerin2 IOX miniature GFP uninjectedTime spent in middle zone
#TIME SPENT IN MIDDLE ZONE
shapiro_results_MiddleZone <- RNAi_behavior_2 %>%
  group_by(Treatment) %>%
  summarise(shapiro_p_value = shapiro.test(MiddleZone)$p.value)

treatments_parametric_MiddleZone <- shapiro_results_MiddleZone %>%
  filter(shapiro_p_value > 0.05, Treatment != "saline") %>%
  pull(Treatment)

treatments_non_parametric_MiddleZone <- shapiro_results_MiddleZone %>%
  filter(shapiro_p_value <= 0.05, Treatment != "saline") %>%
  pull(Treatment)

for (treatment in treatments_parametric_MiddleZone) {
  cat("\nRunning t-test for", treatment, "vs saline (variable: MiddleZone)\n")
  print(t.test(MiddleZone ~ Treatment, data = RNAi_behavior_2 %>% filter(Treatment %in% c(treatment, "saline"))))
}
Running t-test for IOX vs saline (variable: MiddleZone)

    Welch Two Sample t-test

data:  MiddleZone by Treatment
t = 1.4591, df = 27.989, p-value = 0.1557
alternative hypothesis: true difference in means between group IOX and group saline is not equal to 0
95 percent confidence interval:
 -12.55312  74.71710
sample estimates:
   mean in group IOX mean in group saline
            93.79246             62.71047


Running t-test for miniature vs saline (variable: MiddleZone)

    Welch Two Sample t-test

data:  MiddleZone by Treatment
t = 0.53735, df = 27.211, p-value = 0.5954
alternative hypothesis: true difference in means between group miniature and group saline is not equal to 0
95 percent confidence interval:
 -35.04393  59.92373
sample estimates:
mean in group miniature    mean in group saline
               75.15037                62.71047
#IOX vs saline: t = 1.4591, df = 27.989, p-value = 0.1557 (IOX 93.79246, saline 62.71047)
#miniature vs saline: t = 0.53735, df = 27.211, p-value = 0.5954 (miniature 75.15037, saline 62.71047)
for (treatment in treatments_non_parametric_MiddleZone) {
cat("\nRunning Wilcoxon test for", treatment, "vs saline (variable: MiddleZone)\n")
print(wilcox.test(MiddleZone ~ Treatment, data = RNAi_behavior_2 %>% filter(Treatment %in% c(treatment, "saline"))))
}
Running Wilcoxon test for GFP vs saline (variable: MiddleZone)
    Wilcoxon rank sum test with continuity correction

data:  MiddleZone by Treatment
W = 80, p-value = 0.1763
alternative hypothesis: true location shift is not equal to 0


Running Wilcoxon test for JHMT vs saline (variable: MiddleZone)
    Wilcoxon rank sum test with continuity correction

data:  MiddleZone by Treatment
W = 127, p-value = 0.5613
alternative hypothesis: true location shift is not equal to 0


Running Wilcoxon test for hexamerin1 vs saline (variable: MiddleZone)
    Wilcoxon rank sum test with continuity correction

data:  MiddleZone by Treatment
W = 112, p-value = 1
alternative hypothesis: true location shift is not equal to 0


Running Wilcoxon test for hexamerin2 vs saline (variable: MiddleZone)
    Wilcoxon rank sum test with continuity correction

data:  MiddleZone by Treatment
W = 106, p-value = 0.8032
alternative hypothesis: true location shift is not equal to 0


Running Wilcoxon test for uninjected vs saline (variable: MiddleZone)
    Wilcoxon rank sum test with continuity correction

data:  MiddleZone by Treatment
W = 76, p-value = 0.1352
alternative hypothesis: true location shift is not equal to 0
#hex1 vs saline: W = 112, p-value = 1
#hex2 vs saline: W = 106, p-value = 0.8032
#JHMT vs saline: W = 127, p-value = 0.5613
#GFP vs saline: W = 80, p-value = 0.1763
#uninjected vs saline: W = 76, p-value = 0.1352
shapiro_results_MiddleZone# A tibble: 8 × 2
Treatment shapiro_p_value
<chr> <dbl>
1 GFP 0.00000855
2 IOX 0.117
3 JHMT 0.00124
4 hexamerin1 0.0000281
5 hexamerin2 0.000173
6 miniature 0.126
7 saline 0.104
8 uninjected 0.00225 treatments_parametric_MiddleZone[1] "IOX" "miniature"#IOX miniature
treatments_non_parametric_MiddleZone[1] "GFP" "JHMT" "hexamerin1" "hexamerin2" "uninjected"#hexamerin1 hexamerin2 JHMT GFP uninjectedTime spent in non-stimulus and middle zone combined
#TIME SPENT IN NON-STIMULUS ZONE AND MIDDLE ZONE COMBINED
shapiro_results_NonStimulusZoneAndMiddleZoneCombined <- RNAi_behavior_2 %>%
  group_by(Treatment) %>%
  summarise(shapiro_p_value = shapiro.test(NonStimulusZoneAndMiddleZoneCombined)$p.value)

treatments_parametric_NonStimulusZoneAndMiddleZoneCombined <- shapiro_results_NonStimulusZoneAndMiddleZoneCombined %>%
  filter(shapiro_p_value > 0.05, Treatment != "saline") %>%
  pull(Treatment)

treatments_non_parametric_NonStimulusZoneAndMiddleZoneCombined <- shapiro_results_NonStimulusZoneAndMiddleZoneCombined %>%
  filter(shapiro_p_value <= 0.05, Treatment != "saline") %>%
  pull(Treatment)

for (treatment in treatments_parametric_NonStimulusZoneAndMiddleZoneCombined) {
  cat("\nRunning t-test for", treatment, "vs saline (variable: NonStimulusZoneAndMiddleZoneCombined)\n")
  print(t.test(NonStimulusZoneAndMiddleZoneCombined ~ Treatment, data = RNAi_behavior_2 %>% filter(Treatment %in% c(treatment, "saline"))))
}
Running t-test for IOX vs saline (variable: NonStimulusZoneAndMiddleZoneCombined)

    Welch Two Sample t-test

data:  NonStimulusZoneAndMiddleZoneCombined by Treatment
t = -0.63757, df = 26.11, p-value = 0.5293
alternative hypothesis: true difference in means between group IOX and group saline is not equal to 0
95 percent confidence interval:
 -224.0514  117.9502
sample estimates:
   mean in group IOX mean in group saline
            290.8171             343.8677


Running t-test for miniature vs saline (variable: NonStimulusZoneAndMiddleZoneCombined)

    Welch Two Sample t-test

data:  NonStimulusZoneAndMiddleZoneCombined by Treatment
t = 0.12582, df = 27.215, p-value = 0.9008
alternative hypothesis: true difference in means between group miniature and group saline is not equal to 0
95 percent confidence interval:
 -166.8498  188.6583
sample estimates:
mean in group miniature    mean in group saline
               354.7720                343.8677
#IOX vs saline: t = -0.63757, df = 26.11, p-value = 0.5293 (IOX 290.8171, saline 343.8677)
#miniature vs saline: t = 0.12582, df = 27.215, p-value = 0.9008 (miniature 354.7720, saline 343.8677)
for (treatment in treatments_non_parametric_NonStimulusZoneAndMiddleZoneCombined) {
cat("\nRunning Wilcoxon test for", treatment, "vs saline (variable: NonStimulusZoneAndMiddleZoneCombined)\n")
print(wilcox.test(NonStimulusZoneAndMiddleZoneCombined ~ Treatment, data = RNAi_behavior_2 %>% filter(Treatment %in% c(treatment, "saline"))))
}
Running Wilcoxon test for GFP vs saline (variable: NonStimulusZoneAndMiddleZoneCombined)
    Wilcoxon rank sum test with continuity correction

data:  NonStimulusZoneAndMiddleZoneCombined by Treatment
W = 137, p-value = 0.3182
alternative hypothesis: true location shift is not equal to 0


Running Wilcoxon test for JHMT vs saline (variable: NonStimulusZoneAndMiddleZoneCombined)
    Wilcoxon rank sum test with continuity correction

data:  NonStimulusZoneAndMiddleZoneCombined by Treatment
W = 121.5, p-value = 0.7243
alternative hypothesis: true location shift is not equal to 0


Running Wilcoxon test for hexamerin1 vs saline (variable: NonStimulusZoneAndMiddleZoneCombined)
    Wilcoxon rank sum test with continuity correction

data:  NonStimulusZoneAndMiddleZoneCombined by Treatment
W = 116, p-value = 0.9008
alternative hypothesis: true location shift is not equal to 0


Running Wilcoxon test for hexamerin2 vs saline (variable: NonStimulusZoneAndMiddleZoneCombined)
    Wilcoxon rank sum test with continuity correction

data:  NonStimulusZoneAndMiddleZoneCombined by Treatment
W = 107.5, p-value = 0.8519
alternative hypothesis: true location shift is not equal to 0


Running Wilcoxon test for uninjected vs saline (variable: NonStimulusZoneAndMiddleZoneCombined)
    Wilcoxon rank sum test with continuity correction

data:  NonStimulusZoneAndMiddleZoneCombined by Treatment
W = 108.5, p-value = 0.8844
alternative hypothesis: true location shift is not equal to 0
#hex1 vs saline: W = 116, p-value = 0.9008
#hex2 vs saline: W = 107.5, p-value = 0.8519
#JHMT vs saline: W = 121.5, p-value = 0.7243
#GFP vs saline: W = 137, p-value = 0.3182
#uninjected vs saline: W = 108.5, p-value = 0.8844
shapiro_results_NonStimulusZoneAndMiddleZoneCombined# A tibble: 8 × 2
Treatment shapiro_p_value
<chr> <dbl>
1 GFP 0.000870
2 IOX 0.370
3 JHMT 0.0315
4 hexamerin1 0.0409
5 hexamerin2 0.0427
6 miniature 0.0631
7 saline 0.00386
8 uninjected 0.0309 treatments_parametric_NonStimulusZoneAndMiddleZoneCombined[1] "IOX" "miniature"#IOX miniature
treatments_non_parametric_NonStimulusZoneAndMiddleZoneCombined[1] "GFP" "JHMT" "hexamerin1" "hexamerin2" "uninjected"#hexamerin1 hexamerin2 JHMT GFP uninjectedTime spent in stimulus wall
#TIME SPENT ON STIMULUS WALL
shapiro_results_StimulusWall <- RNAi_behavior_2 %>%
  group_by(Treatment) %>%
  summarise(shapiro_p_value = shapiro.test(StimulusWall)$p.value)

treatments_parametric_StimulusWall <- shapiro_results_StimulusWall %>%
  filter(shapiro_p_value > 0.05, Treatment != "saline") %>%
  pull(Treatment)

treatments_non_parametric_StimulusWall <- shapiro_results_StimulusWall %>%
  filter(shapiro_p_value <= 0.05, Treatment != "saline") %>%
  pull(Treatment)

for (treatment in treatments_parametric_StimulusWall) {
  cat("\nRunning t-test for", treatment, "vs saline (variable: StimulusWall)\n")
  print(t.test(StimulusWall ~ Treatment, data = RNAi_behavior_2 %>% filter(Treatment %in% c(treatment, "saline"))))
}

for (treatment in treatments_non_parametric_StimulusWall) {
  cat("\nRunning Wilcoxon test for", treatment, "vs saline (variable: StimulusWall)\n")
  print(wilcox.test(StimulusWall ~ Treatment, data = RNAi_behavior_2 %>% filter(Treatment %in% c(treatment, "saline"))))
}
Running Wilcoxon test for GFP vs saline (variable: StimulusWall)
    Wilcoxon rank sum test with continuity correction

data:  StimulusWall by Treatment
W = 79.5, p-value = 0.128
alternative hypothesis: true location shift is not equal to 0


Running Wilcoxon test for IOX vs saline (variable: StimulusWall)
    Wilcoxon rank sum test with continuity correction

data:  StimulusWall by Treatment
W = 113, p-value = 1
alternative hypothesis: true location shift is not equal to 0


Running Wilcoxon test for JHMT vs saline (variable: StimulusWall)
    Wilcoxon rank sum test with continuity correction

data:  StimulusWall by Treatment
W = 103.5, p-value = 0.7156
alternative hypothesis: true location shift is not equal to 0


Running Wilcoxon test for hexamerin1 vs saline (variable: StimulusWall)
    Wilcoxon rank sum test with continuity correction

data:  StimulusWall by Treatment
W = 108, p-value = 0.8626
alternative hypothesis: true location shift is not equal to 0


Running Wilcoxon test for hexamerin2 vs saline (variable: StimulusWall)
    Wilcoxon rank sum test with continuity correction

data:  StimulusWall by Treatment
W = 118, p-value = 0.8316
alternative hypothesis: true location shift is not equal to 0


Running Wilcoxon test for miniature vs saline (variable: StimulusWall)
    Wilcoxon rank sum test with continuity correction

data:  StimulusWall by Treatment
W = 118, p-value = 0.8316
alternative hypothesis: true location shift is not equal to 0


Running Wilcoxon test for uninjected vs saline (variable: StimulusWall)
    Wilcoxon rank sum test with continuity correction

data:  StimulusWall by Treatment
W = 125, p-value = 0.6036
alternative hypothesis: true location shift is not equal to 0
#hex1 vs saline: W = 108, p-value = 0.8626
#hex2 vs saline: W = 118, p-value = 0.8316
#JHMT vs saline: W = 103.5, p-value = 0.7156
#IOX vs saline: W = 113, p-value = 1
#miniature vs saline: W = 118, p-value = 0.8316
#GFP vs saline: W = 79.5, p-value = 0.128
#uninjected vs saline: W = 125, p-value = 0.6036
shapiro_results_StimulusWall# A tibble: 8 × 2
Treatment shapiro_p_value
<chr> <dbl>
1 GFP 0.00000418
2 IOX 0.0108
3 JHMT 0.0000194
4 hexamerin1 0.000418
5 hexamerin2 0.00528
6 miniature 0.000132
7 saline 0.000458
8 uninjected 0.000198 treatments_parametric_StimulusWallcharacter(0)#None!
treatments_non_parametric_StimulusWall[1] "GFP" "IOX" "JHMT" "hexamerin1" "hexamerin2"
[6] "miniature" "uninjected"#hexamerin1 hexamerin2 JHMT IOX miniature GFP uninjectedTime spent in non-stimulus wall
#TIME SPENT ON NON-STIMULUS WALL
shapiro_results_NonStimulusWall <- RNAi_behavior_2 %>%
  group_by(Treatment) %>%
  summarise(shapiro_p_value = shapiro.test(NonStimulusWall)$p.value)

treatments_parametric_NonStimulusWall <- shapiro_results_NonStimulusWall %>%
  filter(shapiro_p_value > 0.05, Treatment != "saline") %>%
  pull(Treatment)

treatments_non_parametric_NonStimulusWall <- shapiro_results_NonStimulusWall %>%
  filter(shapiro_p_value <= 0.05, Treatment != "saline") %>%
  pull(Treatment)

for (treatment in treatments_parametric_NonStimulusWall) {
  cat("\nRunning t-test for", treatment, "vs saline (variable: NonStimulusWall)\n")
  print(t.test(NonStimulusWall ~ Treatment, data = RNAi_behavior_2 %>% filter(Treatment %in% c(treatment, "saline"))))
}

for (treatment in treatments_non_parametric_NonStimulusWall) {
  cat("\nRunning Wilcoxon test for", treatment, "vs saline (variable: NonStimulusWall)\n")
  print(wilcox.test(NonStimulusWall ~ Treatment, data = RNAi_behavior_2 %>% filter(Treatment %in% c(treatment, "saline"))))
}
Running Wilcoxon test for GFP vs saline (variable: NonStimulusWall)
    Wilcoxon rank sum test with continuity correction

data:  NonStimulusWall by Treatment
W = 109.5, p-value = 0.9159
alternative hypothesis: true location shift is not equal to 0


Running Wilcoxon test for IOX vs saline (variable: NonStimulusWall)
    Wilcoxon rank sum test with continuity correction

data:  NonStimulusWall by Treatment
W = 89, p-value = 0.328
alternative hypothesis: true location shift is not equal to 0


Running Wilcoxon test for JHMT vs saline (variable: NonStimulusWall)
    Wilcoxon rank sum test with continuity correction

data:  NonStimulusWall by Treatment
W = 115, p-value = 0.9333
alternative hypothesis: true location shift is not equal to 0


Running Wilcoxon test for hexamerin1 vs saline (variable: NonStimulusWall)
    Wilcoxon rank sum test with continuity correction

data:  NonStimulusWall by Treatment
W = 77, p-value = 0.1299
alternative hypothesis: true location shift is not equal to 0


Running Wilcoxon test for hexamerin2 vs saline (variable: NonStimulusWall)
    Wilcoxon rank sum test with continuity correction

data:  NonStimulusWall by Treatment
W = 105, p-value = 0.7659
alternative hypothesis: true location shift is not equal to 0


Running Wilcoxon test for miniature vs saline (variable: NonStimulusWall)
    Wilcoxon rank sum test with continuity correction

data:  NonStimulusWall by Treatment
W = 114.5, p-value = 0.9495
alternative hypothesis: true location shift is not equal to 0


Running Wilcoxon test for uninjected vs saline (variable: NonStimulusWall)
    Wilcoxon rank sum test with continuity correction

data:  NonStimulusWall by Treatment
W = 132.5, p-value = 0.4032
alternative hypothesis: true location shift is not equal to 0
#hex1 vs saline: W = 77, p-value = 0.1299
#hex2 vs saline: W = 105, p-value = 0.7659
#JHMT vs saline: W = 115, p-value = 0.9333
#IOX vs saline: W = 89, p-value = 0.328
#miniature vs saline: W = 114.5, p-value = 0.9495
#GFP vs saline: W = 109.5, p-value = 0.9159
#uninjected vs saline: W = 132.5, p-value = 0.4032
shapiro_results_NonStimulusWall# A tibble: 8 × 2
Treatment shapiro_p_value
<chr> <dbl>
1 GFP 0.00287
2 IOX 0.000127
3 JHMT 0.0305
4 hexamerin1 0.0000657
5 hexamerin2 0.00387
6 miniature 0.00103
7 saline 0.00256
8 uninjected 0.00380 treatments_parametric_NonStimulusWallcharacter(0)#None..!
treatments_non_parametric_NonStimulusWall[1] "GFP" "IOX" "JHMT" "hexamerin1" "hexamerin2"
[6] "miniature" "uninjected"#hexamerin1 hexamerin2 JHMT IOX miniature GFP uninjectedVelocity
##VELOCITY
shapiro_results_VelocityCalculated <- RNAi_behavior_2 %>%
  group_by(Treatment) %>%
  summarise(shapiro_p_value = shapiro.test(VelocityCalculated)$p.value)

treatments_parametric_VelocityCalculated <- shapiro_results_VelocityCalculated %>%
  filter(shapiro_p_value > 0.05, Treatment != "saline") %>%
  pull(Treatment)

treatments_non_parametric_VelocityCalculated <- shapiro_results_VelocityCalculated %>%
  filter(shapiro_p_value <= 0.05, Treatment != "saline") %>%
  pull(Treatment)

for (treatment in treatments_parametric_VelocityCalculated) {
  cat("\nRunning t-test for", treatment, "vs saline (variable: VelocityCalculated)\n")
  print(t.test(VelocityCalculated ~ Treatment, data = RNAi_behavior_2 %>% filter(Treatment %in% c(treatment, "saline"))))
}
Running t-test for JHMT vs saline (variable: VelocityCalculated)

    Welch Two Sample t-test

data:  VelocityCalculated by Treatment
t = 0.11353, df = 25.426, p-value = 0.9105
alternative hypothesis: true difference in means between group JHMT and group saline is not equal to 0
95 percent confidence interval:
 -0.09987976  0.11154373
sample estimates:
  mean in group JHMT mean in group saline
           0.8597872            0.8539552


Running t-test for hexamerin1 vs saline (variable: VelocityCalculated)

    Welch Two Sample t-test

data:  VelocityCalculated by Treatment
t = 0.36488, df = 22.418, p-value = 0.7186
alternative hypothesis: true difference in means between group hexamerin1 and group saline is not equal to 0
95 percent confidence interval:
 -0.1022860  0.1460206
sample estimates:
mean in group hexamerin1     mean in group saline
               0.8758225                0.8539552


Running t-test for hexamerin2 vs saline (variable: VelocityCalculated)

    Welch Two Sample t-test

data:  VelocityCalculated by Treatment
t = 1.7177, df = 26.376, p-value = 0.09757
alternative hypothesis: true difference in means between group hexamerin2 and group saline is not equal to 0
95 percent confidence interval:
 -0.01645777  0.18452075
sample estimates:
mean in group hexamerin2     mean in group saline
               0.9379867                0.8539552


Running t-test for uninjected vs saline (variable: VelocityCalculated)

    Welch Two Sample t-test

data:  VelocityCalculated by Treatment
t = -1.5481, df = 26.084, p-value = 0.1337
alternative hypothesis: true difference in means between group saline and group uninjected is not equal to 0
95 percent confidence interval:
 -0.17902051  0.02519586
sample estimates:
    mean in group saline mean in group uninjected
               0.8539552                0.9308675
#hex1 vs saline: t = 0.36488, df = 22.418, p-value = 0.7186 (hexamerin1 0.8758225, saline 0.8539552)
#hex2 vs saline: t = 1.7177, df = 26.376, p-value = 0.09757 (hexamerin2 0.9379867, saline 0.8539552)
#JHMT vs saline: t = 0.11353, df = 25.426, p-value = 0.9105 (JHMT 0.8597872, saline 0.8539552)
#uninjected vs saline: t = -1.5481, df = 26.084, p-value = 0.1337 (uninjected 0.9308675, saline 0.8539552)
for (treatment in treatments_non_parametric_VelocityCalculated) {
cat("\nRunning Wilcoxon test for", treatment, "vs saline (variable: VelocityCalculated)\n")
print(wilcox.test(VelocityCalculated ~ Treatment, data = RNAi_behavior_2 %>% filter(Treatment %in% c(treatment, "saline"))))
}
Running Wilcoxon test for GFP vs saline (variable: VelocityCalculated)

    Wilcoxon rank sum exact test

data:  VelocityCalculated by Treatment
W = 66, p-value = 0.05553
alternative hypothesis: true location shift is not equal to 0


Running Wilcoxon test for IOX vs saline (variable: VelocityCalculated)

    Wilcoxon rank sum exact test

data:  VelocityCalculated by Treatment
W = 139, p-value = 0.2854
alternative hypothesis: true location shift is not equal to 0


Running Wilcoxon test for miniature vs saline (variable: VelocityCalculated)

    Wilcoxon rank sum exact test

data:  VelocityCalculated by Treatment
W = 139, p-value = 0.2854
alternative hypothesis: true location shift is not equal to 0
#IOX vs saline: W = 139, p-value = 0.2854
#miniature vs saline: W = 139, p-value = 0.2854
#GFP vs saline: W = 66, p-value = 0.05553
shapiro_results_VelocityCalculated# A tibble: 8 × 2
Treatment shapiro_p_value
<chr> <dbl>
1 GFP 0.0442
2 IOX 0.000437
3 JHMT 0.250
4 hexamerin1 0.234
5 hexamerin2 0.369
6 miniature 0.00139
7 saline 0.151
8 uninjected 0.779 #hexamerin1 hexamerin2 JHMT uninjected
treatments_parametric_VelocityCalculated[1] "JHMT" "hexamerin1" "hexamerin2" "uninjected"#IOX miniature GFP
treatments_non_parametric_VelocityCalculated[1] "GFP" "IOX" "miniature"Rotations
##ROTATIONS
shapiro_results_Rotations <- RNAi_behavior_2 %>%
  group_by(Treatment) %>%
  summarise(shapiro_p_value = shapiro.test(RotationTotal)$p.value)

treatments_parametric_Rotations <- shapiro_results_Rotations %>%
  filter(shapiro_p_value > 0.05, Treatment != "saline") %>%
  pull(Treatment)

treatments_non_parametric_Rotations <- shapiro_results_Rotations %>%
  filter(shapiro_p_value <= 0.05, Treatment != "saline") %>%
  pull(Treatment)

for (treatment in treatments_parametric_Rotations) {
  cat("\nRunning t-test for", treatment, "vs saline (variable: RotationTotal)\n")
  print(t.test(RotationTotal ~ Treatment, data = RNAi_behavior_2 %>% filter(Treatment %in% c(treatment, "saline"))))
}
Running t-test for GFP vs saline (variable: RotationTotal)

    Welch Two Sample t-test

data:  RotationTotal by Treatment
t = -0.15346, df = 27.705, p-value = 0.8791
alternative hypothesis: true difference in means between group GFP and group saline is not equal to 0
95 percent confidence interval:
 -5.74166  4.94166
sample estimates:
   mean in group GFP mean in group saline
            10.53333             10.93333


Running t-test for IOX vs saline (variable: RotationTotal)

    Welch Two Sample t-test

data:  RotationTotal by Treatment
t = 3.0266, df = 19.873, p-value = 0.006698
alternative hypothesis: true difference in means between group IOX and group saline is not equal to 0
95 percent confidence interval:
  4.284959 23.315041
sample estimates:
   mean in group IOX mean in group saline
            24.73333             10.93333


Running t-test for uninjected vs saline (variable: RotationTotal)

    Welch Two Sample t-test

data:  RotationTotal by Treatment
t = -4.1807, df = 22.609, p-value = 0.0003698
alternative hypothesis: true difference in means between group saline and group uninjected is not equal to 0
95 percent confidence interval:
 -23.924624  -8.075376
sample estimates:
    mean in group saline mean in group uninjected
                10.93333                 26.93333
#IOX vs saline: t = 3.0266, df = 19.873, p-value = 0.006698 (IOX 24.73333, saline 10.93333)
#GFP vs saline: t = -0.15346, df = 27.705, p-value = 0.8791 (GFP 10.53333, saline 10.93333)
#uninjected vs saline: t = -4.1807, df = 22.609, p-value = 0.0003698 (uninjected 26.93333, saline 10.93333)
for (treatment in treatments_non_parametric_Rotations) {
cat("\nRunning Wilcoxon test for", treatment, "vs saline (variable: RotationTotal)\n")
print(wilcox.test(RotationTotal ~ Treatment, data = RNAi_behavior_2 %>% filter(Treatment %in% c(treatment, "saline"))))
}
Running Wilcoxon test for JHMT vs saline (variable: RotationTotal)
    Wilcoxon rank sum test with continuity correction

data:  RotationTotal by Treatment
W = 152, p-value = 0.1047
alternative hypothesis: true location shift is not equal to 0


Running Wilcoxon test for hexamerin1 vs saline (variable: RotationTotal)
    Wilcoxon rank sum test with continuity correction

data:  RotationTotal by Treatment
W = 119, p-value = 0.8029
alternative hypothesis: true location shift is not equal to 0


Running Wilcoxon test for hexamerin2 vs saline (variable: RotationTotal)
    Wilcoxon rank sum test with continuity correction

data:  RotationTotal by Treatment
W = 156.5, p-value = 0.07065
alternative hypothesis: true location shift is not equal to 0


Running Wilcoxon test for miniature vs saline (variable: RotationTotal)
    Wilcoxon rank sum test with continuity correction

data:  RotationTotal by Treatment
W = 131, p-value = 0.4546
alternative hypothesis: true location shift is not equal to 0
#hex1 vs saline: W = 119, p-value = 0.8029
#hex2 vs saline: W = 156.5, p-value = 0.07065
#JHMT vs saline: W = 152, p-value = 0.1047
#miniature vs saline: W = 131, p-value = 0.4546
shapiro_results_Rotations# A tibble: 8 × 2
Treatment shapiro_p_value
<chr> <dbl>
1 GFP 0.298
2 IOX 0.239
3 JHMT 0.0442
4 hexamerin1 0.00193
5 hexamerin2 0.00913
6 miniature 0.0000473
7 saline 0.0942
8 uninjected 0.979 treatments_parametric_Rotations[1] "GFP" "IOX" "uninjected"#IOX GFP uninjected
treatments_non_parametric_Rotations[1] "JHMT" "hexamerin1" "hexamerin2" "miniature" #hexamerin1 hexamerin2 JHMT miniature1.3. Plots
#### GRAPHS ####
RNAi_behavior_2 <- RNAi_behavior_2 %>%
  mutate(Treatment = factor(Treatment, levels = c("hexamerin1", "hexamerin2", "JHMT", "IOX", "miniature", "GFP", "saline", "uninjected")))


#DISTANCE MOVED
ggplot(RNAi_behavior_2, aes(x = Treatment, y = DistanceMoved, fill = Treatment)) +
  geom_boxplot() +
  labs(title = "Distance Moved by Treatment",
       x = "Treatment",
       y = "Distance Moved (cm)") +
  theme_minimal() +
  scale_fill_manual(values = c("hexamerin1" = "darkgoldenrod1",
                               "hexamerin2" = "firebrick1",
                               "JHMT" = "darkorchid1",
                               "IOX" = "deepskyblue",
                               "miniature" = "hotpink",
                               "GFP" = "springgreen1",
                               "saline" = "sienna",
                               "controlnoinjection" = "snow4")) +
  theme(legend.position = "none",
        plot.title = element_text(hjust = 0.5))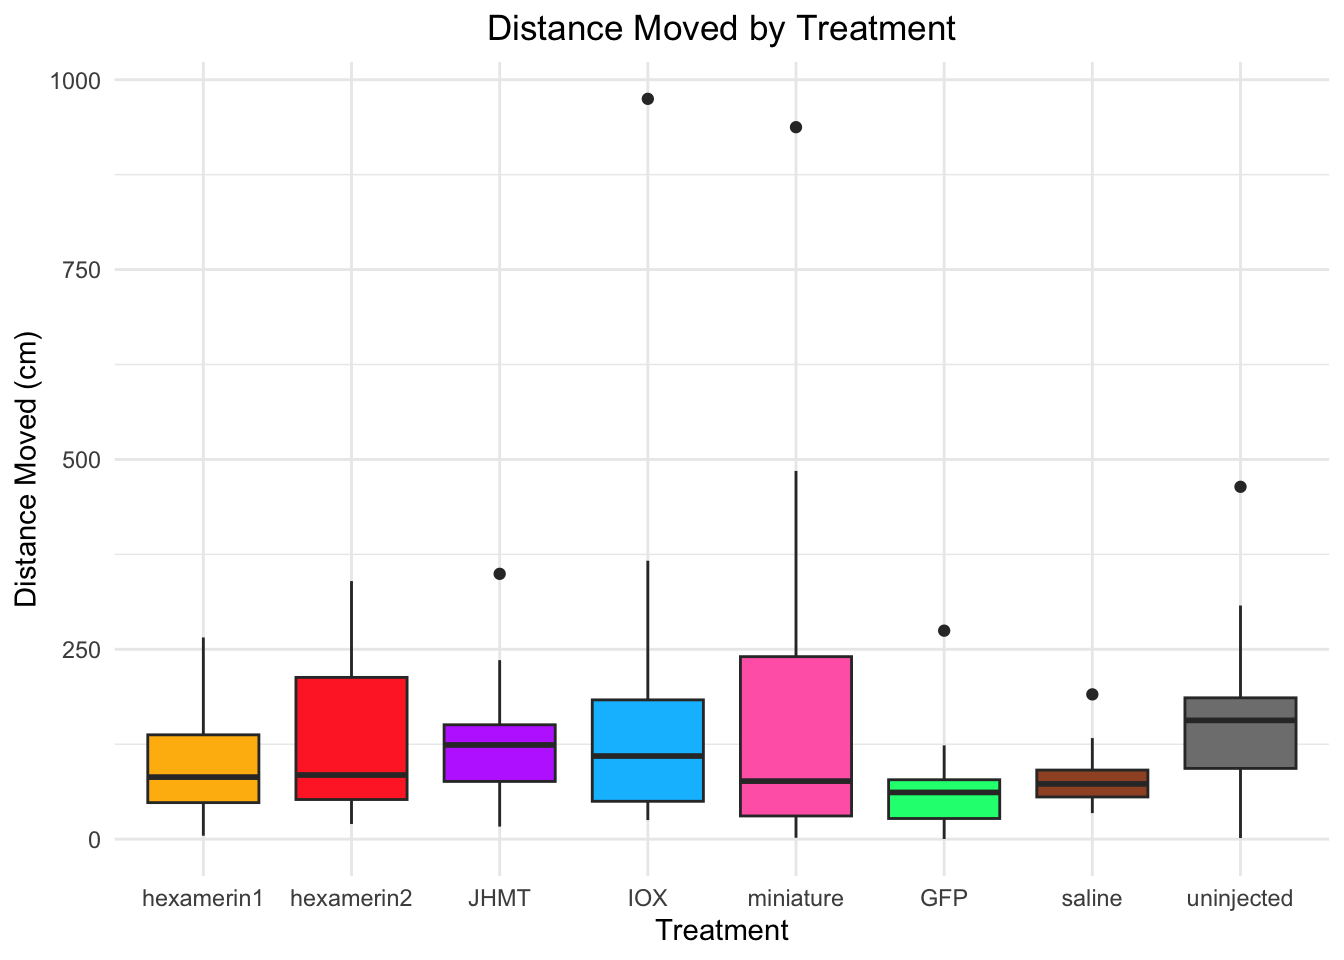
| Version | Author | Date |
|---|---|---|
| a77d8e5 | Maeva TECHER | 2026-02-24 |
#OR:
ggplot(RNAi_behavior_2, aes(x = Treatment, y = DistanceMoved, fill = Treatment)) +
  geom_boxplot() +
  labs(title = "Distance Moved by Treatment",
       x = "Treatment",
       y = "Distance Moved (cm)") +
  theme_minimal() +
  scale_fill_manual(values = c("hexamerin1" = "darkgoldenrod1",
                               "hexamerin2" = "firebrick1",
                               "JHMT" = "darkorchid1",
                               "IOX" = "deepskyblue",
                               "miniature" = "hotpink",
                               "GFP" = "springgreen1",
                               "saline" = "sienna",
                               "controlnoinjection" = "snow4")) +
  coord_cartesian(ylim = c(0, 300)) +
  theme(legend.position = "none",
        plot.title = element_text(hjust = 0.5))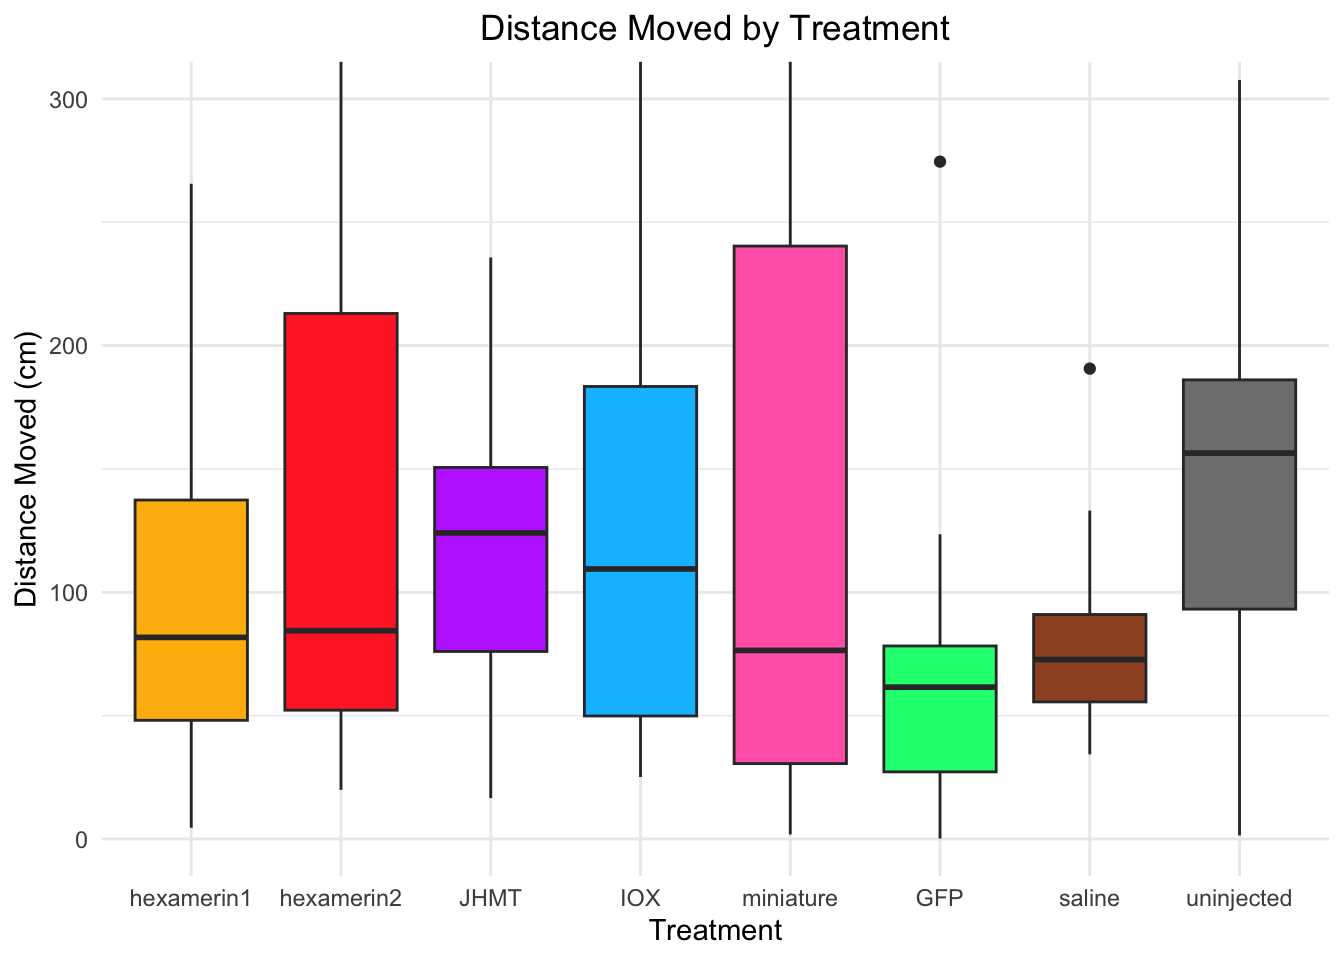
| Version | Author | Date |
|---|---|---|
| a77d8e5 | Maeva TECHER | 2026-02-24 |
#Just checking some values
median(RNAi_behavior_2$DistanceMoved[RNAi_behavior_2$Treatment == "hexamerin1"], na.rm = TRUE)
[1] 81.7244median(RNAi_behavior_2$DistanceMoved[RNAi_behavior_2$Treatment == "uninjected"], na.rm = TRUE)[1] 156.416#TIME SPENT MOVING
ggplot(RNAi_behavior_2, aes(x = Treatment, y = DistanceMoved, fill = Treatment)) +
geom_boxplot() +
labs(title = "Time Spent Moving by Treatment",
x = "Treatment",
y = "Time (s)") +
theme_minimal() +
scale_fill_manual(values = c("hexamerin1" = "darkgoldenrod1",
"hexamerin2" = "firebrick1",
"JHMT" = "darkorchid1",
"IOX" = "deepskyblue",
"miniature" = "hotpink",
"GFP" = "springgreen1",
"saline" = "sienna",
"controlnoinjection" = "snow4")) +
theme(legend.position = "none",
plot.title = element_text(hjust = 0.5))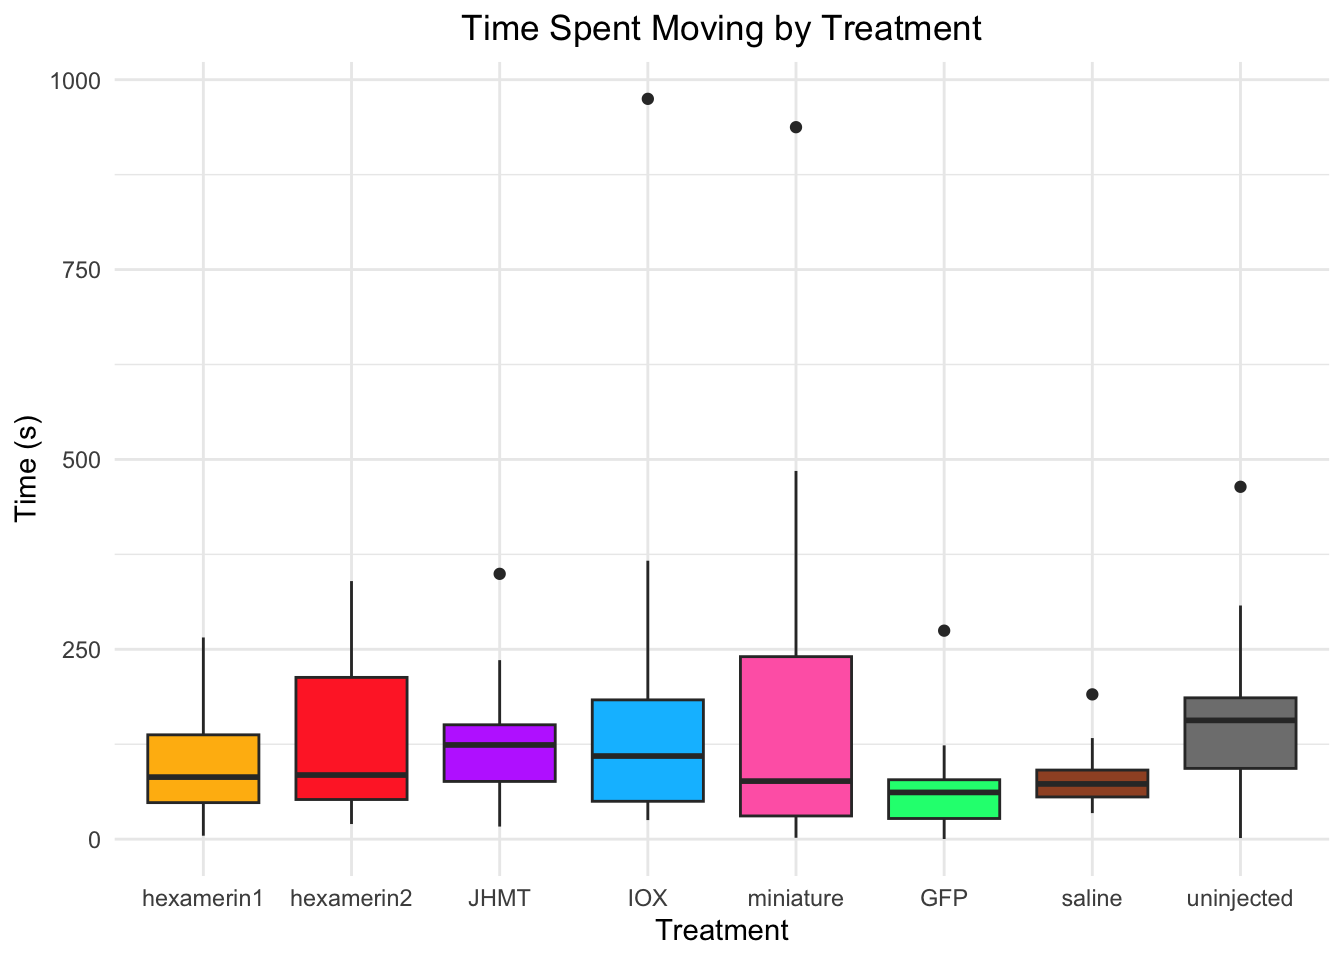
| Version | Author | Date |
|---|---|---|
| a77d8e5 | Maeva TECHER | 2026-02-24 |
#OR

ggplot(RNAi_behavior_2, aes(x = Treatment, y = DistanceMoved, fill = Treatment)) +
  geom_boxplot() +
  labs(title = "Time Spent Moving by Treatment",
       x = "Treatment",
       y = "Time (s)") +
  theme_minimal() +
  scale_fill_manual(values = c("hexamerin1" = "darkgoldenrod1",
                               "hexamerin2" = "firebrick1",
                               "JHMT" = "darkorchid1",
                               "IOX" = "deepskyblue",
                               "miniature" = "hotpink",
                               "GFP" = "springgreen1",
                               "saline" = "sienna",
                               "controlnoinjection" = "snow4")) +
  coord_cartesian(ylim = c(0, 300)) +
  theme(legend.position = "none",
        plot.title = element_text(hjust = 0.5))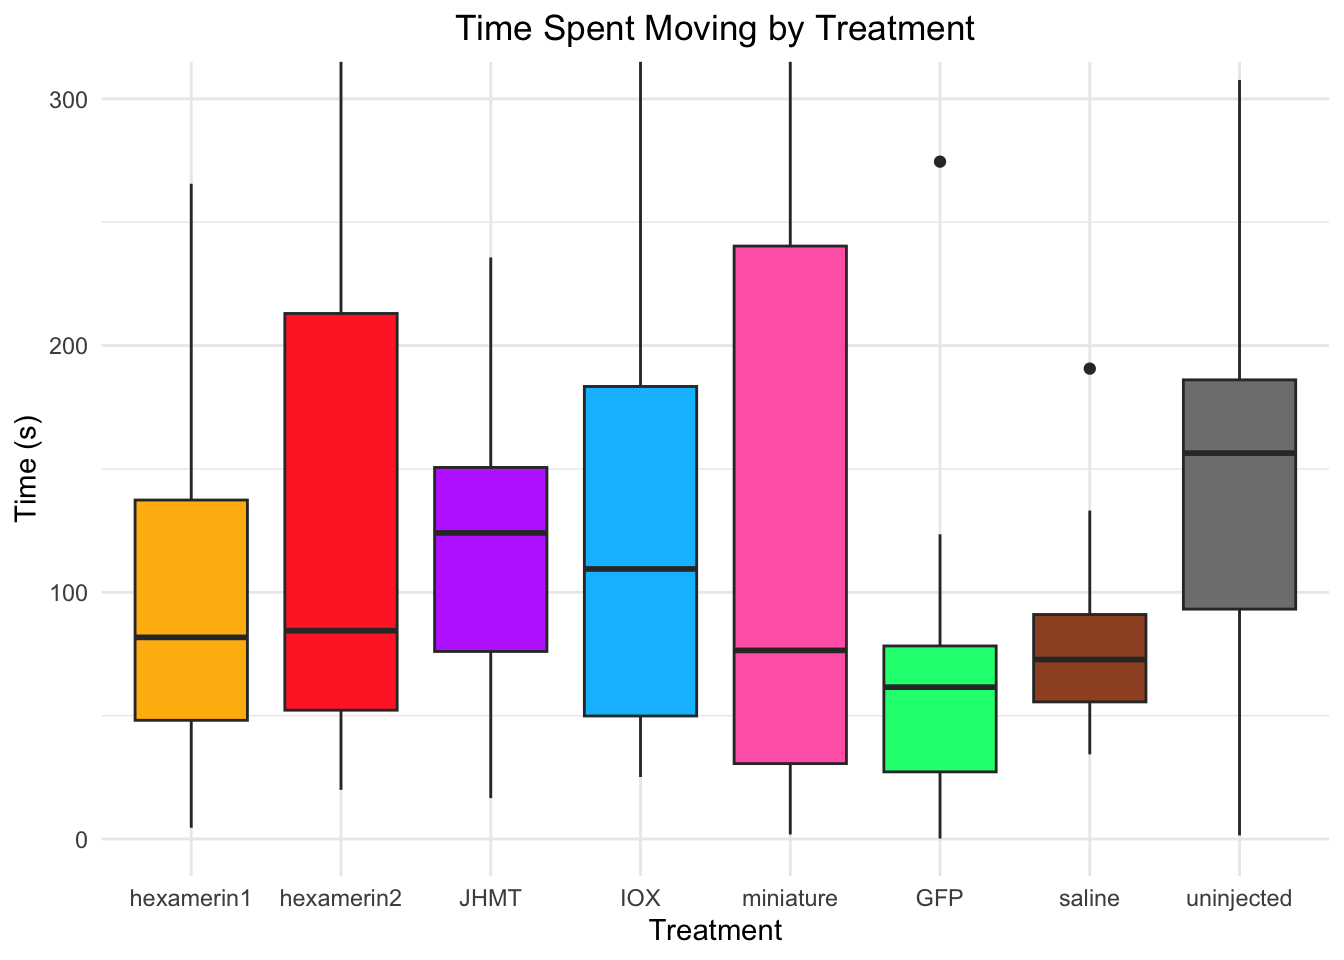
| Version | Author | Date |
|---|---|---|
| a77d8e5 | Maeva TECHER | 2026-02-24 |
#TIME SPENT IN STIMULUS ZONE
ggplot(RNAi_behavior_2, aes(x = Treatment, y = StimulusZone, fill = Treatment)) +
  geom_boxplot() +
  labs(title = "Time Spent in Stimulus Zone by Treatment",
       x = "Treatment",
       y = "Time (s)") +
  theme_minimal() +
  scale_fill_manual(values = c("hexamerin1" = "darkgoldenrod1",
                               "hexamerin2" = "firebrick1",
                               "JHMT" = "darkorchid1",
                               "IOX" = "deepskyblue",
                               "miniature" = "hotpink",
                               "GFP" = "springgreen1",
                               "saline" = "sienna",
                               "controlnoinjection" = "snow4")) +
  coord_cartesian(ylim = c(0, 600)) +
  theme(legend.position = "none",
        plot.title = element_text(hjust = 0.5))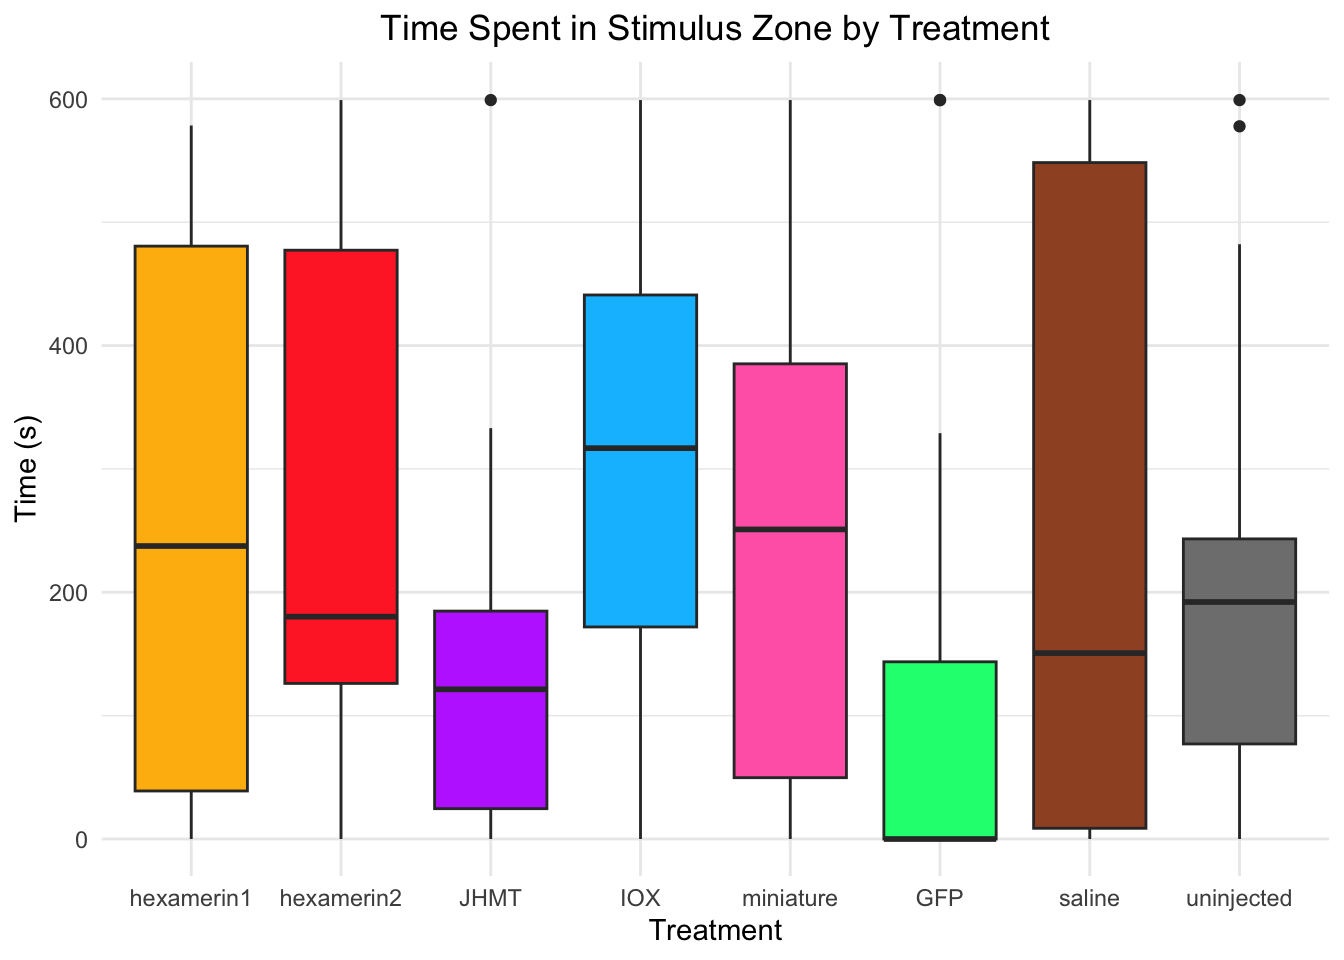
| Version | Author | Date |
|---|---|---|
| a77d8e5 | Maeva TECHER | 2026-02-24 |
#TIME SPENT IN NON-STIMULUS ZONE
ggplot(RNAi_behavior_2, aes(x = Treatment, y = NonStimulusZone, fill = Treatment)) +
  geom_boxplot() +
  labs(title = "Time Spent in Non-Stimulus Zone by Treatment",
       x = "Treatment",
       y = "Time (s)") +
  theme_minimal() +
  scale_fill_manual(values = c("hexamerin1" = "darkgoldenrod1",
                               "hexamerin2" = "firebrick1",
                               "JHMT" = "darkorchid1",
                               "IOX" = "deepskyblue",
                               "miniature" = "hotpink",
                               "GFP" = "springgreen1",
                               "saline" = "sienna",
                               "controlnoinjection" = "snow4")) +
  coord_cartesian(ylim = c(0, 600)) +
  theme(legend.position = "none",
        plot.title = element_text(hjust = 0.5))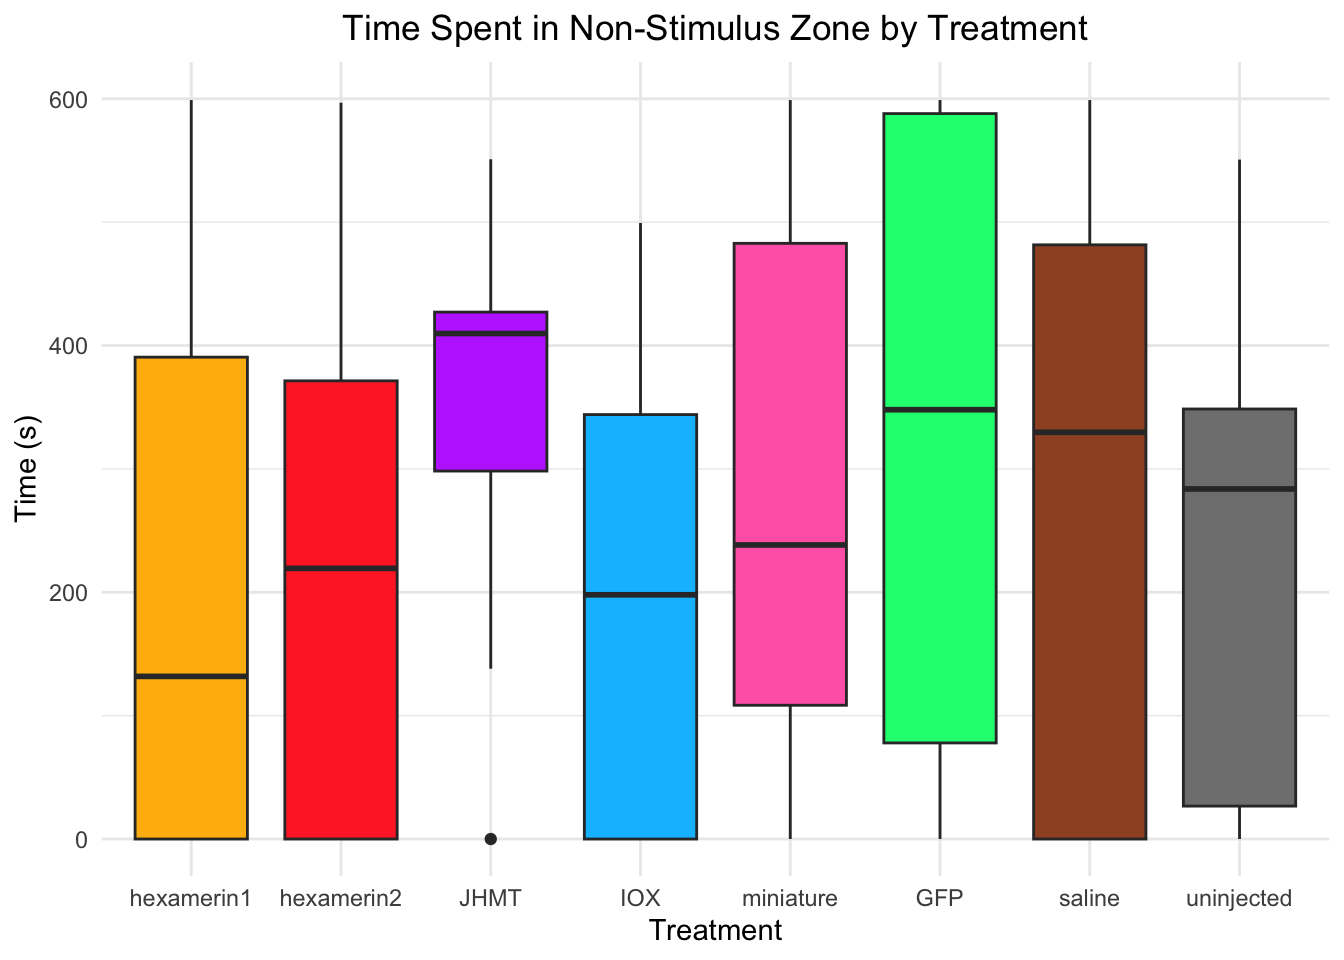
| Version | Author | Date |
|---|---|---|
| a77d8e5 | Maeva TECHER | 2026-02-24 |
#TIME SPENT IN MIDDLE ZONE
ggplot(RNAi_behavior_2, aes(x = Treatment, y = MiddleZone, fill = Treatment)) +
  geom_boxplot() +
  labs(title = "Time Spent in Middle Zone by Treatment",
       x = "Treatment",
       y = "Time (s)") +
  theme_minimal() +
  scale_fill_manual(values = c("hexamerin1" = "darkgoldenrod1",
                               "hexamerin2" = "firebrick1",
                               "JHMT" = "darkorchid1",
                               "IOX" = "deepskyblue",
                               "miniature" = "hotpink",
                               "GFP" = "springgreen1",
                               "saline" = "sienna",
                               "controlnoinjection" = "snow4")) +
  coord_cartesian(ylim = c(0, 600)) +
  theme(legend.position = "none",
        plot.title = element_text(hjust = 0.5))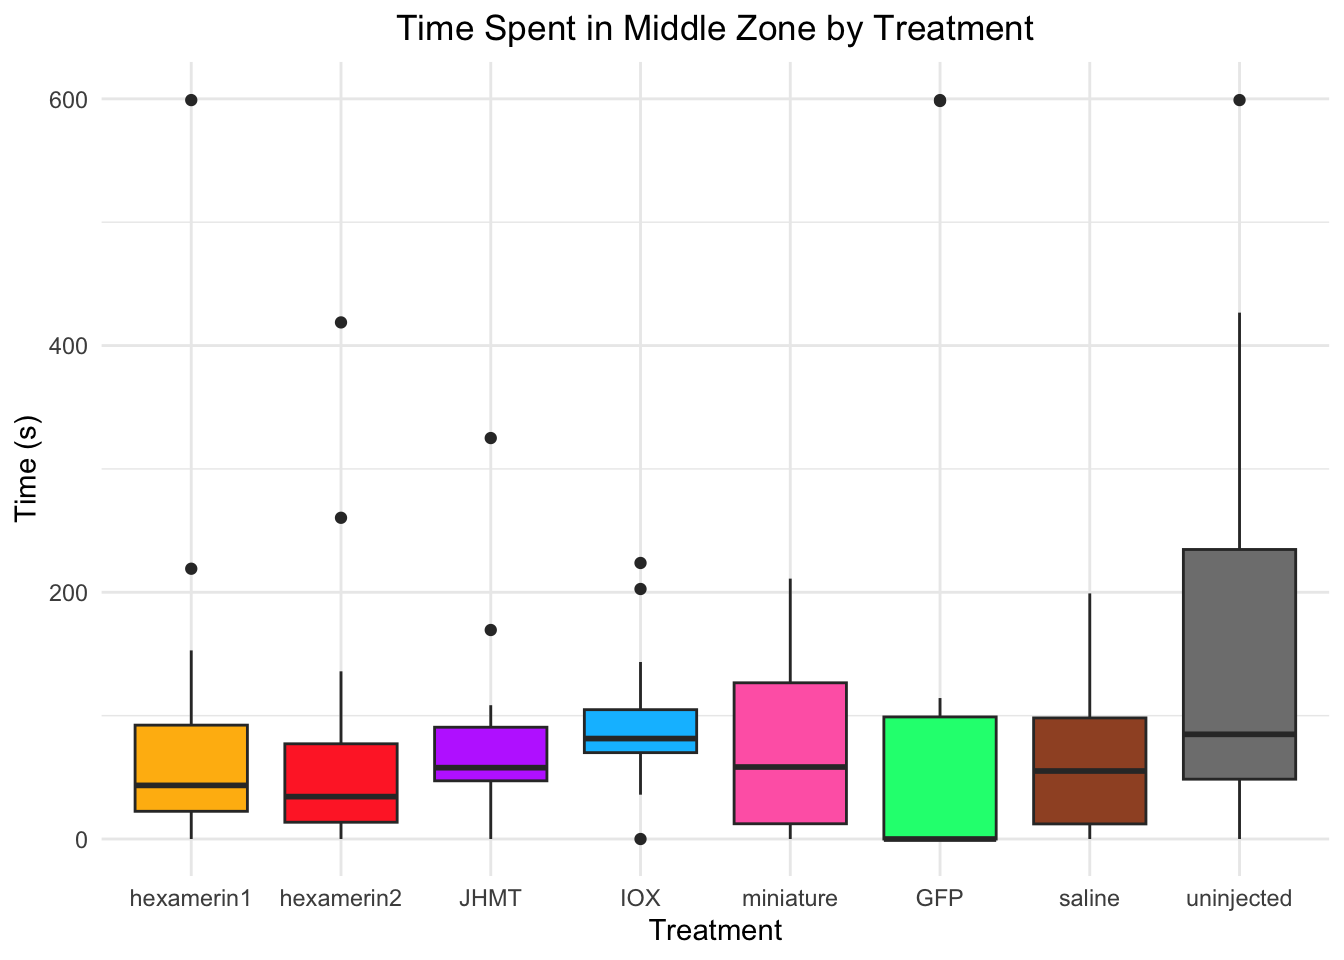
| Version | Author | Date |
|---|---|---|
| a77d8e5 | Maeva TECHER | 2026-02-24 |
#TIME SPENT IN NON-STIMULUS ZONE AND MIDDLE ZONE COMBINED
ggplot(RNAi_behavior_2, aes(x = Treatment, y = NonStimulusZoneAndMiddleZoneCombined, fill = Treatment)) +
  geom_boxplot() +
  labs(title = "Time Spent in Non-Stimulus Zone & Middle Zone Combined by Treatment",
       x = "Treatment",
       y = "Time (s)") +
  theme_minimal() +
  scale_fill_manual(values = c("hexamerin1" = "darkgoldenrod1",
                               "hexamerin2" = "firebrick1",
                               "JHMT" = "darkorchid1",
                               "IOX" = "deepskyblue",
                               "miniature" = "hotpink",
                               "GFP" = "springgreen1",
                               "saline" = "sienna",
                               "controlnoinjection" = "snow4")) +
  coord_cartesian(ylim = c(0, 600)) +
  theme(legend.position = "none",
        plot.title = element_text(hjust = 0.5))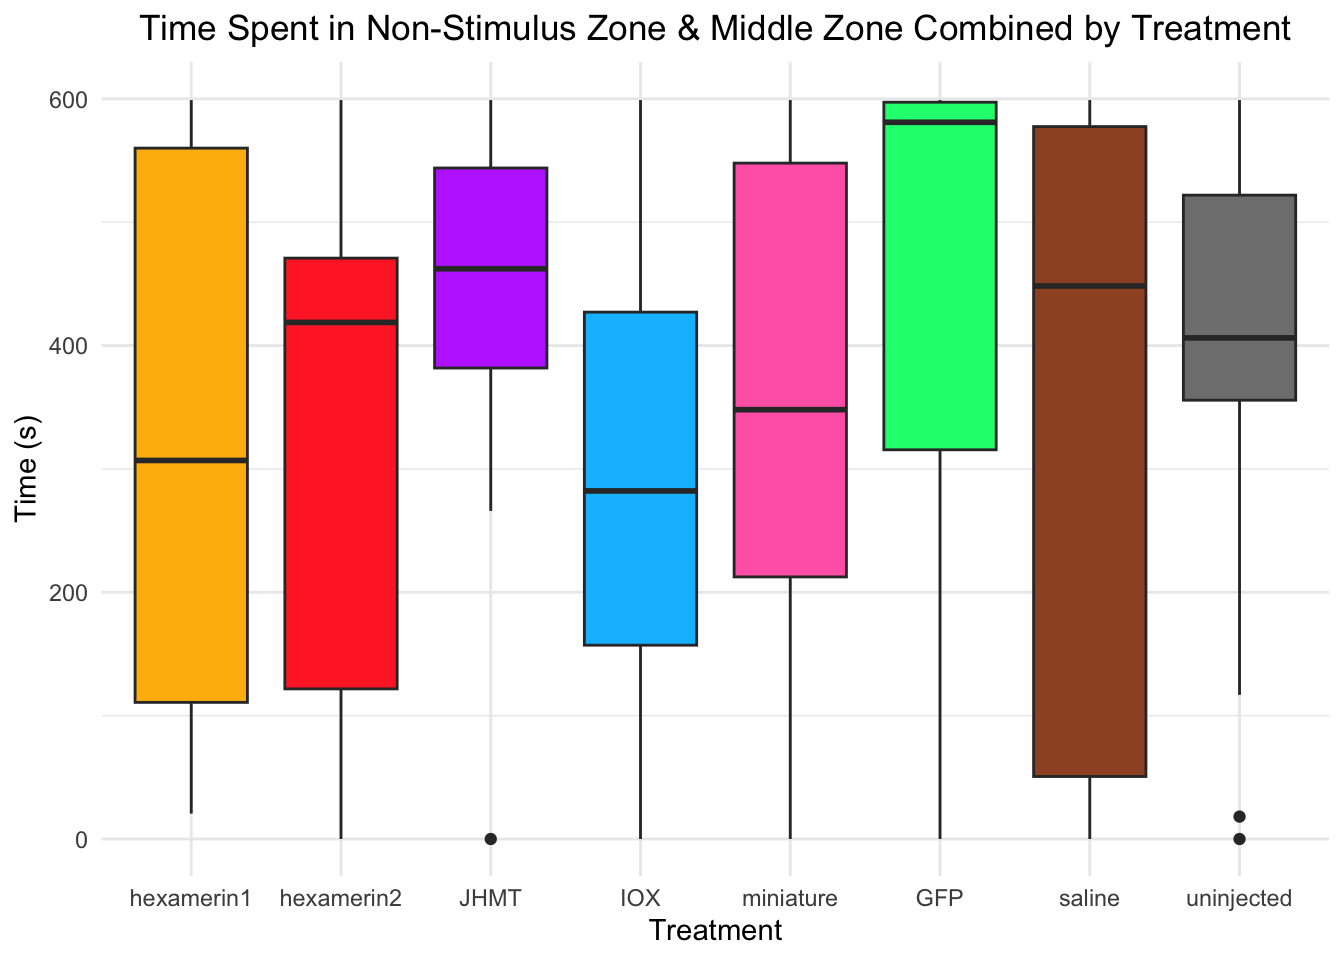
| Version | Author | Date |
|---|---|---|
| a77d8e5 | Maeva TECHER | 2026-02-24 |
#TIME SPENT ON STIMULUS WALL
ggplot(RNAi_behavior_2, aes(x = Treatment, y = StimulusWall, fill = Treatment)) +
  geom_boxplot() +
  labs(title = "Time Spent on Stimulus Wall by Treatment",
       x = "Treatment",
       y = "Time (s)") +
  theme_minimal() +
  scale_fill_manual(values = c("hexamerin1" = "darkgoldenrod1",
                               "hexamerin2" = "firebrick1",
                               "JHMT" = "darkorchid1",
                               "IOX" = "deepskyblue",
                               "miniature" = "hotpink",
                               "GFP" = "springgreen1",
                               "saline" = "sienna",
                               "controlnoinjection" = "snow4")) +
  coord_cartesian(ylim = c(0, 600)) +
  theme(legend.position = "none",
        plot.title = element_text(hjust = 0.5))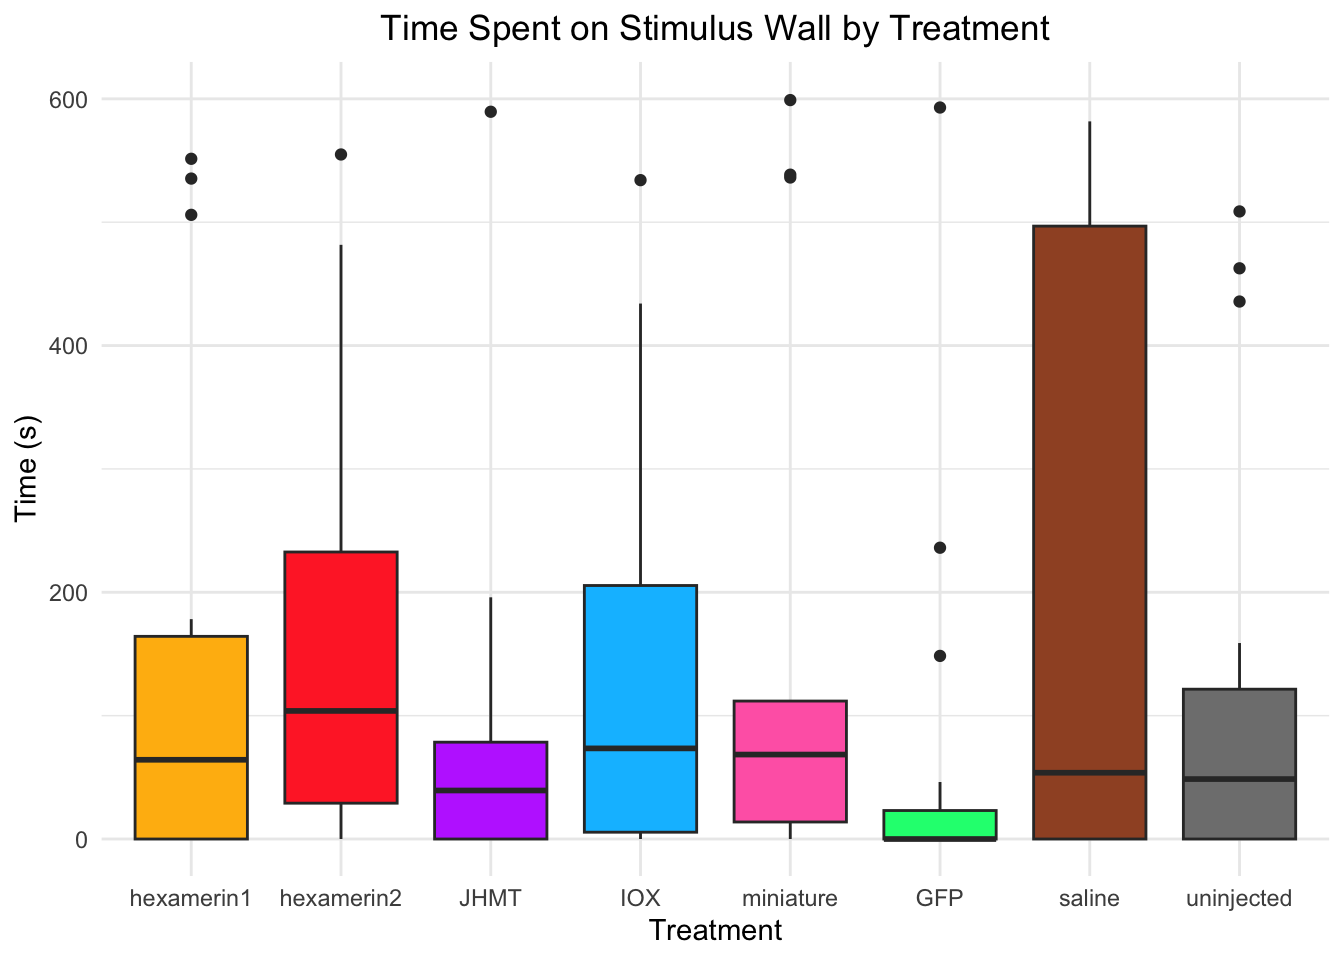
| Version | Author | Date |
|---|---|---|
| a77d8e5 | Maeva TECHER | 2026-02-24 |
#TIME SPENT ON NON-STIMULUS WALL
ggplot(RNAi_behavior_2, aes(x = Treatment, y = NonStimulusWall, fill = Treatment)) +
  geom_boxplot() +
  labs(title = "Time Spent on Non-Stimulus Wall by Treatment",
       x = "Treatment",
       y = "Time (s)") +
  theme_minimal() +
  scale_fill_manual(values = c("hexamerin1" = "darkgoldenrod1",
                               "hexamerin2" = "firebrick1",
                               "JHMT" = "darkorchid1",
                               "IOX" = "deepskyblue",
                               "miniature" = "hotpink",
                               "GFP" = "springgreen1",
                               "saline" = "sienna",
                               "controlnoinjection" = "snow4")) +
  coord_cartesian(ylim = c(0, 600)) +
  theme(legend.position = "none",
        plot.title = element_text(hjust = 0.5))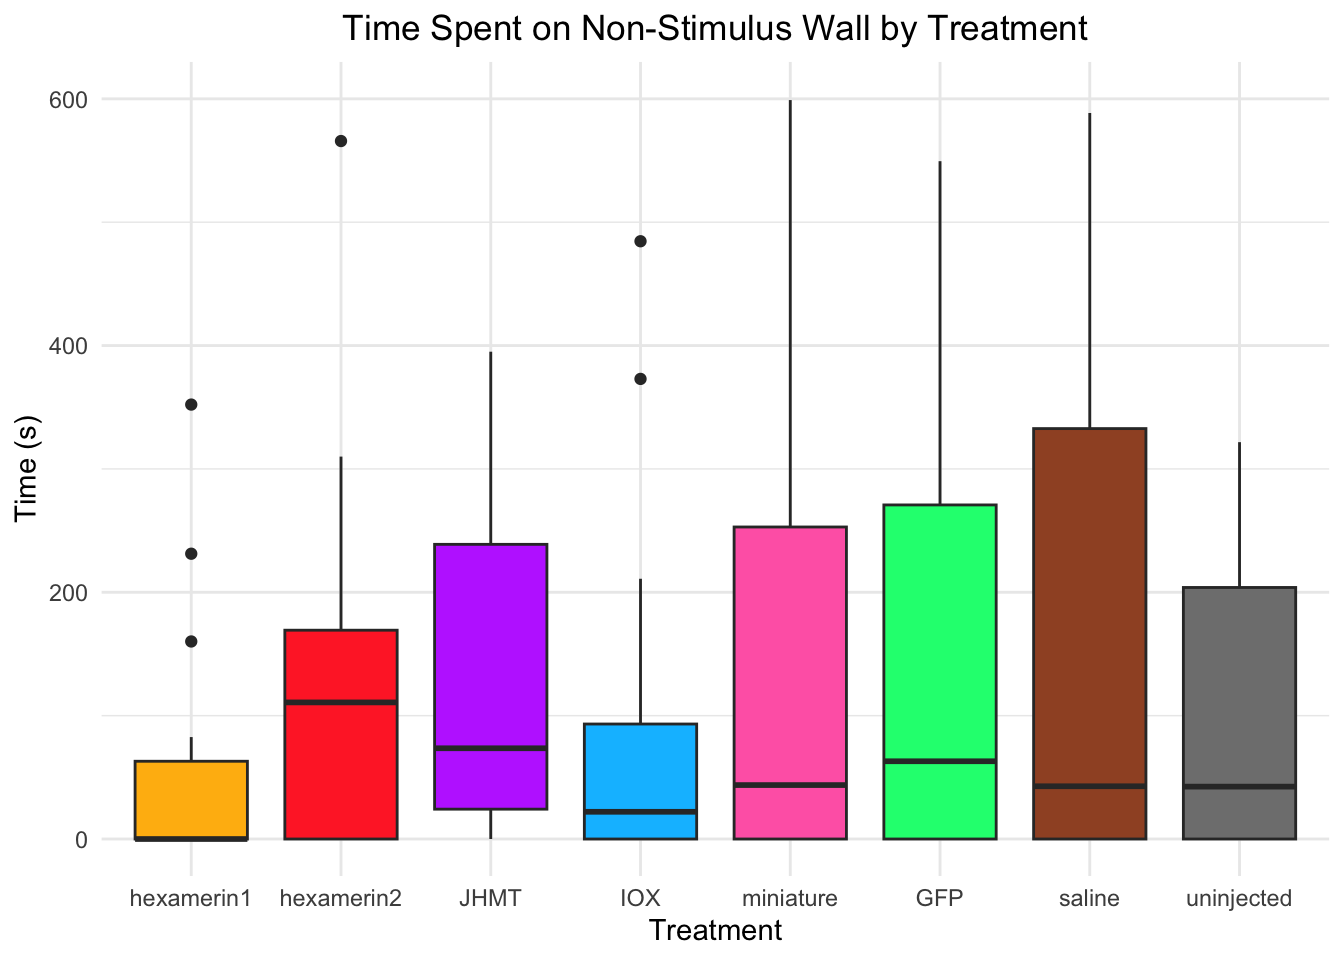
| Version | Author | Date |
|---|---|---|
| a77d8e5 | Maeva TECHER | 2026-02-24 |
#VELOCITY
ggplot(RNAi_behavior_2, aes(x = Treatment, y = VelocityCalculated, fill = Treatment)) +
  geom_boxplot() +
  labs(title = "Velocity by Treatment",
       x = "Treatment",
       y = "Velocity (cm/s)") +
  theme_minimal() +
  scale_fill_manual(values = c("hexamerin1" = "darkgoldenrod1",
                               "hexamerin2" = "firebrick1",
                               "JHMT" = "darkorchid1",
                               "IOX" = "deepskyblue",
                               "miniature" = "hotpink",
                               "GFP" = "springgreen1",
                               "saline" = "sienna",
                               "controlnoinjection" = "snow4")) +
  coord_cartesian(ylim = c(0, 2.5)) +
  theme(legend.position = "none",
        plot.title = element_text(hjust = 0.5))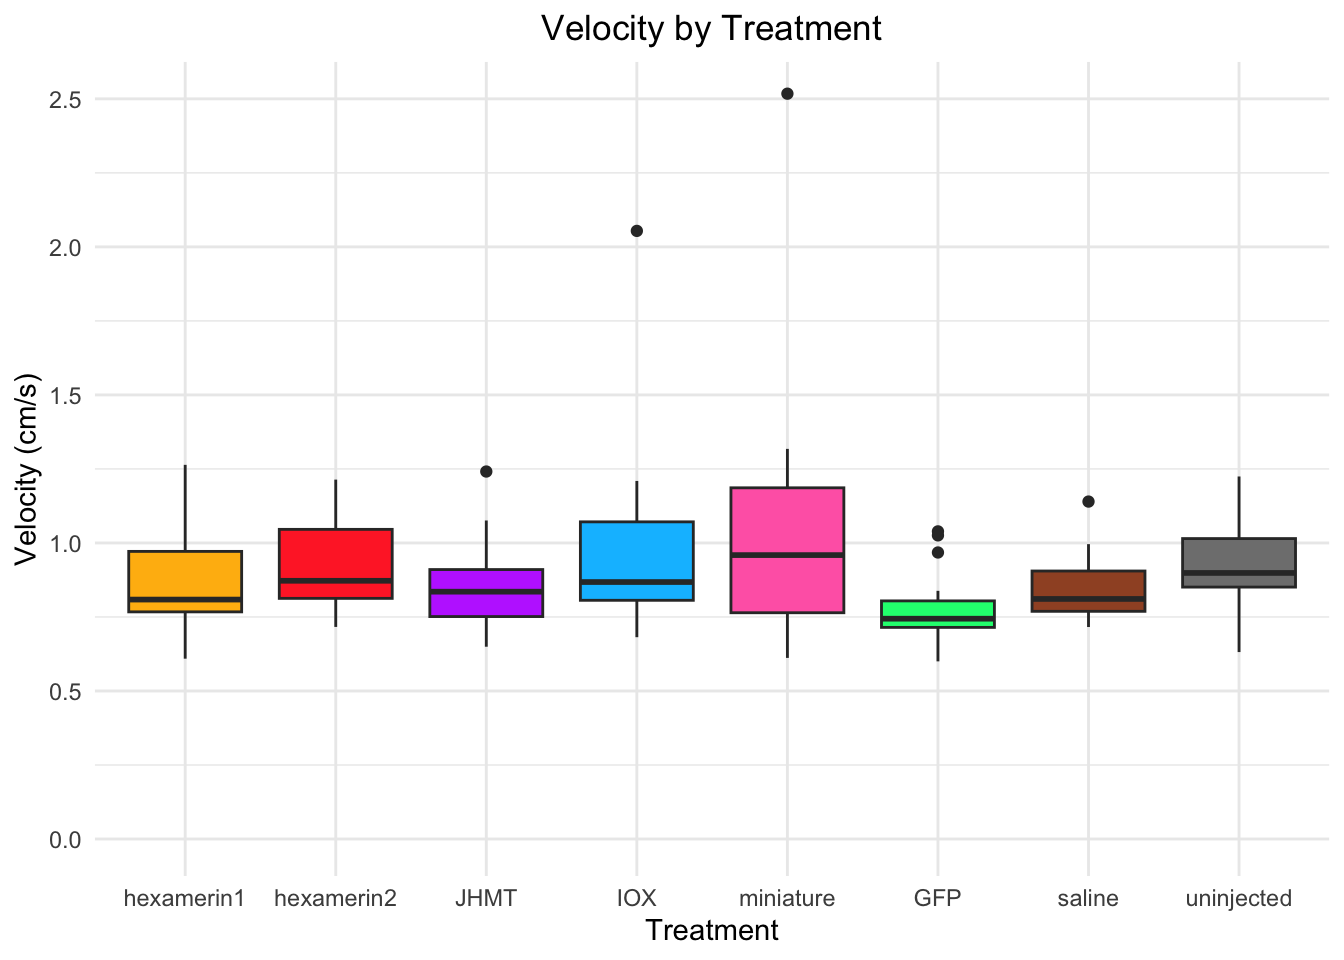
| Version | Author | Date |
|---|---|---|
| a77d8e5 | Maeva TECHER | 2026-02-24 |
#ROTATIONS
ggplot(RNAi_behavior_2, aes(x = Treatment, y = RotationTotal, fill = Treatment)) +
  geom_boxplot() +
  labs(title = "Number of Total Rotations by Treatment",
       x = "Treatment",
       y = "Rotations") +
  theme_minimal() +
  scale_fill_manual(values = c("hexamerin1" = "darkgoldenrod1",
                               "hexamerin2" = "firebrick1",
                               "JHMT" = "darkorchid1",
                               "IOX" = "deepskyblue",
                               "miniature" = "hotpink",
                               "GFP" = "springgreen1",
                               "saline" = "sienna",
                               "controlnoinjection" = "snow4")) +
  coord_cartesian(ylim = c(0, 85)) +
  theme(legend.position = "none",
        plot.title = element_text(hjust = 0.5))
| Version | Author | Date |
|---|---|---|
| a77d8e5 | Maeva TECHER | 2026-02-24 |
Following is the publication graph:
library(dplyr)
library(ggplot2)
library(ggpubr)
library(rstatix)
library(patchwork)

# 1) Factor order + short labels for plotting
RNAi_behavior_2 <- RNAi_behavior_2 %>%
  mutate(
    Treatment = factor(Treatment,
      levels = c("hexamerin1","hexamerin2","JHMT","IOX",
                 "miniature","GFP","saline","uninjected")
    ),
    Treatment_label = factor(
      dplyr::recode(as.character(Treatment),
        "hexamerin1" = "HEX1",
        "hexamerin2" = "HEX2",
        "JHMT"       = "JHMT",
        "IOX"        = "MIOX",
        "miniature"  = "UNCH",
        "GFP"        = "GFP",
        "saline"     = "Saline",
        "uninjected" = "Uninjected"
      ),
      levels = c("HEX1","HEX2","JHMT","MIOX","UNCH","GFP","Saline","Uninjected")
    )
  )

# 2) Colors (controls stand out)
cols <- c(
  "HEX1"       = "gray",
  "HEX2"       = "gray",
  "JHMT"       = "gray",
  "MIOX"       = "gray",
  "UNCH"       = "gray",
  "GFP"        = "springgreen1",
  "Saline"     = "black",
  "Uninjected" = "white"
)

# Helper: stats vs Uninjected (BH-adjusted Wilcoxon), keep only significant
get_sig_vs_uninj <- function(df, yvar) {
  df %>%
    filter(!is.na(.data[[yvar]])) %>%
    wilcox_test(
      as.formula(paste0(yvar, " ~ Treatment_label")),
      ref.group = "Uninjected",
      p.adjust.method = "BH"
    ) %>%
    add_significance("p.adj") %>%
    filter(p.adj.signif != "ns") %>%                 # show only significant
    add_xy_position(x = "Treatment_label", fun = "max", step.increase = 0.18)
}

# 3) Stats for both traits
stat_dist <- get_sig_vs_uninj(RNAi_behavior_2, "DistanceMoved")
stat_time <- get_sig_vs_uninj(RNAi_behavior_2, "TimeMoving")

# 4) Plot 1: Distance moved
ymax_dist <- max(RNAi_behavior_2$DistanceMoved, na.rm = TRUE)

p1 <- ggplot(RNAi_behavior_2,
             aes(Treatment_label, DistanceMoved, fill = Treatment_label)) +
  geom_boxplot(outlier.shape = NA, width = 0.7, color = "black") +
  geom_jitter(width = 0.12, alpha = 0.6, size = 1.6) +
  stat_pvalue_manual(
    stat_dist,
    label = "p.adj.signif",
    tip.length = 0.01,
    bracket.size = 1,
    size = 7
  ) +
  scale_fill_manual(values = cols) +
  coord_cartesian(ylim = c(0, ymax_dist * 1.45)) +
  labs(
    #title = "Distance moved (vs Uninjected)",
    x = NULL,
    y = "Distance moved (cm)"
  ) +
  theme_minimal(base_size = 13) +
  theme(
  legend.position = "none",
  plot.title = element_text(hjust = 0.5, face = "bold"),

  # X axis text (gene labels)
  axis.text.x = element_text(
  size = 14,
  face = "bold",
  angle = 45,
  hjust = 1,
  vjust = 1
),
  axis.title.x = element_blank(),

  # Y axis text
  axis.text.y = element_text(size = 12),

  # Y axis title (bold label, unit normal via expression below)
  axis.title.y = element_text(size = 14, face = "bold"),

  # Remove vertical grid
  panel.grid.major.x = element_blank(),
  panel.grid.minor.x = element_blank(),

  # Make horizontal grid dashed
  panel.grid.major.y = element_line(linetype = "dashed", color = "grey70"),
  panel.grid.minor.y = element_blank()
)

# 5) Plot 2: Time spent moving
ymax_time <- max(RNAi_behavior_2$TimeMoving, na.rm = TRUE)

p2 <- ggplot(RNAi_behavior_2,
             aes(Treatment_label, TimeMoving, fill = Treatment_label)) +
  geom_boxplot(outlier.shape = NA, width = 0.7, color = "black") +
  geom_jitter(width = 0.12, alpha = 0.6, size = 1.6) +
  stat_pvalue_manual(
    stat_time,
    label = "p.adj.signif",
    tip.length = 0.01,
    bracket.size = 1,
    size = 7
  ) +
  scale_fill_manual(values = cols) +
  coord_cartesian(ylim = c(0, ymax_time * 1.45)) +
  labs(
    #title = "Time spent moving (vs Uninjected)",
    x = NULL,
    y = "Time spent moving (s)"
  ) +
  theme_minimal(base_size = 13) +
  theme(
  legend.position = "none",
  plot.title = element_text(hjust = 0.5, face = "bold"),

  # X axis text (gene labels)
  axis.text.x = element_text(
  size = 14,
  face = "bold",
  angle = 45,
  hjust = 1,
  vjust = 1
),
  axis.title.x = element_blank(),

  # Y axis text
  axis.text.y = element_text(size = 12),

  # Y axis title (bold label, unit normal via expression below)
  axis.title.y = element_text(size = 14, face = "bold"),

  # Remove vertical grid
  panel.grid.major.x = element_blank(),
  panel.grid.minor.x = element_blank(),

  # Make horizontal grid dashed
  panel.grid.major.y = element_line(linetype = "dashed", color = "grey70"),
  panel.grid.minor.y = element_blank()
)

# 6) Stack them
p1 / p2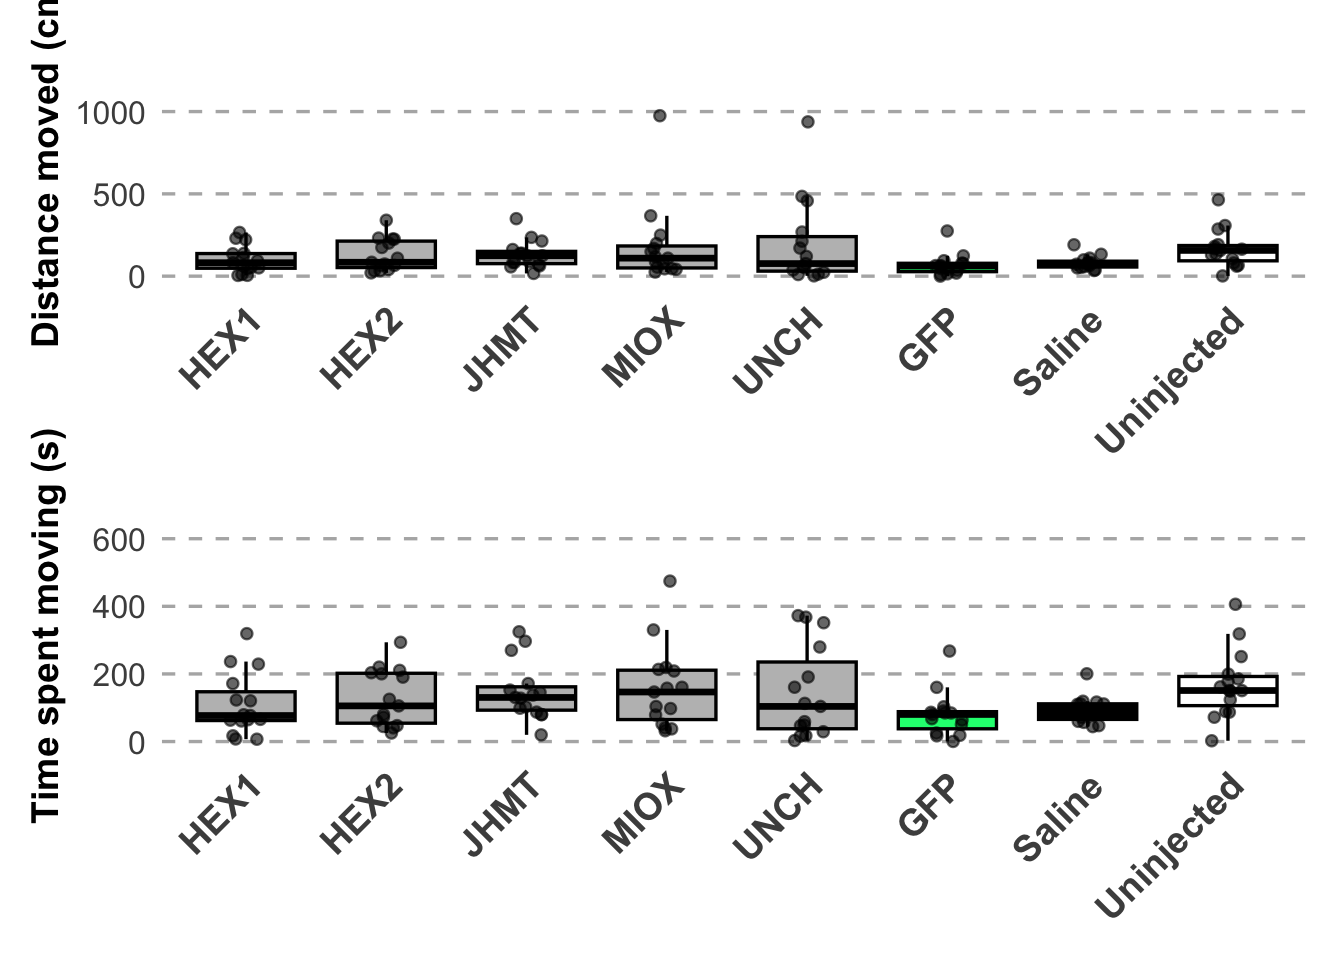
# Helper: BH-adjusted Wilcoxon vs Uninjected for any variable
sig_vs_uninj <- function(df, yvar) {
  df %>%
    filter(!is.na(.data[[yvar]])) %>%
    wilcox_test(
      as.formula(paste0(yvar, " ~ Treatment_label")),
      ref.group = "Uninjected",
      p.adjust.method = "BH"
    ) %>%
    add_significance("p.adj") %>%
    arrange(p.adj)
}

# Distance moved
dist_sig <- sig_vs_uninj(RNAi_behavior_2, "DistanceMoved") %>%
  select(group1, group2, p, p.adj, p.adj.signif)

dist_sig
# A tibble: 7 × 5
group1 group2 p p.adj p.adj.signif
<chr> <chr> <dbl> <dbl> <chr>
1 Uninjected GFP 0.002 0.012 *
2 Uninjected Saline 0.008 0.026 *
3 Uninjected HEX1 0.089 0.208 ns
4 Uninjected HEX2 0.412 0.436 ns
5 Uninjected JHMT 0.345 0.436 ns
6 Uninjected MIOX 0.436 0.436 ns
7 Uninjected UNCH 0.436 0.436 ns # Time spent moving
time_sig <- sig_vs_uninj(RNAi_behavior_2, "TimeMoving") %>%
select(group1, group2, p, p.adj, p.adj.signif)
time_sig# A tibble: 7 × 5
group1 group2 p p.adj p.adj.signif
<chr> <chr> <dbl> <dbl> <chr>
1 Uninjected GFP 0.003 0.022 *
2 Uninjected Saline 0.009 0.03 *
3 Uninjected HEX1 0.056 0.13 ns
4 Uninjected HEX2 0.345 0.483 ns
5 Uninjected UNCH 0.345 0.483 ns
6 Uninjected JHMT 0.431 0.503 ns
7 Uninjected MIOX 0.624 0.624 ns
sessionInfo()R version 4.4.2 (2024-10-31)
Platform: aarch64-apple-darwin20
Running under: macOS Sequoia 15.7.4
Matrix products: default
BLAS: /Library/Frameworks/R.framework/Versions/4.4-arm64/Resources/lib/libRblas.0.dylib
LAPACK: /Library/Frameworks/R.framework/Versions/4.4-arm64/Resources/lib/libRlapack.dylib; LAPACK version 3.12.0
locale:
[1] en_US.UTF-8/en_US.UTF-8/en_US.UTF-8/C/en_US.UTF-8/en_US.UTF-8
time zone: Asia/Tokyo
tzcode source: internal
attached base packages:
[1] stats graphics grDevices utils datasets methods base
other attached packages:
[1] patchwork_1.3.2 rstatix_0.7.3 car_3.1-3 carData_3.0-5
[5] plotrix_3.8-13 ggraptR_1.3 shiny_1.12.1 pacman_0.5.1
[9] AICcmodavg_2.3-4 broom_1.0.12 lubridate_1.9.4 forcats_1.0.1
[13] stringr_1.6.0 dplyr_1.1.4 purrr_1.2.1 readr_2.1.6
[17] tidyr_1.3.2 tibble_3.3.1 tidyverse_2.0.0 ggpubr_0.6.2
[21] ggplot2_4.0.2
loaded via a namespace (and not attached):
[1] gtable_0.3.6 xfun_0.56 bslib_0.9.0 lattice_0.22-7
[5] tzdb_0.5.0 vctrs_0.7.0 tools_4.4.2 generics_0.1.4
[9] parallel_4.4.2 stats4_4.4.2 pkgconfig_2.0.3 Matrix_1.7-4
[13] RColorBrewer_1.1-3 S7_0.2.1 lifecycle_1.0.5 compiler_4.4.2
[17] farver_2.1.2 git2r_0.36.2 httpuv_1.6.16 htmltools_0.5.9
[21] sass_0.4.10 yaml_2.3.12 Formula_1.2-5 later_1.4.5
[25] pillar_1.11.1 jquerylib_0.1.4 whisker_0.4.1 MASS_7.3-65
[29] cachem_1.1.0 abind_1.4-8 mime_0.13 nlme_3.1-168
[33] tidyselect_1.2.1 digest_0.6.39 stringi_1.8.7 labeling_0.4.3
[37] splines_4.4.2 rprojroot_2.1.1 fastmap_1.2.0 grid_4.4.2
[41] cli_3.6.5 magrittr_2.0.4 utf8_1.2.6 survival_3.8-6
[45] dichromat_2.0-0.1 withr_3.0.2 scales_1.4.0 promises_1.5.0
[49] backports_1.5.0 unmarked_1.5.1 timechange_0.3.0 rmarkdown_2.30
[53] otel_0.2.0 ggsignif_0.6.4 workflowr_1.7.2 hms_1.1.4
[57] VGAM_1.1-14 evaluate_1.0.5 knitr_1.51 rlang_1.1.7
[61] Rcpp_1.1.1 xtable_1.8-4 glue_1.8.0 rstudioapi_0.18.0
[65] jsonlite_2.0.0 R6_2.6.1 fs_1.6.6