Deng et al. Logistic SuSiE GSEA
karltayeb
2022-04-03
Last updated: 2022-04-13
Checks: 7 0
Knit directory: logistic-susie-gsea/
This reproducible R Markdown analysis was created with workflowr (version 1.7.0). The Checks tab describes the reproducibility checks that were applied when the results were created. The Past versions tab lists the development history.
Great! Since the R Markdown file has been committed to the Git repository, you know the exact version of the code that produced these results.
Great job! The global environment was empty. Objects defined in the global environment can affect the analysis in your R Markdown file in unknown ways. For reproduciblity it’s best to always run the code in an empty environment.
The command set.seed(20220105) was run prior to running the code in the R Markdown file. Setting a seed ensures that any results that rely on randomness, e.g. subsampling or permutations, are reproducible.
Great job! Recording the operating system, R version, and package versions is critical for reproducibility.
Nice! There were no cached chunks for this analysis, so you can be confident that you successfully produced the results during this run.
Great job! Using relative paths to the files within your workflowr project makes it easier to run your code on other machines.
Great! You are using Git for version control. Tracking code development and connecting the code version to the results is critical for reproducibility.
The results in this page were generated with repository version 862ad9b. See the Past versions tab to see a history of the changes made to the R Markdown and HTML files.
Note that you need to be careful to ensure that all relevant files for the analysis have been committed to Git prior to generating the results (you can use wflow_publish or wflow_git_commit). workflowr only checks the R Markdown file, but you know if there are other scripts or data files that it depends on. Below is the status of the Git repository when the results were generated:
Ignored files:
    Ignored:    .DS_Store
    Ignored:    .RData
    Ignored:    .Rhistory
    Ignored:    .Rproj.user/
    Ignored:    analysis/figure/
    Ignored:    library/
    Ignored:    renv/library/
    Ignored:    renv/staging/
    Ignored:    staging/

Untracked files:
    Untracked:  .ipynb_checkpoints/
    Untracked:  Untitled.ipynb
    Untracked:  _targets.R
    Untracked:  _targets.html
    Untracked:  _targets.md
    Untracked:  _targets/
    Untracked:  _targets_r/
    Untracked:  analysis/de_droplet_noshrink.Rmd
    Untracked:  analysis/de_droplet_noshrink_logistic_susie.Rmd
    Untracked:  analysis/fetal_reference_cellid_gsea.Rmd
    Untracked:  analysis/fixed_intercept.Rmd
    Untracked:  analysis/iDEA_examples.Rmd
    Untracked:  analysis/latent_gene_list.Rmd
    Untracked:  analysis/libra_setup.Rmd
    Untracked:  analysis/linear_method_failure_modes.Rmd
    Untracked:  analysis/linear_regression_failure_regime.Rmd
    Untracked:  analysis/logistic_susie_veb_boost_vs_vb.Rmd
    Untracked:  analysis/logistic_susie_vis.Rmd
    Untracked:  analysis/references.bib
    Untracked:  analysis/scale_v_standardize_v_raw.Rmd
    Untracked:  analysis/simulations.Rmd
    Untracked:  analysis/test.Rmd
    Untracked:  baboon_diet_cache/
    Untracked:  build_site.R
    Untracked:  cache/
    Untracked:  code/html_tables.R
    Untracked:  code/latent_logistic_susie.R
    Untracked:  code/load_data.R
    Untracked:  code/logistic_susie_data_driver.R
    Untracked:  code/marginal_sumstat_gsea_collapsed.R
    Untracked:  code/sumstat_gsea.py
    Untracked:  code/susie_gsea_queries.R
    Untracked:  data/adipose_2yr_topsnp.txt
    Untracked:  data/de-droplet/
    Untracked:  data/deng/
    Untracked:  data/fetal_reference_cellid_gene_sets.RData
    Untracked:  data/human_chimp_eb/
    Untracked:  data/pbmc-purified/
    Untracked:  data/wenhe_baboon_diet/
    Untracked:  deng_example_cache/
    Untracked:  docs.zip
    Untracked:  export/
    Untracked:  human_chimp_eb_de_example_cache/
    Untracked:  index.md
    Untracked:  latent_logistic_susie_cache/
    Untracked:  simulation_targets/
    Untracked:  single_cell_pbmc_cache/
    Untracked:  single_cell_pbmc_l1_cache/
    Untracked:  summary_stat_gsea_exploration_cache/
    Untracked:  summary_stat_gsea_sim_cache/

Unstaged changes:
    Modified:   _simulation_targets.R
    Modified:   _targets.Rmd
    Modified:   analysis/alpha_for_single_cell.Rmd
    Modified:   analysis/baboon_diet.Rmd
    Modified:   analysis/gseabenchmark_tcga.Rmd
    Modified:   analysis/human_chimp_eb_de_example.Rmd
    Modified:   analysis/single_cell_pbmc.Rmd
    Modified:   analysis/single_cell_pbmc_l1.Rmd
    Deleted:    analysis/summary_stat_gsea_univariate_simulations.Rmd
    Modified:   code/enrichment_pipeline.R
    Modified:   code/fit_baselines.R
    Modified:   code/fit_logistic_susie.R
    Modified:   code/fit_mr_ash.R
    Modified:   code/fit_susie.R
    Modified:   code/load_gene_sets.R
    Modified:   code/logistic_susie_vb.R
    Modified:   code/marginal_sumstat_gsea.R
    Modified:   code/simulate_gene_lists.R
    Modified:   target_components/factories.R
    Modified:   target_components/methods.R
Note that any generated files, e.g. HTML, png, CSS, etc., are not included in this status report because it is ok for generated content to have uncommitted changes.
These are the previous versions of the repository in which changes were made to the R Markdown (analysis/deng_example.Rmd) and HTML (docs/deng_example.html) files. If you’ve configured a remote Git repository (see ?wflow_git_remote), click on the hyperlinks in the table below to view the files as they were in that past version.
| File | Version | Author | Date | Message |
|---|---|---|---|---|
| Rmd | 862ad9b | karltayeb | 2022-04-13 | wflow_publish(“analysis/deng_example.Rmd”) |
| html | 72fad28 | karltayeb | 2022-04-09 | Build site. |
| Rmd | 419aadc | karltayeb | 2022-04-09 | wflow_publish(“analysis/deng_example.Rmd”) |
Overview
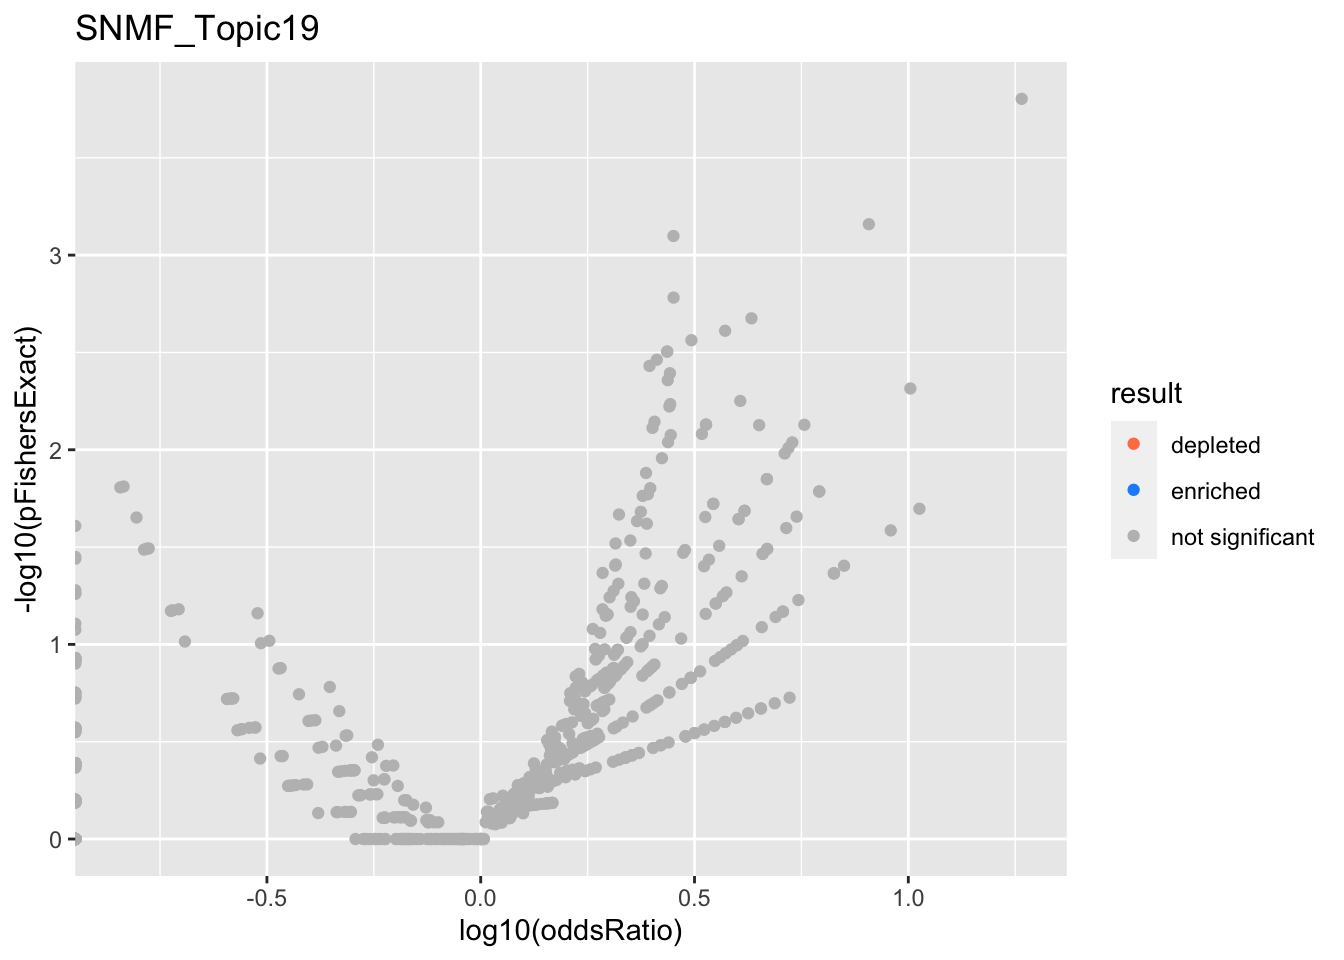
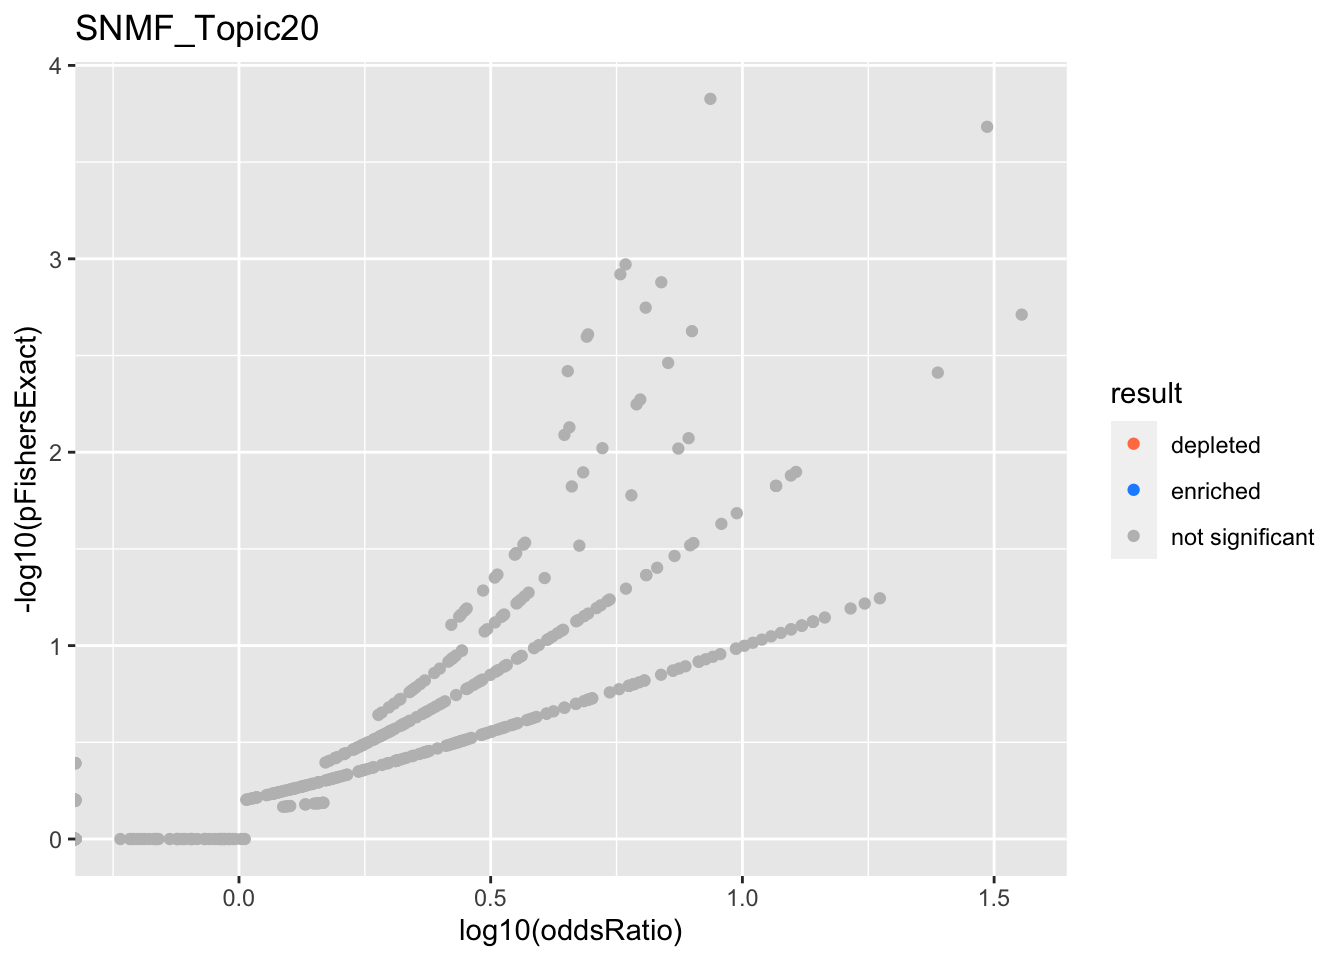
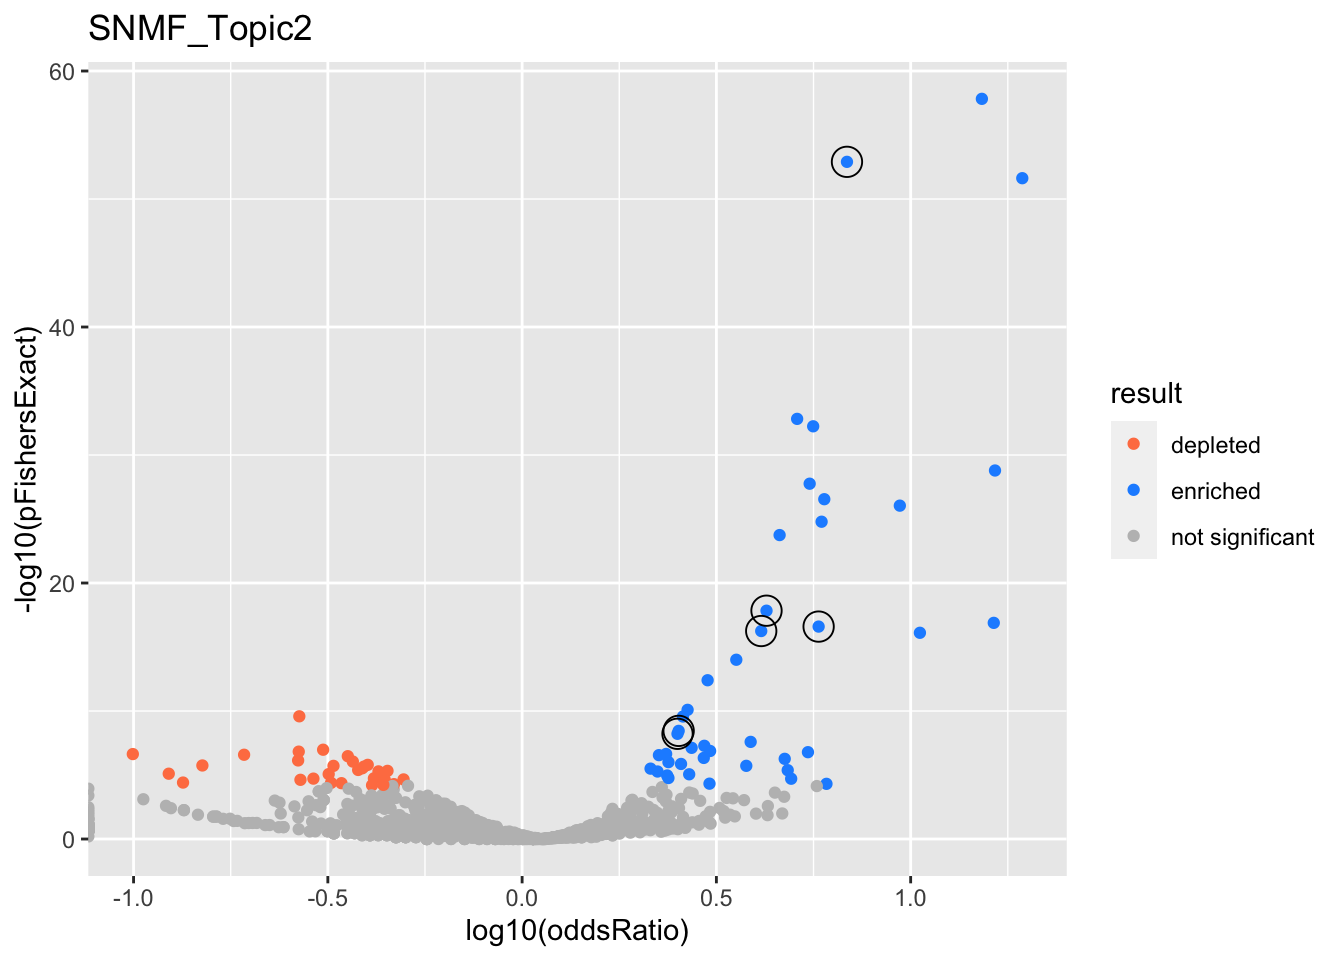
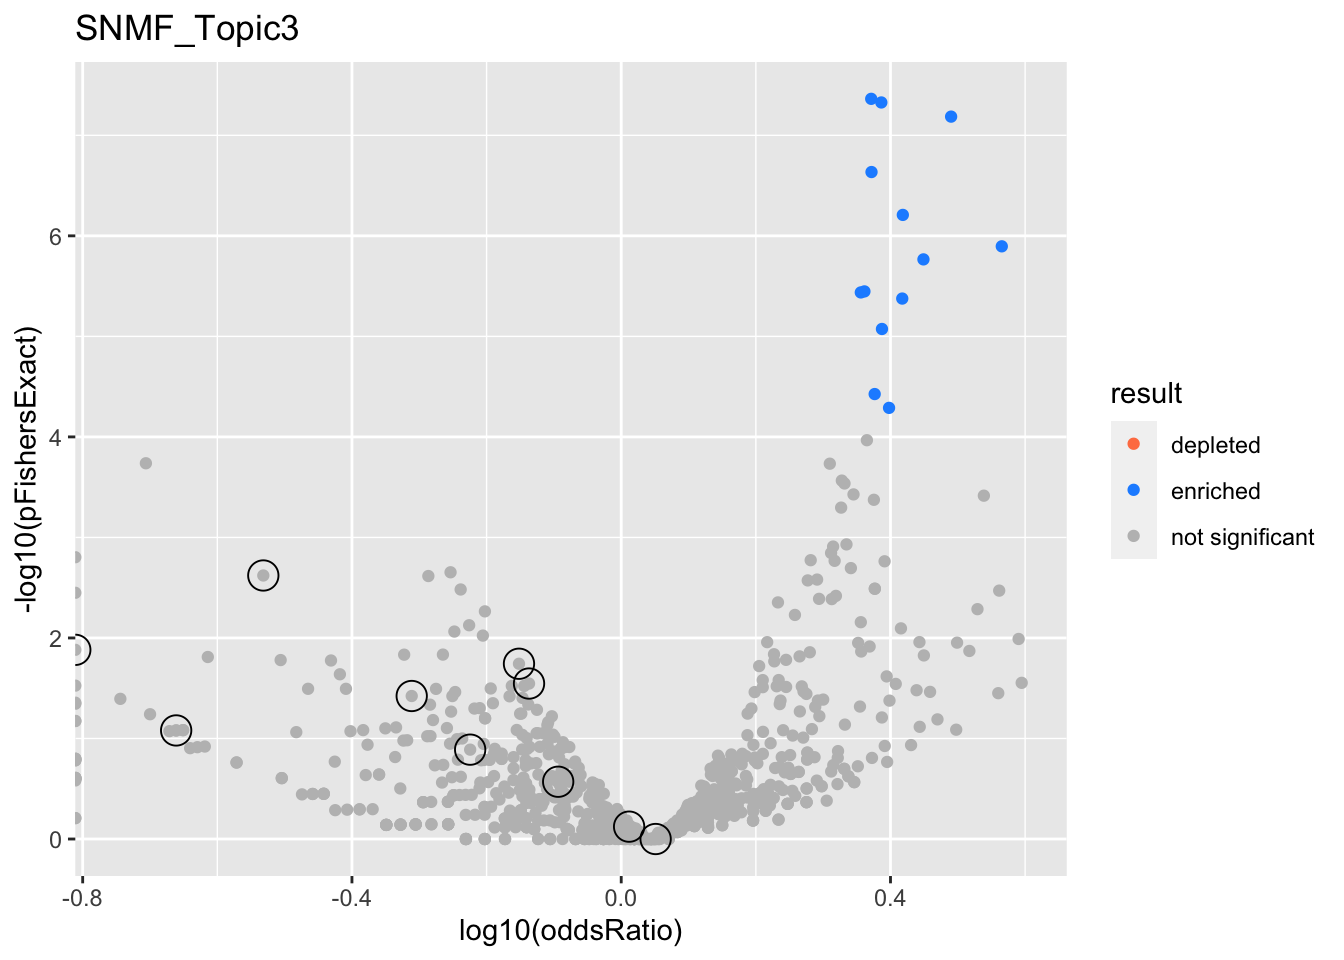
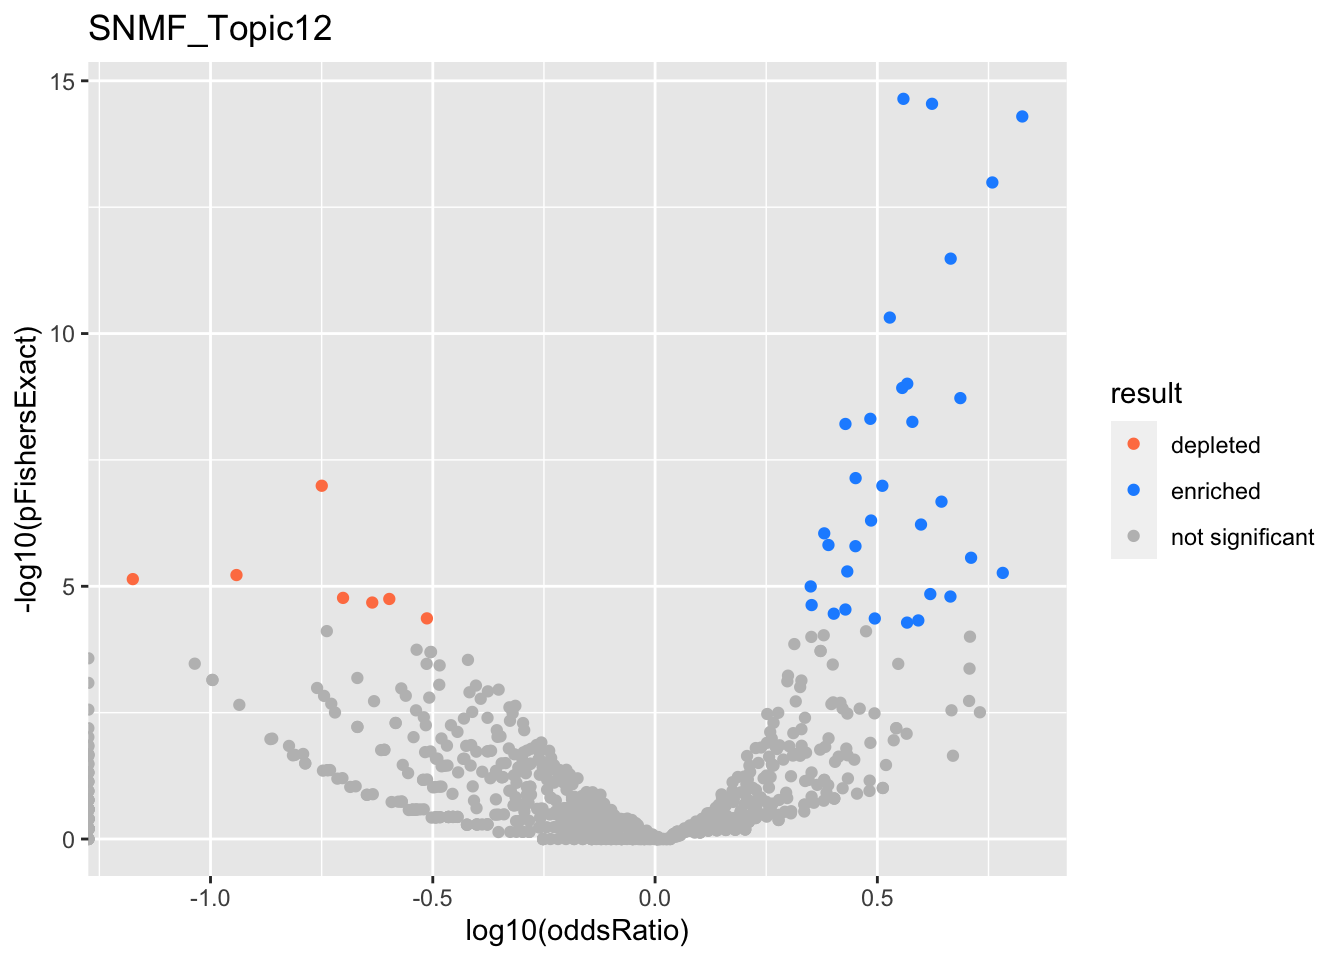
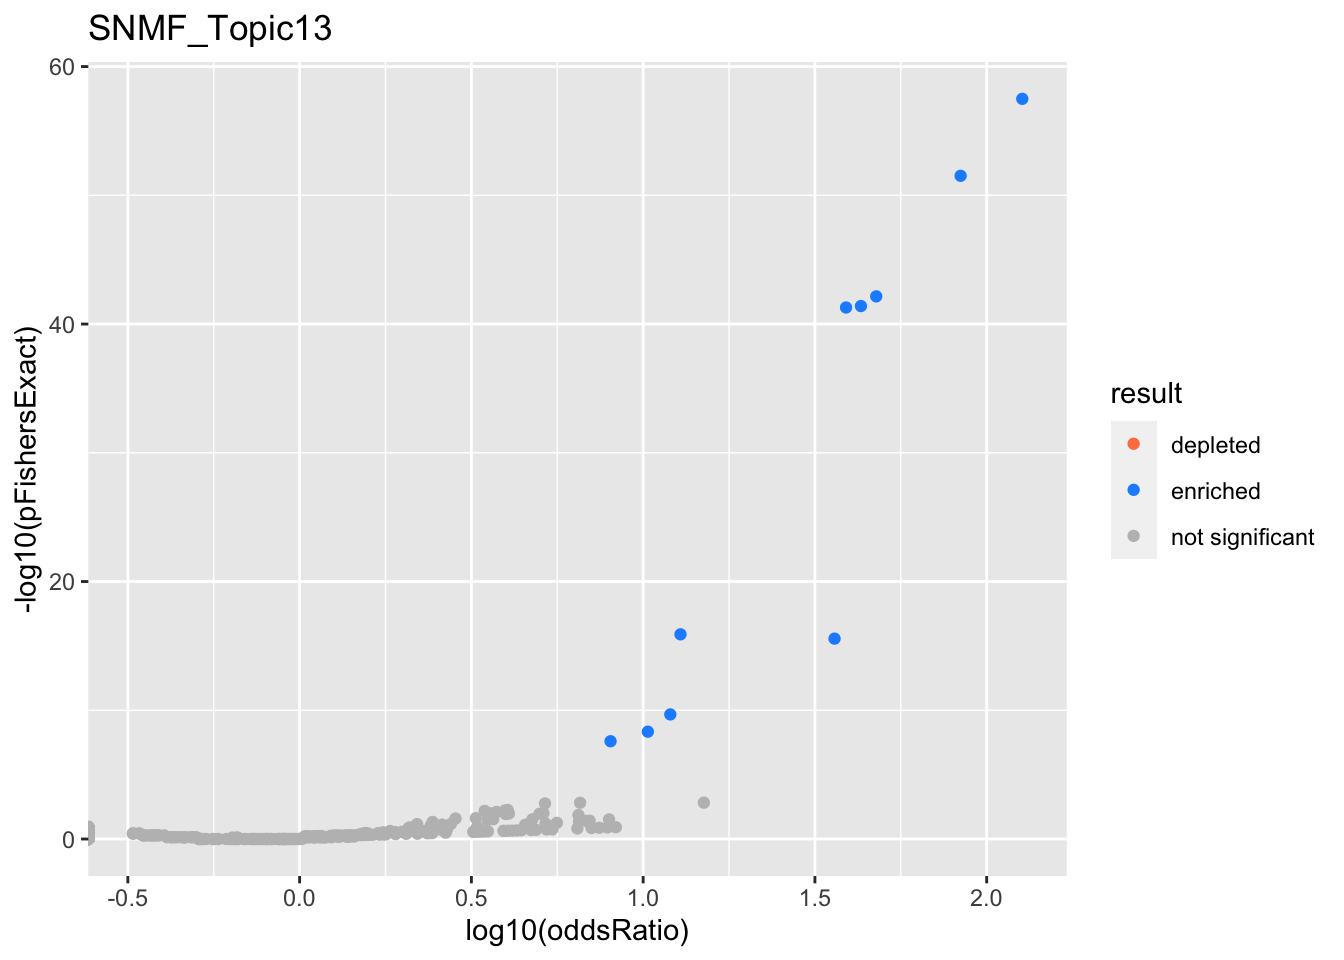
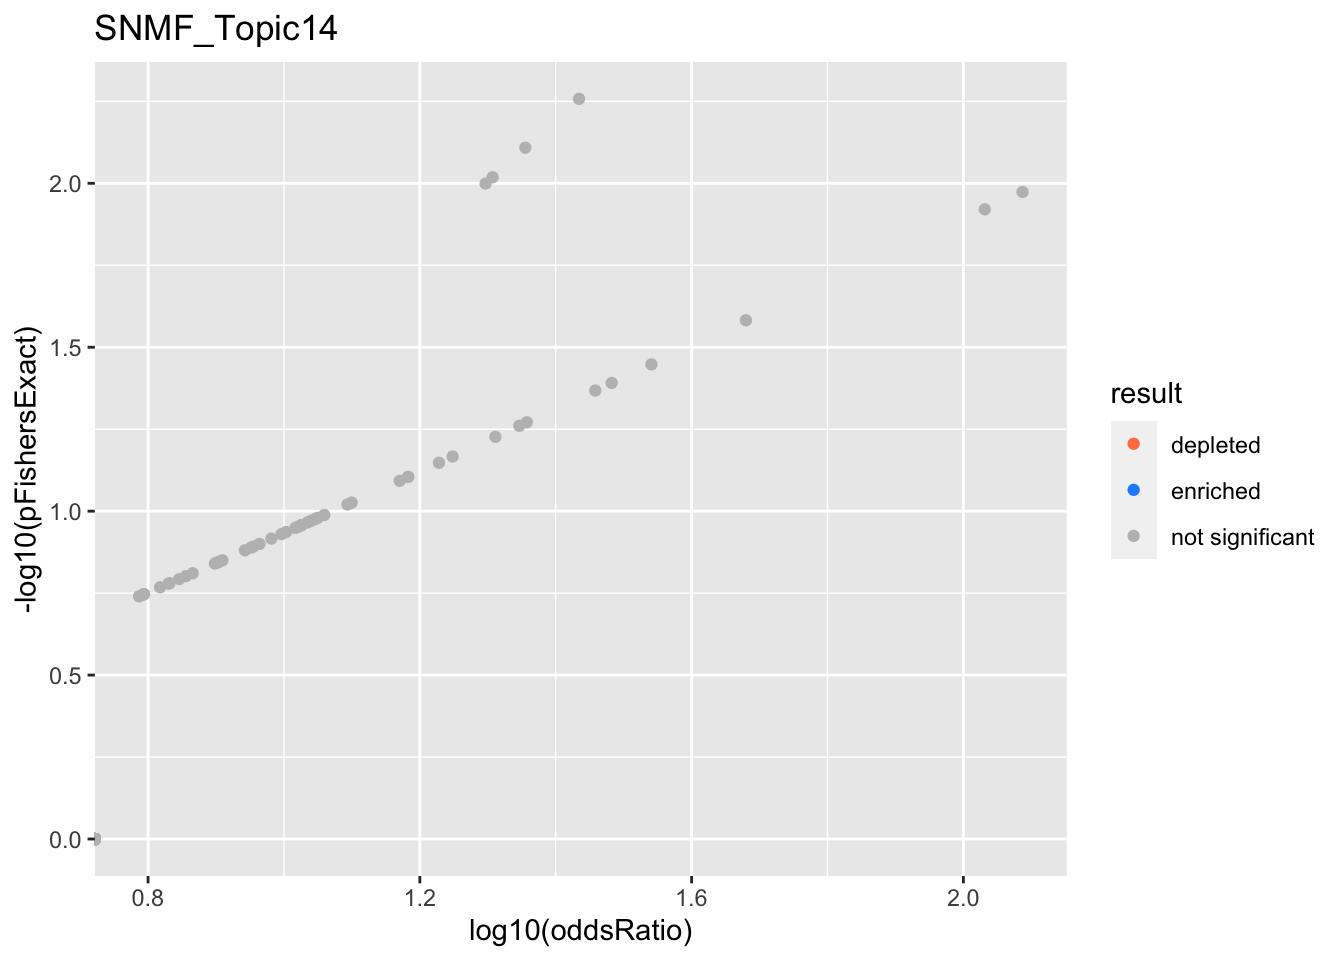
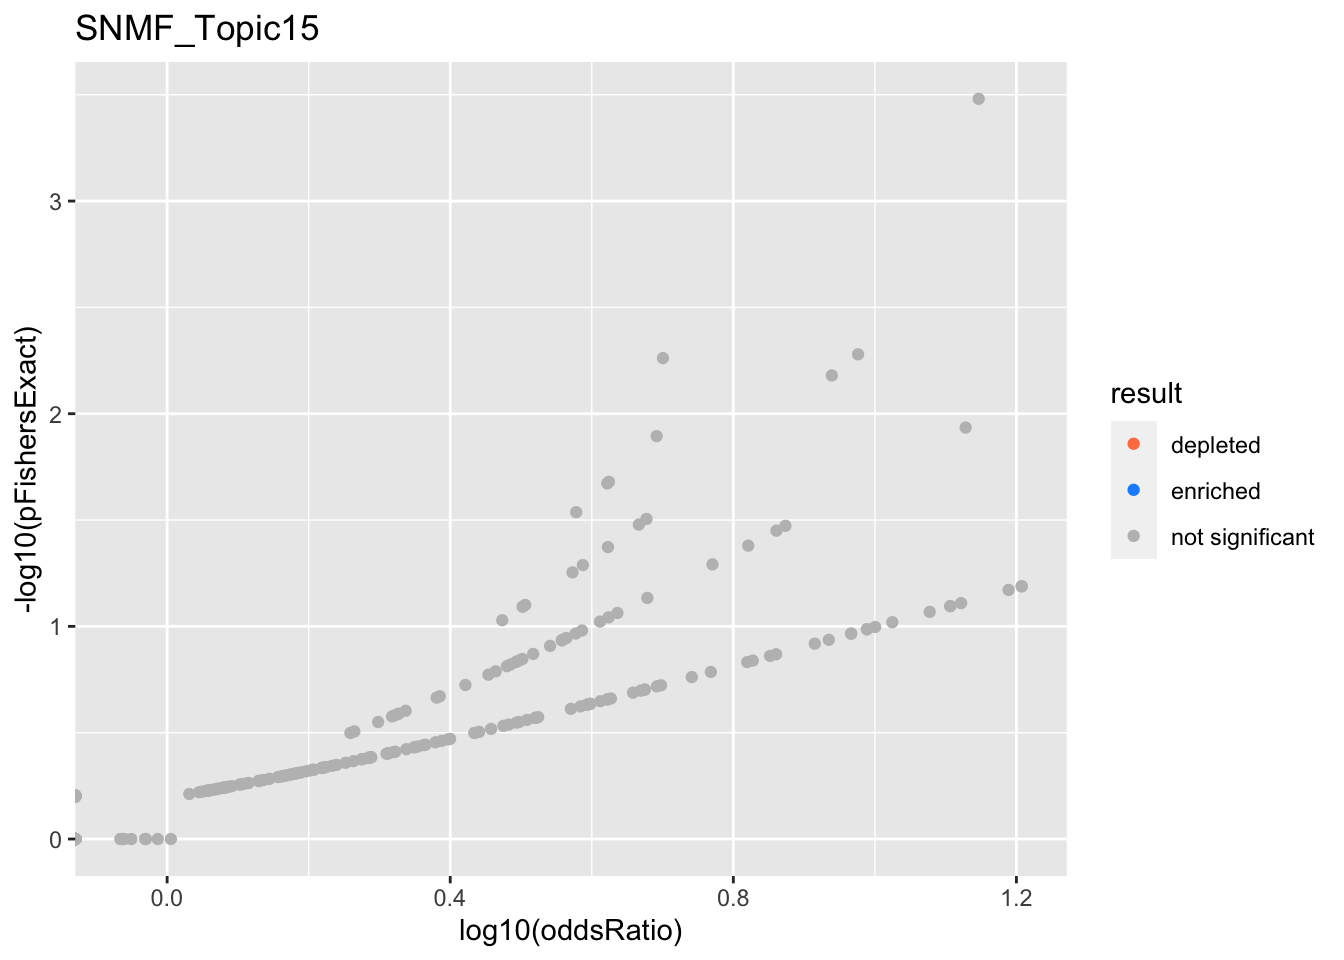
We report gene set enrichment analysis of the topics from Jason’s NMF and SNMF of the Deng et al. data set.
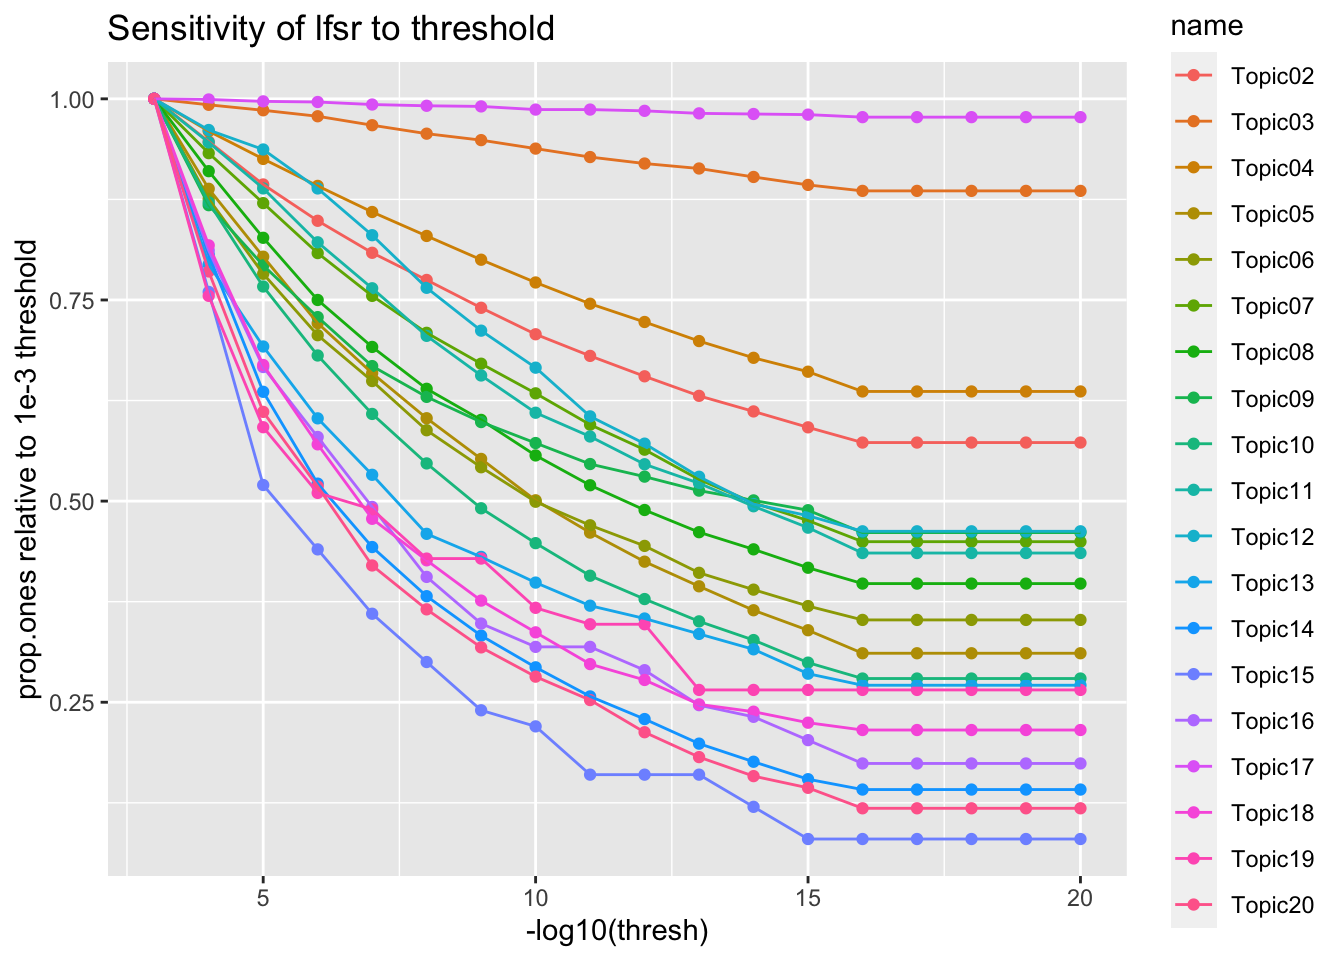
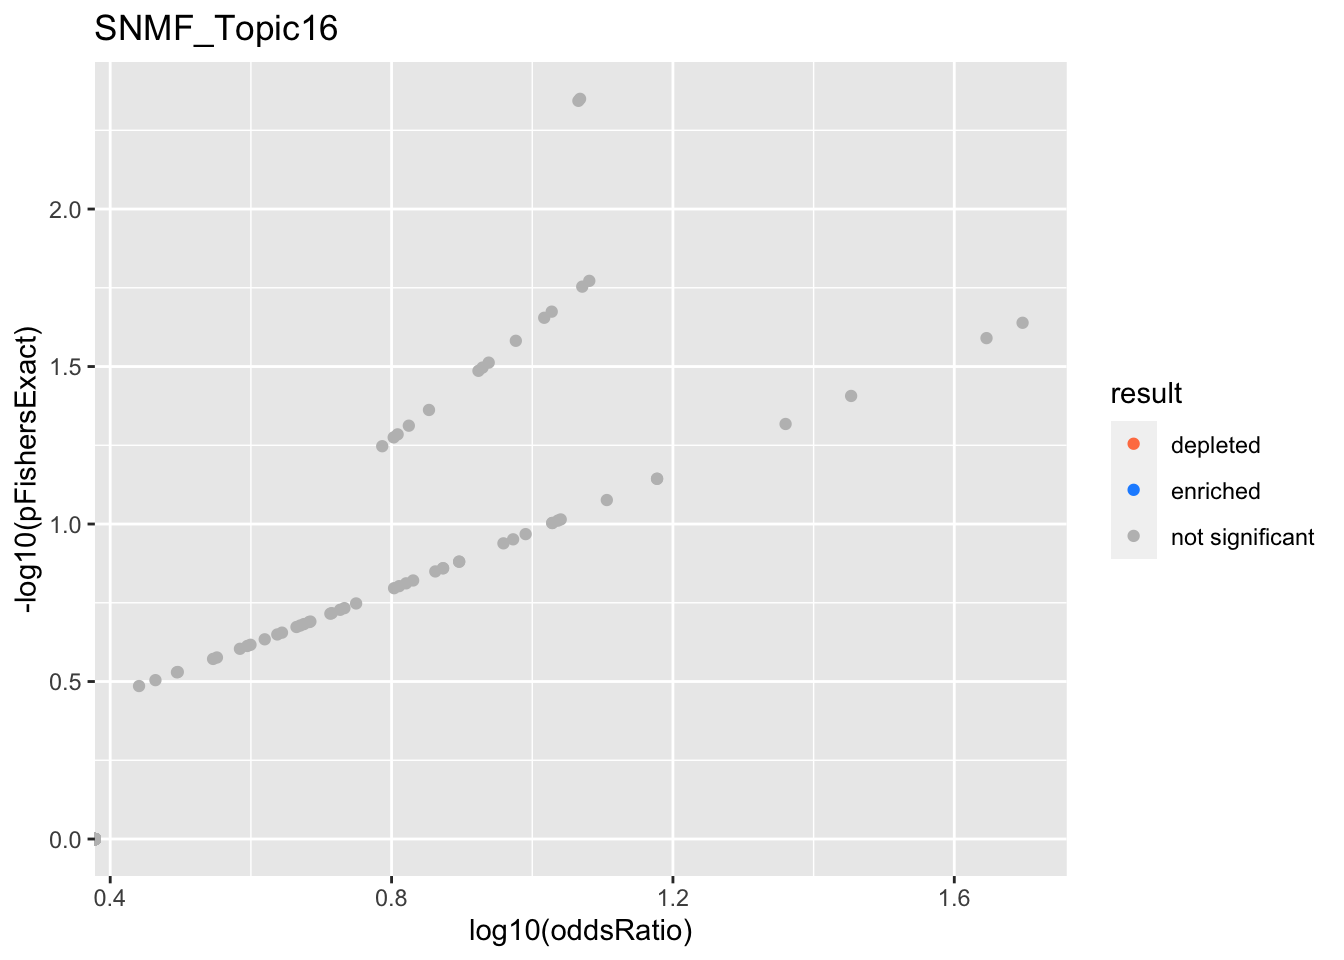
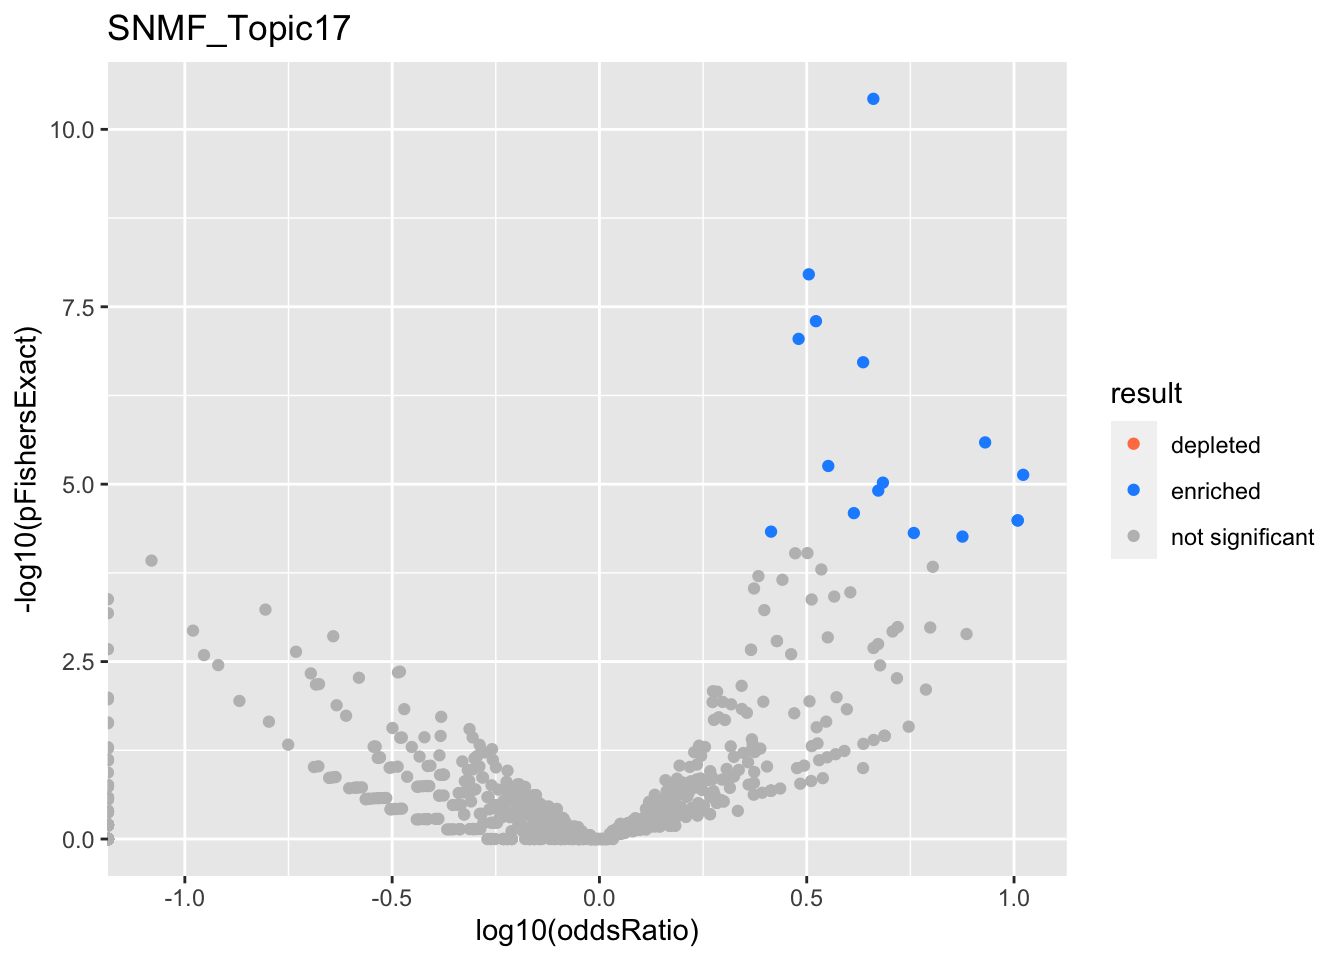
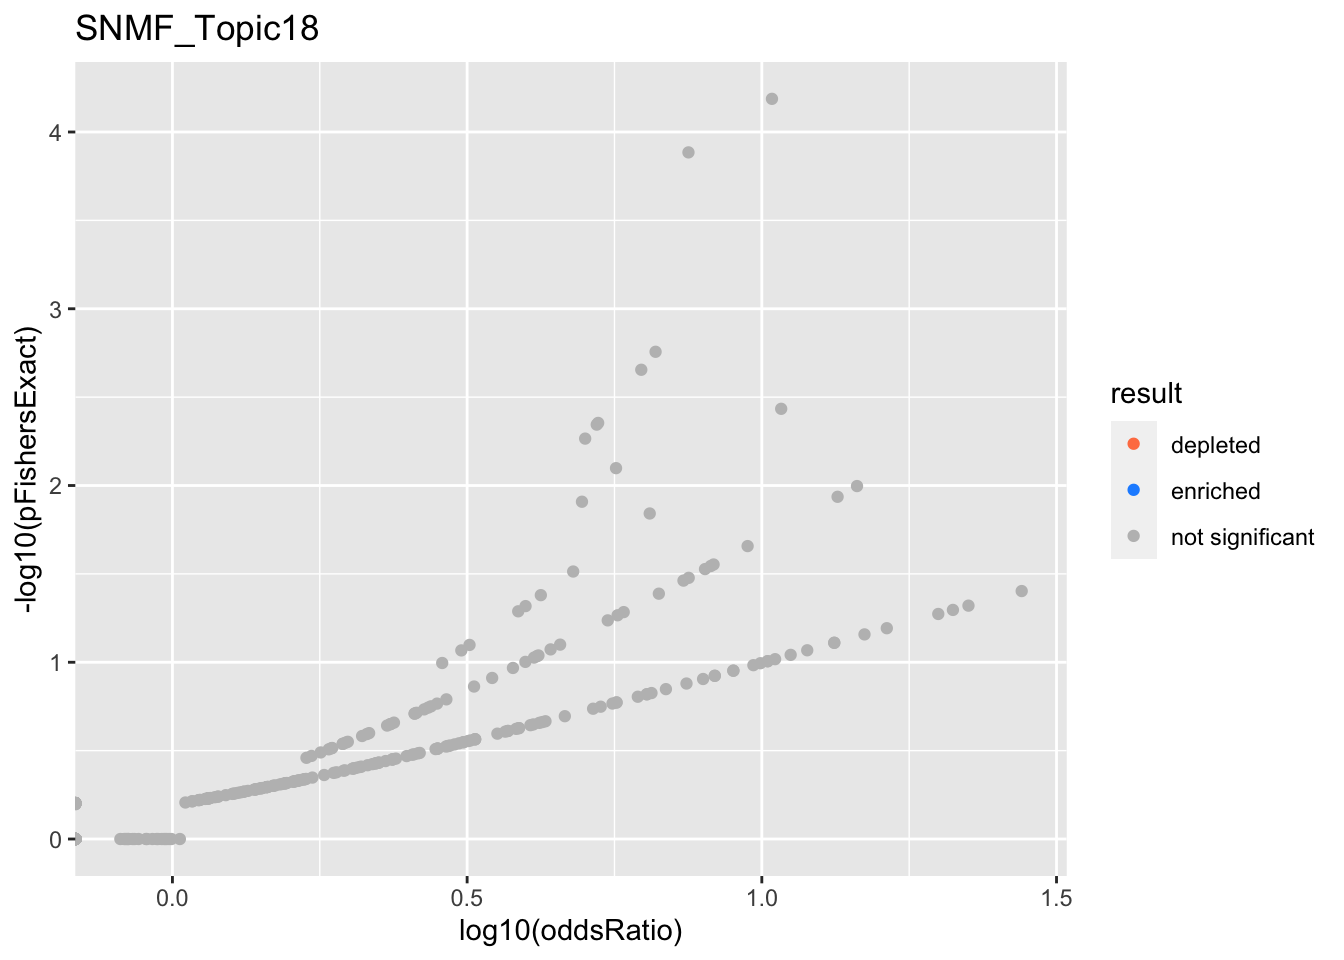
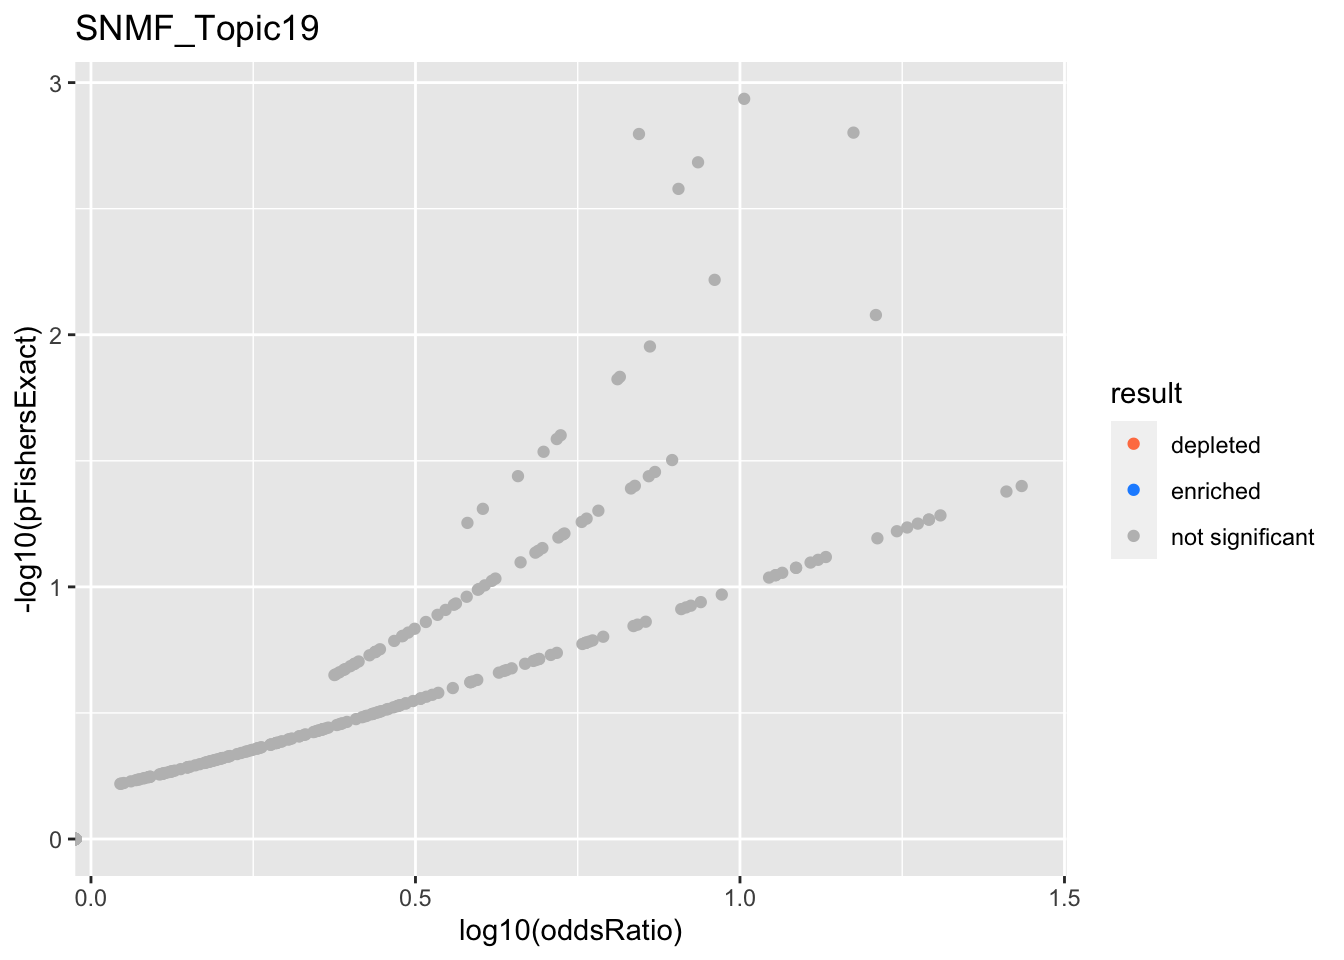
For each topic we construct a binary gene list by thresholding on local false sign rates output from flash. Here, I pick \(lfsr <- 1e-5\).
library(tidyverse)
library(htmltools)
source('code/utils.R')
source('code/load_gene_sets.R')
source('code/load_data.R')
data <- load_deng_topics()
genesets <- load_gene_sets()source('code/logistic_susie_vb.R')
source('code/logistic_susie_veb_boost.R')
source('code/enrichment_pipeline.R')
# fix params
params.genesets <- eval(parse(text=params$genesets))
params.thresh <- eval(parse(text=params$thresh))
params.rerun <- eval(parse(text=params$rerun))
do_logistic_susie_cached = function(data, db, thresh, .sign=c(1, -1), prefix=''){
res <- xfun::cache_rds({
purrr::map_dfr(
names(data),
~do_logistic_susie(.x, db, thresh, genesets, data, .sign=.sign))},
dir = params$cache_dir,
file=paste0(prefix, 'logistic_susie_', db, '_', thresh),
hash = list(data, db, thresh, prefix),
rerun = params.rerun)
}
fits <- map_dfr(params.genesets, ~do_logistic_susie_cached(data, .x, params.thresh))
snmf.data <- data[grep('^SNMF*', names(data))]
positive.fits <- map_dfr(
params.genesets,
~do_logistic_susie_cached(snmf.data, .x, params.thresh, c(1), 'positive'))
negative.fits <- map_dfr(
params.genesets,
~do_logistic_susie_cached(snmf.data, .x, params.thresh, c(1), 'negative'))
do_ora_cached = function(data, db, thresh, .sign=c(1, -1), prefix=''){
res <- xfun::cache_rds({
purrr::map_dfr(names(data), ~do_ora(.x, db, thresh, genesets, data, .sign=.sign))
},
dir = params$cache_dir,
file=paste0(prefix, 'ora_', db, '_', thresh),
rerun=params.rerun)
}
ora <- map_dfr(params.genesets, ~do_ora_cached(data, .x, params.thresh))
positive.ora <- map_dfr(
params.genesets,
~do_ora_cached(snmf.data, .x, params.thresh, c(1), 'positive'))
negative.ora <- map_dfr(
params.genesets,
~do_ora_cached(snmf.data, .x, params.thresh, c(-1), 'negative'))# take credible set summary, return "best" row for each gene set
get_cs_summary_condensed = function(fit){
fit %>%
get_credible_set_summary() %>%
group_by(geneSet) %>%
arrange(desc(alpha)) %>%
filter(row_number() == 1)
}
# generate table for making gene-set plots
get_plot_tbl = function(fits, ora){
res <- fits %>%
left_join(ora) %>%
mutate(
gs_summary = map(fit, get_gene_set_summary),
cs_summary = map(fit, get_cs_summary_condensed),
res = map2(gs_summary, cs_summary, ~ left_join(.x, .y, by='geneSet')),
res = map2(res, ora, ~ possibly(left_join, NULL)(.x, .y))
) %>%
select(-c(fit, susie.args, ora, gs_summary, cs_summary)) %>%
unnest(res)
return(res)
}
# split tibble into a list using 'col'
split_tibble = function(tibble, col = 'col'){
tibble %>% split(., .[, col])
}
# Get summary of credible sets with gene set descriptions
get_table_tbl = function(fits, ora){
res2 <- fits %>%
left_join(ora) %>%
mutate(res = map(fit, get_credible_set_summary)) %>%
mutate(res = map2(res, ora, ~ left_join(.x, .y))) %>%
select(-c(fit, ora)) %>%
unnest(res)
descriptions <- map_dfr(genesets, ~pluck(.x, 'geneSet', 'geneSetDes'))
tbl <- res2 %>%
filter(active_cs) %>%
left_join(descriptions)
tbl_split <- split_tibble(tbl, 'experiment')
html_tables <- map(tbl_split, ~split_tibble(.x, 'db'))
return(html_tables)
}get_ora_enrichments = function(tbl){
tbl %>% mutate(
padj = p.adjust(pFishersExact),
result = case_when(
padj < 0.05 & oddsRatio < 1 ~ 'depleted',
padj < 0.05 & oddsRatio > 1 ~ 'enriched',
TRUE ~ 'not significant'
)
)
}
do.volcano = function(res){
res %>%
get_ora_enrichments %>%
ggplot(aes(x=log10(oddsRatio), y=-log10(pFishersExact), color=result)) +
geom_point() +
geom_point(
res %>% filter(in_cs, active_cs),
mapping=aes(x=log10(oddsRatio), y=-log10(pFishersExact)),
color='black', pch=21, size=5) +
scale_color_manual(values = c('depleted' = 'coral',
'enriched' = 'dodgerblue',
'not significant' = 'grey'))
}NMF
Threshold sensitivity
thresh <- map_dbl(1:20, ~10**-.x)

.prop.ones = function(topic){
  map_dbl(thresh, ~ prep_binary_data(
  genesets[['gobp']], data[[topic]], thresh=.x)$y %>% mean())
}

prop.ones <- map_dfc(names(data[grep('^NMF*', names(data))]), ~.prop.ones(.x))

new.names = paste0('Topic', str_pad(2:20, 2, pad='0'))
colnames(prop.ones) <- new.names
prop.ones <- prop.ones %>% mutate(thresh = thresh)

prop.ones %>%
  pivot_longer(one_of(new.names)) %>%
  filter(thresh <= 1e-3) %>%
  group_by(name) %>%
  mutate(value = value / (sort(value, decreasing = T)[1])) %>%
  ggplot(aes(x=-log10(thresh), y=value, color=name)) +
  geom_point() + geom_line() +
  labs(
    y = 'prop.ones relative to 1e-3 threshold',
    title = 'Sensitivity of lfsr to threshold'
  )
| Version | Author | Date |
|---|---|---|
| 72fad28 | karltayeb | 2022-04-09 |
Glossary
alphais the posterior probability of SuSiE including this gene set in this component which is different from PIP (probability of SuSiE including this gene set in ANY component)betaposterior mean/standard error of posterior mean for effect size. Standard errors are likely too small.oddsRatio, pHypergeometric, pFishersExactconstruct a contingency table (gene list membersip) x (gene set membership), estimate theoddsRatiogives the odds of being in the gene list conditional on being in the gene set / odds of being in the gene list conditional on NOT being in the gene set.pHypergeometricandpFishersExactare pvalues from 1 and 2 sided test respectively.
res <- fits %>%
  filter(str_detect(experiment, '^NMF*')) %>%
  get_plot_tbl(., ora)

html_tables <- fits %>%
  filter(str_detect(experiment, '^NMF*')) %>%
  get_table_tbl(., ora)

experiments <- unique(res$experiment)

for (i in 1:length(experiments)){
  this_experiment <- experiments[i]
  cat("\n")
  cat("###", this_experiment, "\n") # Create second level headings with the names.

  # print volcano plot
  p <- do.volcano(res %>% filter(experiment == this_experiment)) +
    labs(title=this_experiment)
  print(p)

  cat("\n\n")

  # print table
  for(db in names(html_tables[[this_experiment]])){
    cat("####", db, "\n") # Create second level headings with the names.
    to_print <- html_tables[[this_experiment]][[db]] %>% distinct()
    to_print %>% report_susie_credible_sets() %>% htmltools::HTML() %>% print()
    cat("\n")
  }}
NMF_Topic2
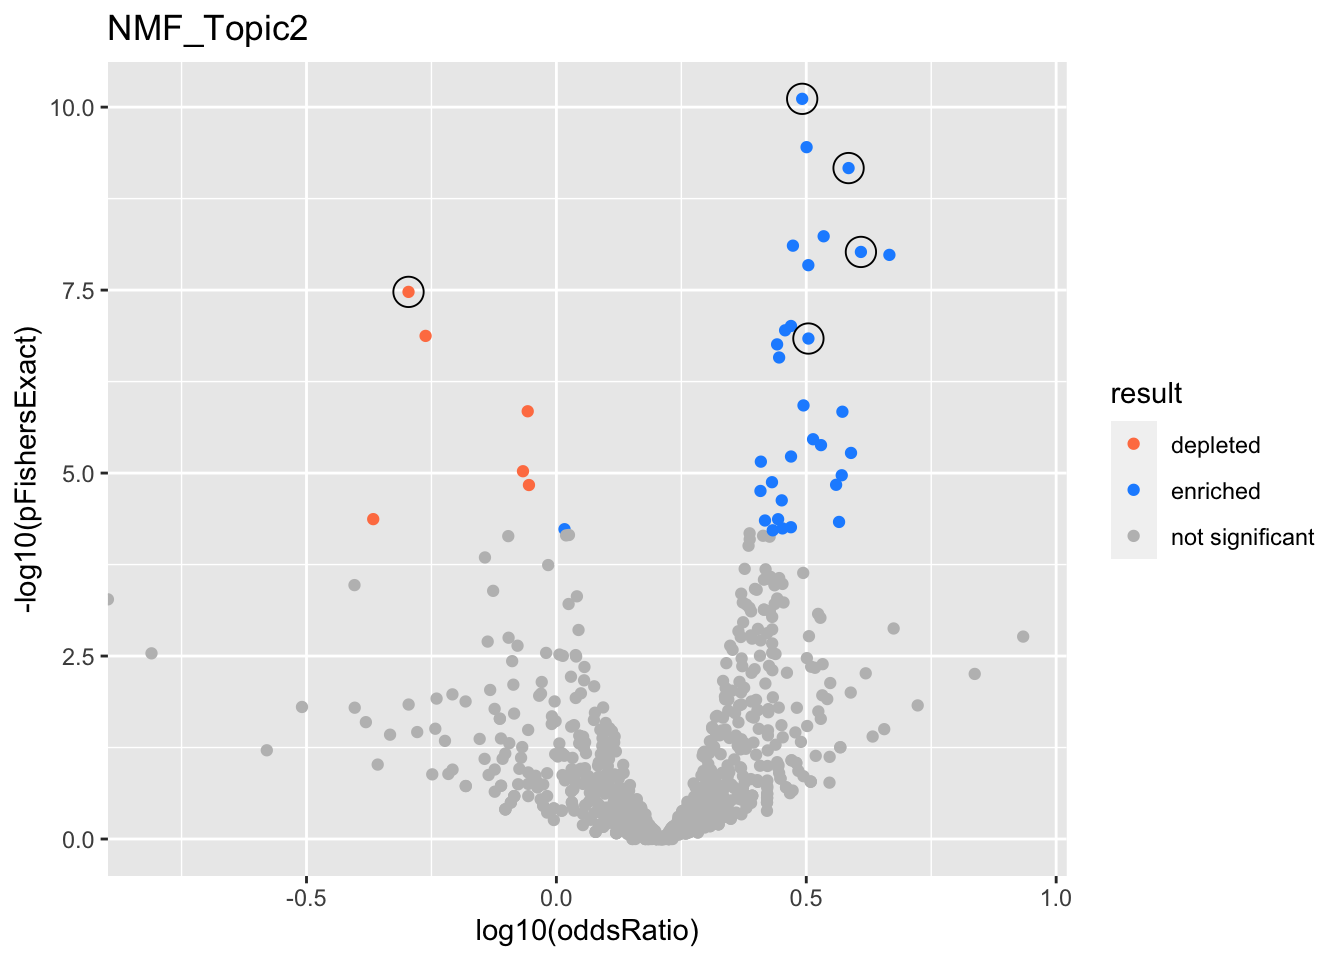
gobp_nr
| geneSet | description | alpha | beta | beta.se | pHypergeometric | pFishersExact | overlap | geneSetSize | oddsRatio |
|---|---|---|---|---|---|---|---|---|---|
| L1 | |||||||||
| GO:0044772 | mitotic cell cycle phase transition | 0.97 | 0.518 | 0.0949 | 4.1e-11 | 7.71e-11 | 231 | 435 | 3.1 |
| GO:0048285 | organelle fission | 0.0136 | 0.47 | 0.102 | 1.91e-10 | 3.52e-10 | 202 | 376 | 3.17 |
| GO:1901987 | regulation of cell cycle phase transition | 0.0052 | 0.469 | 0.107 | 5.79e-08 | 9.78e-08 | 176 | 338 | 2.95 |
| GO:0007059 | chromosome segregation | 0.00303 | 0.52 | 0.123 | 3.27e-09 | 5.82e-09 | 142 | 254 | 3.43 |
| L3 | |||||||||
| GO:0040029 | regulation of gene expression, epigenetic | 0.937 | 0.816 | 0.137 | 5e-10 | 6.8e-10 | 124 | 211 | 3.84 |
| GO:0016458 | gene silencing | 0.0624 | 0.853 | 0.156 | 6.49e-09 | 9.52e-09 | 97 | 161 | 4.07 |
| L4 | |||||||||
| GO:0006399 | tRNA metabolic process | 0.957 | -1.02 | 0.185 | 1 | 3.34e-08 | 22 | 136 | 0.506 |
| GO:0034470 | ncRNA processing | 0.0394 | -0.59 | 0.118 | 1 | 1.43e-06 | 76 | 304 | 0.876 |
| L5 | |||||||||
| GO:0070646 | protein modification by small protein removal | 0.954 | 0.619 | 0.125 | 9.91e-08 | 1.45e-07 | 135 | 249 | 3.19 |
| GO:0000209 | protein polyubiquitination | 0.0048 | 0.487 | 0.131 | 7.08e-07 | 1.19e-06 | 123 | 229 | 3.12 |
| GO:0016311 | dephosphorylation | 0.0015 | 0.353 | 0.102 | 9.77e-06 | 1.76e-05 | 187 | 385 | 2.56 |
| GO:0016569 | covalent chromatin modification | 0.00148 | 0.352 | 0.101 | 1.54e-07 | 2.63e-07 | 196 | 387 | 2.79 |
| GO:0030522 | intracellular receptor signaling pathway | 0.00138 | 0.429 | 0.127 | 2.37e-05 | 4.27e-05 | 124 | 244 | 2.78 |
| GO:0140053 | mitochondrial gene expression | 0.00137 | -0.556 | 0.169 | 1 | 1.34e-07 | 24 | 139 | 0.547 |
| GO:0071166 | ribonucleoprotein complex localization | 0.00127 | 0.581 | 0.178 | 1.03e-05 | 1.45e-05 | 68 | 118 | 3.63 |
| GO:0009755 | hormone-mediated signaling pathway | 0.00101 | 0.467 | 0.143 | 3.3e-05 | 5.5e-05 | 99 | 189 | 2.95 |
| GO:0007265 | Ras protein signal transduction | 0.000958 | 0.345 | 0.103 | 6.18e-08 | 1.12e-07 | 191 | 372 | 2.87 |
| GO:0018210 | peptidyl-threonine modification | 0.000929 | 0.603 | 0.192 | 3.48e-05 | 4.65e-05 | 58 | 100 | 3.68 |
NMF_Topic3
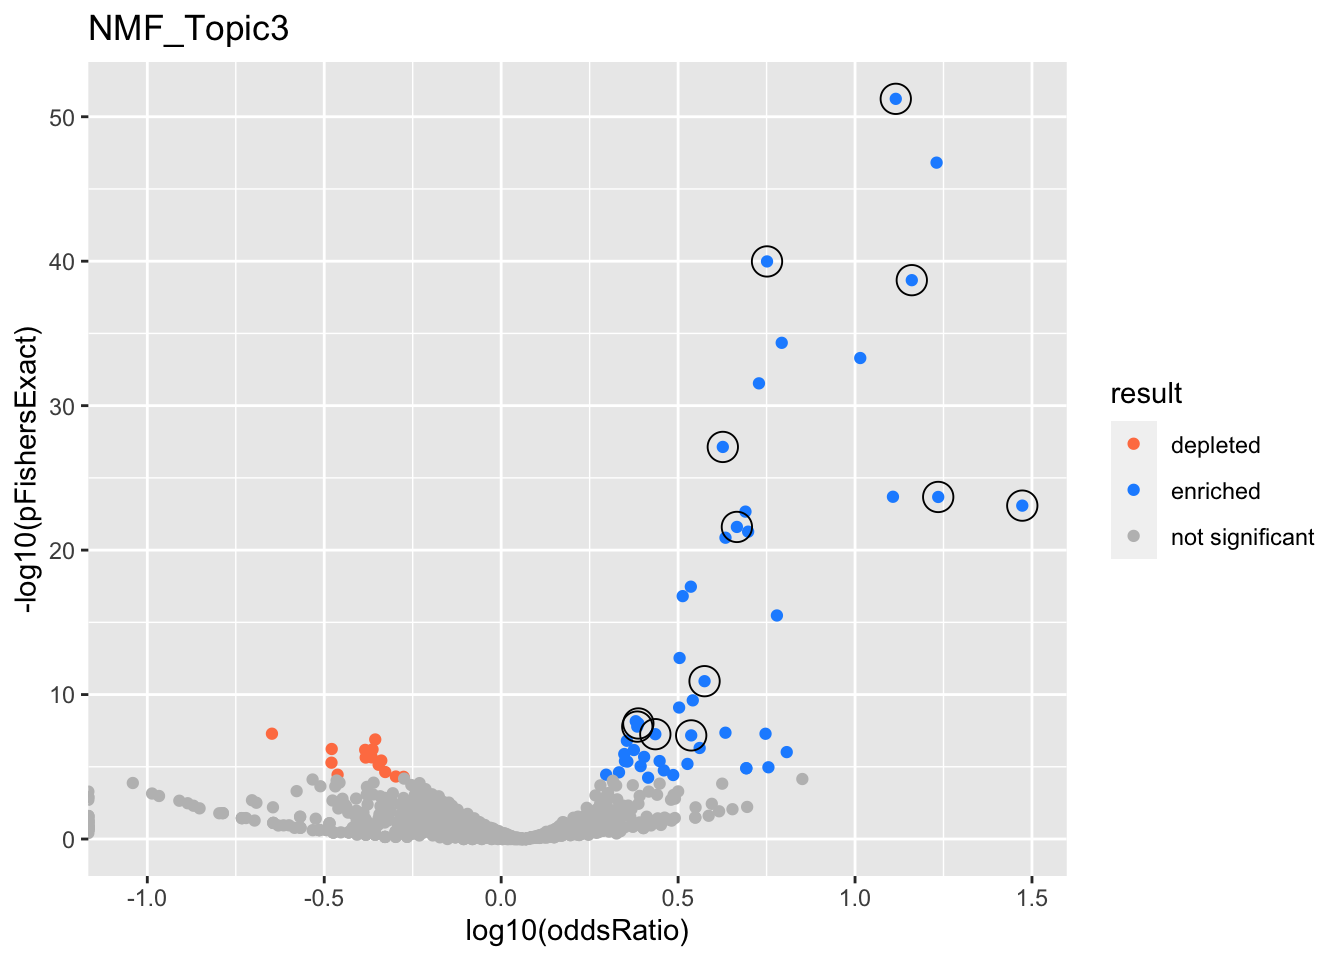
gobp_nr
| geneSet | description | alpha | beta | beta.se | pHypergeometric | pFishersExact | overlap | geneSetSize | oddsRatio |
|---|---|---|---|---|---|---|---|---|---|
| L1 | |||||||||
| GO:0006413 | translational initiation | 1 | 1.85 | 0.156 | 5.76e-52 | 5.76e-52 | 112 | 177 | 13 |
| L10 | |||||||||
| GO:0070646 | protein modification by small protein removal | 1 | 0.922 | 0.132 | 3.23e-08 | 5.52e-08 | 68 | 249 | 2.73 |
| L2 | |||||||||
| GO:0006414 | translational elongation | 1 | 2.67 | 0.187 | 2.06e-39 | 2.06e-39 | 80 | 121 | 14.5 |
| L3 | |||||||||
| GO:0033108 | mitochondrial respiratory chain complex assembly | 0.903 | 2.27 | 0.262 | 2.09e-24 | 2.09e-24 | 45 | 64 | 17.2 |
| GO:0010257 | NADH dehydrogenase complex assembly | 0.0973 | 2.59 | 0.309 | 8.33e-24 | 8.33e-24 | 37 | 46 | 29.7 |
| L4 | |||||||||
| GO:0006605 | protein targeting | 1 | 1.2 | 0.109 | 1.04e-40 | 1.04e-40 | 154 | 364 | 5.64 |
| L5 | |||||||||
| GO:0009123 | nucleoside monophosphate metabolic process | 0.985 | 1.2 | 0.13 | 2.49e-22 | 2.49e-22 | 98 | 255 | 4.64 |
| GO:0009141 | nucleoside triphosphate metabolic process | 0.0145 | 1.18 | 0.134 | 2.16e-23 | 2.16e-23 | 97 | 244 | 4.9 |
| L6 | |||||||||
| GO:0022613 | ribonucleoprotein complex biogenesis | 1 | 0.96 | 0.107 | 7.21e-28 | 7.21e-28 | 140 | 391 | 4.23 |
| L7 | |||||||||
| GO:0006457 | protein folding | 1 | 1.16 | 0.154 | 1.08e-11 | 1.18e-11 | 61 | 179 | 3.76 |
| L8 | |||||||||
| GO:0036230 | granulocyte activation | 0.52 | 0.798 | 0.108 | 7.46e-09 | 1e-08 | 96 | 384 | 2.44 |
| GO:0002446 | neutrophil mediated immunity | 0.48 | 0.796 | 0.108 | 9.89e-09 | 1.65e-08 | 96 | 386 | 2.42 |
| L9 | |||||||||
| GO:0006399 | tRNA metabolic process | 1 | 1.17 | 0.177 | 4.79e-08 | 6.72e-08 | 44 | 136 | 3.44 |
NMF_Topic4
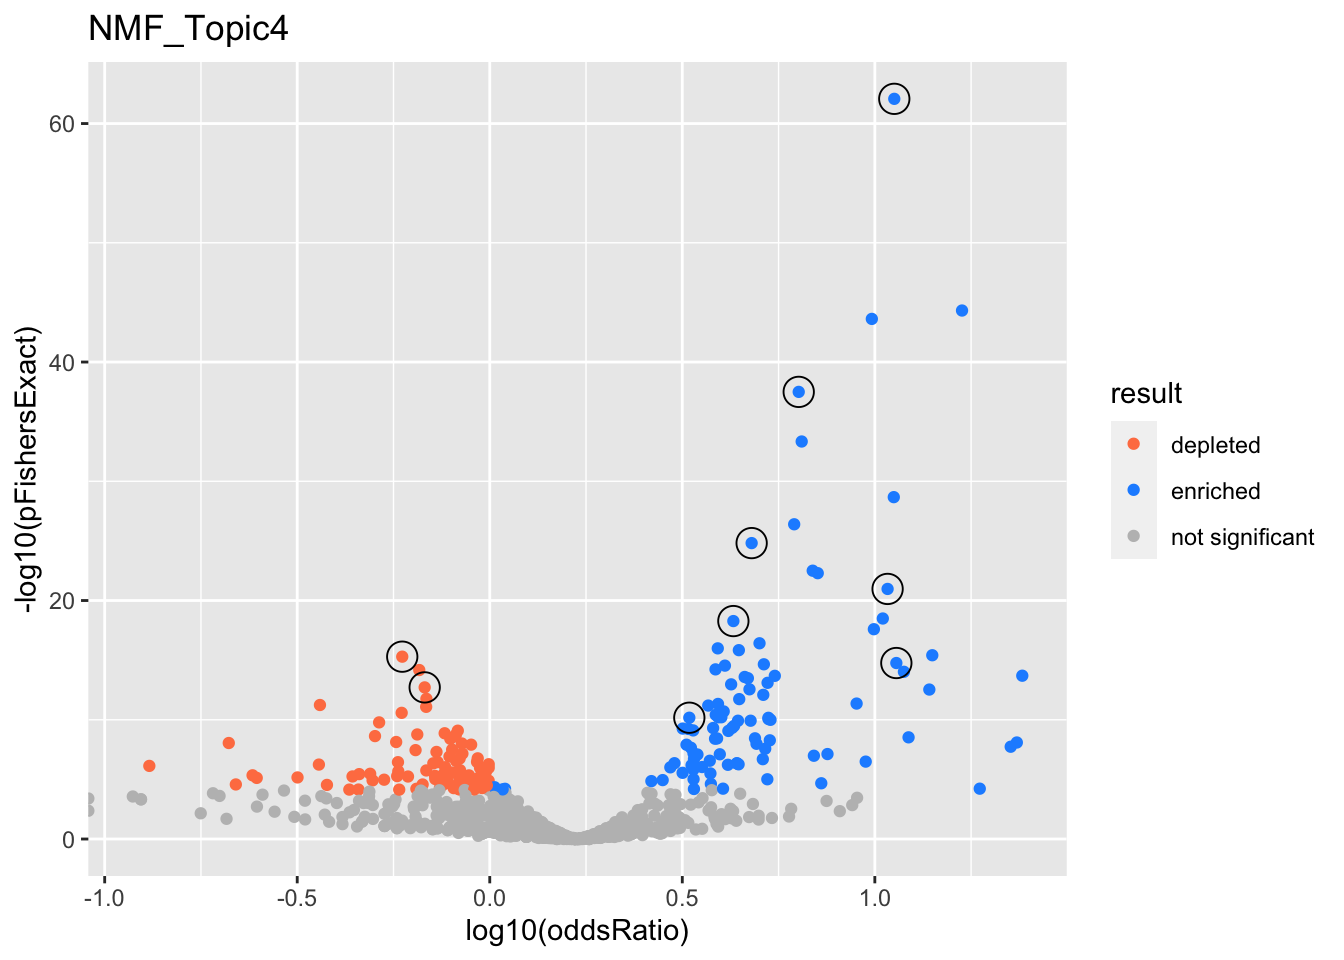
gobp_nr
| geneSet | description | alpha | beta | beta.se | pHypergeometric | pFishersExact | overlap | geneSetSize | oddsRatio |
|---|---|---|---|---|---|---|---|---|---|
| L1 | |||||||||
| GO:0022613 | ribonucleoprotein complex biogenesis | 1 | 1.57 | 0.111 | 5.24e-63 | 8.47e-63 | 316 | 391 | 11.2 |
| L2 | |||||||||
| GO:0044772 | mitotic cell cycle phase transition | 1 | 1.07 | 0.0979 | 8.84e-26 | 1.53e-25 | 281 | 435 | 4.79 |
| L3 | |||||||||
| GO:0006397 | mRNA processing | 0.991 | 1.02 | 0.102 | 2.68e-38 | 3.18e-38 | 300 | 425 | 6.34 |
| L4 | |||||||||
| GO:0043062 | extracellular structure organization | 1 | -0.871 | 0.119 | 1 | 5.11e-16 | 63 | 325 | 0.593 |
| L5 | |||||||||
| GO:0016569 | covalent chromatin modification | 1 | 0.865 | 0.103 | 3.74e-19 | 5.28e-19 | 241 | 387 | 4.29 |
| L6 | |||||||||
| GO:0070972 | protein localization to endoplasmic reticulum | 0.996 | 1.69 | 0.191 | 9.03e-22 | 1.07e-21 | 106 | 131 | 10.8 |
| L7 | |||||||||
| GO:0061919 | process utilizing autophagic mechanism | 1 | 0.75 | 0.1 | 3.83e-11 | 6.73e-11 | 226 | 403 | 3.3 |
| L8 | |||||||||
| GO:0034765 | regulation of ion transmembrane transport | 0.992 | -0.865 | 0.116 | 1 | 1.92e-13 | 73 | 339 | 0.678 |
| L9 | |||||||||
| GO:0098781 | ncRNA transcription | 0.99 | 1.7 | 0.233 | 1.08e-15 | 1.74e-15 | 72 | 88 | 11.4 |
| GO:0016073 | snRNA metabolic process | 0.0101 | 1.6 | 0.242 | 2.81e-16 | 3.88e-16 | 67 | 79 | 14.1 |
NMF_Topic5
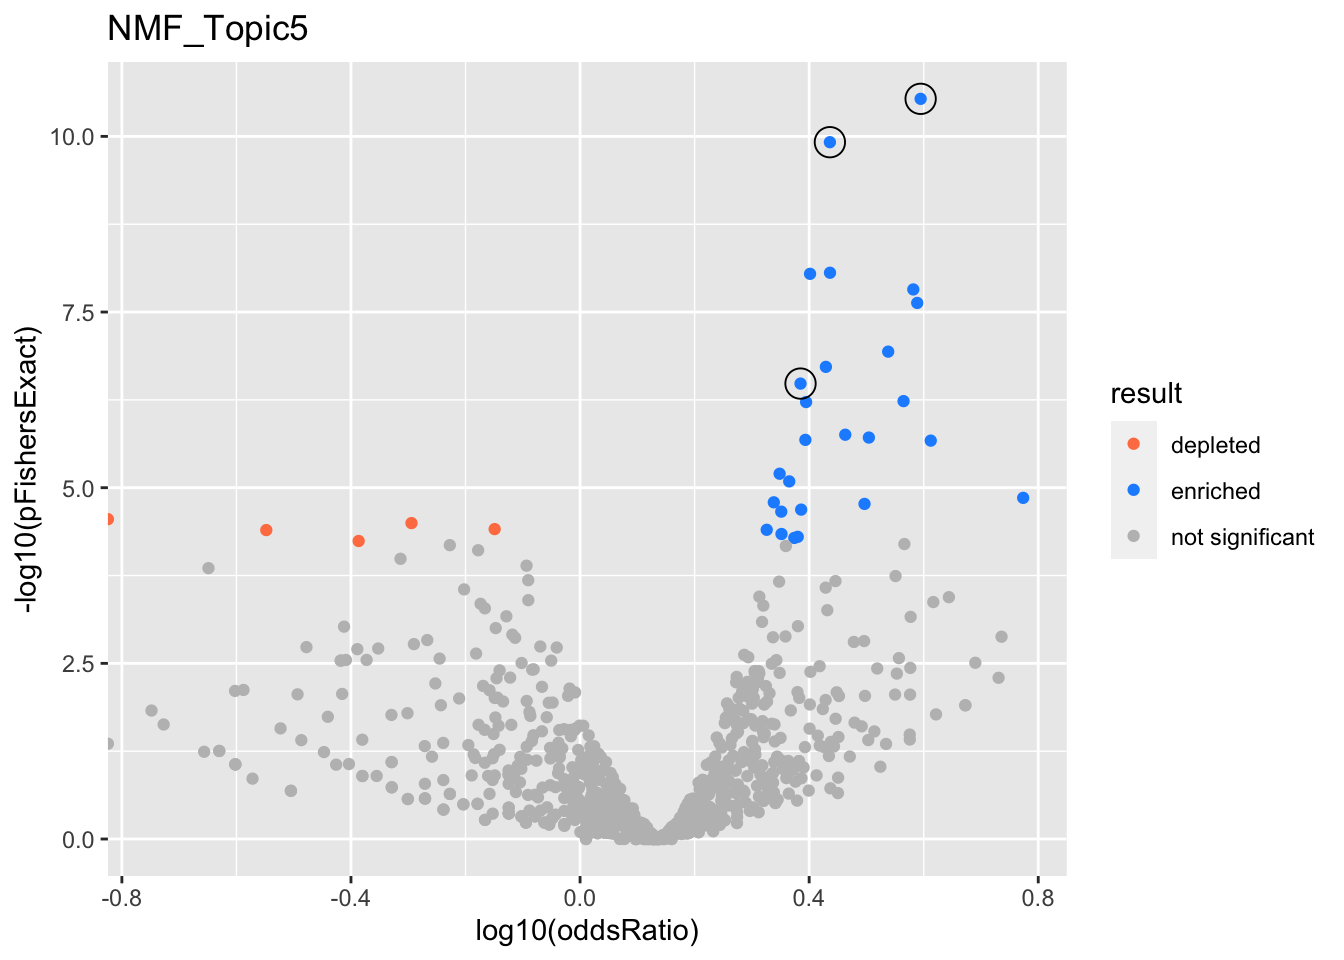
gobp_nr
| geneSet | description | alpha | beta | beta.se | pHypergeometric | pFishersExact | overlap | geneSetSize | oddsRatio |
|---|---|---|---|---|---|---|---|---|---|
| L1 | |||||||||
| GO:0016197 | endosomal transport | 0.981 | 0.86 | 0.152 | 1.79e-11 | 2.92e-11 | 86 | 170 | 3.93 |
| GO:0016482 | cytosolic transport | 0.016 | 0.854 | 0.176 | 1.24e-08 | 1.51e-08 | 64 | 128 | 3.82 |
| L2 | |||||||||
| GO:0061919 | process utilizing autophagic mechanism | 0.996 | 0.555 | 0.0992 | 7.39e-11 | 1.21e-10 | 166 | 403 | 2.73 |
| L3 | |||||||||
| GO:0006091 | generation of precursor metabolites and energy | 0.989 | 0.566 | 0.103 | 2.31e-07 | 3.3e-07 | 143 | 371 | 2.43 |
| GO:0009123 | nucleoside monophosphate metabolic process | 0.00462 | 0.544 | 0.125 | 1.16e-05 | 2.05e-05 | 99 | 255 | 2.43 |
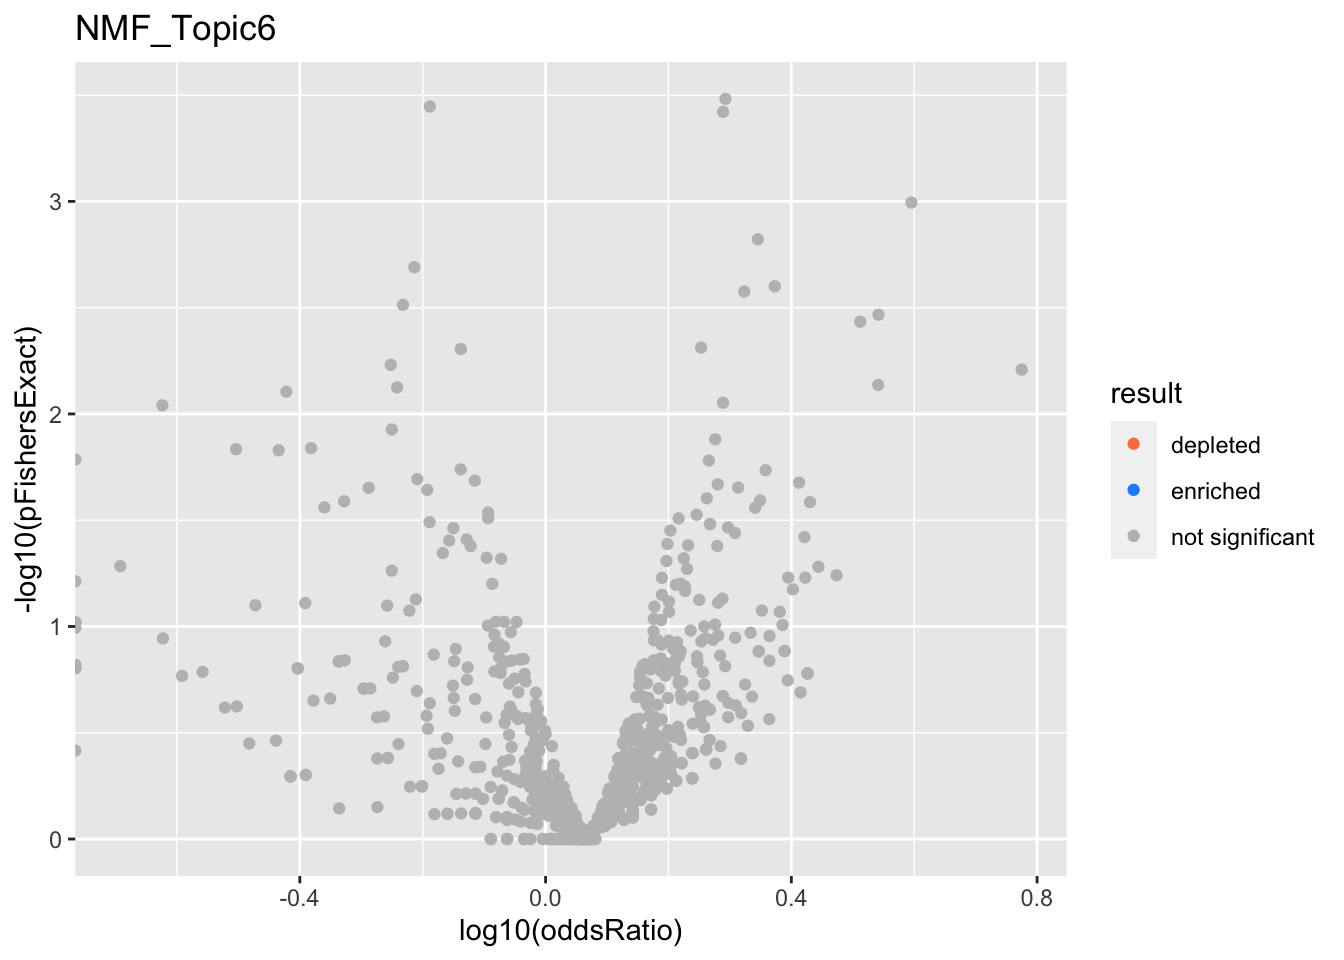
NMF_Topic6
NMF_Topic7
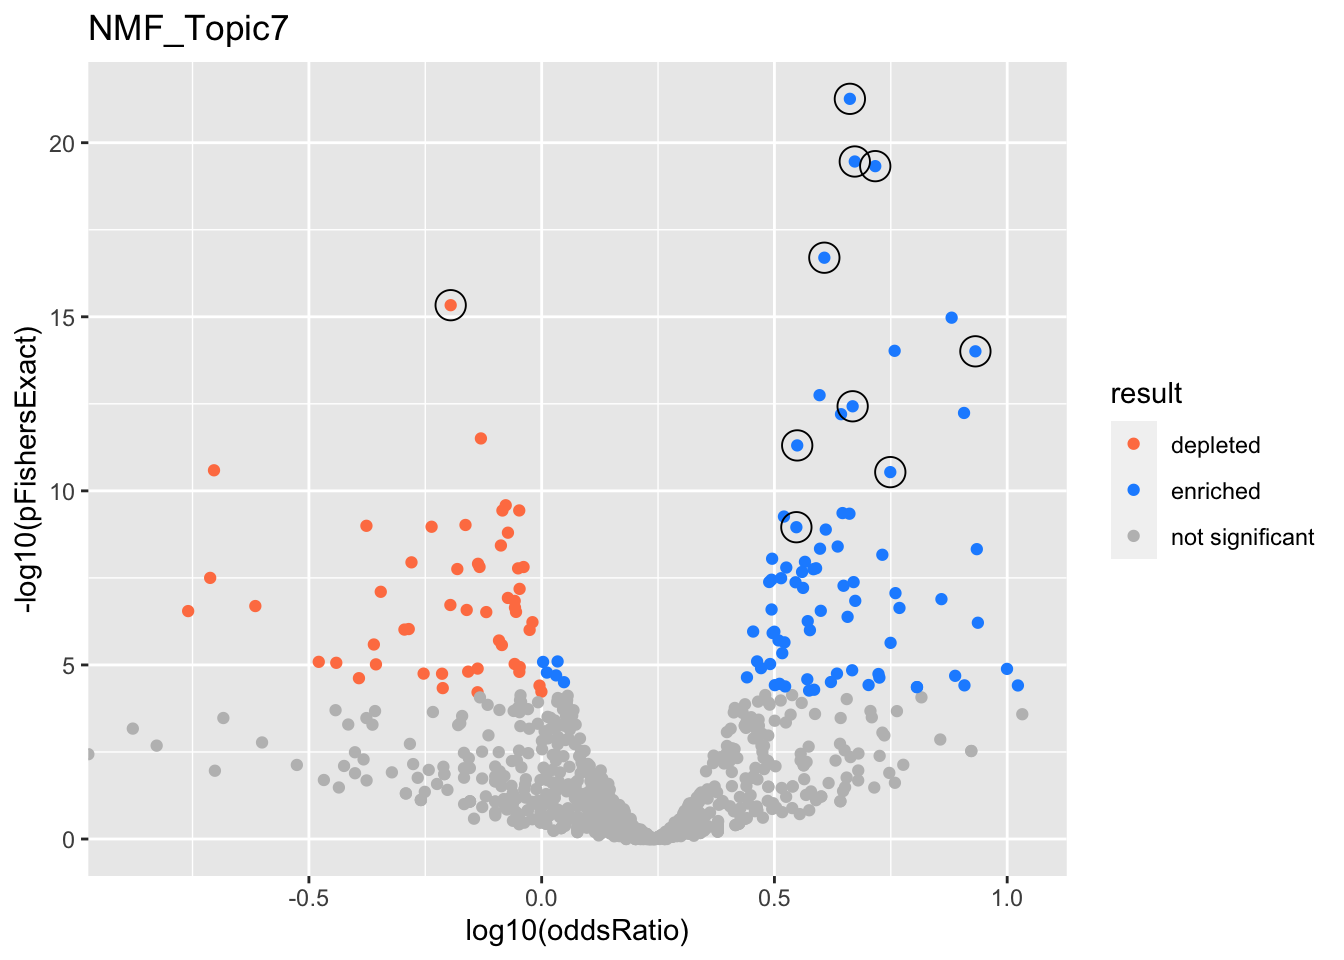
gobp_nr
| geneSet | description | alpha | beta | beta.se | pHypergeometric | pFishersExact | overlap | geneSetSize | oddsRatio |
|---|---|---|---|---|---|---|---|---|---|
| L1 | |||||||||
| GO:0006397 | mRNA processing | 0.902 | 0.985 | 0.0984 | 4.02e-22 | 5.49e-22 | 275 | 425 | 4.59 |
| GO:0008380 | RNA splicing | 0.0984 | 1.03 | 0.106 | 2.57e-20 | 3.47e-20 | 240 | 367 | 4.71 |
| L10 | |||||||||
| GO:0048193 | Golgi vesicle transport | 1 | 0.765 | 0.113 | 5.69e-10 | 1.11e-09 | 185 | 314 | 3.53 |
| L2 | |||||||||
| GO:0034470 | ncRNA processing | 1 | 1.09 | 0.117 | 2.65e-20 | 4.71e-20 | 206 | 304 | 5.21 |
| L3 | |||||||||
| GO:0034765 | regulation of ion transmembrane transport | 1 | -0.961 | 0.116 | 1 | 4.65e-16 | 72 | 339 | 0.638 |
| L4 | |||||||||
| GO:0061919 | process utilizing autophagic mechanism | 1 | 0.757 | 0.1 | 2.65e-12 | 4.95e-12 | 237 | 403 | 3.54 |
| L5 | |||||||||
| GO:0044772 | mitotic cell cycle phase transition | 0.987 | 0.663 | 0.0971 | 1.12e-17 | 2.01e-17 | 269 | 435 | 4.05 |
| GO:0044839 | cell cycle G2/M phase transition | 0.00606 | 0.885 | 0.148 | 6.1e-15 | 9.5e-15 | 129 | 184 | 5.73 |
| L6 | |||||||||
| GO:0031023 | microtubule organizing center organization | 1 | 1.36 | 0.199 | 5.23e-15 | 9.82e-15 | 88 | 113 | 8.55 |
| L7 | |||||||||
| GO:0140053 | mitochondrial gene expression | 0.999 | 1.12 | 0.174 | 2.21e-11 | 2.9e-11 | 97 | 139 | 5.61 |
| L8 | |||||||||
| GO:0006260 | DNA replication | 0.984 | 0.877 | 0.133 | 2.08e-13 | 3.72e-13 | 152 | 232 | 4.66 |
| GO:0006289 | nucleotide-excision repair | 0.00808 | 1.12 | 0.194 | 3.05e-13 | 5.79e-13 | 80 | 104 | 8.08 |
NMF_Topic8
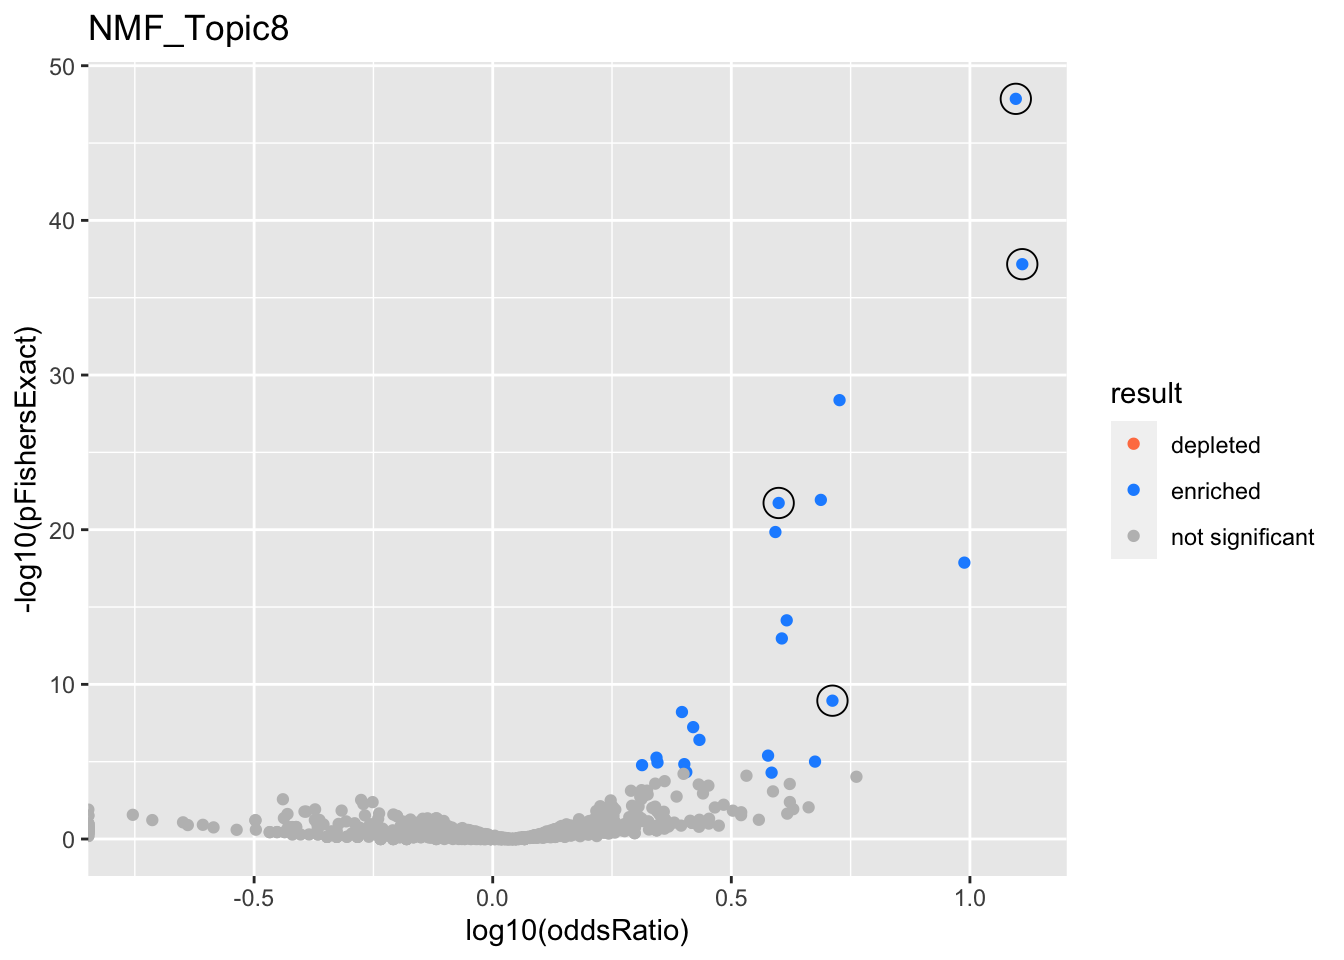
gobp_nr
| geneSet | description | alpha | beta | beta.se | pHypergeometric | pFishersExact | overlap | geneSetSize | oddsRatio |
|---|---|---|---|---|---|---|---|---|---|
| L1 | |||||||||
| GO:0006413 | translational initiation | 1 | 1.59 | 0.154 | 1.39e-48 | 1.39e-48 | 95 | 177 | 12.5 |
| L2 | |||||||||
| GO:0070972 | protein localization to endoplasmic reticulum | 1 | 1.34 | 0.181 | 6.8e-38 | 6.8e-38 | 72 | 131 | 12.9 |
| L3 | |||||||||
| GO:1990823 | response to leukemia inhibitory factor | 1 | 1.55 | 0.216 | 1.14e-09 | 1.14e-09 | 30 | 89 | 5.15 |
| L4 | |||||||||
| GO:0022613 | ribonucleoprotein complex biogenesis | 1 | 0.844 | 0.108 | 1.87e-22 | 1.87e-22 | 106 | 391 | 3.97 |
NMF_Topic9
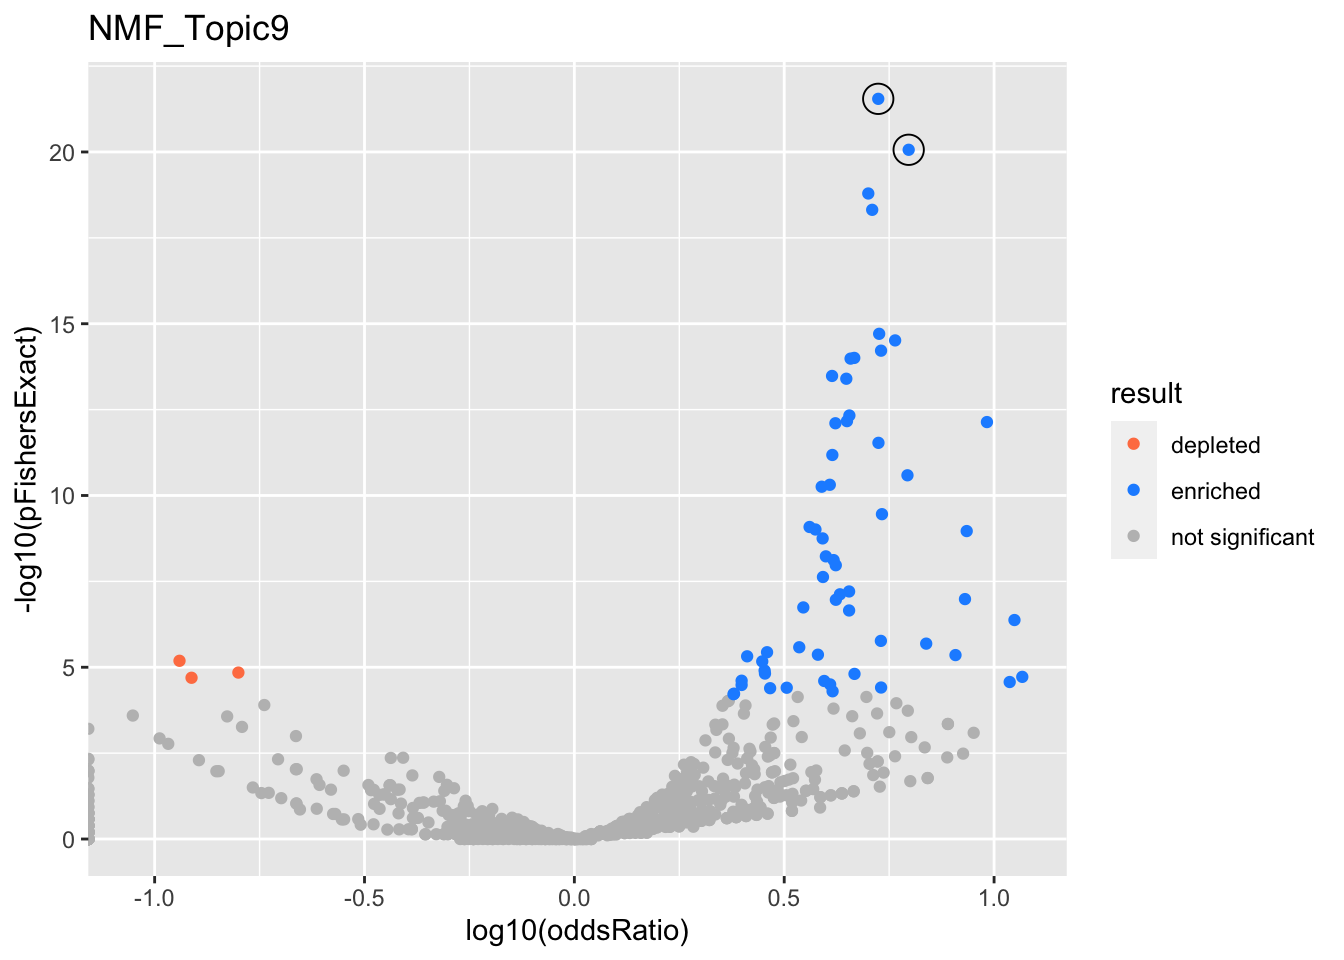
gobp_nr
| geneSet | description | alpha | beta | beta.se | pHypergeometric | pFishersExact | overlap | geneSetSize | oddsRatio |
|---|---|---|---|---|---|---|---|---|---|
| L1 | |||||||||
| GO:0002250 | adaptive immune response | 1 | 1.19 | 0.134 | 8.63e-21 | 8.63e-21 | 52 | 263 | 6.26 |
| L2 | |||||||||
| GO:0002521 | leukocyte differentiation | 1 | 1.16 | 0.112 | 2.84e-22 | 2.84e-22 | 66 | 390 | 5.3 |
NMF_Topic10
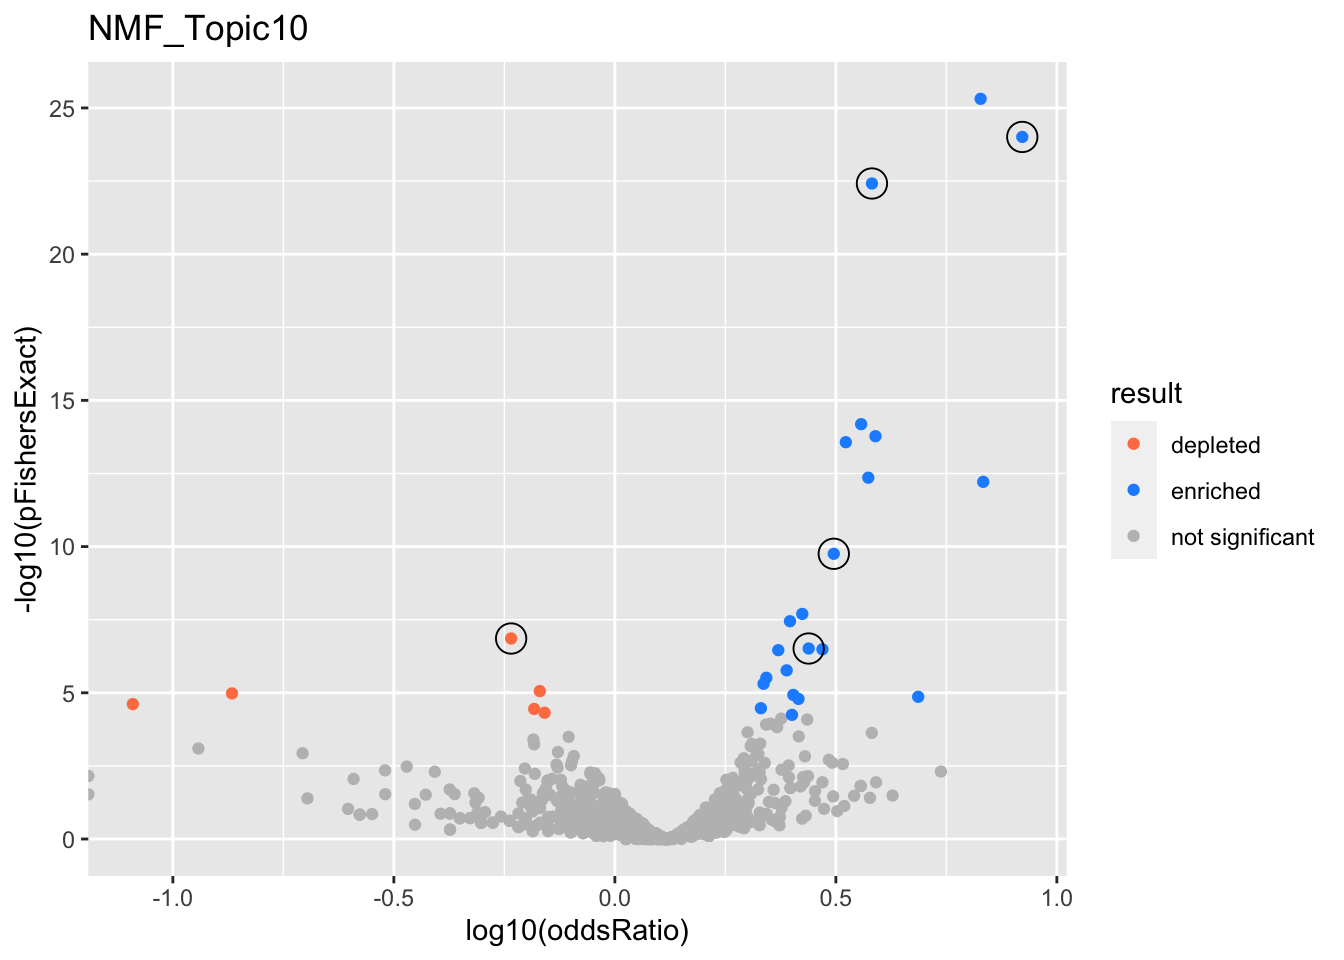
gobp_nr
| geneSet | description | alpha | beta | beta.se | pHypergeometric | pFishersExact | overlap | geneSetSize | oddsRatio |
|---|---|---|---|---|---|---|---|---|---|
| L1 | |||||||||
| GO:0070972 | protein localization to endoplasmic reticulum | 1 | 1.56 | 0.178 | 9.82e-25 | 9.82e-25 | 86 | 131 | 8.35 |
| L2 | |||||||||
| GO:0022613 | ribonucleoprotein complex biogenesis | 1 | 0.886 | 0.102 | 3.15e-23 | 3.83e-23 | 180 | 391 | 3.82 |
| L3 | |||||||||
| GO:0070646 | protein modification by small protein removal | 1 | 0.827 | 0.126 | 1.03e-10 | 1.76e-10 | 104 | 249 | 3.13 |
| L4 | |||||||||
| GO:0044282 | small molecule catabolic process | 0.999 | -0.69 | 0.122 | 1 | 1.39e-07 | 41 | 336 | 0.582 |
| L5 | |||||||||
| GO:0034504 | protein localization to nucleus | 0.954 | 0.642 | 0.132 | 1.81e-07 | 3.06e-07 | 88 | 227 | 2.74 |
| GO:0006383 | transcription by RNA polymerase III | 0.00333 | 0.905 | 0.276 | 1.06e-05 | 1.37e-05 | 25 | 47 | 4.86 |
| GO:0006457 | protein folding | 0.00246 | 0.514 | 0.153 | 4e-05 | 5.69e-05 | 66 | 179 | 2.52 |
| GO:0006413 | translational initiation | 0.00194 | 0.5 | 0.152 | 4.89e-26 | 4.89e-26 | 107 | 177 | 6.72 |
| GO:0071824 | protein-DNA complex subunit organization | 0.00188 | 0.498 | 0.151 | 2.59e-07 | 3.25e-07 | 73 | 180 | 2.95 |
| GO:0016569 | covalent chromatin modification | 0.0017 | 0.353 | 0.105 | 2.14e-07 | 3.48e-07 | 135 | 387 | 2.34 |
| GO:0018205 | peptidyl-lysine modification | 0.00162 | 0.404 | 0.122 | 1.22e-06 | 1.71e-06 | 102 | 283 | 2.45 |
| GO:0006970 | response to osmotic stress | 0.000875 | 0.739 | 0.259 | 0.00147 | 0.00246 | 24 | 57 | 3.1 |
| GO:0040029 | regulation of gene expression, epigenetic | 0.000865 | 0.431 | 0.141 | 7.41e-06 | 1.18e-05 | 78 | 211 | 2.53 |
| GO:0007200 | phospholipase C-activating G protein-coupled receptor signaling pathway | 0.000804 | -0.704 | 0.247 | 1 | 1.05e-05 | 2 | 64 | 0.136 |
NMF_Topic11
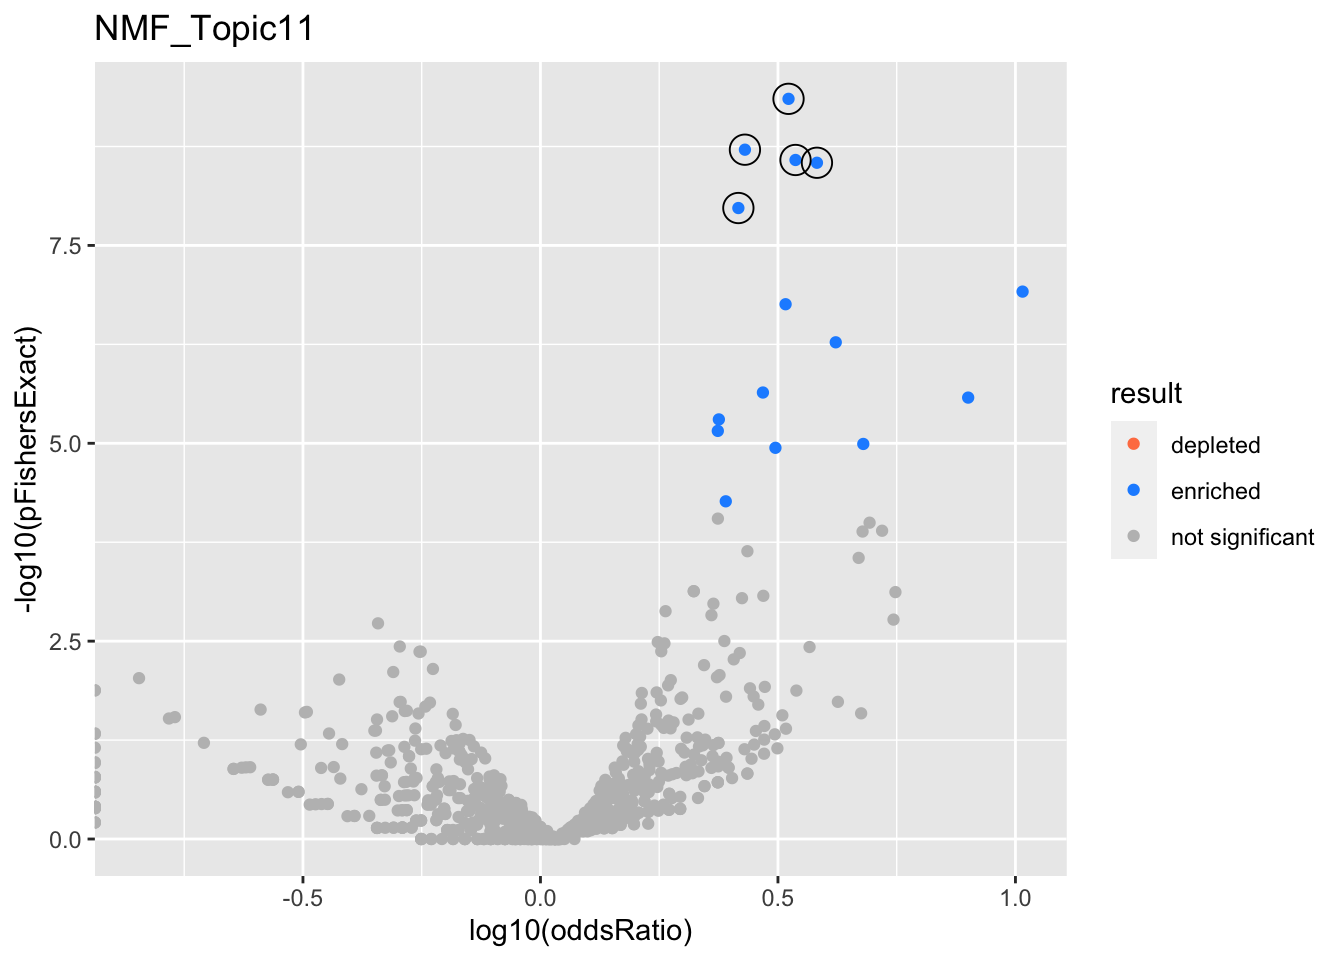
gobp_nr
| geneSet | description | alpha | beta | beta.se | pHypergeometric | pFishersExact | overlap | geneSetSize | oddsRatio |
|---|---|---|---|---|---|---|---|---|---|
| L1 | |||||||||
| GO:0034976 | response to endoplasmic reticulum stress | 1 | 1.04 | 0.138 | 4.45e-10 | 4.45e-10 | 51 | 239 | 3.33 |
| L2 | |||||||||
| GO:0002446 | neutrophil mediated immunity | 0.881 | 0.859 | 0.111 | 1.47e-09 | 1.95e-09 | 69 | 386 | 2.69 |
| GO:0036230 | granulocyte activation | 0.119 | 0.833 | 0.111 | 7.16e-09 | 1.07e-08 | 67 | 384 | 2.61 |
| L3 | |||||||||
| GO:0070085 | glycosylation | 0.999 | 0.893 | 0.15 | 2.63e-09 | 2.63e-09 | 44 | 200 | 3.44 |
| L4 | |||||||||
| GO:0006643 | membrane lipid metabolic process | 0.999 | 0.984 | 0.167 | 2.85e-09 | 2.85e-09 | 38 | 159 | 3.82 |
NMF_Topic12
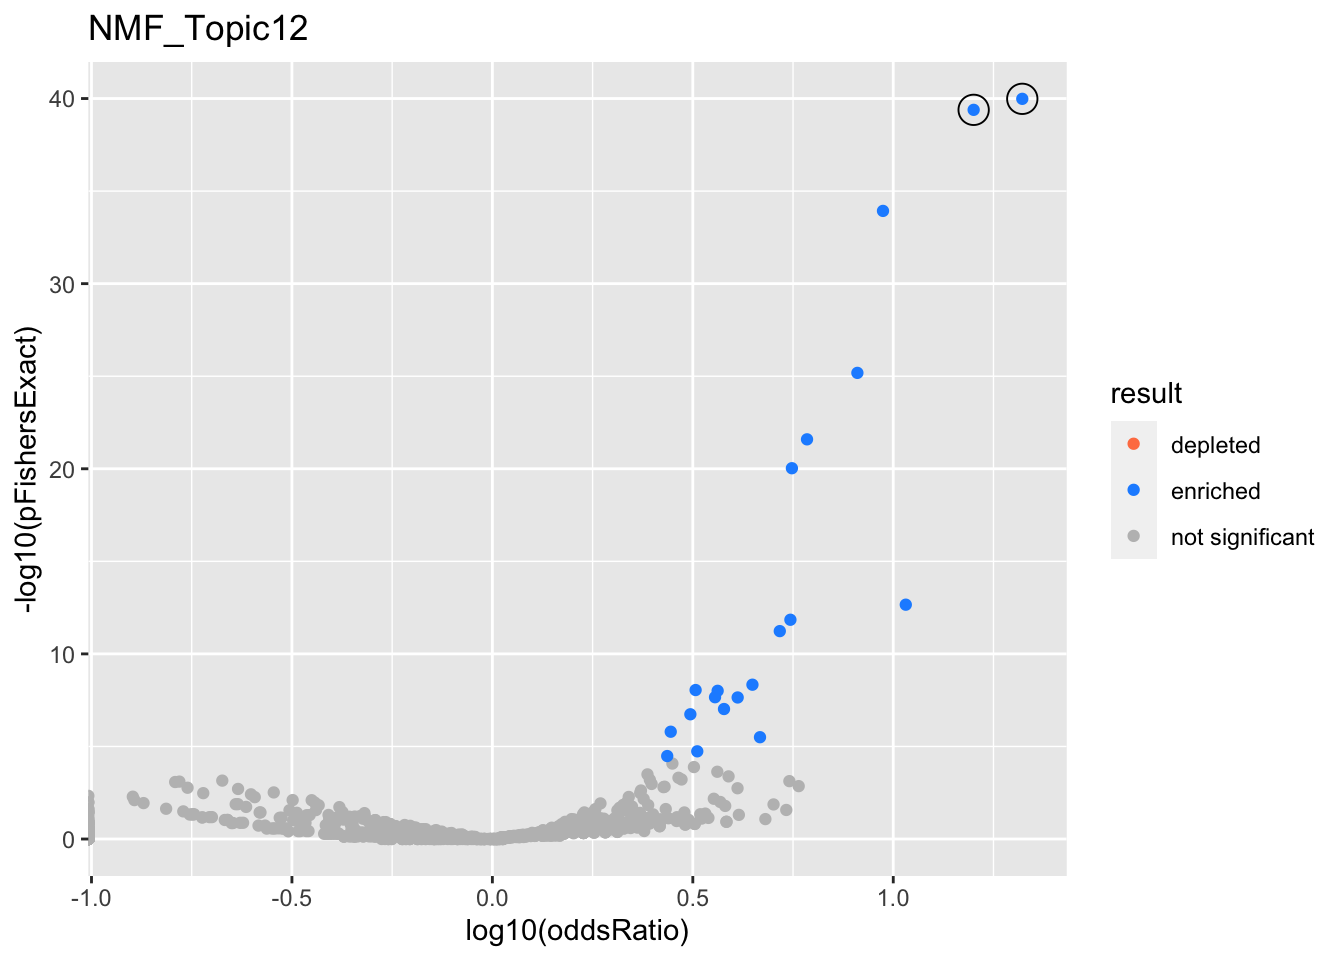
gobp_nr
| geneSet | description | alpha | beta | beta.se | pHypergeometric | pFishersExact | overlap | geneSetSize | oddsRatio |
|---|---|---|---|---|---|---|---|---|---|
| L1 | |||||||||
| GO:0070972 | protein localization to endoplasmic reticulum | 1 | 1.87 | 0.181 | 1.04e-40 | 1.04e-40 | 51 | 131 | 21 |
| L2 | |||||||||
| GO:0006413 | translational initiation | 1 | 1.72 | 0.159 | 4.08e-40 | 4.08e-40 | 57 | 177 | 15.9 |
NMF_Topic13
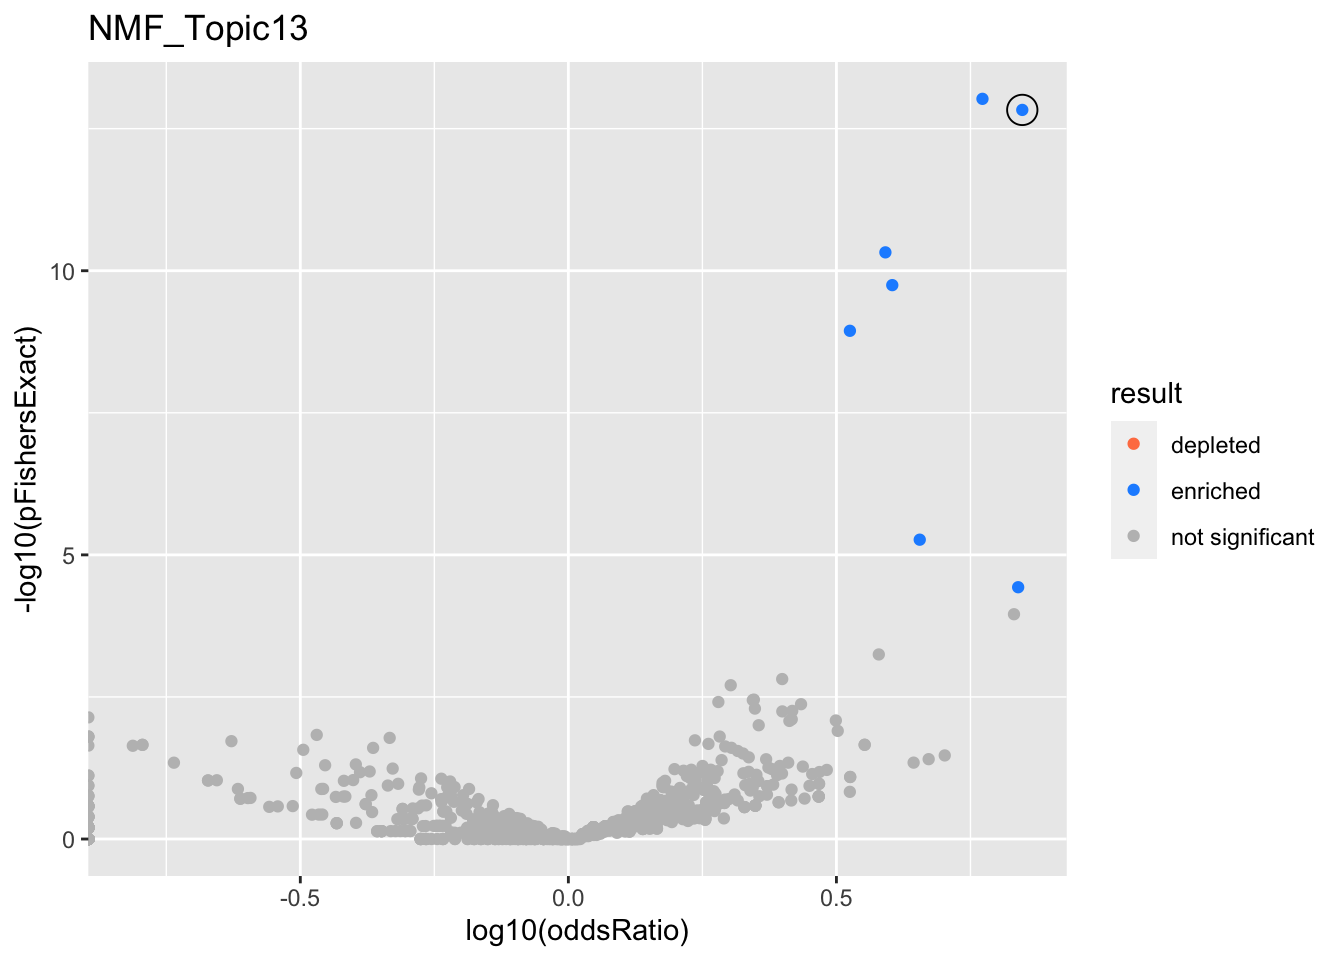
gobp_nr
| geneSet | description | alpha | beta | beta.se | pHypergeometric | pFishersExact | overlap | geneSetSize | oddsRatio |
|---|---|---|---|---|---|---|---|---|---|
| L1 | |||||||||
| GO:0070972 | protein localization to endoplasmic reticulum | 1 | 1.88 | 0.185 | 1.48e-13 | 1.48e-13 | 29 | 131 | 7.03 |
NMF_Topic14
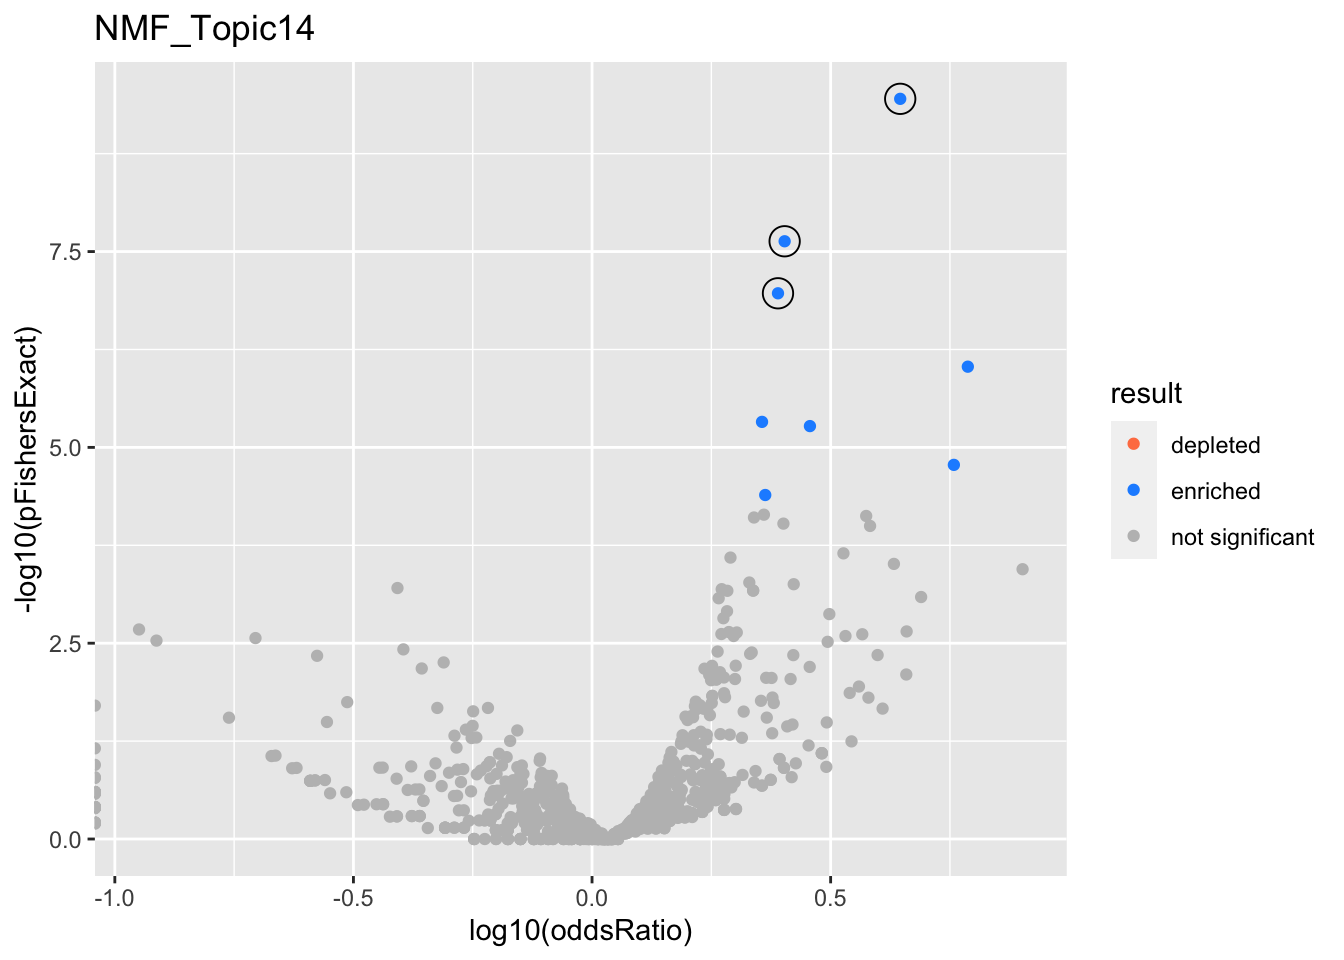
gobp_nr
| geneSet | description | alpha | beta | beta.se | pHypergeometric | pFishersExact | overlap | geneSetSize | oddsRatio |
|---|---|---|---|---|---|---|---|---|---|
| L1 | |||||||||
| GO:0070972 | protein localization to endoplasmic reticulum | 1 | 1.38 | 0.181 | 3.55e-10 | 3.55e-10 | 36 | 131 | 4.42 |
| L2 | |||||||||
| GO:0002446 | neutrophil mediated immunity | 0.849 | 0.818 | 0.111 | 1.84e-08 | 2.34e-08 | 68 | 386 | 2.53 |
| GO:0036230 | granulocyte activation | 0.151 | 0.795 | 0.111 | 7.98e-08 | 1.08e-07 | 66 | 384 | 2.45 |
NMF_Topic15
NMF_Topic16
NMF_Topic17
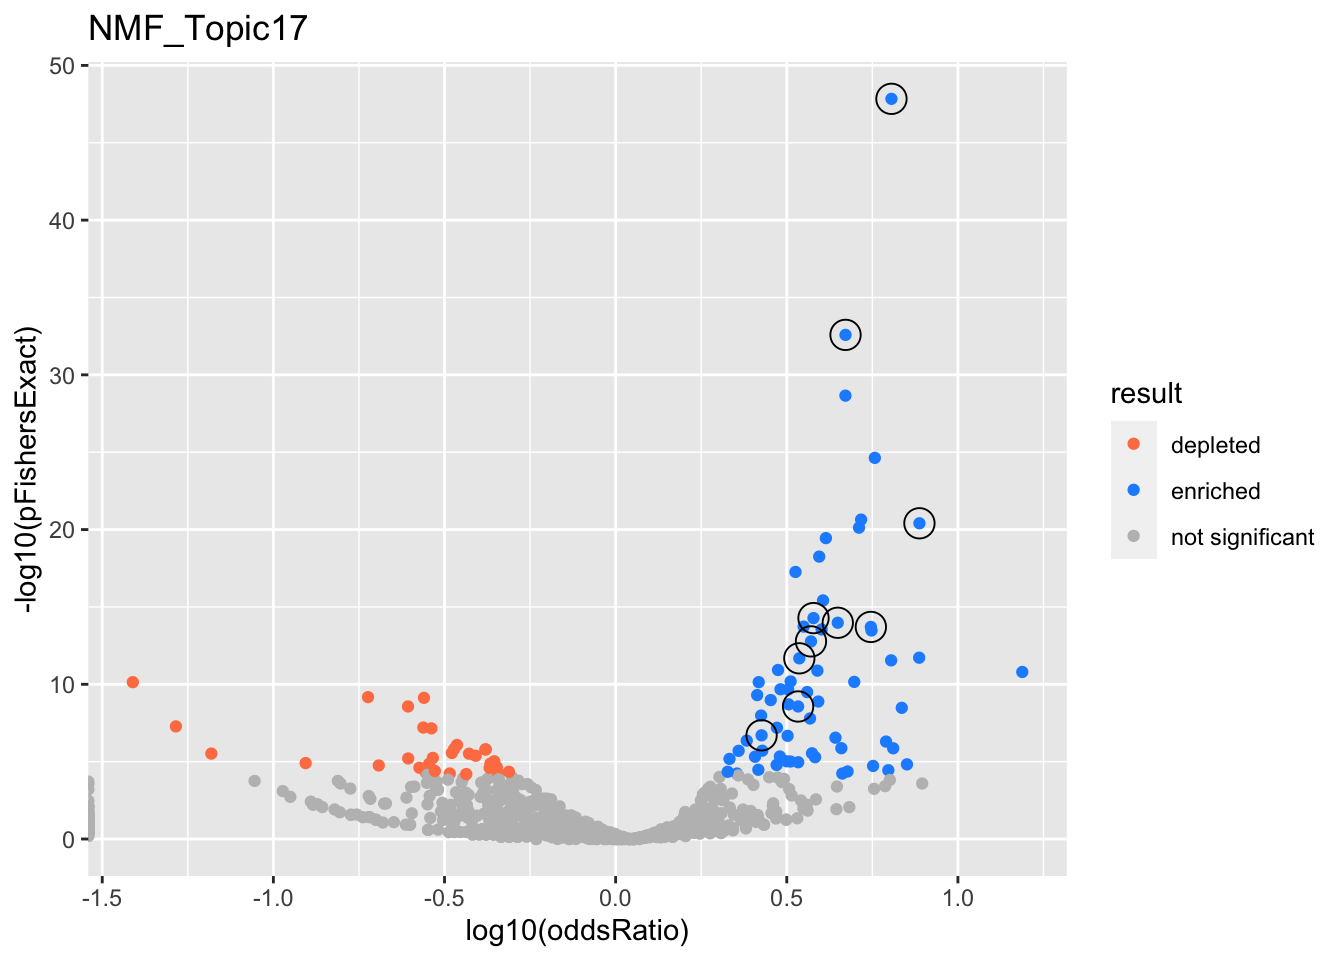
gobp_nr
| geneSet | description | alpha | beta | beta.se | pHypergeometric | pFishersExact | overlap | geneSetSize | oddsRatio |
|---|---|---|---|---|---|---|---|---|---|
| L1 | |||||||||
| GO:0022613 | ribonucleoprotein complex biogenesis | 1 | 1.51 | 0.104 | 1.45e-48 | 1.45e-48 | 154 | 391 | 6.39 |
| L10 | |||||||||
| GO:0009123 | nucleoside monophosphate metabolic process | 1 | 1.04 | 0.133 | 1.33e-07 | 1.99e-07 | 58 | 255 | 2.67 |
| L2 | |||||||||
| GO:0006397 | mRNA processing | 0.999 | 0.994 | 0.101 | 2.61e-33 | 2.61e-33 | 139 | 425 | 4.7 |
| L3 | |||||||||
| GO:0006414 | translational elongation | 1 | 1.76 | 0.185 | 1.96e-14 | 1.96e-14 | 46 | 121 | 5.57 |
| L4 | |||||||||
| GO:0007059 | chromosome segregation | 1 | 1.11 | 0.131 | 5.27e-15 | 5.27e-15 | 74 | 254 | 3.79 |
| L5 | |||||||||
| GO:0070646 | protein modification by small protein removal | 1 | 1.14 | 0.133 | 2.04e-12 | 2.1e-12 | 68 | 249 | 3.44 |
| L6 | |||||||||
| GO:0006260 | DNA replication | 1 | 1.01 | 0.137 | 1.69e-13 | 1.69e-13 | 67 | 232 | 3.72 |
| L7 | |||||||||
| GO:0006457 | protein folding | 1 | 1.26 | 0.156 | 2.37e-09 | 2.71e-09 | 49 | 179 | 3.41 |
| L8 | |||||||||
| GO:0071166 | ribonucleoprotein complex localization | 0.999 | 1.23 | 0.188 | 3.93e-21 | 3.93e-21 | 54 | 118 | 7.72 |
| L9 | |||||||||
| GO:0071824 | protein-DNA complex subunit organization | 1 | 1.13 | 0.155 | 1.05e-14 | 1.05e-14 | 59 | 180 | 4.46 |
NMF_Topic18
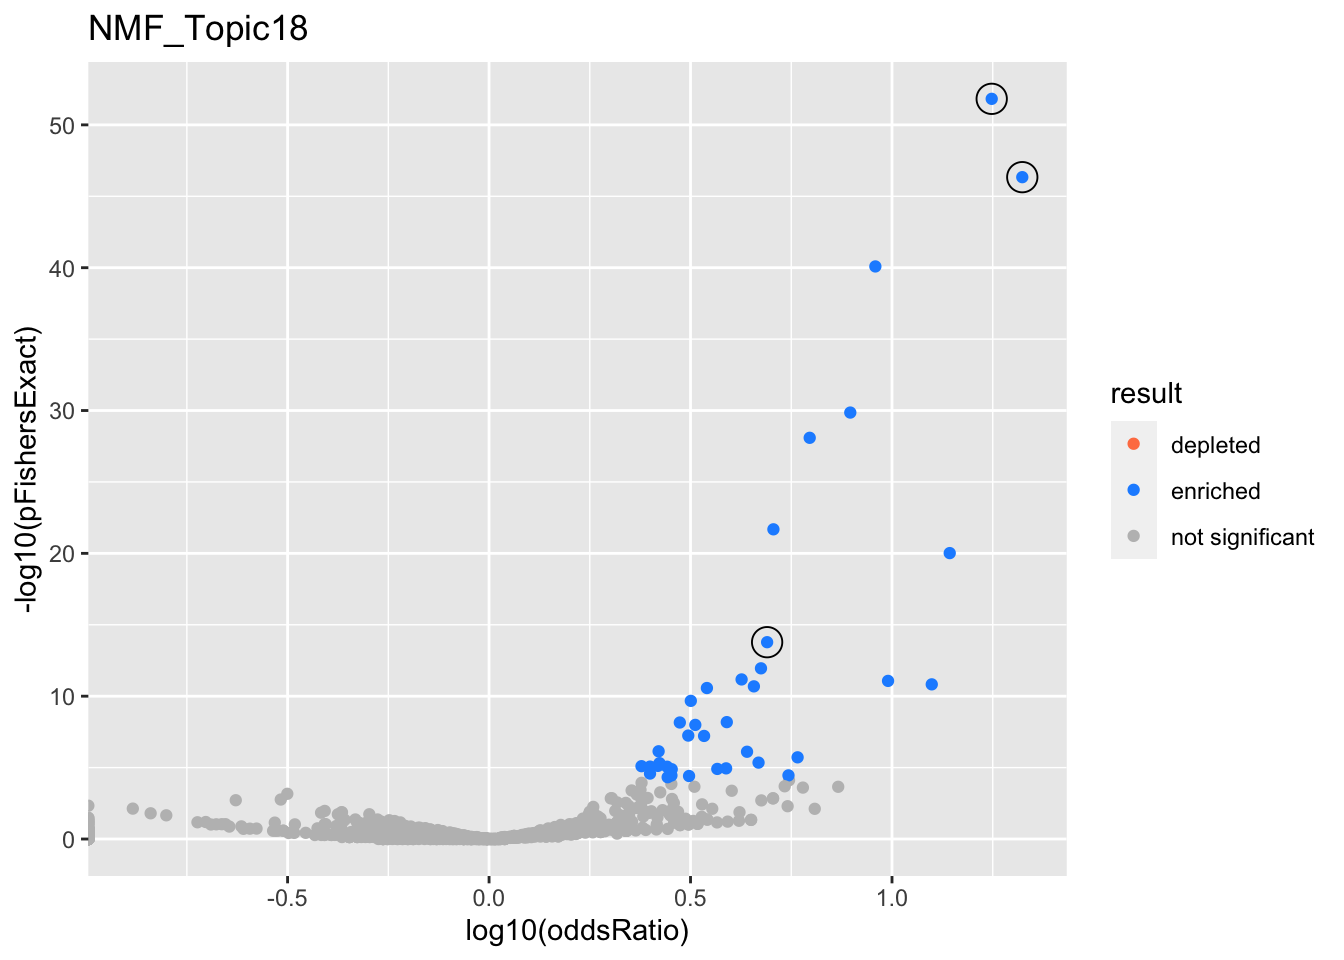
gobp_nr
| geneSet | description | alpha | beta | beta.se | pHypergeometric | pFishersExact | overlap | geneSetSize | oddsRatio |
|---|---|---|---|---|---|---|---|---|---|
| L1 | |||||||||
| GO:0006413 | translational initiation | 1 | 2 | 0.156 | 1.5e-52 | 1.5e-52 | 75 | 177 | 17.7 |
| L2 | |||||||||
| GO:0070972 | protein localization to endoplasmic reticulum | 1 | 1.79 | 0.181 | 4.58e-47 | 4.58e-47 | 62 | 131 | 21.1 |
| L3 | |||||||||
| GO:0009141 | nucleoside triphosphate metabolic process | 1 | 1.66 | 0.14 | 1.66e-14 | 1.66e-14 | 44 | 244 | 4.9 |
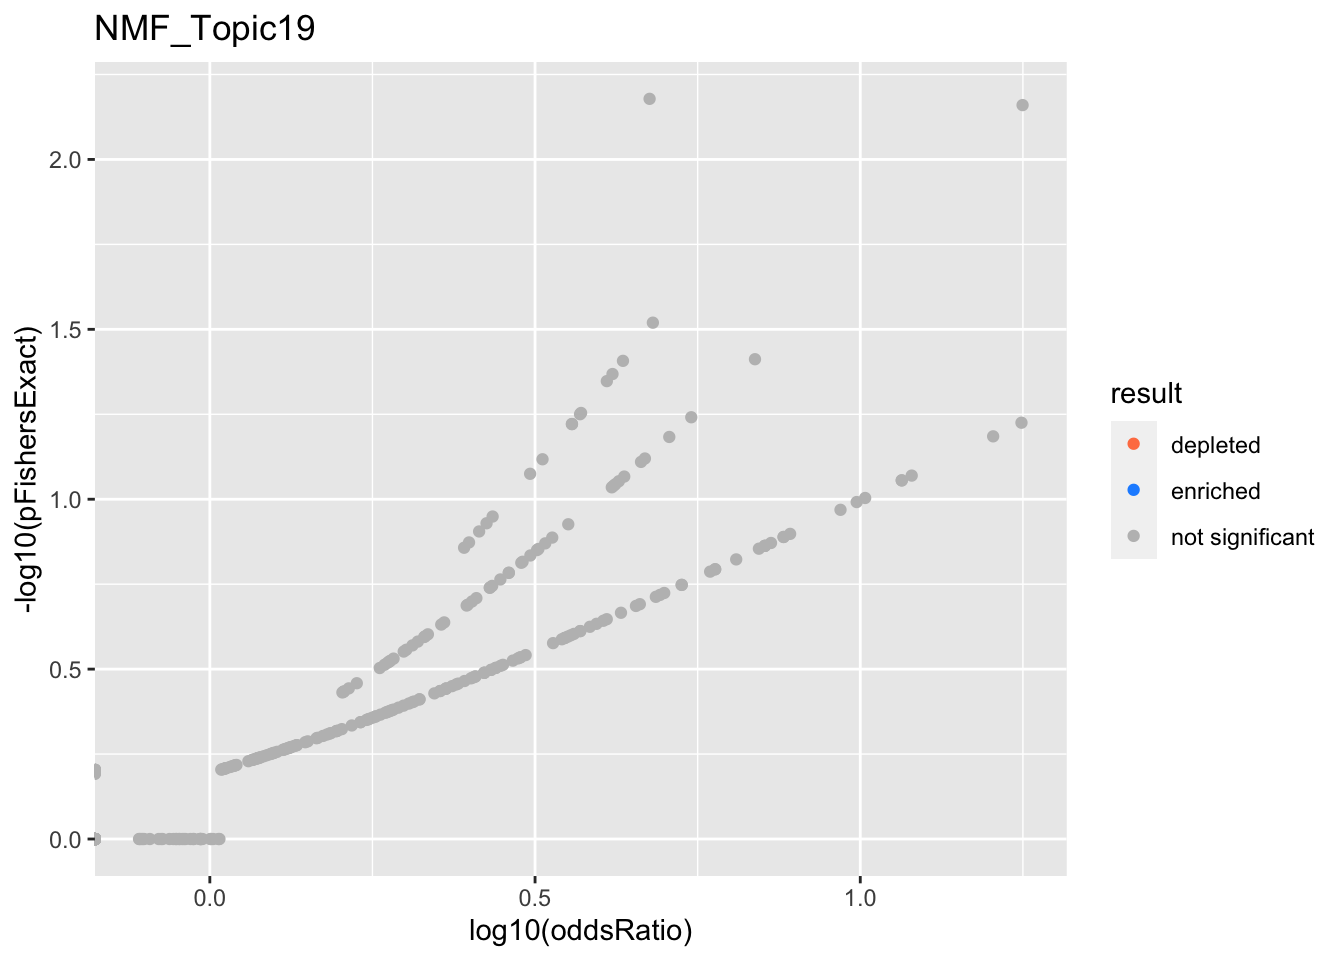
NMF_Topic19
NMF_Topic20
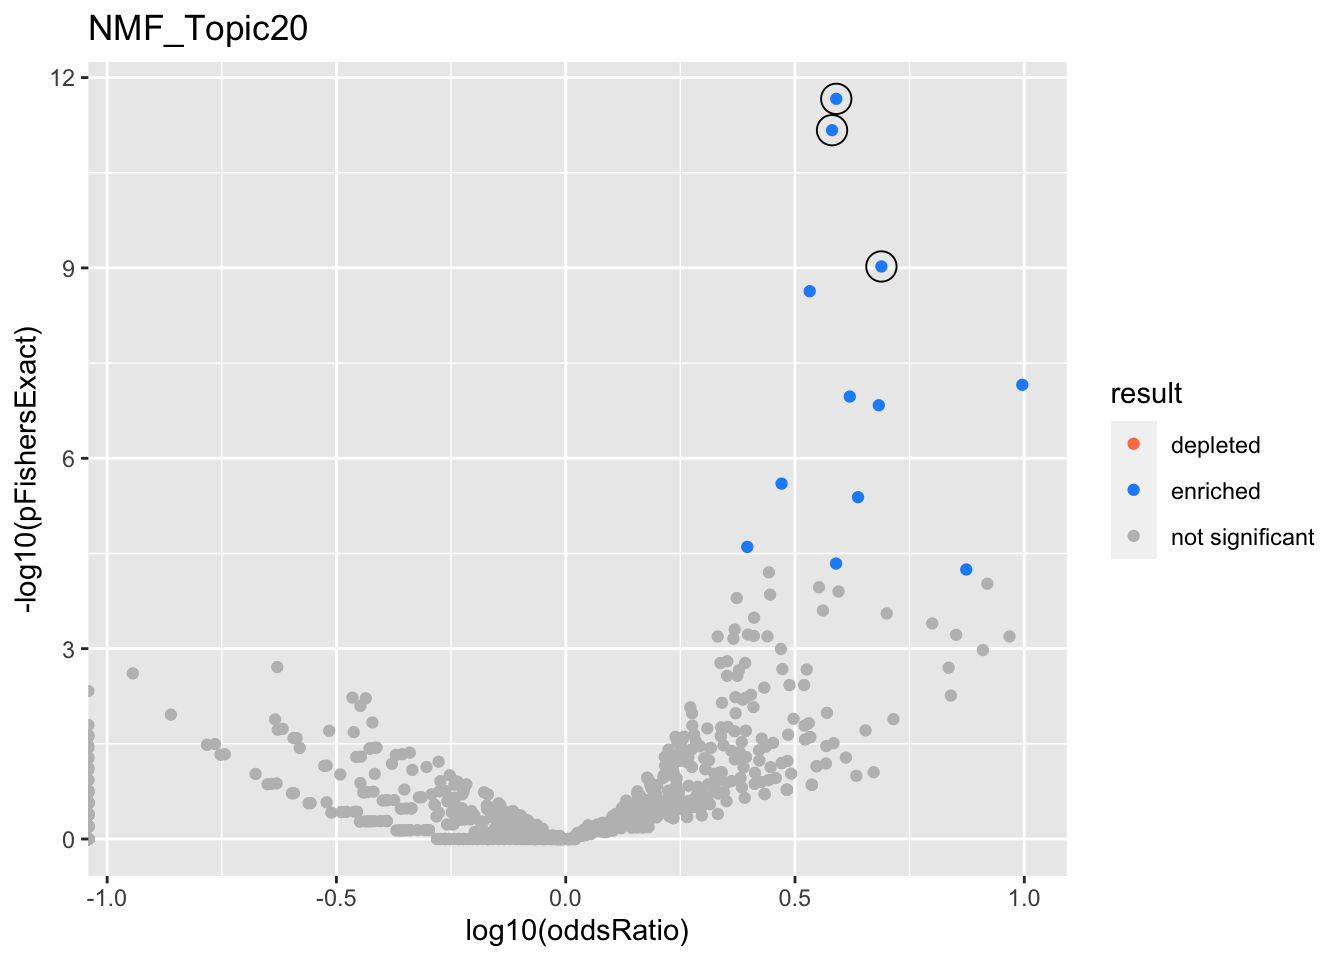
gobp_nr
| geneSet | description | alpha | beta | beta.se | pHypergeometric | pFishersExact | overlap | geneSetSize | oddsRatio |
|---|---|---|---|---|---|---|---|---|---|
| L1 | |||||||||
| GO:0002446 | neutrophil mediated immunity | 0.91 | 1.33 | 0.116 | 2.16e-12 | 2.16e-12 | 47 | 386 | 3.89 |
| GO:0036230 | granulocyte activation | 0.0903 | 1.31 | 0.117 | 6.76e-12 | 6.76e-12 | 46 | 384 | 3.81 |
| L2 | |||||||||
| GO:0006413 | translational initiation | 1 | 1.58 | 0.167 | 9.48e-10 | 9.48e-10 | 27 | 177 | 4.88 |
SNMF
res <- fits %>%
  filter(str_detect(experiment, '^SNMF*')) %>%
  get_plot_tbl(., ora)

html_tables <- fits %>%
  filter(str_detect(experiment, '^SNMF*')) %>%
  get_table_tbl(., ora)

experiments <- unique(res$experiment)
for (i in 1:length(experiments)){
  this_experiment <- experiments[i]
  cat("\n")
  cat("###", this_experiment, "\n") # Create second level headings with the names.

  # print volcano plot
  p <- do.volcano(res %>% filter(experiment == this_experiment)) +
    labs(title=this_experiment)
  print(p)

  cat("\n\n")

  # print table
  for(db in names(html_tables[[this_experiment]])){
    cat("####", db, "\n") # Create second level headings with the names.
    to_print <- html_tables[[this_experiment]][[db]] %>% distinct()
    to_print %>% report_susie_credible_sets() %>% htmltools::HTML() %>% print()
    cat("\n")
  }}
SNMF_Topic2
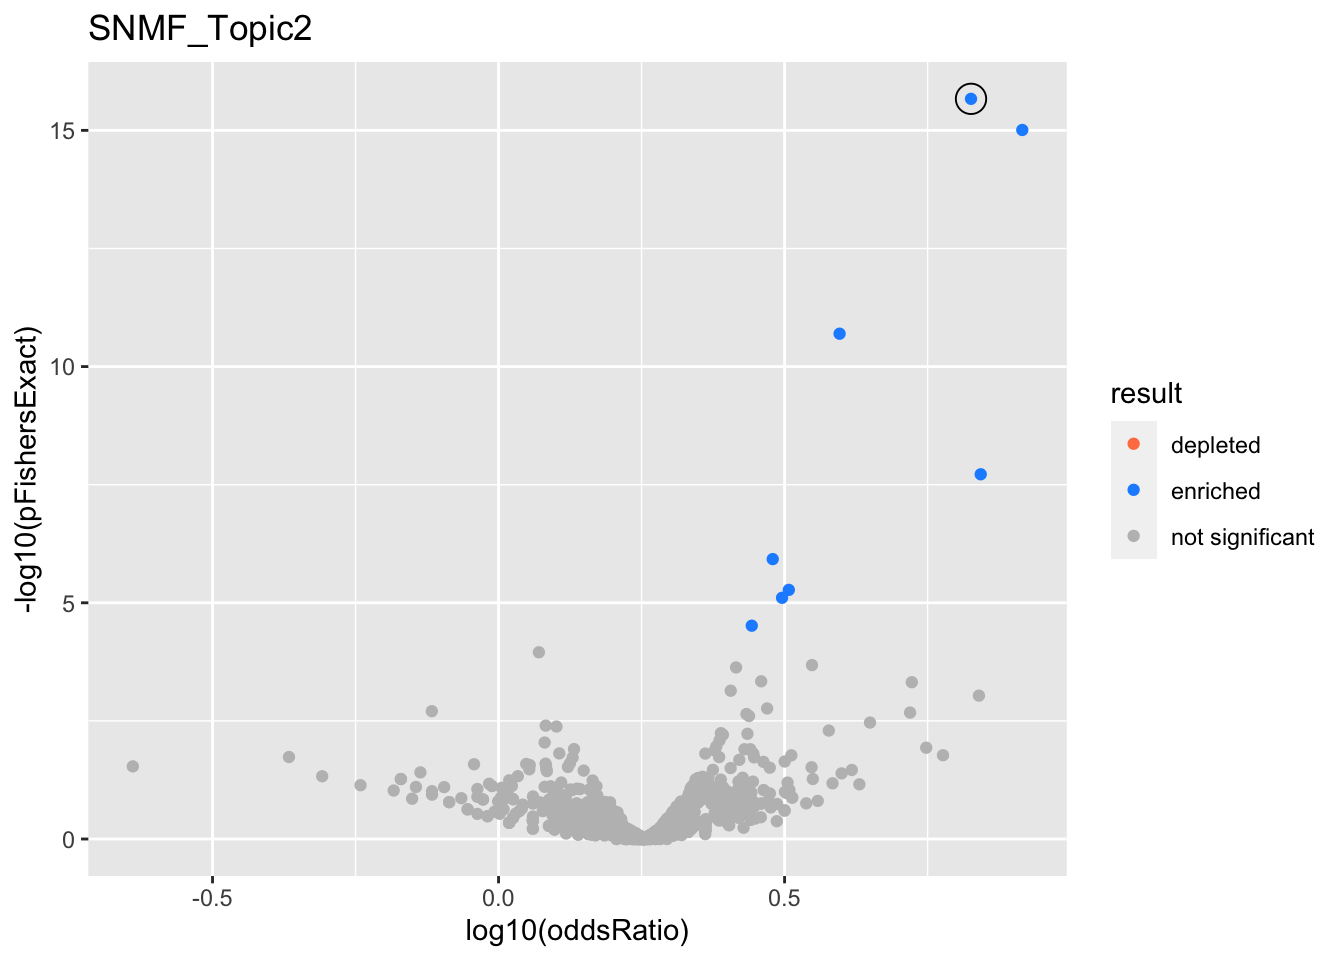
gobp_nr
| geneSet | description | alpha | beta | beta.se | pHypergeometric | pFishersExact | overlap | geneSetSize | oddsRatio |
|---|---|---|---|---|---|---|---|---|---|
| L1 | |||||||||
| GO:0006413 | translational initiation | 0.993 | 1.21 | 0.156 | 1.14e-16 | 2.15e-16 | 131 | 177 | 6.7 |
SNMF_Topic3
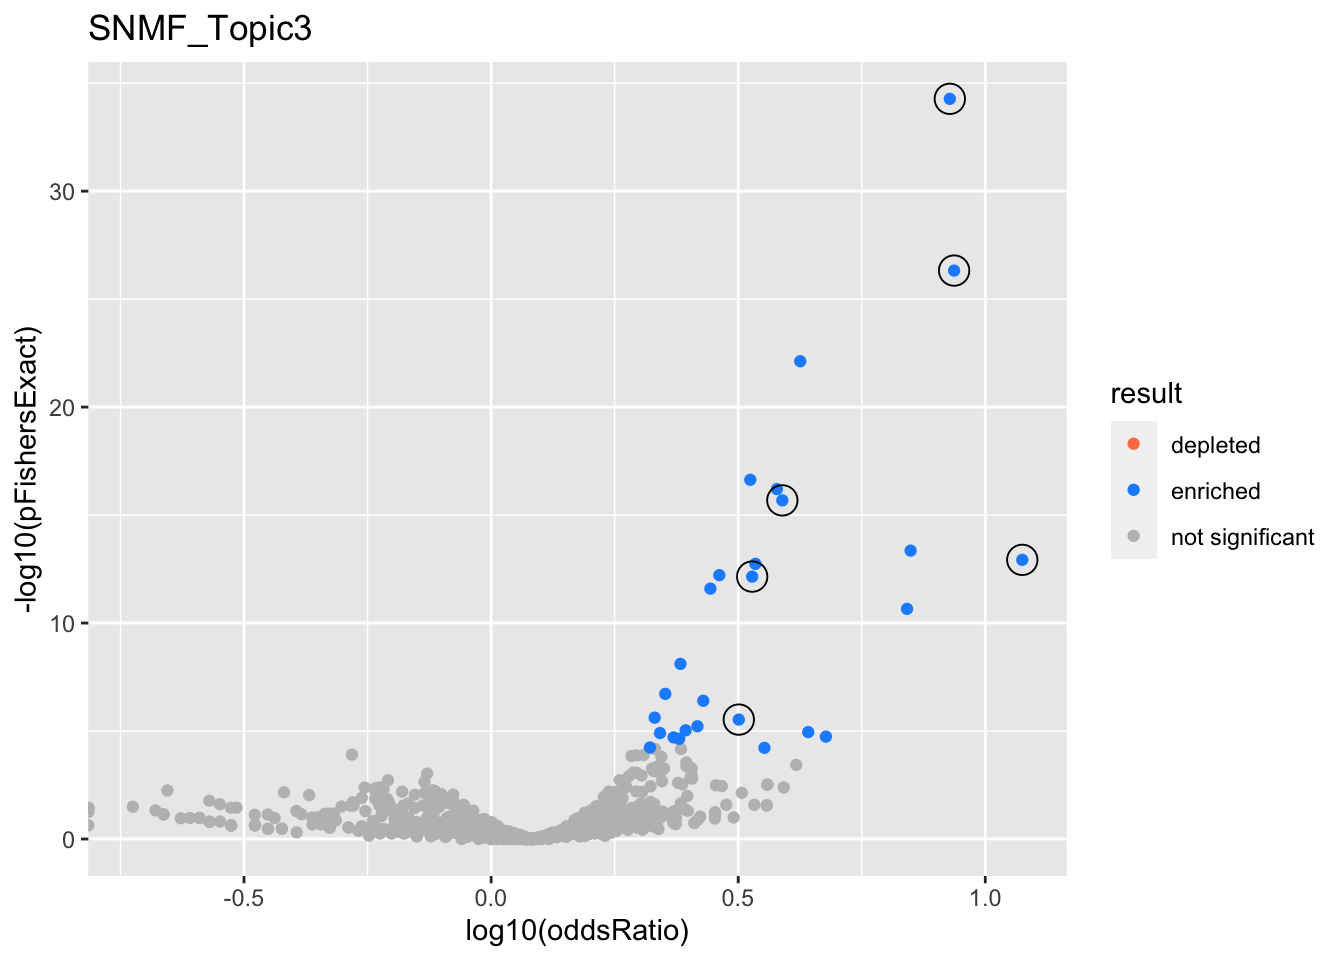
gobp_nr
| geneSet | description | alpha | beta | beta.se | pHypergeometric | pFishersExact | overlap | geneSetSize | oddsRatio |
|---|---|---|---|---|---|---|---|---|---|
| L1 | |||||||||
| GO:0006413 | translational initiation | 1 | 1.49 | 0.153 | 5.33e-35 | 5.33e-35 | 104 | 177 | 8.48 |
| L2 | |||||||||
| GO:0009141 | nucleoside triphosphate metabolic process | 0.998 | 0.975 | 0.13 | 1.71e-16 | 2.09e-16 | 97 | 244 | 3.88 |
| L3 | |||||||||
| GO:0070646 | protein modification by small protein removal | 1 | 1.04 | 0.128 | 5.44e-13 | 7.07e-13 | 91 | 249 | 3.38 |
| L4 | |||||||||
| GO:0070972 | protein localization to endoplasmic reticulum | 0.992 | 1.12 | 0.178 | 4.78e-27 | 4.78e-27 | 78 | 131 | 8.65 |
| L5 | |||||||||
| GO:0010257 | NADH dehydrogenase complex assembly | 0.976 | 1.67 | 0.299 | 1.18e-13 | 1.18e-13 | 31 | 46 | 11.9 |
| GO:0033108 | mitochondrial respiratory chain complex assembly | 0.0234 | 1.27 | 0.258 | 2.2e-11 | 2.2e-11 | 35 | 64 | 6.94 |
| L6 | |||||||||
| GO:0006414 | translational elongation | 0.991 | 0.962 | 0.183 | 1.77e-06 | 2.95e-06 | 43 | 121 | 3.17 |
SNMF_Topic4
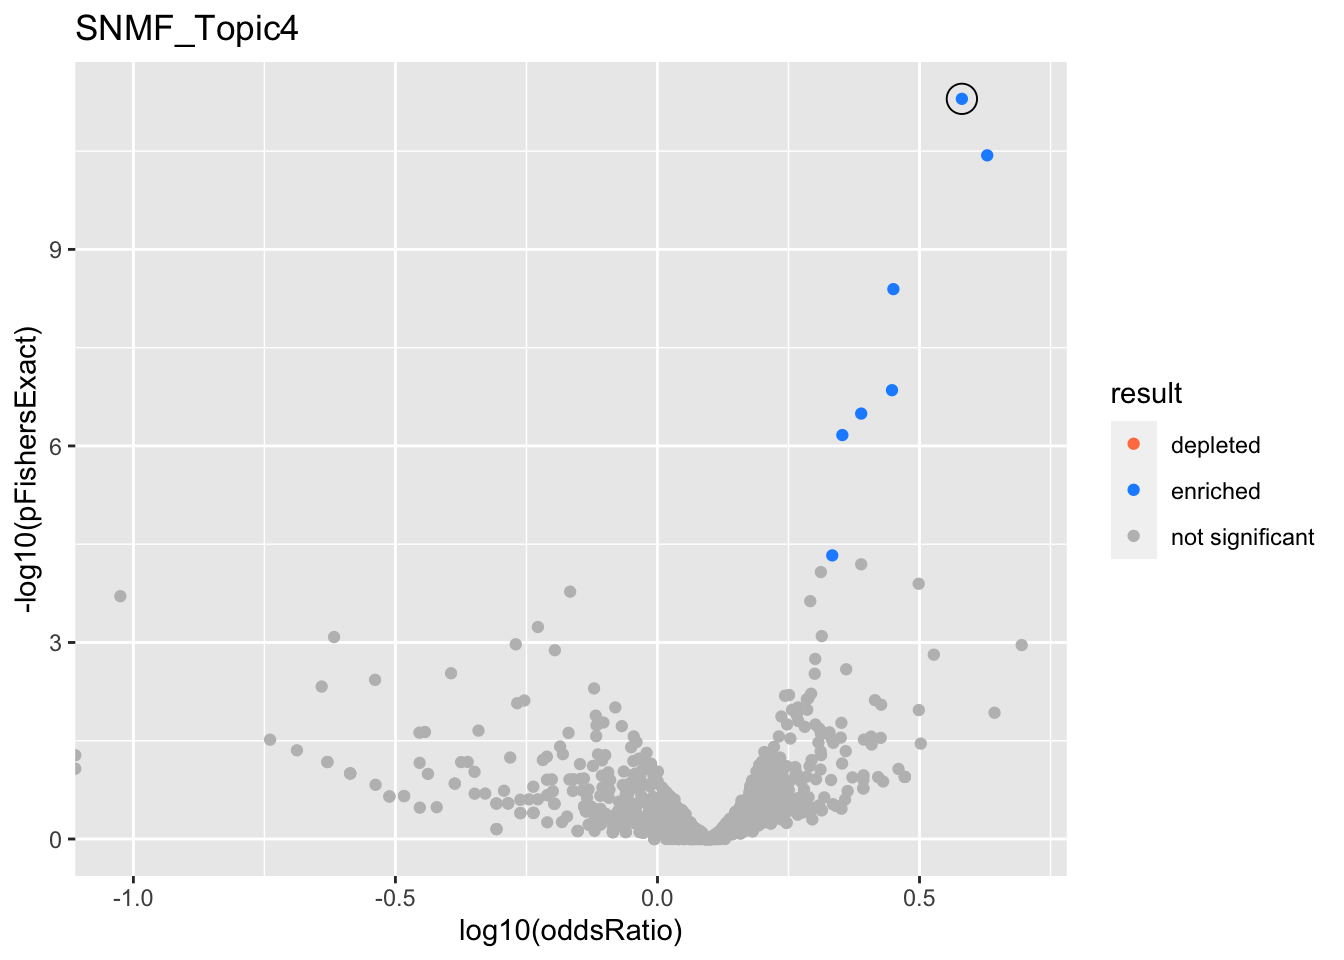
gobp_nr
| geneSet | description | alpha | beta | beta.se | pHypergeometric | pFishersExact | overlap | geneSetSize | oddsRatio |
|---|---|---|---|---|---|---|---|---|---|
| L1 | |||||||||
| GO:0006413 | translational initiation | 0.988 | 1.04 | 0.15 | 4.52e-12 | 5.04e-12 | 76 | 177 | 3.81 |
| GO:0070972 | protein localization to endoplasmic reticulum | 0.0122 | 1.11 | 0.177 | 3.3e-11 | 3.67e-11 | 60 | 131 | 4.26 |
SNMF_Topic5
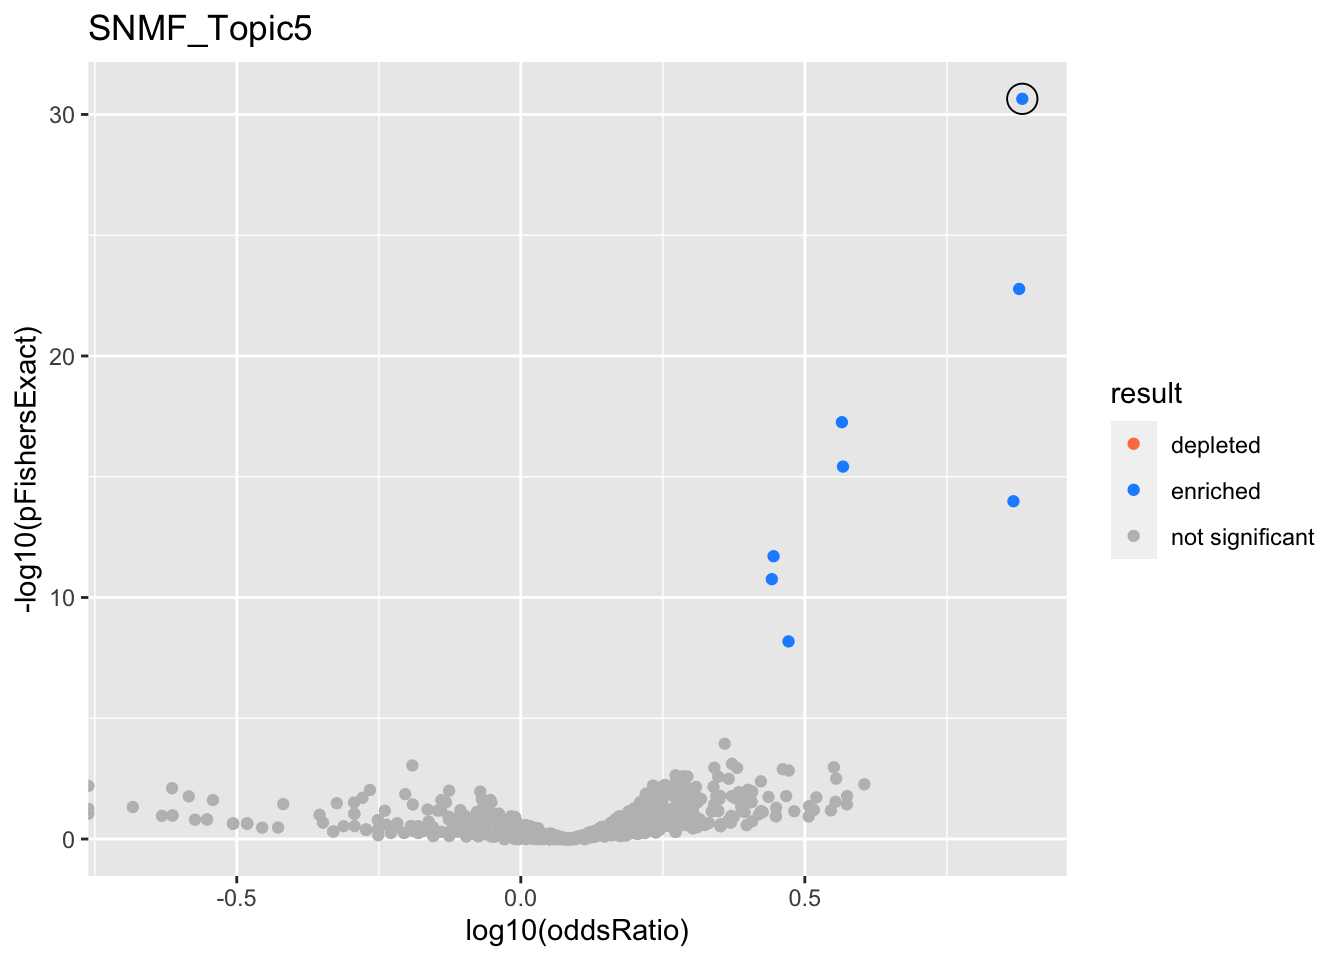
gobp_nr
| geneSet | description | alpha | beta | beta.se | pHypergeometric | pFishersExact | overlap | geneSetSize | oddsRatio |
|---|---|---|---|---|---|---|---|---|---|
| L1 | |||||||||
| GO:0006413 | translational initiation | 1 | 1.71 | 0.151 | 2.26e-31 | 2.26e-31 | 100 | 177 | 7.64 |
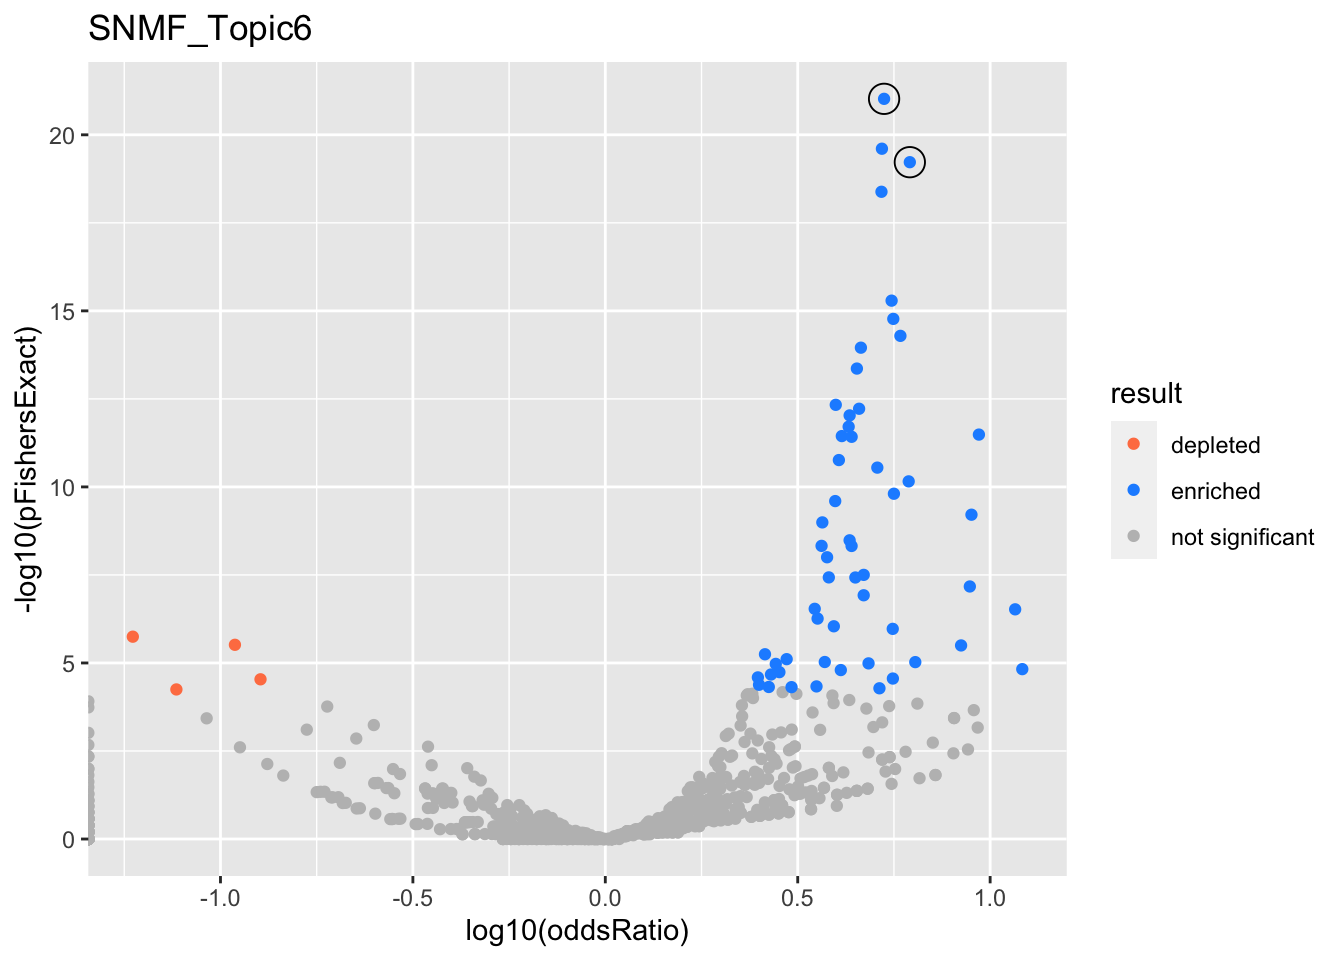
SNMF_Topic6
gobp_nr
| geneSet | description | alpha | beta | beta.se | pHypergeometric | pFishersExact | overlap | geneSetSize | oddsRatio |
|---|---|---|---|---|---|---|---|---|---|
| L1 | |||||||||
| GO:0002521 | leukocyte differentiation | 1 | 1.19 | 0.113 | 9.51e-22 | 9.51e-22 | 64 | 390 | 5.3 |
| L2 | |||||||||
| GO:0002250 | adaptive immune response | 1 | 1.19 | 0.135 | 5.99e-20 | 5.99e-20 | 50 | 263 | 6.18 |
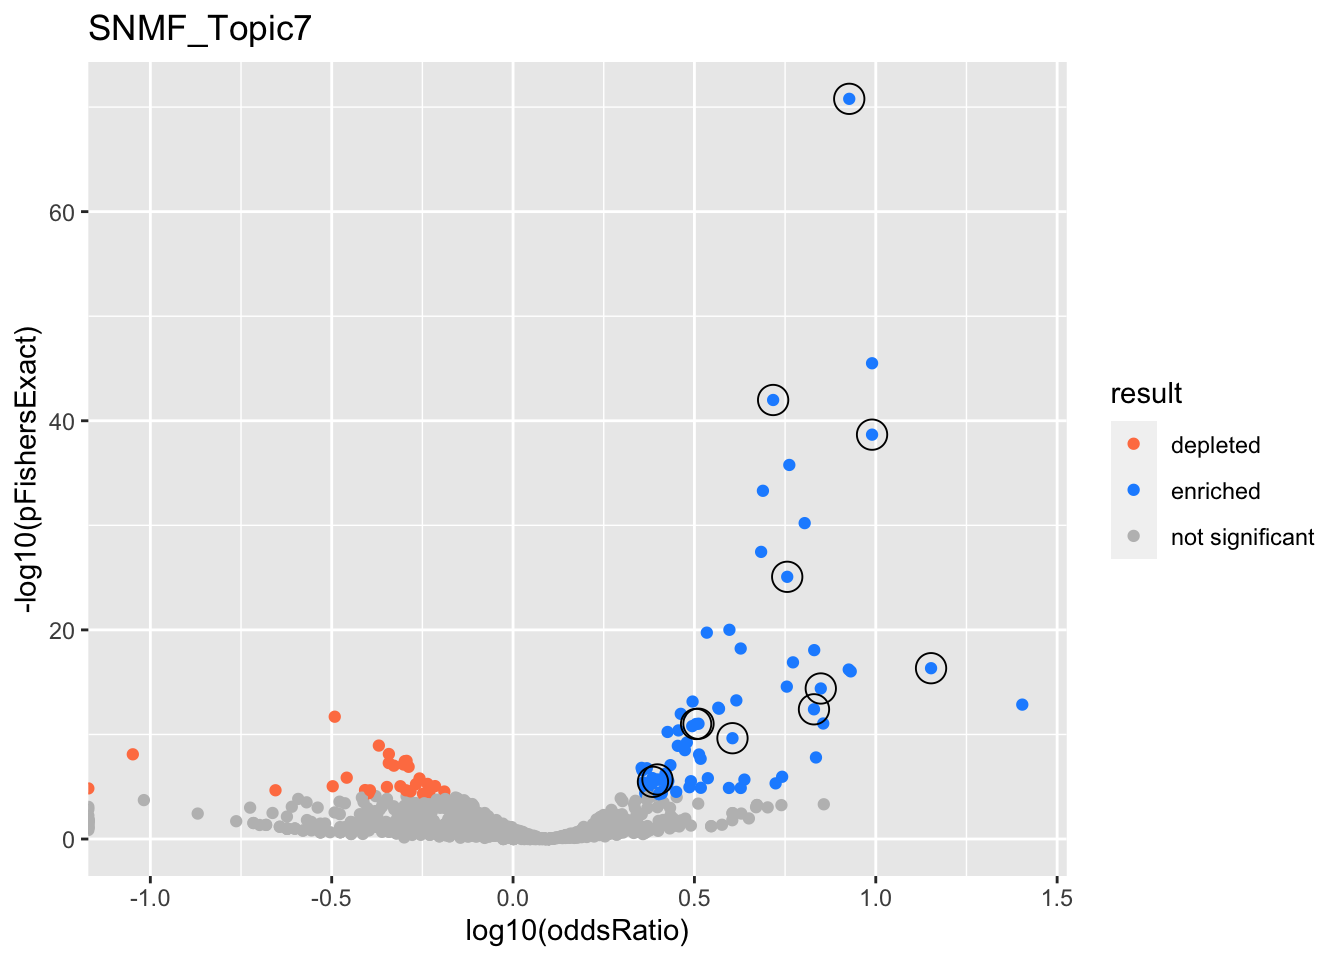
SNMF_Topic7
gobp_nr
| geneSet | description | alpha | beta | beta.se | pHypergeometric | pFishersExact | overlap | geneSetSize | oddsRatio |
|---|---|---|---|---|---|---|---|---|---|
| L1 | |||||||||
| GO:0022613 | ribonucleoprotein complex biogenesis | 1 | 1.41 | 0.104 | 1.63e-71 | 1.63e-71 | 236 | 391 | 8.45 |
| L10 | |||||||||
| GO:0098781 | ncRNA transcription | 0.929 | 1.25 | 0.221 | 4.02e-15 | 4.02e-15 | 51 | 88 | 7.05 |
| GO:0016073 | snRNA metabolic process | 0.0509 | 1.17 | 0.23 | 3.94e-13 | 3.94e-13 | 45 | 79 | 6.75 |
| GO:0006383 | transcription by RNA polymerase III | 0.0102 | 1.43 | 0.304 | 1.59e-08 | 1.59e-08 | 27 | 47 | 6.84 |
| L2 | |||||||||
| GO:0006413 | translational initiation | 1 | 1.67 | 0.156 | 2.13e-39 | 2.13e-39 | 115 | 177 | 9.77 |
| L3 | |||||||||
| GO:0006397 | mRNA processing | 1 | 0.965 | 0.0992 | 1.03e-42 | 1.03e-42 | 208 | 425 | 5.21 |
| L4 | |||||||||
| GO:0070646 | protein modification by small protein removal | 1 | 0.983 | 0.128 | 5.73e-12 | 9.41e-12 | 96 | 249 | 3.25 |
| L5 | |||||||||
| GO:0006360 | transcription by RNA polymerase I | 0.998 | 1.72 | 0.292 | 4.62e-17 | 4.62e-17 | 39 | 53 | 14.2 |
| L6 | |||||||||
| GO:0007059 | chromosome segregation | 1 | 0.938 | 0.128 | 8.49e-12 | 9.99e-12 | 97 | 254 | 3.2 |
| L7 | |||||||||
| GO:0009123 | nucleoside monophosphate metabolic process | 0.731 | 0.813 | 0.128 | 2.19e-06 | 3.4e-06 | 82 | 255 | 2.43 |
| GO:0009141 | nucleoside triphosphate metabolic process | 0.261 | 0.811 | 0.131 | 1.24e-06 | 2.01e-06 | 80 | 244 | 2.5 |
| L8 | |||||||||
| GO:0006403 | RNA localization | 0.99 | 0.886 | 0.141 | 8.39e-26 | 8.39e-26 | 110 | 211 | 5.7 |
| GO:0051169 | nuclear transport | 0.00854 | 0.659 | 0.12 | 8.28e-21 | 9.79e-21 | 133 | 310 | 3.95 |
| L9 | |||||||||
| GO:0006338 | chromatin remodeling | 0.962 | 0.986 | 0.175 | 1.73e-10 | 2.29e-10 | 59 | 134 | 4.03 |
| GO:0006260 | DNA replication | 0.0117 | 0.678 | 0.14 | 1.84e-09 | 3.17e-09 | 85 | 232 | 2.98 |
| GO:0071824 | protein-DNA complex subunit organization | 0.0112 | 0.748 | 0.156 | 5.24e-14 | 5.54e-14 | 80 | 180 | 4.13 |
| GO:0016569 | covalent chromatin modification | 0.0065 | 0.518 | 0.109 | 4.55e-11 | 5.77e-11 | 131 | 387 | 2.67 |
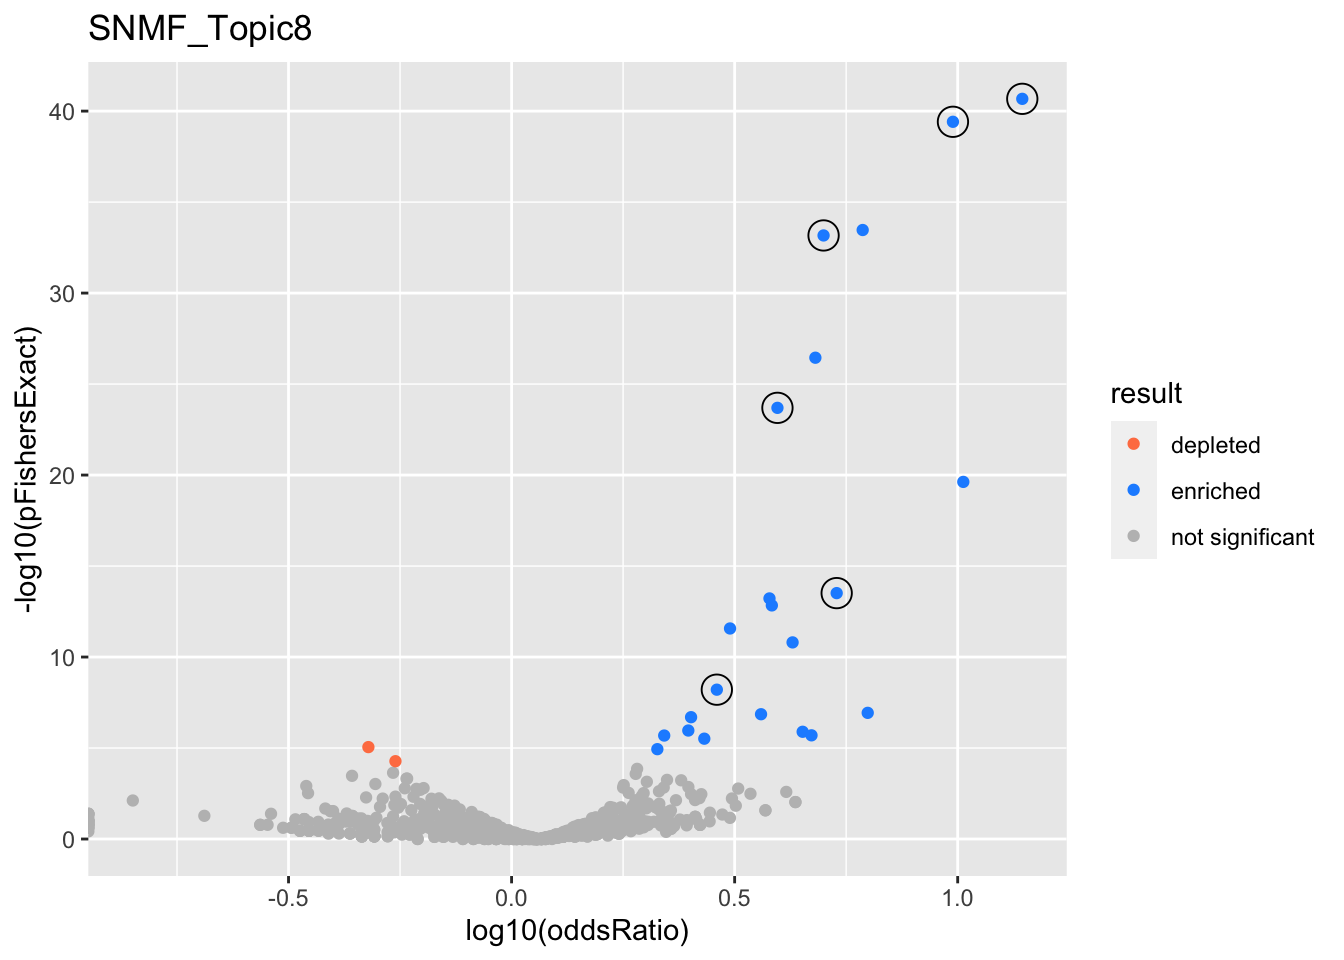
SNMF_Topic8
gobp_nr
| geneSet | description | alpha | beta | beta.se | pHypergeometric | pFishersExact | overlap | geneSetSize | oddsRatio |
|---|---|---|---|---|---|---|---|---|---|
| L1 | |||||||||
| GO:0070972 | protein localization to endoplasmic reticulum | 0.996 | 1.08 | 0.183 | 2.12e-41 | 2.12e-41 | 84 | 131 | 14 |
| L2 | |||||||||
| GO:0022613 | ribonucleoprotein complex biogenesis | 1 | 0.881 | 0.106 | 1.96e-24 | 2.03e-24 | 130 | 391 | 3.94 |
| L3 | |||||||||
| GO:0006414 | translational elongation | 1 | 1.52 | 0.183 | 3.07e-14 | 3.07e-14 | 50 | 121 | 5.35 |
| L4 | |||||||||
| GO:0009141 | nucleoside triphosphate metabolic process | 0.999 | 0.979 | 0.133 | 4.81e-09 | 6.22e-09 | 67 | 244 | 2.88 |
| L5 | |||||||||
| GO:0006413 | translational initiation | 1 | 1.12 | 0.157 | 3.87e-40 | 3.87e-40 | 98 | 177 | 9.76 |
| L6 | |||||||||
| GO:0006605 | protein targeting | 1 | 0.865 | 0.11 | 6.81e-34 | 6.81e-34 | 140 | 364 | 5 |
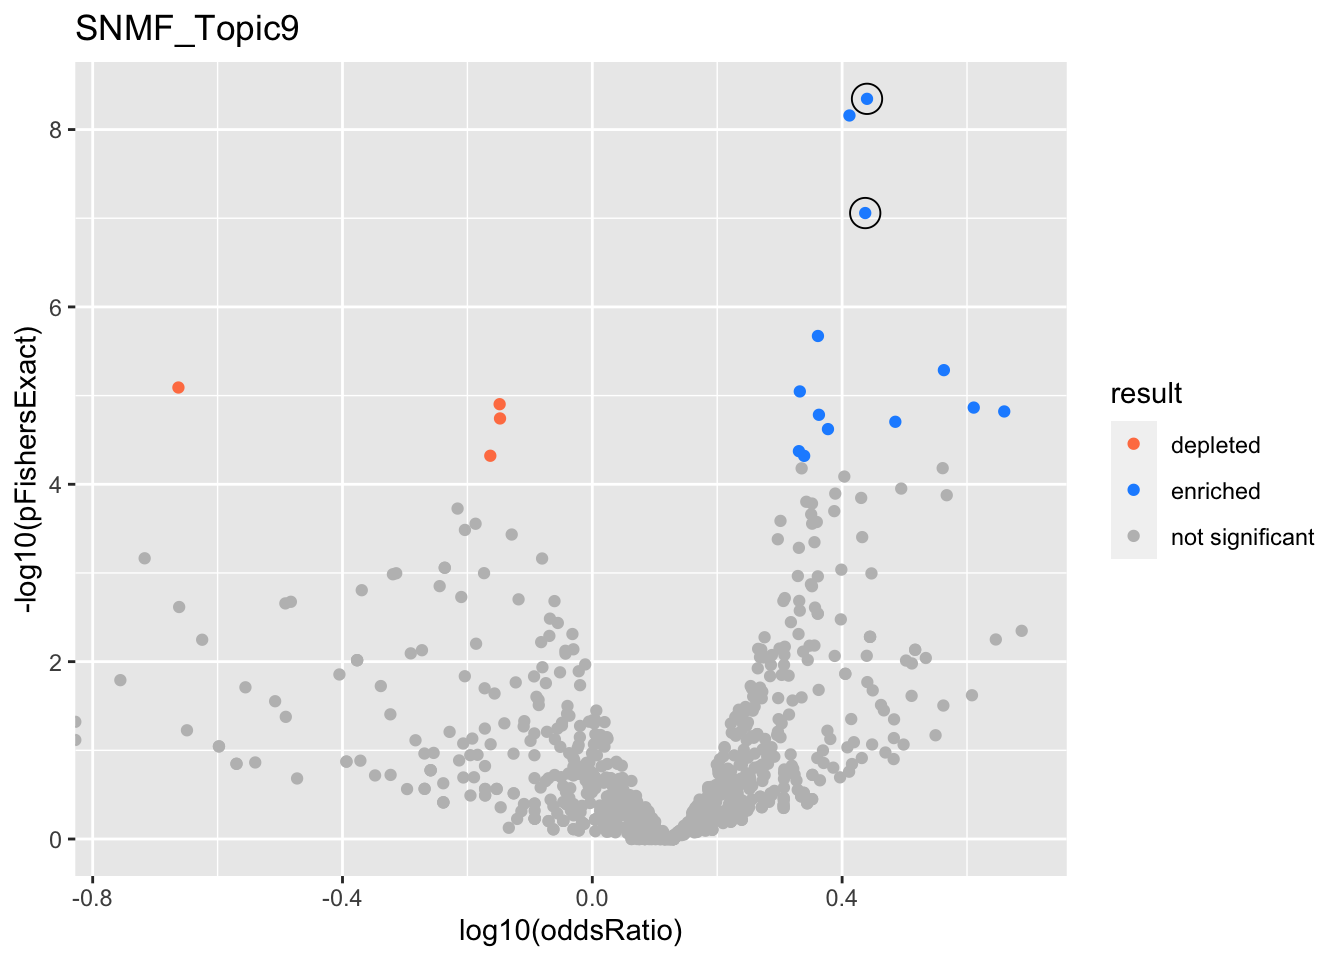
SNMF_Topic9
gobp_nr
| geneSet | description | alpha | beta | beta.se | pHypergeometric | pFishersExact | overlap | geneSetSize | oddsRatio |
|---|---|---|---|---|---|---|---|---|---|
| L1 | |||||||||
| GO:0006401 | RNA catabolic process | 0.999 | 0.694 | 0.114 | 2.96e-09 | 4.51e-09 | 121 | 304 | 2.75 |
| L2 | |||||||||
| GO:0006520 | cellular amino acid metabolic process | 0.999 | 0.707 | 0.125 | 6.39e-08 | 8.74e-08 | 101 | 254 | 2.74 |
SNMF_Topic10
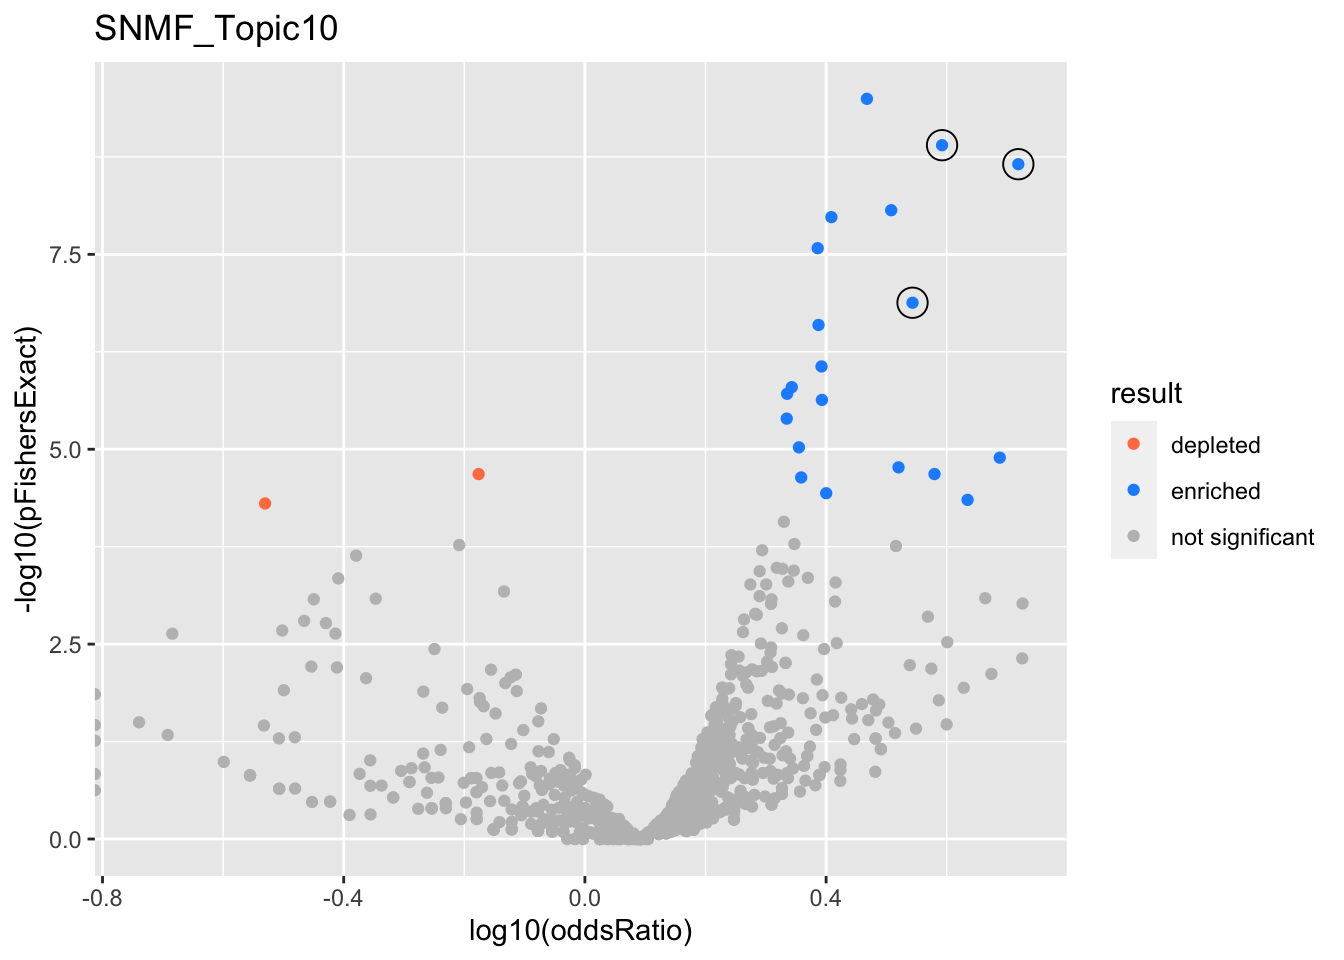
gobp_nr
| geneSet | description | alpha | beta | beta.se | pHypergeometric | pFishersExact | overlap | geneSetSize | oddsRatio |
|---|---|---|---|---|---|---|---|---|---|
| L1 | |||||||||
| GO:0070972 | protein localization to endoplasmic reticulum | 0.962 | 1.14 | 0.174 | 7.35e-10 | 1.26e-09 | 55 | 131 | 3.91 |
| GO:0090150 | establishment of protein localization to membrane | 0.0299 | 0.775 | 0.128 | 2.63e-10 | 3.2e-10 | 93 | 266 | 2.94 |
| L2 | |||||||||
| GO:0048013 | ephrin receptor signaling pathway | 0.998 | 1.26 | 0.229 | 2.21e-09 | 2.21e-09 | 37 | 75 | 5.23 |
| L3 | |||||||||
| GO:0038127 | ERBB signaling pathway | 0.971 | 0.893 | 0.181 | 1.02e-07 | 1.32e-07 | 48 | 122 | 3.49 |
| GO:0070671 | response to interleukin-12 | 0.00272 | 1.04 | 0.305 | 1.28e-05 | 1.28e-05 | 21 | 44 | 4.88 |
| GO:1990823 | response to leukemia inhibitory factor | 0.00161 | 0.737 | 0.221 | 1.53e-05 | 1.71e-05 | 34 | 89 | 3.31 |
| GO:0034109 | homotypic cell-cell adhesion | 0.00152 | 0.836 | 0.255 | 1.96e-05 | 2.08e-05 | 27 | 65 | 3.8 |
| GO:0007015 | actin filament organization | 0.00131 | 0.404 | 0.117 | 6.55e-09 | 1.05e-08 | 105 | 329 | 2.56 |
| GO:0046847 | filopodium assembly | 0.00118 | 0.933 | 0.296 | 4.46e-05 | 4.46e-05 | 21 | 47 | 4.31 |
| GO:0034330 | cell junction organization | 0.000818 | 0.442 | 0.134 | 1.32e-06 | 2.33e-06 | 78 | 249 | 2.47 |
| GO:0002446 | neutrophil mediated immunity | 0.000789 | 0.362 | 0.108 | 1.08e-06 | 1.6e-06 | 111 | 386 | 2.2 |
| GO:0008544 | epidermis development | 0.000718 | 0.433 | 0.133 | 1.6e-05 | 2.3e-05 | 76 | 256 | 2.28 |
| GO:0072337 | modified amino acid transport | 0.000602 | 1.16 | 0.412 | 0.000954 | 0.000954 | 11 | 22 | 5.32 |
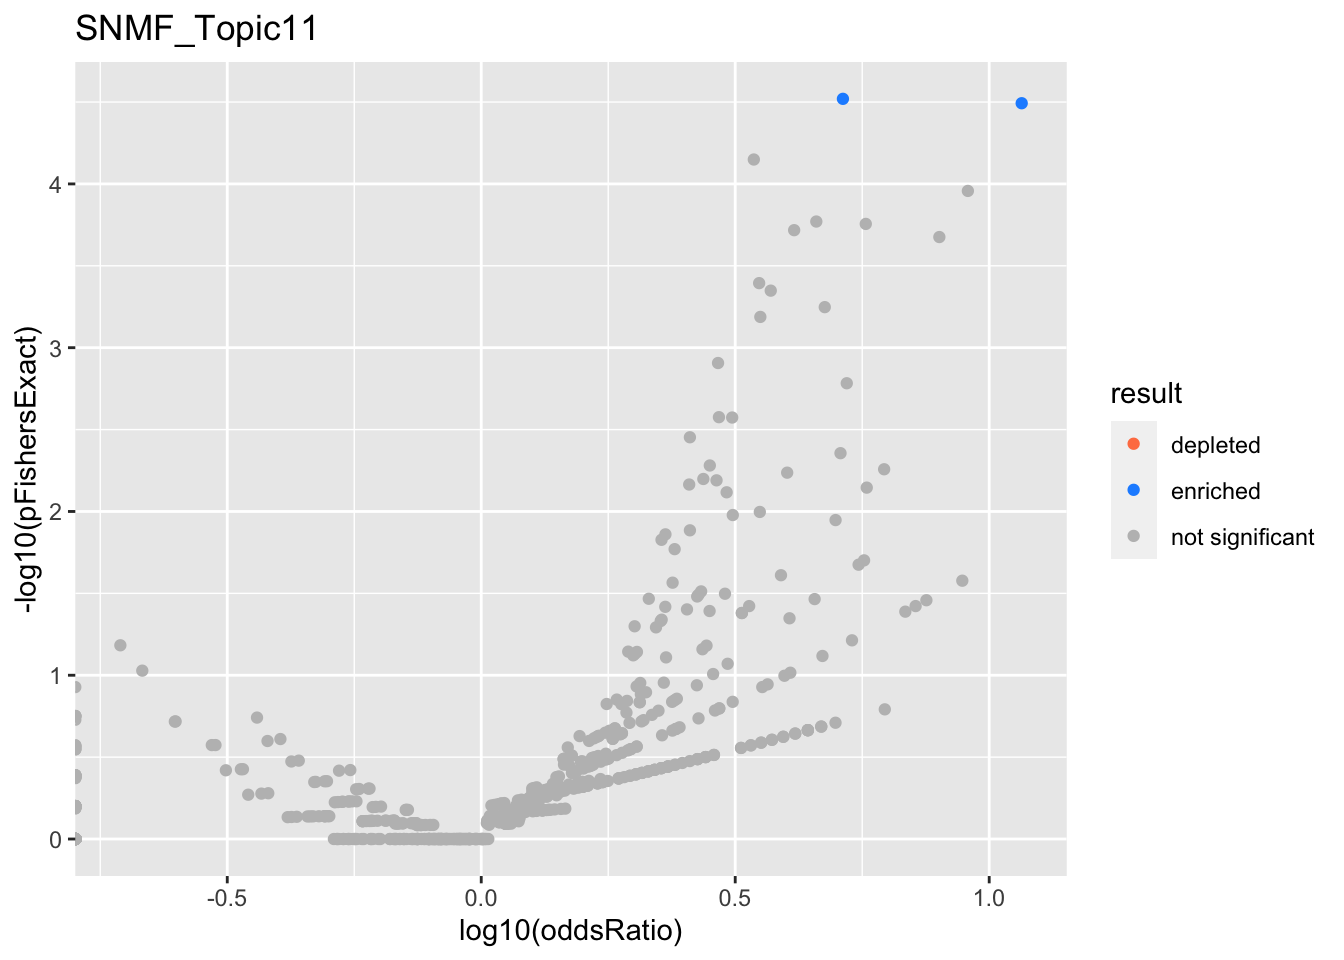
SNMF_Topic11
SNMF_Topic12
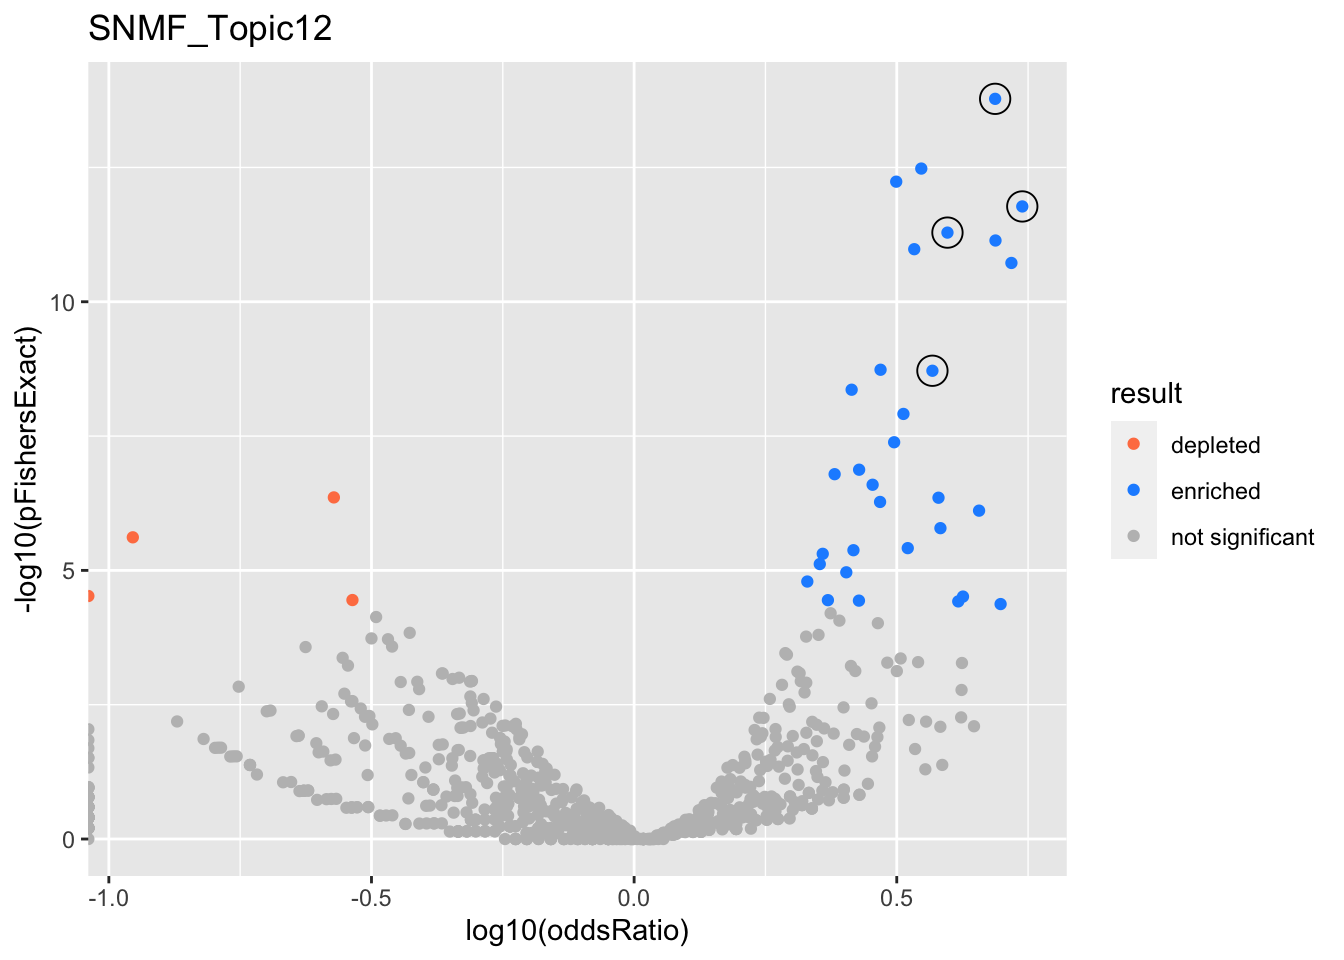
gobp_nr
| geneSet | description | alpha | beta | beta.se | pHypergeometric | pFishersExact | overlap | geneSetSize | oddsRatio |
|---|---|---|---|---|---|---|---|---|---|
| L1 | |||||||||
| GO:0006413 | translational initiation | 1 | 1.4 | 0.157 | 1.67e-14 | 1.67e-14 | 48 | 177 | 4.87 |
| L2 | |||||||||
| GO:0006414 | translational elongation | 0.999 | 1.61 | 0.187 | 1.68e-12 | 1.68e-12 | 36 | 121 | 5.48 |
| L3 | |||||||||
| GO:0006403 | RNA localization | 0.998 | 1.15 | 0.146 | 5.16e-12 | 5.16e-12 | 49 | 211 | 3.95 |
| L4 | |||||||||
| GO:0071824 | protein-DNA complex subunit organization | 1 | 1.2 | 0.158 | 1.92e-09 | 1.92e-09 | 40 | 180 | 3.7 |
SNMF_Topic13
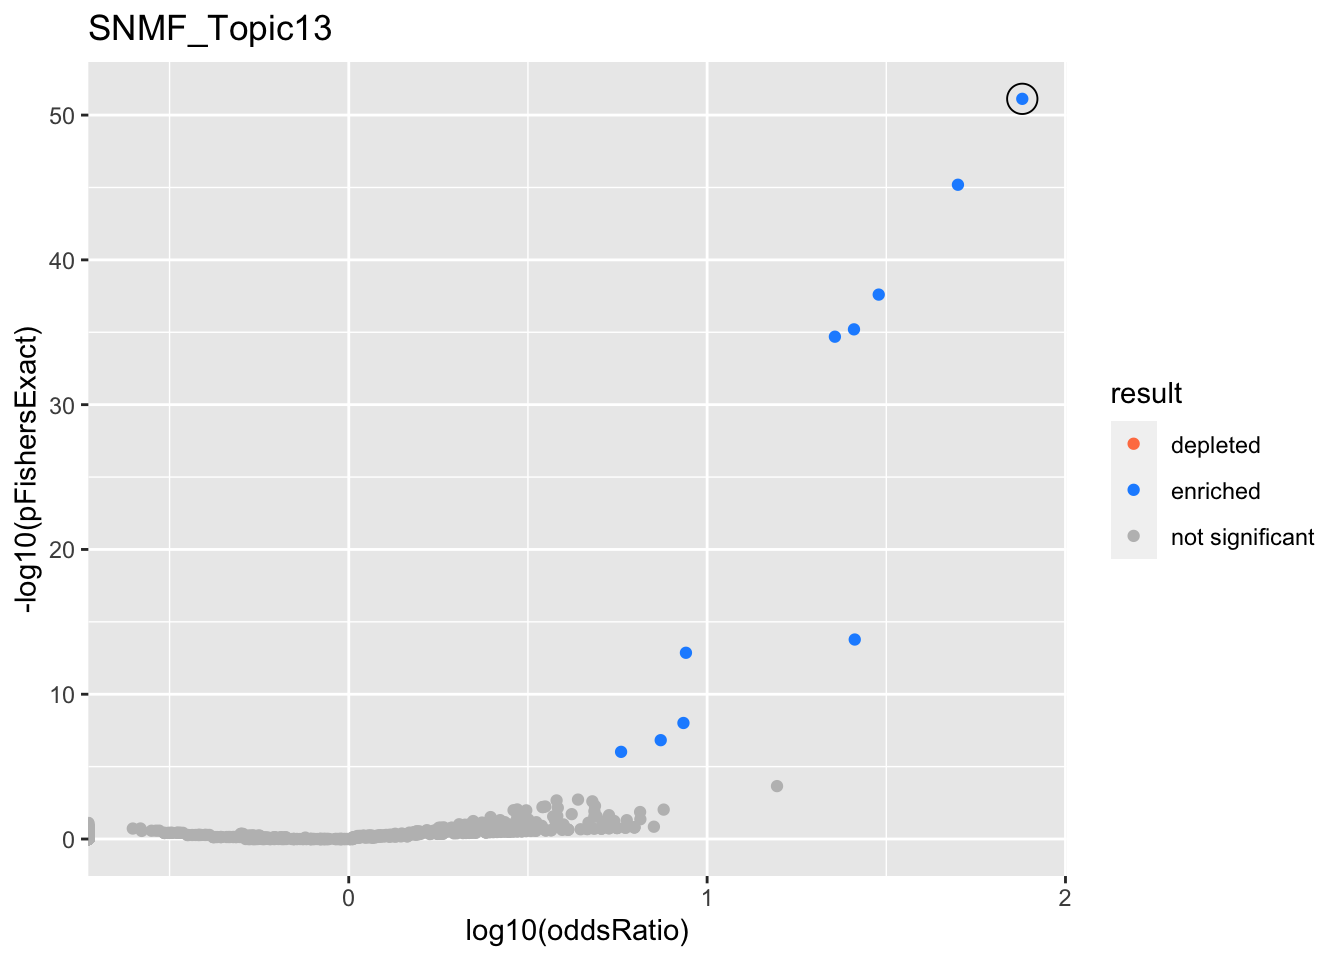
gobp_nr
| geneSet | description | alpha | beta | beta.se | pHypergeometric | pFishersExact | overlap | geneSetSize | oddsRatio |
|---|---|---|---|---|---|---|---|---|---|
| L1 | |||||||||
| GO:0070972 | protein localization to endoplasmic reticulum | 1 | 4.29 | 0.18 | 7.55e-52 | 7.55e-52 | 40 | 131 | 75.8 |
SNMF_Topic14
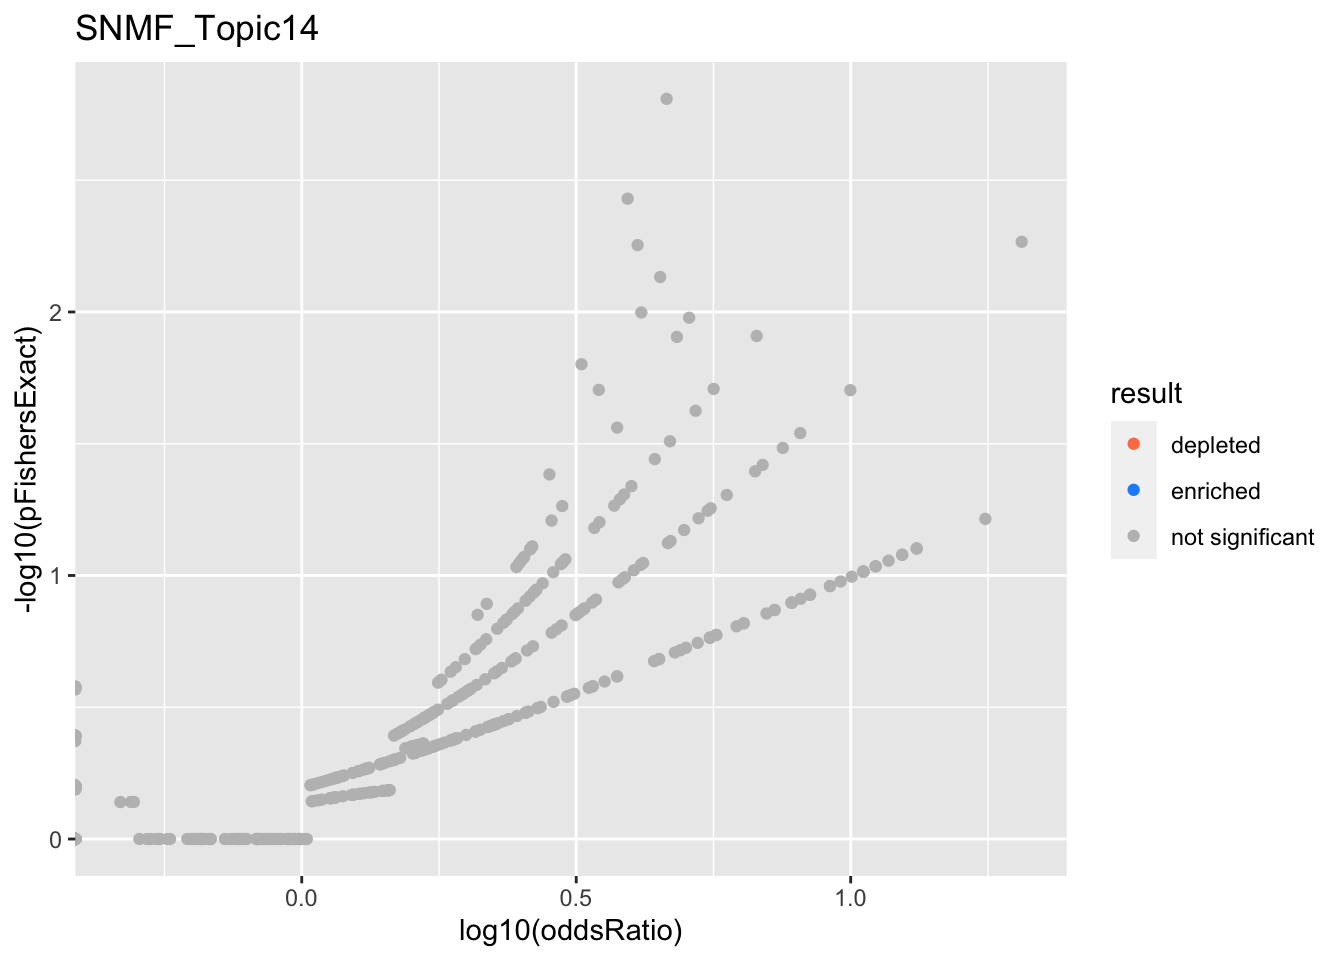
SNMF_Topic15
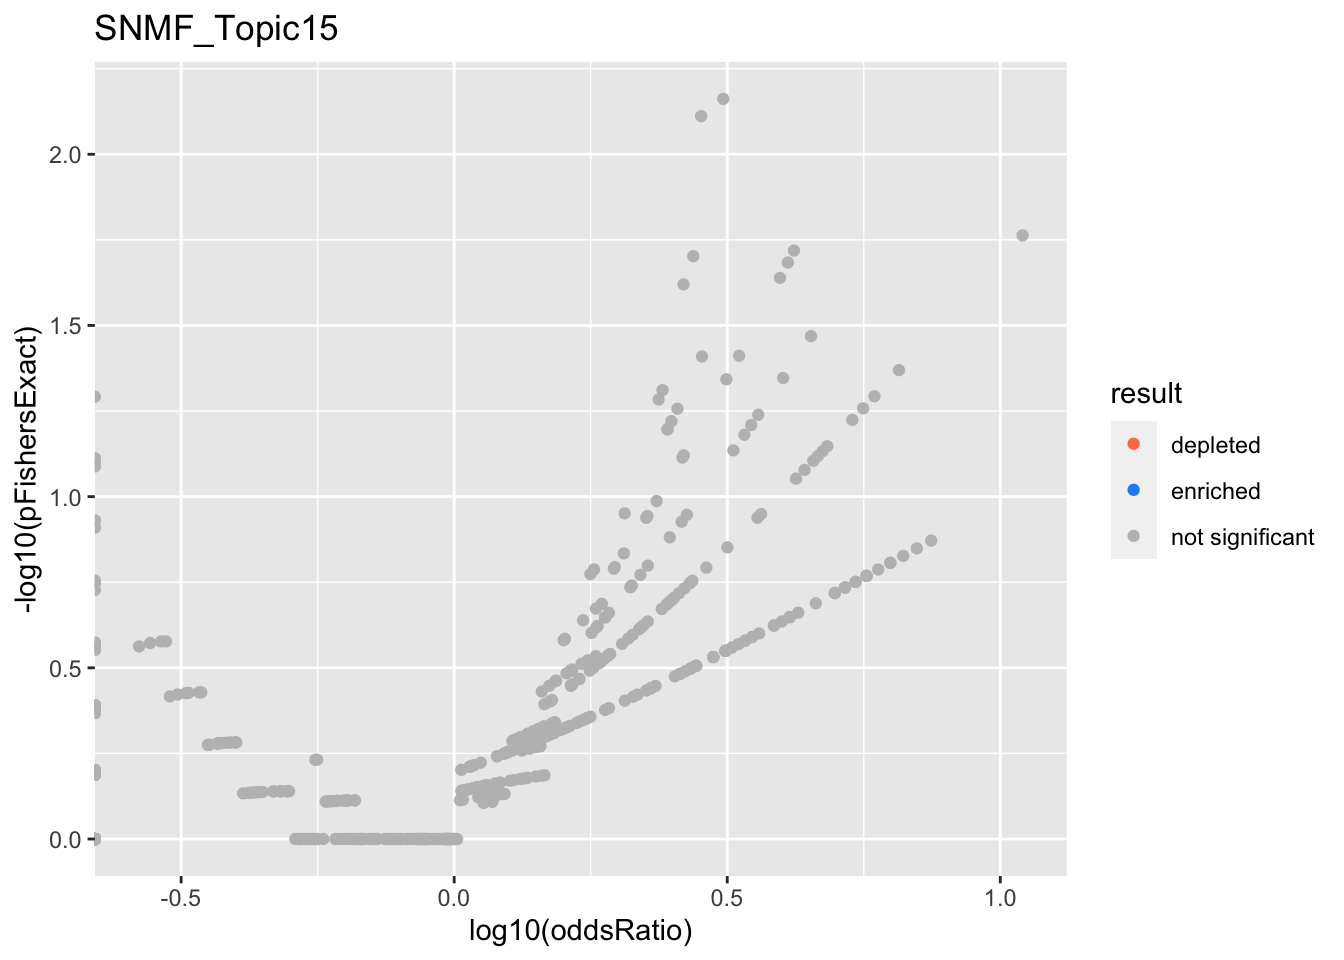
SNMF_Topic16
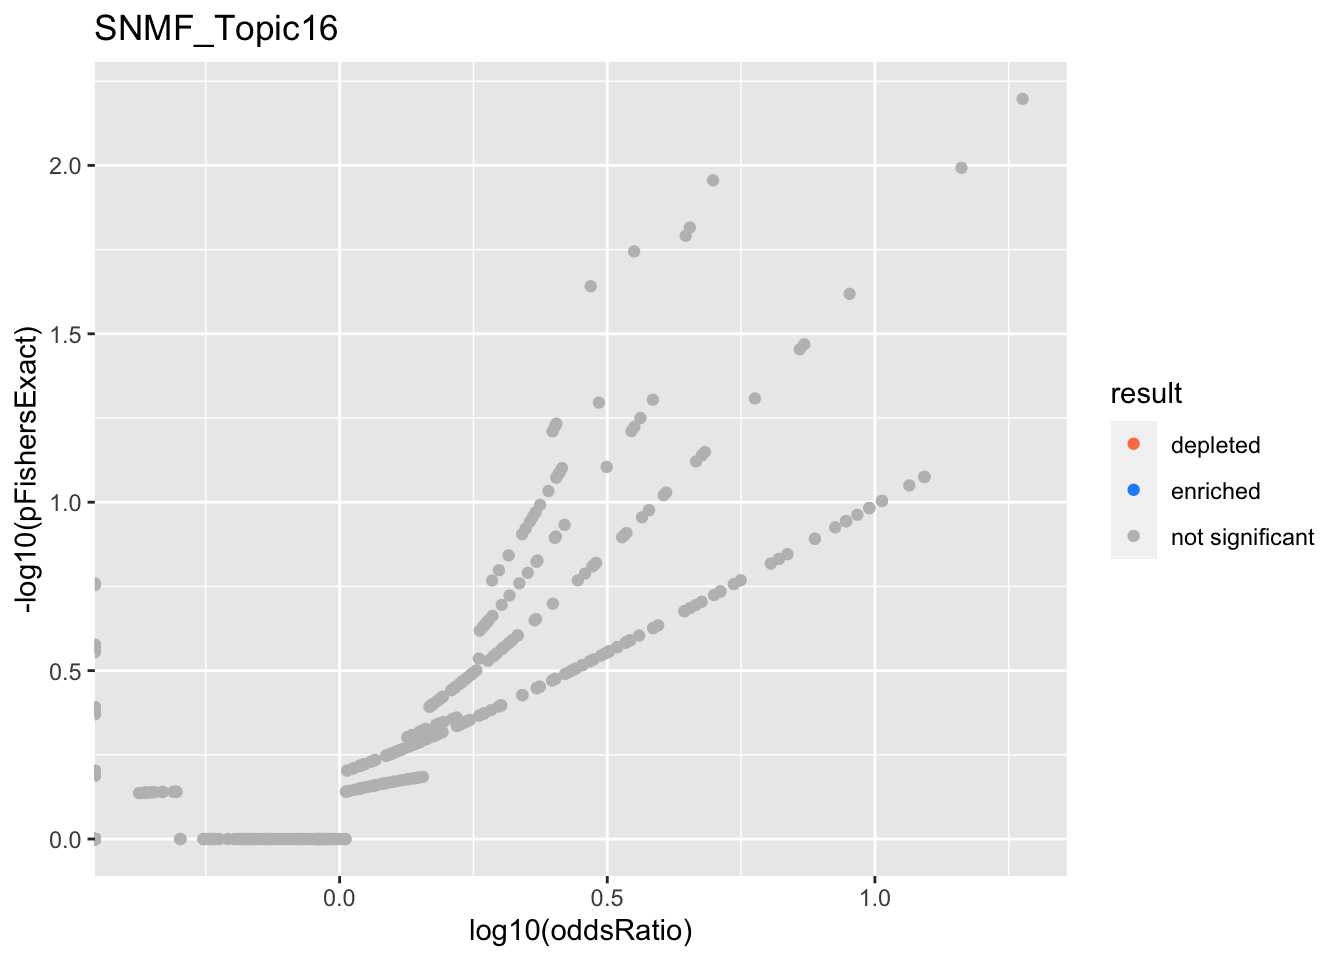
SNMF_Topic17
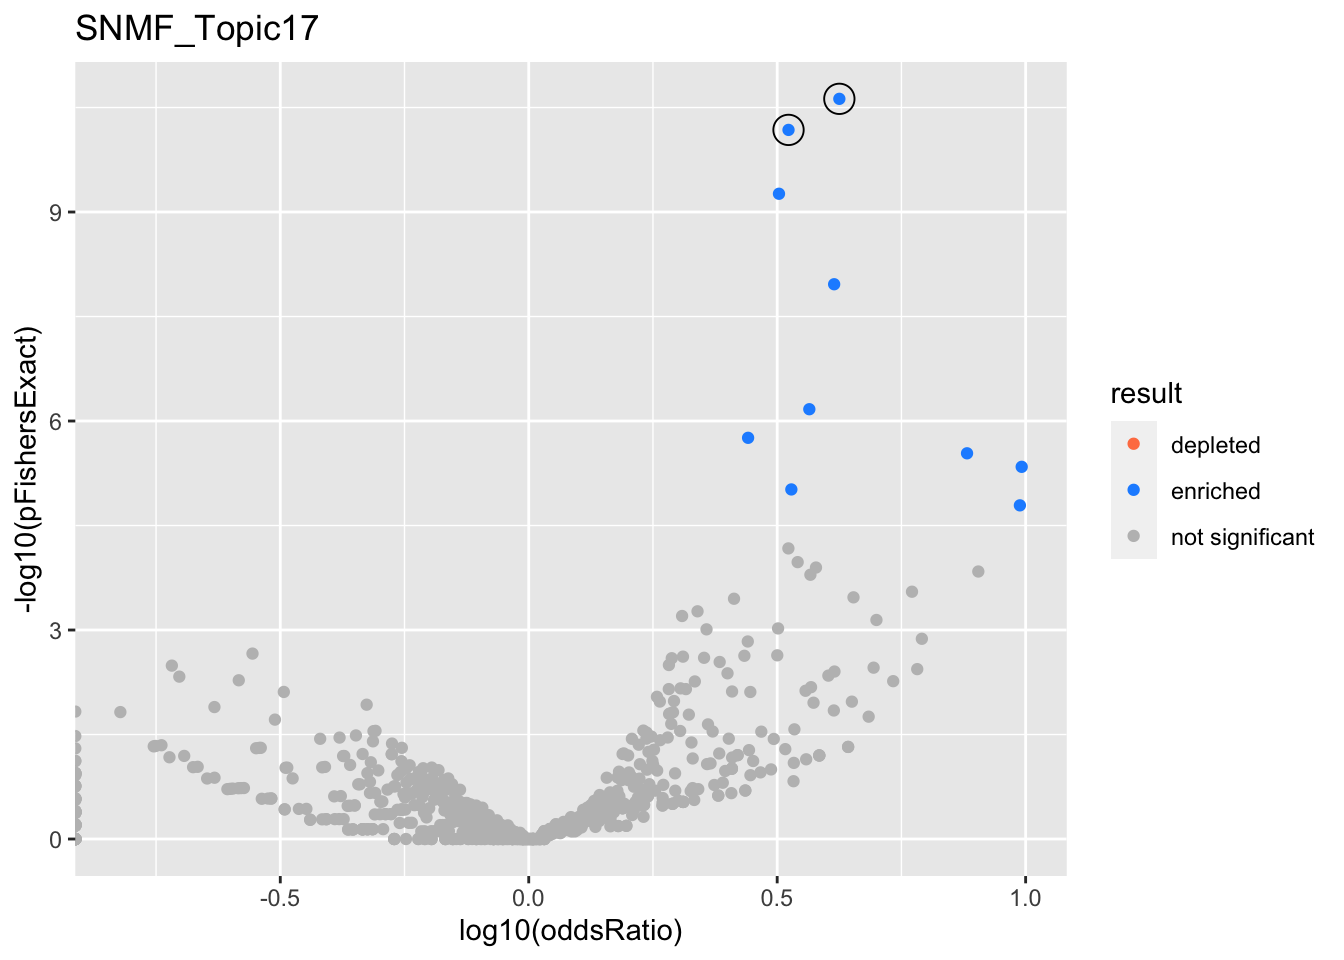
gobp_nr
| geneSet | description | alpha | beta | beta.se | pHypergeometric | pFishersExact | overlap | geneSetSize | oddsRatio |
|---|---|---|---|---|---|---|---|---|---|
| L1 | |||||||||
| GO:0034976 | response to endoplasmic reticulum stress | 1 | 1.38 | 0.143 | 2.37e-11 | 2.37e-11 | 39 | 239 | 4.22 |
| L2 | |||||||||
| GO:0002446 | neutrophil mediated immunity | 0.959 | 1.14 | 0.115 | 6.63e-11 | 6.63e-11 | 51 | 386 | 3.33 |
| GO:0036230 | granulocyte activation | 0.0405 | 1.11 | 0.116 | 5.47e-10 | 5.47e-10 | 49 | 384 | 3.19 |
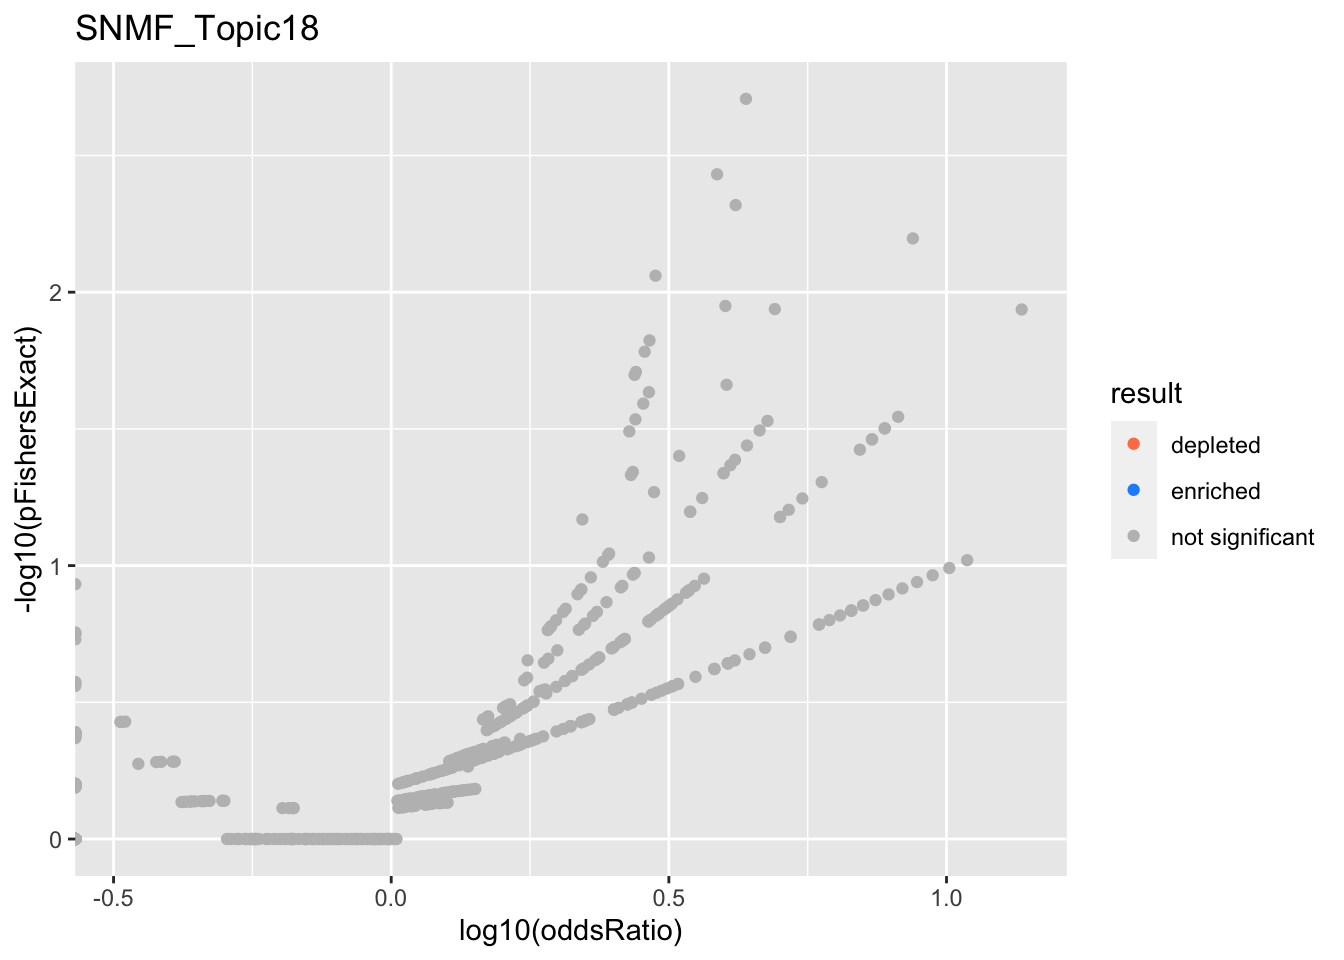
SNMF_Topic18
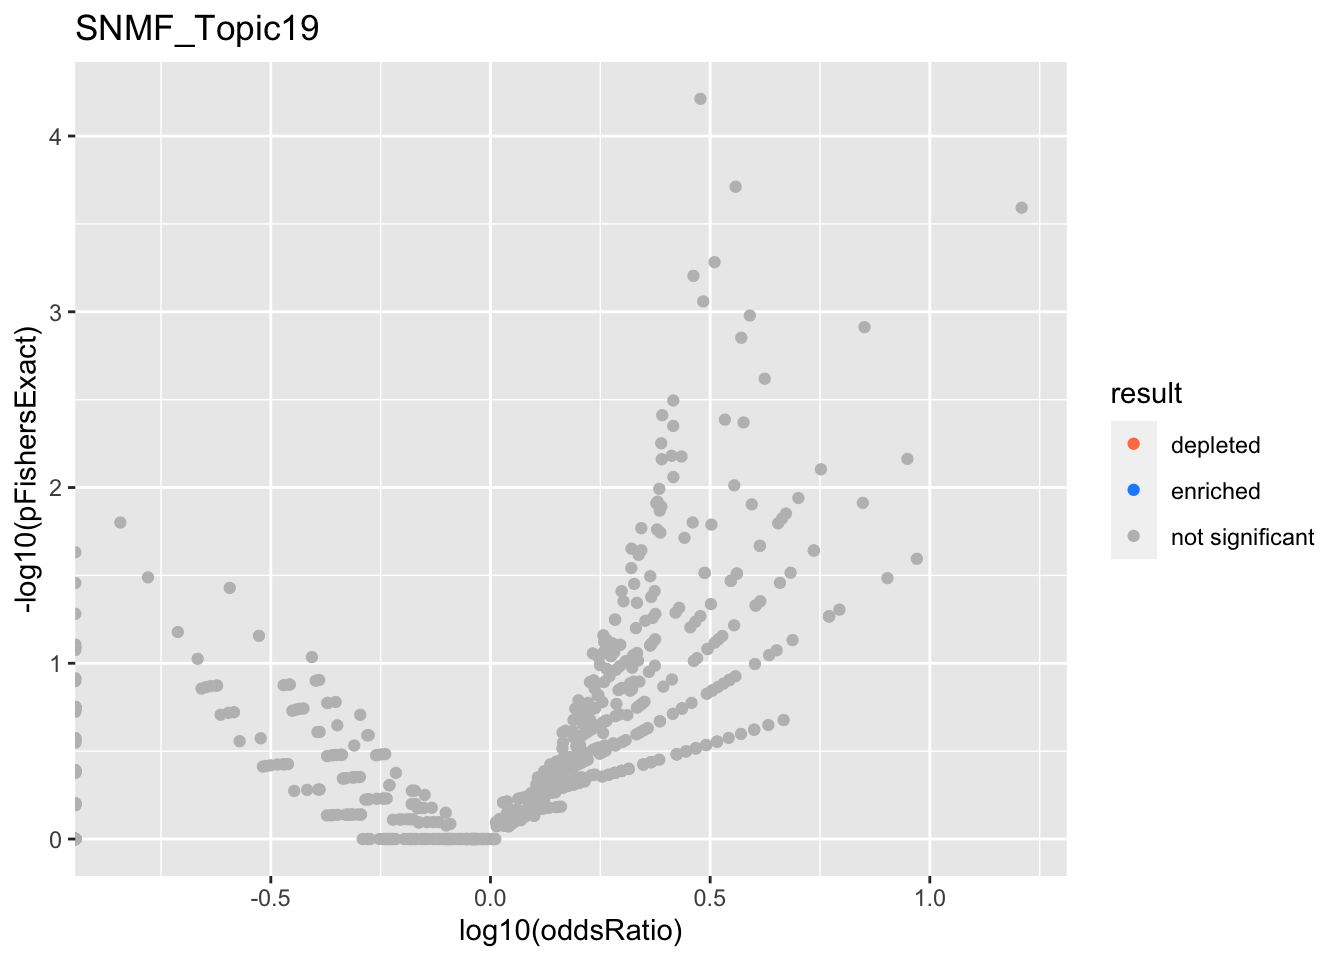
SNMF_Topic19
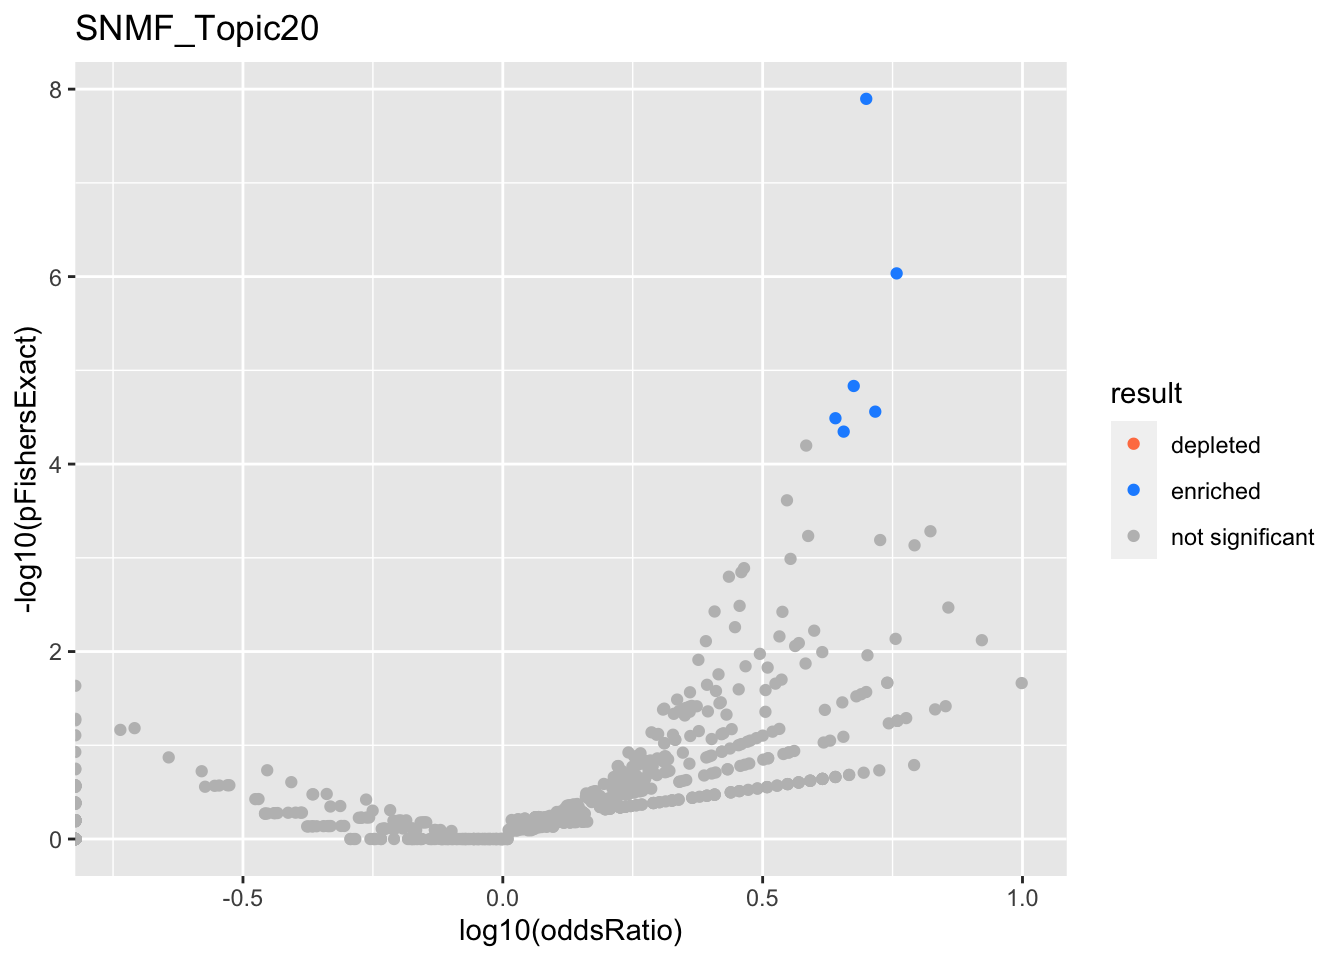
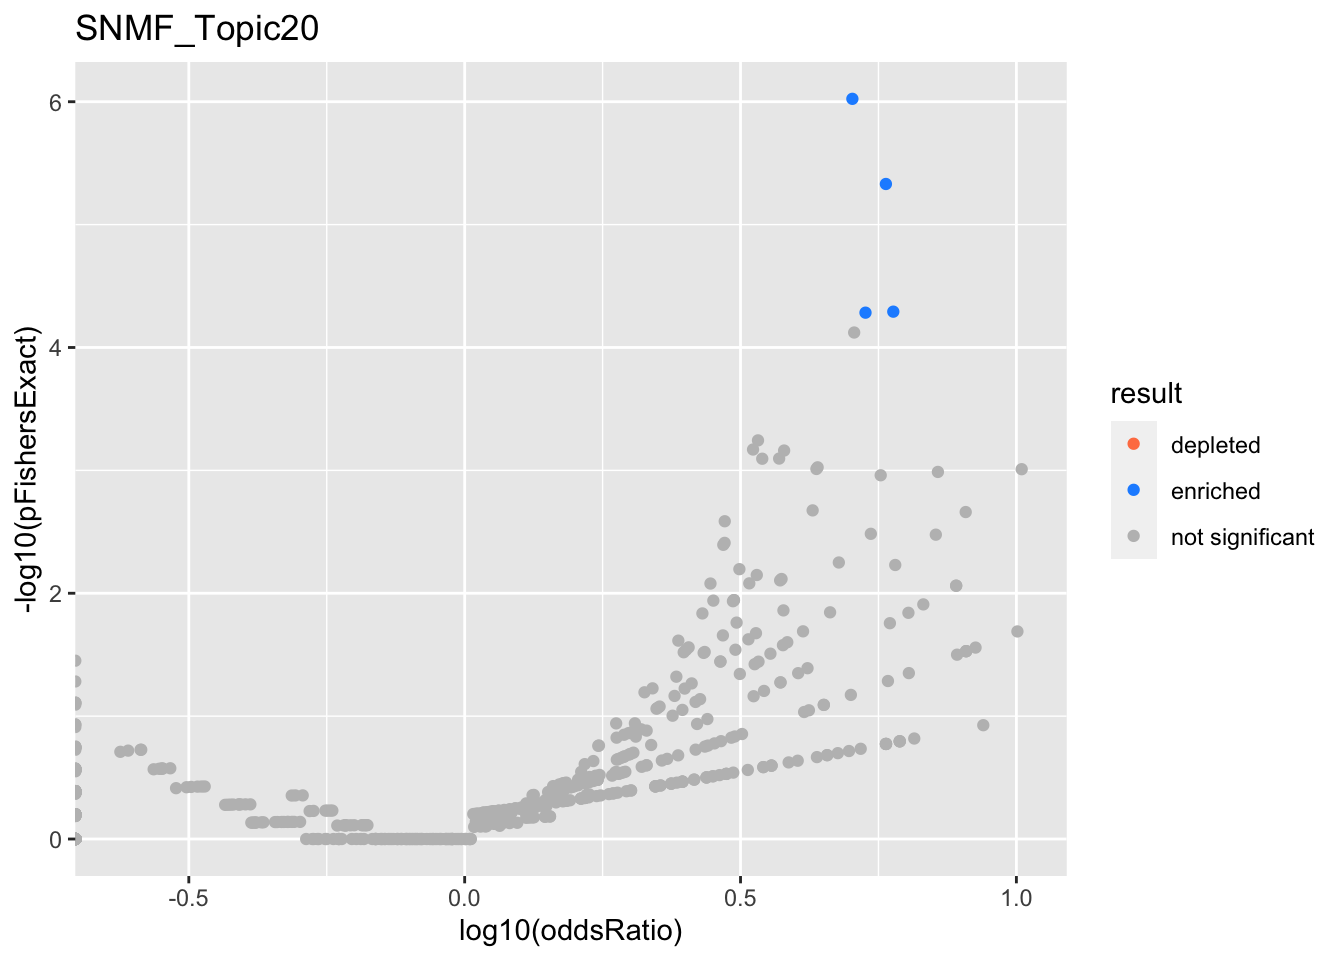
SNMF_Topic20
SNMF - Positive loadings
res <- positive.fits %>%
  filter(str_detect(experiment, '^SNMF*')) %>%
  get_plot_tbl(., positive.ora)

html_tables <- positive.fits %>%
  filter(str_detect(experiment, '^SNMF*')) %>%
  get_table_tbl(., positive.ora)

experiments <- unique(res$experiment)
for (i in 1:length(experiments)){
  this_experiment <- experiments[i]
  cat("\n")
  cat("###", this_experiment, "\n") # Create second level headings with the names.

  # print volcano plot
  p <- do.volcano(res %>% filter(experiment == this_experiment)) +
    labs(title=this_experiment)
  print(p)

  cat("\n\n")

  # print table
  for(db in names(html_tables[[this_experiment]])){
    cat("####", db, "\n") # Create second level headings with the names.
    to_print <- html_tables[[this_experiment]][[db]] %>% distinct()
    to_print %>% report_susie_credible_sets() %>% htmltools::HTML() %>% print()
    cat("\n")
  }}
SNMF_Topic2
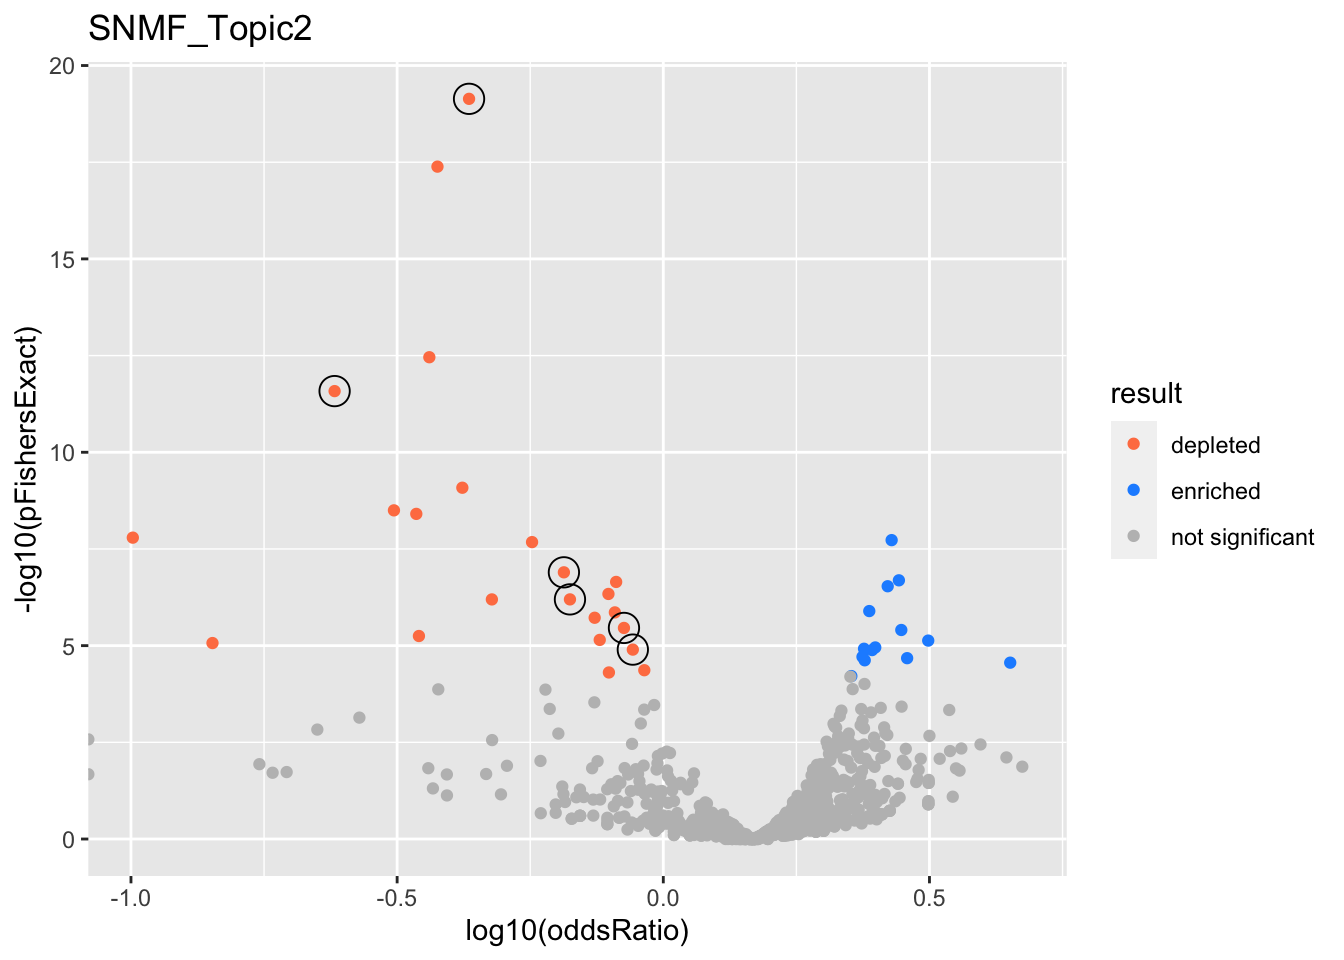
gobp_nr
| geneSet | description | alpha | beta | beta.se | pHypergeometric | pFishersExact | overlap | geneSetSize | oddsRatio |
|---|---|---|---|---|---|---|---|---|---|
| L1 | |||||||||
| GO:0022613 | ribonucleoprotein complex biogenesis | 1 | -1.15 | 0.115 | 1 | 7.26e-20 | 48 | 391 | 0.432 |
| L2 | |||||||||
| GO:0140053 | mitochondrial gene expression | 1 | -1.66 | 0.206 | 1 | 2.62e-12 | 10 | 139 | 0.241 |
| L3 | |||||||||
| GO:0009123 | nucleoside monophosphate metabolic process | 0.906 | -0.781 | 0.135 | 1 | 1.27e-07 | 44 | 255 | 0.651 |
| GO:0009141 | nucleoside triphosphate metabolic process | 0.0891 | -0.735 | 0.137 | 1 | 6.37e-07 | 43 | 244 | 0.668 |
| L5 | |||||||||
| GO:0002446 | neutrophil mediated immunity | 0.805 | -0.571 | 0.107 | 1 | 3.48e-06 | 82 | 386 | 0.844 |
| GO:0036230 | granulocyte activation | 0.192 | -0.542 | 0.107 | 1 | 1.27e-05 | 84 | 384 | 0.876 |
SNMF_Topic3
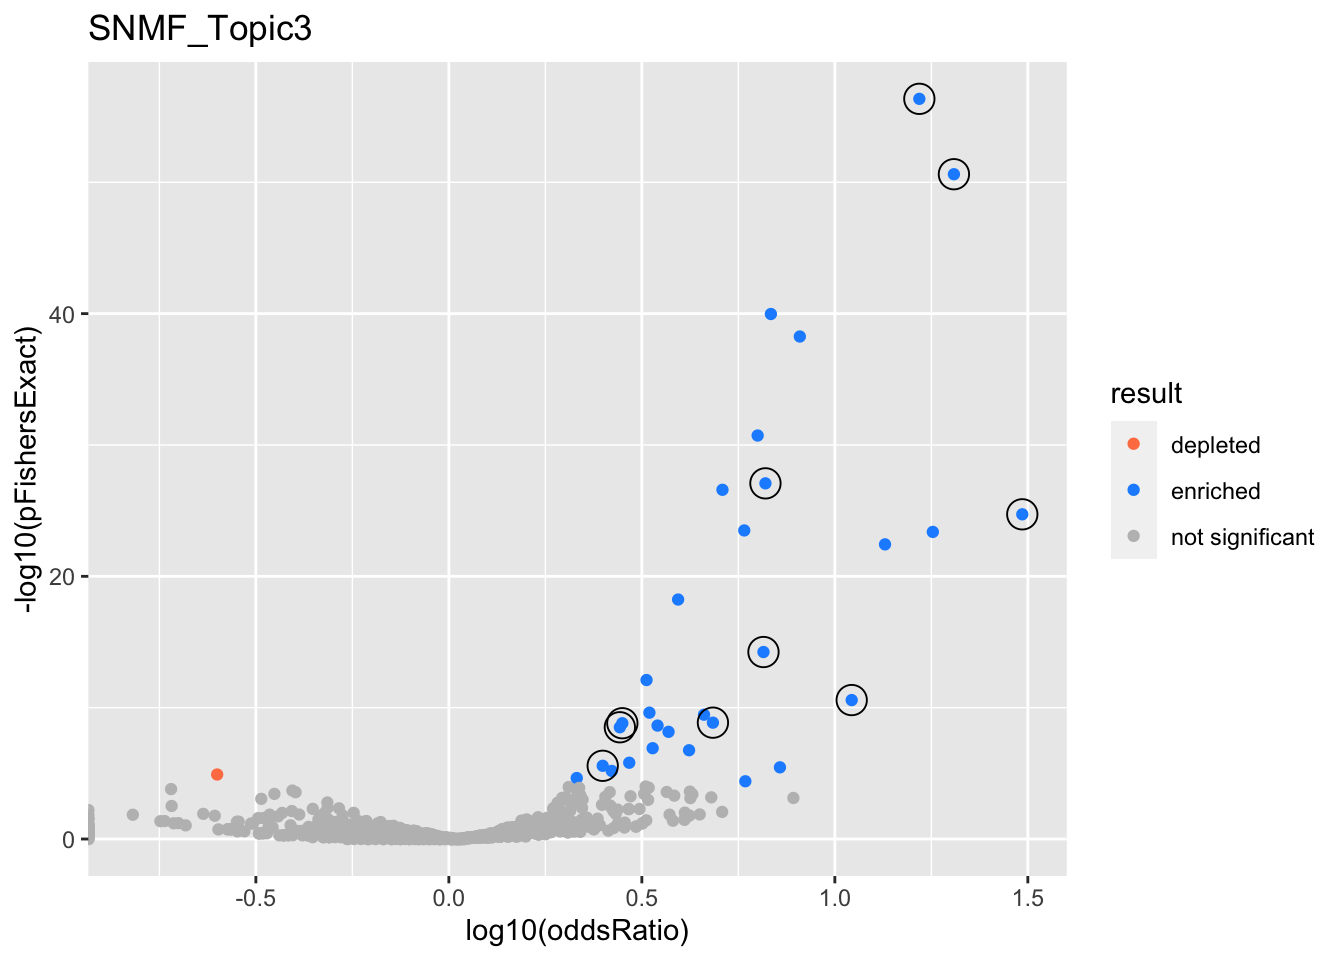
gobp_nr
| geneSet | description | alpha | beta | beta.se | pHypergeometric | pFishersExact | overlap | geneSetSize | oddsRatio |
|---|---|---|---|---|---|---|---|---|---|
| L1 | |||||||||
| GO:0006413 | translational initiation | 1 | 2.15 | 0.156 | 4.42e-57 | 4.42e-57 | 90 | 177 | 16.6 |
| L2 | |||||||||
| GO:0010257 | NADH dehydrogenase complex assembly | 0.983 | 2.57 | 0.306 | 1.9e-25 | 1.9e-25 | 31 | 46 | 30.6 |
| GO:0033108 | mitochondrial respiratory chain complex assembly | 0.0175 | 2.13 | 0.268 | 4.16e-24 | 4.16e-24 | 35 | 64 | 17.9 |
| L3 | |||||||||
| GO:0070972 | protein localization to endoplasmic reticulum | 1 | 1.92 | 0.183 | 2.42e-51 | 2.42e-51 | 74 | 131 | 20.3 |
| L4 | |||||||||
| GO:0009141 | nucleoside triphosphate metabolic process | 1 | 1.55 | 0.137 | 8.34e-28 | 8.34e-28 | 73 | 244 | 6.61 |
| L5 | |||||||||
| GO:0006414 | translational elongation | 1 | 2.05 | 0.189 | 5.8e-15 | 5.8e-15 | 37 | 121 | 6.53 |
| L6 | |||||||||
| GO:0070671 | response to interleukin-12 | 1 | 2.41 | 0.306 | 2.64e-11 | 2.64e-11 | 19 | 44 | 11.1 |
| L7 | |||||||||
| GO:0002446 | neutrophil mediated immunity | 0.795 | 0.997 | 0.114 | 1.36e-09 | 1.53e-09 | 61 | 386 | 2.81 |
| GO:0036230 | granulocyte activation | 0.205 | 0.982 | 0.115 | 2.91e-09 | 3.11e-09 | 60 | 384 | 2.77 |
| L8 | |||||||||
| GO:0070585 | protein localization to mitochondrion | 1 | 1.57 | 0.197 | 1.38e-09 | 1.38e-09 | 29 | 117 | 4.83 |
| L9 | |||||||||
| GO:0043687 | post-translational protein modification | 1 | 1.03 | 0.128 | 2.38e-06 | 2.66e-06 | 45 | 310 | 2.5 |
SNMF_Topic4
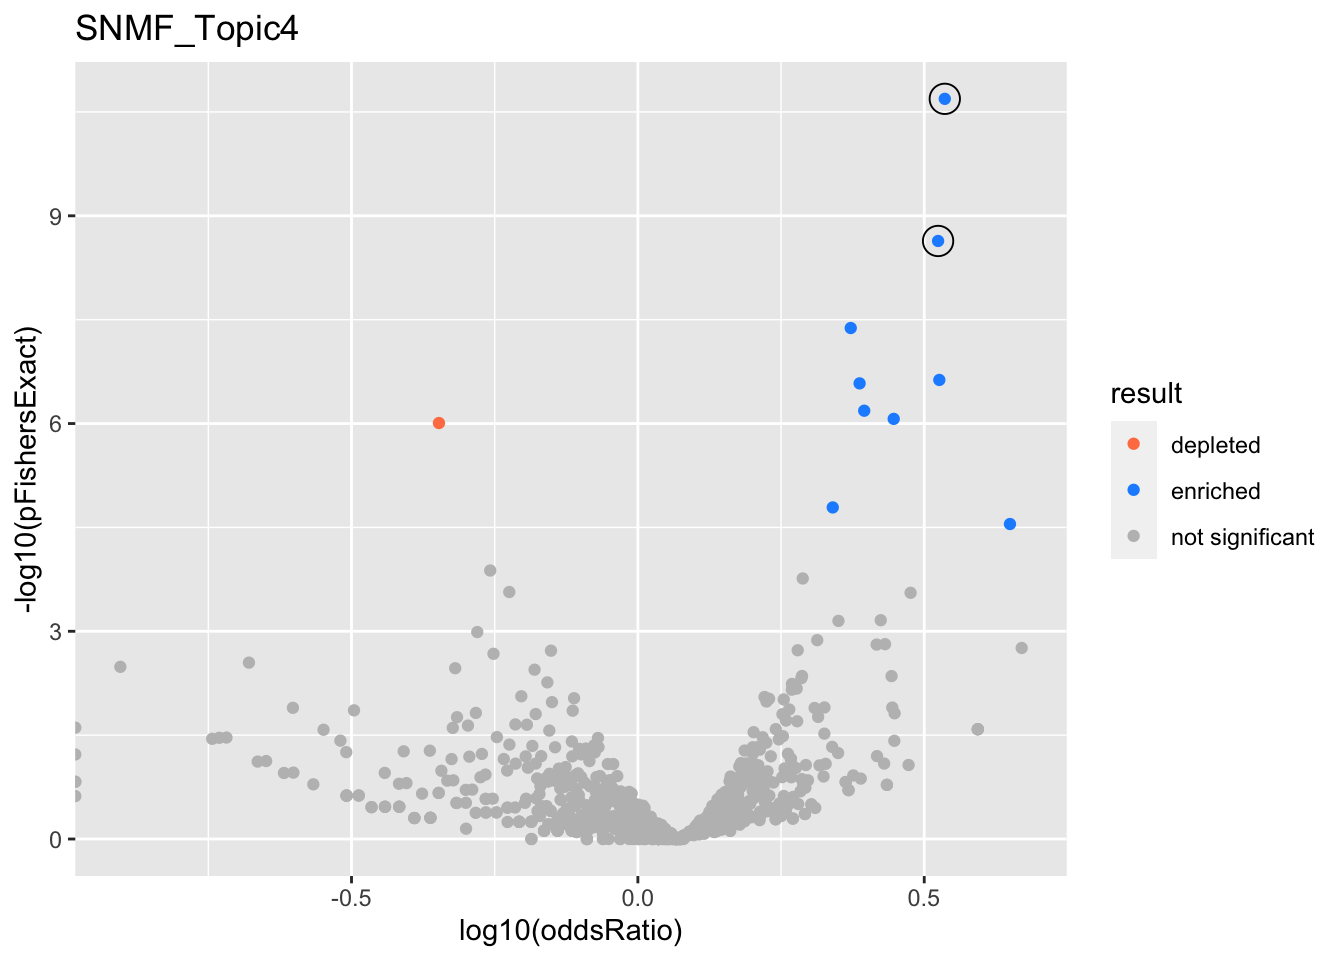
gobp_nr
| geneSet | description | alpha | beta | beta.se | pHypergeometric | pFishersExact | overlap | geneSetSize | oddsRatio |
|---|---|---|---|---|---|---|---|---|---|
| L1 | |||||||||
| GO:0016072 | rRNA metabolic process | 1 | 0.93 | 0.14 | 1.58e-11 | 2.05e-11 | 71 | 210 | 3.43 |
| L2 | |||||||||
| GO:0006413 | translational initiation | 0.998 | 0.873 | 0.152 | 1.54e-09 | 2.31e-09 | 59 | 177 | 3.34 |
SNMF_Topic5
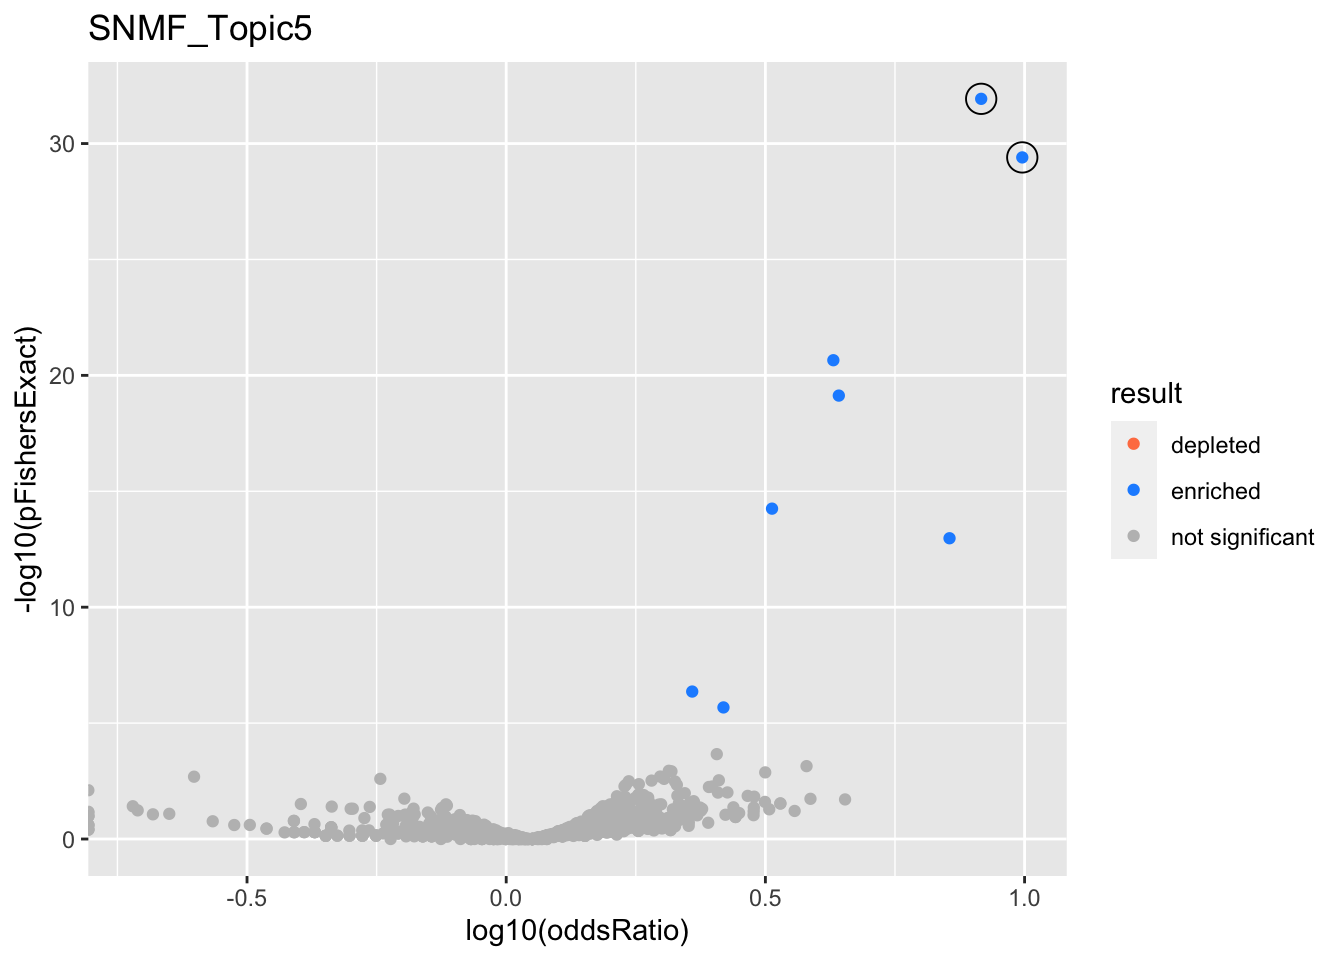
gobp_nr
| geneSet | description | alpha | beta | beta.se | pHypergeometric | pFishersExact | overlap | geneSetSize | oddsRatio |
|---|---|---|---|---|---|---|---|---|---|
| L1 | |||||||||
| GO:0006413 | translational initiation | 1 | 1.38 | 0.153 | 1.18e-32 | 1.18e-32 | 82 | 177 | 8.25 |
| L2 | |||||||||
| GO:0070972 | protein localization to endoplasmic reticulum | 1 | 1.33 | 0.177 | 3.96e-30 | 3.96e-30 | 67 | 131 | 9.9 |
SNMF_Topic6
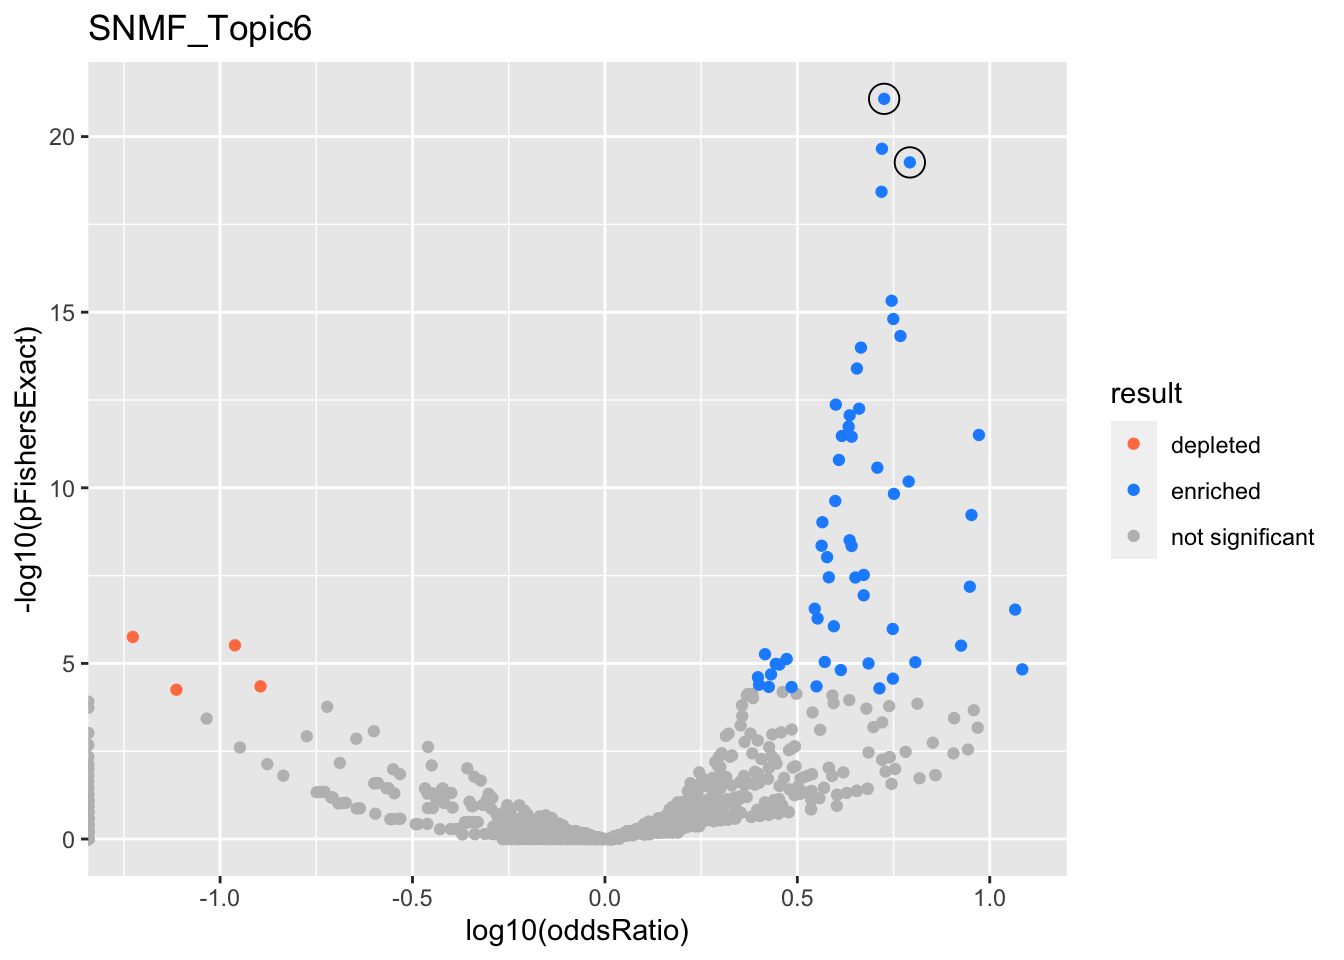
gobp_nr
| geneSet | description | alpha | beta | beta.se | pHypergeometric | pFishersExact | overlap | geneSetSize | oddsRatio |
|---|---|---|---|---|---|---|---|---|---|
| L1 | |||||||||
| GO:0002521 | leukocyte differentiation | 1 | 1.19 | 0.113 | 8.42e-22 | 8.42e-22 | 64 | 390 | 5.32 |
| L2 | |||||||||
| GO:0002250 | adaptive immune response | 1 | 1.19 | 0.135 | 5.43e-20 | 5.43e-20 | 50 | 263 | 6.2 |
SNMF_Topic7
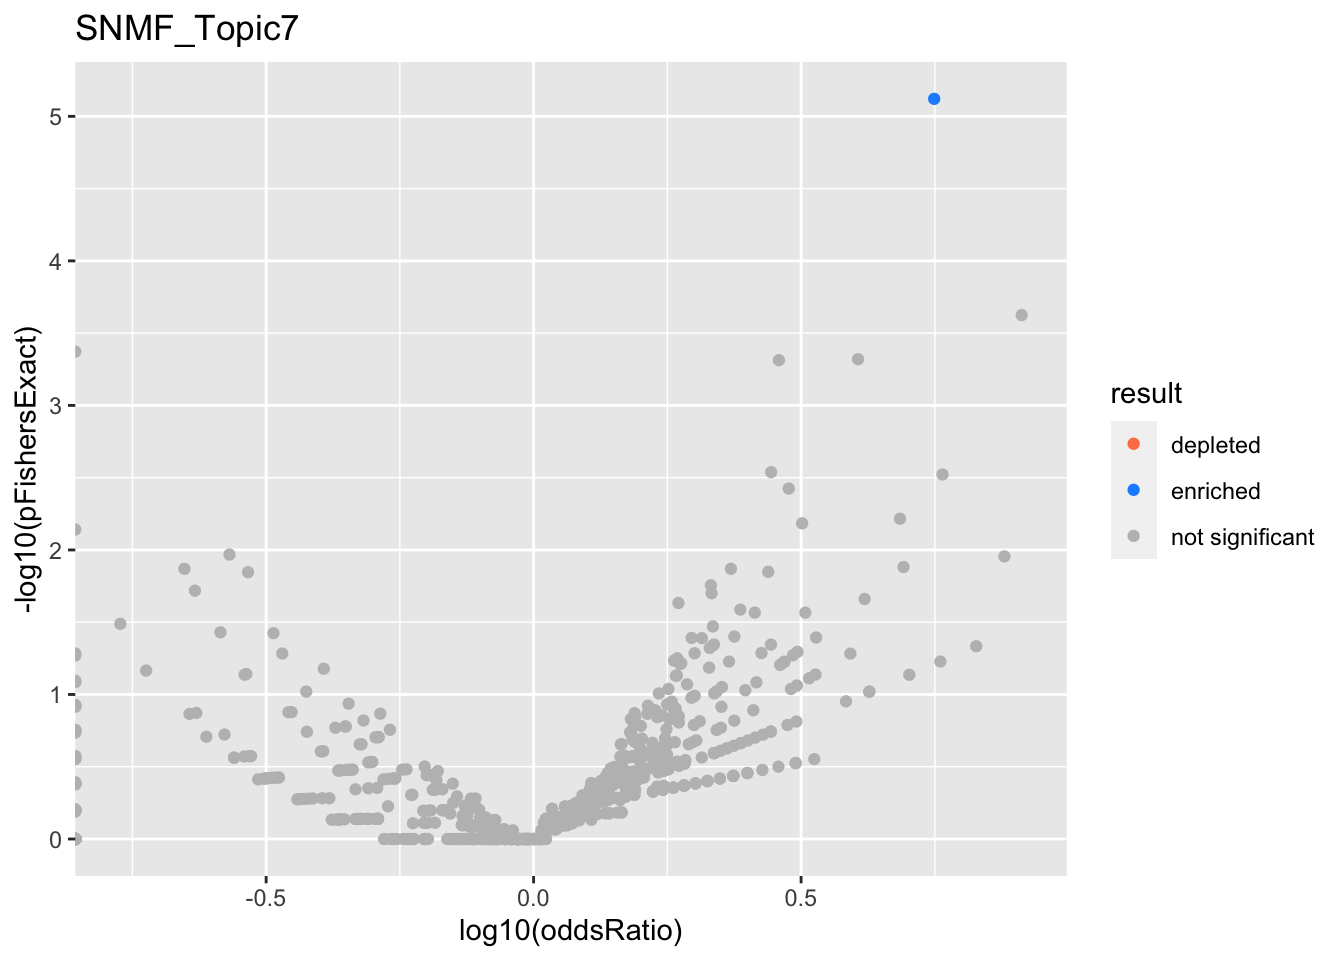
SNMF_Topic8
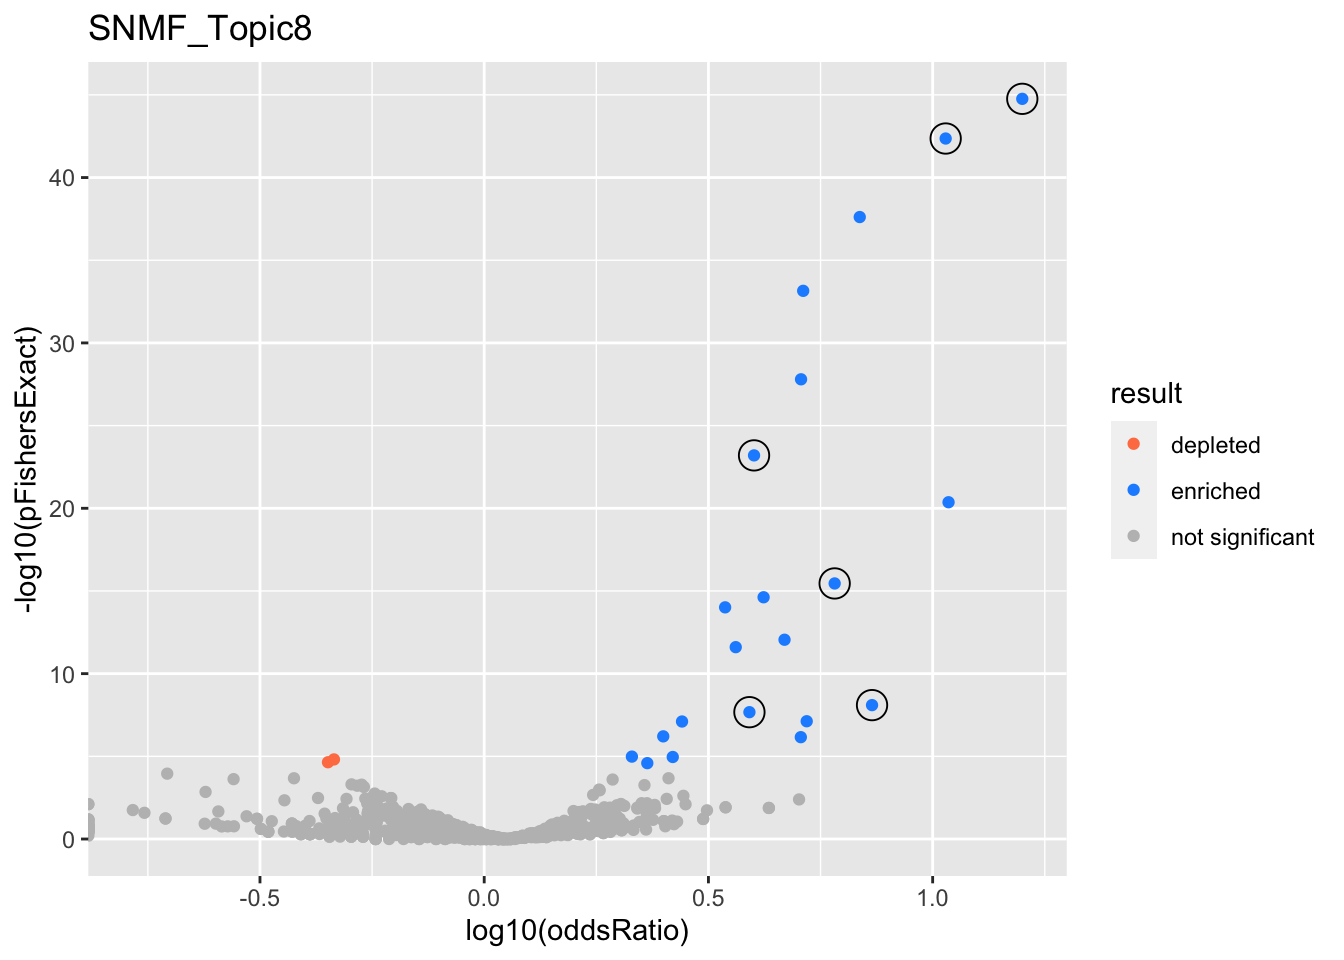
gobp_nr
| geneSet | description | alpha | beta | beta.se | pHypergeometric | pFishersExact | overlap | geneSetSize | oddsRatio |
|---|---|---|---|---|---|---|---|---|---|
| L1 | |||||||||
| GO:0070972 | protein localization to endoplasmic reticulum | 1 | 1.8 | 0.182 | 1.74e-45 | 1.74e-45 | 83 | 131 | 15.8 |
| L2 | |||||||||
| GO:0006414 | translational elongation | 1 | 1.65 | 0.184 | 3.5e-16 | 3.5e-16 | 49 | 121 | 6.05 |
| L3 | |||||||||
| GO:0022613 | ribonucleoprotein complex biogenesis | 1 | 0.866 | 0.107 | 6.33e-24 | 6.33e-24 | 118 | 391 | 4 |
| L4 | |||||||||
| GO:0010257 | NADH dehydrogenase complex assembly | 0.983 | 1.93 | 0.294 | 8.01e-09 | 8.01e-09 | 21 | 46 | 7.32 |
| GO:0033108 | mitochondrial respiratory chain complex assembly | 0.0173 | 1.54 | 0.258 | 7.55e-08 | 7.55e-08 | 24 | 64 | 5.24 |
| L5 | |||||||||
| GO:0006413 | translational initiation | 1 | 1.26 | 0.156 | 4.36e-43 | 4.36e-43 | 95 | 177 | 10.7 |
| L6 | |||||||||
| GO:0070585 | protein localization to mitochondrion | 1 | 1.3 | 0.189 | 2.14e-08 | 2.14e-08 | 36 | 117 | 3.9 |
SNMF_Topic9
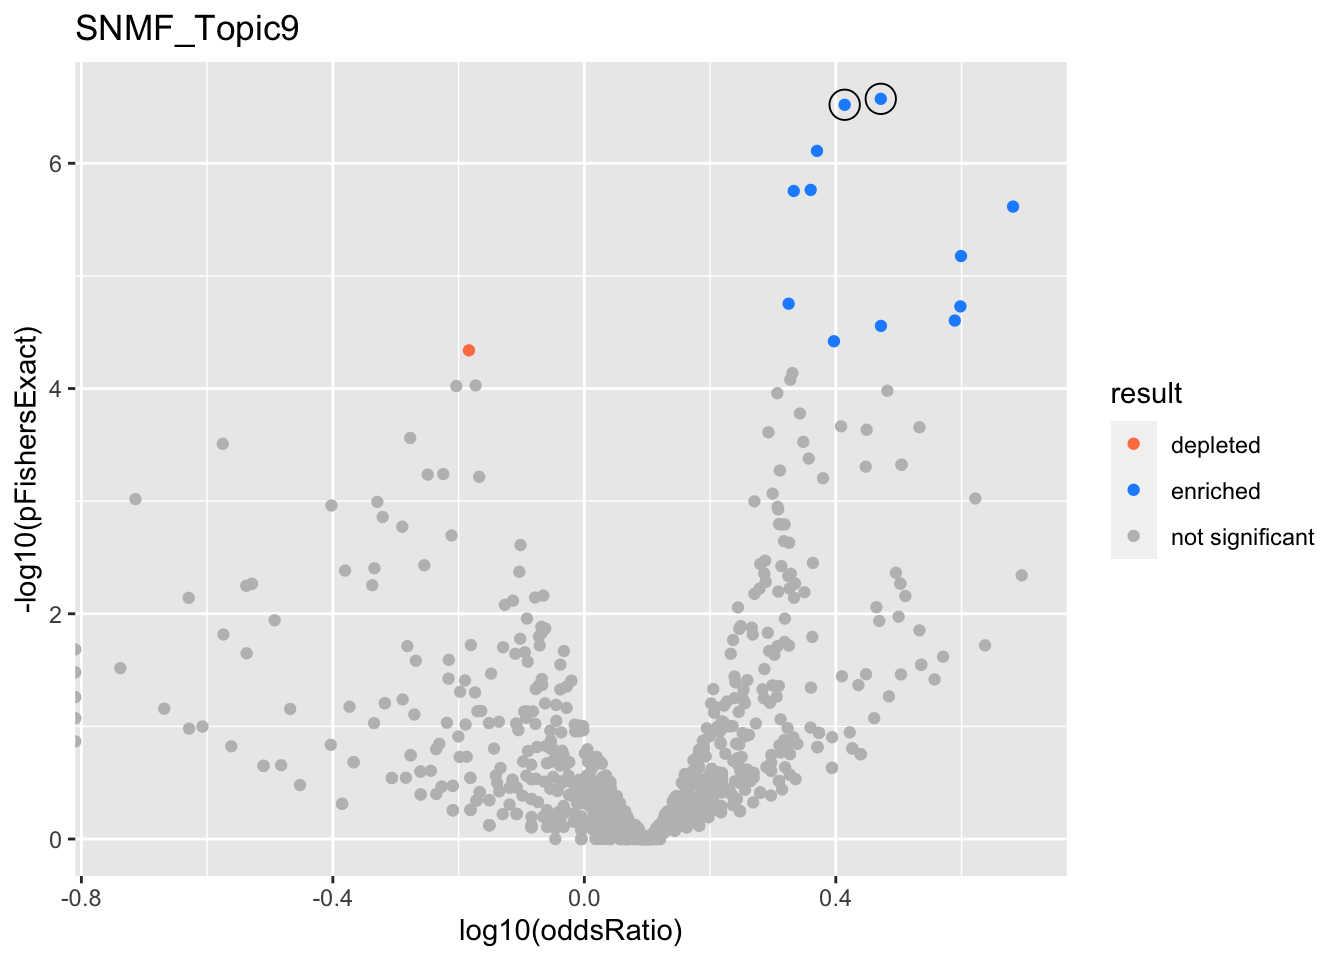
gobp_nr
| geneSet | description | alpha | beta | beta.se | pHypergeometric | pFishersExact | overlap | geneSetSize | oddsRatio |
|---|---|---|---|---|---|---|---|---|---|
| L1 | |||||||||
| GO:0006302 | double-strand break repair | 0.996 | 0.821 | 0.152 | 2.03e-07 | 2.68e-07 | 64 | 173 | 2.96 |
| L2 | |||||||||
| GO:0006520 | cellular amino acid metabolic process | 0.994 | 0.697 | 0.126 | 1.89e-07 | 3.02e-07 | 86 | 254 | 2.59 |
SNMF_Topic10
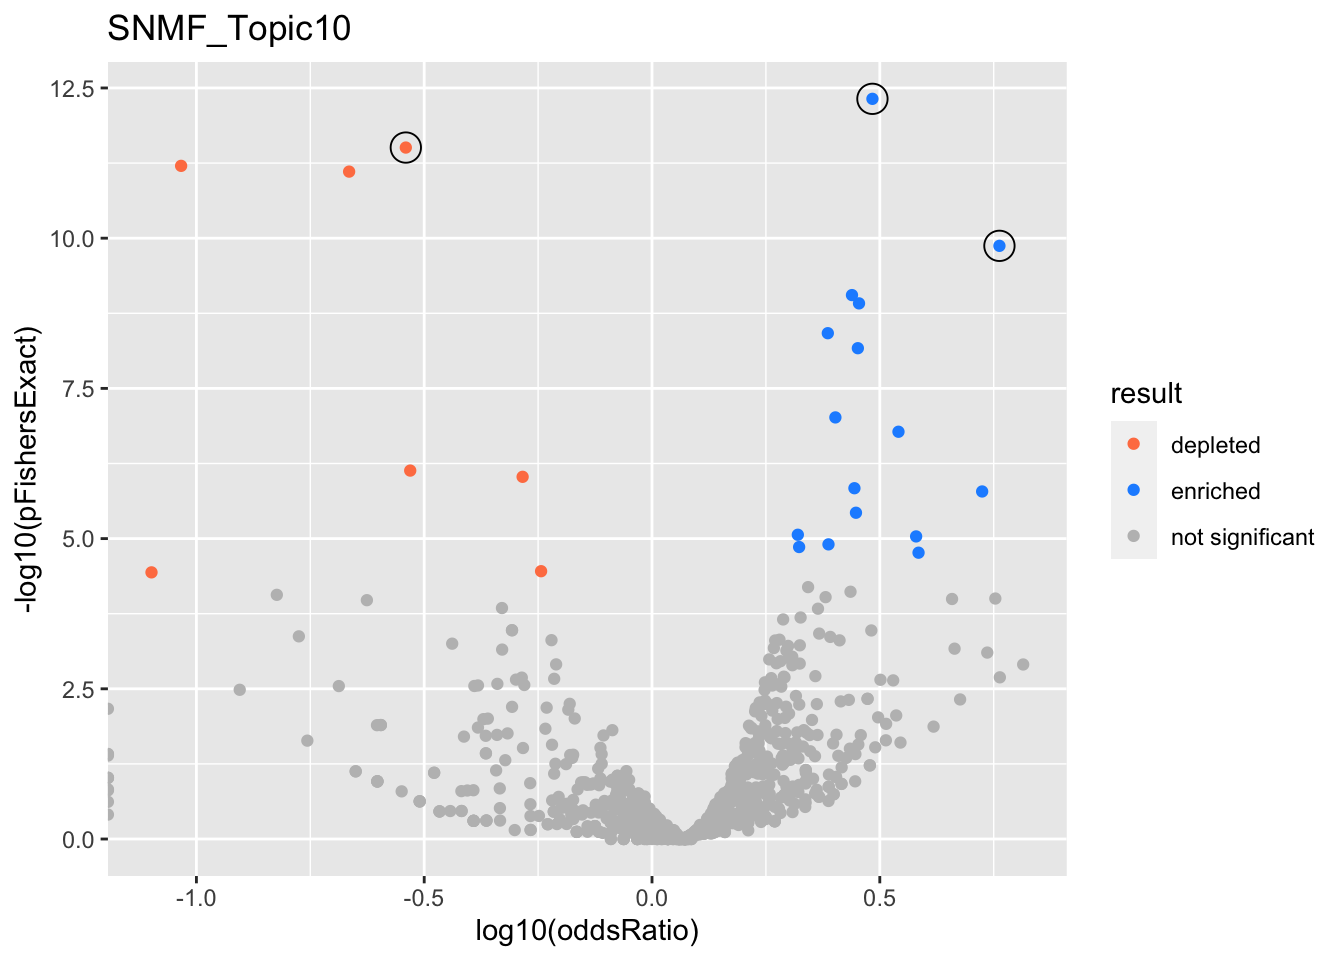
gobp_nr
| geneSet | description | alpha | beta | beta.se | pHypergeometric | pFishersExact | overlap | geneSetSize | oddsRatio |
|---|---|---|---|---|---|---|---|---|---|
| L1 | |||||||||
| GO:0007015 | actin filament organization | 1 | 0.781 | 0.113 | 3.54e-13 | 4.8e-13 | 102 | 329 | 3.05 |
| L2 | |||||||||
| GO:0022613 | ribonucleoprotein complex biogenesis | 1 | -1.31 | 0.13 | 1 | 3.1e-12 | 17 | 391 | 0.288 |
| L3 | |||||||||
| GO:0048013 | ephrin receptor signaling pathway | 0.999 | 1.28 | 0.23 | 1.34e-10 | 1.34e-10 | 35 | 75 | 5.79 |
SNMF_Topic11
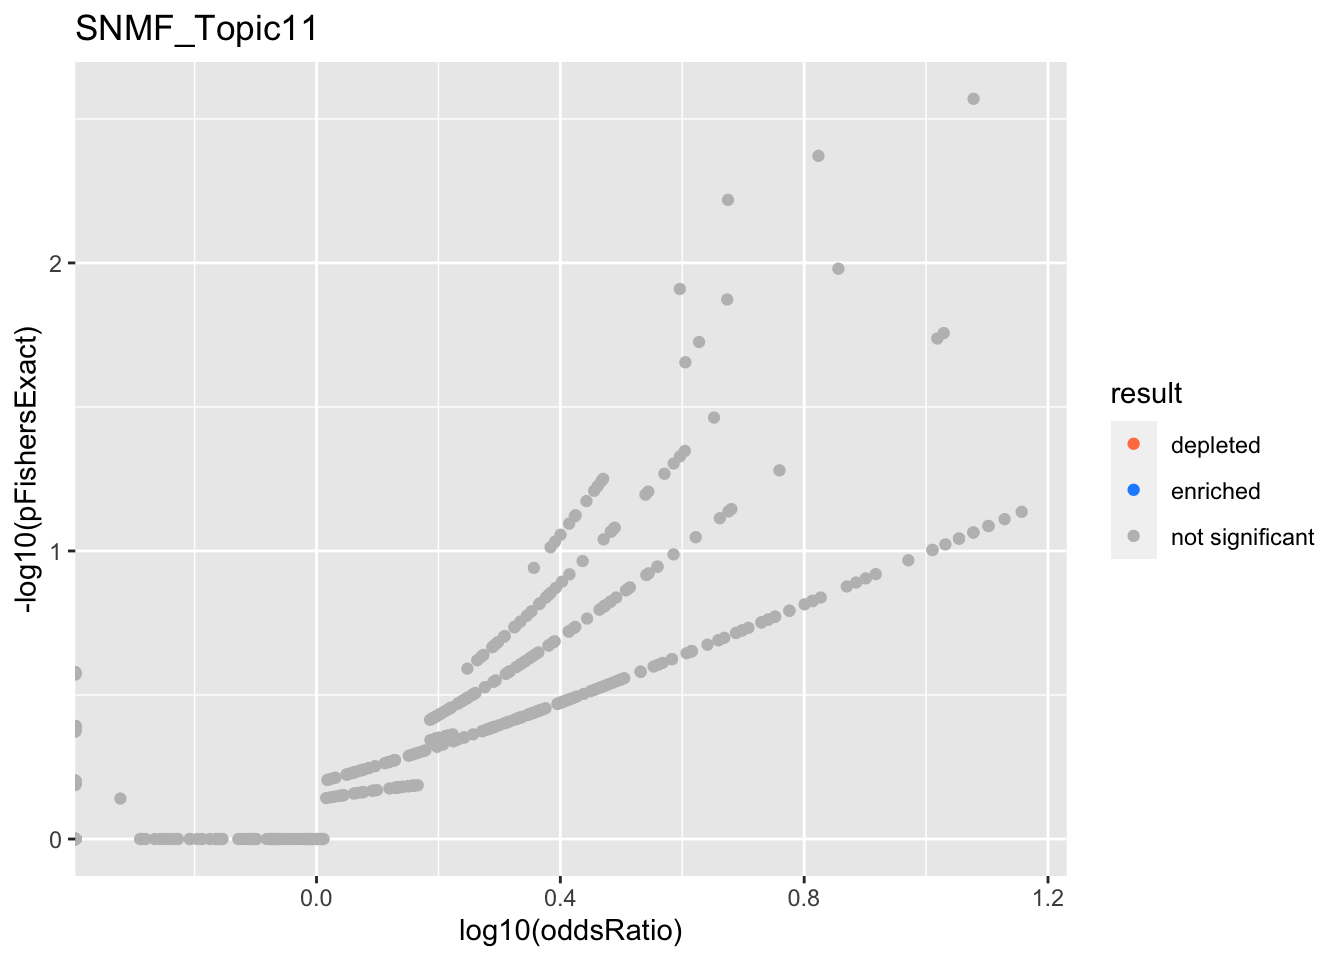
SNMF_Topic12
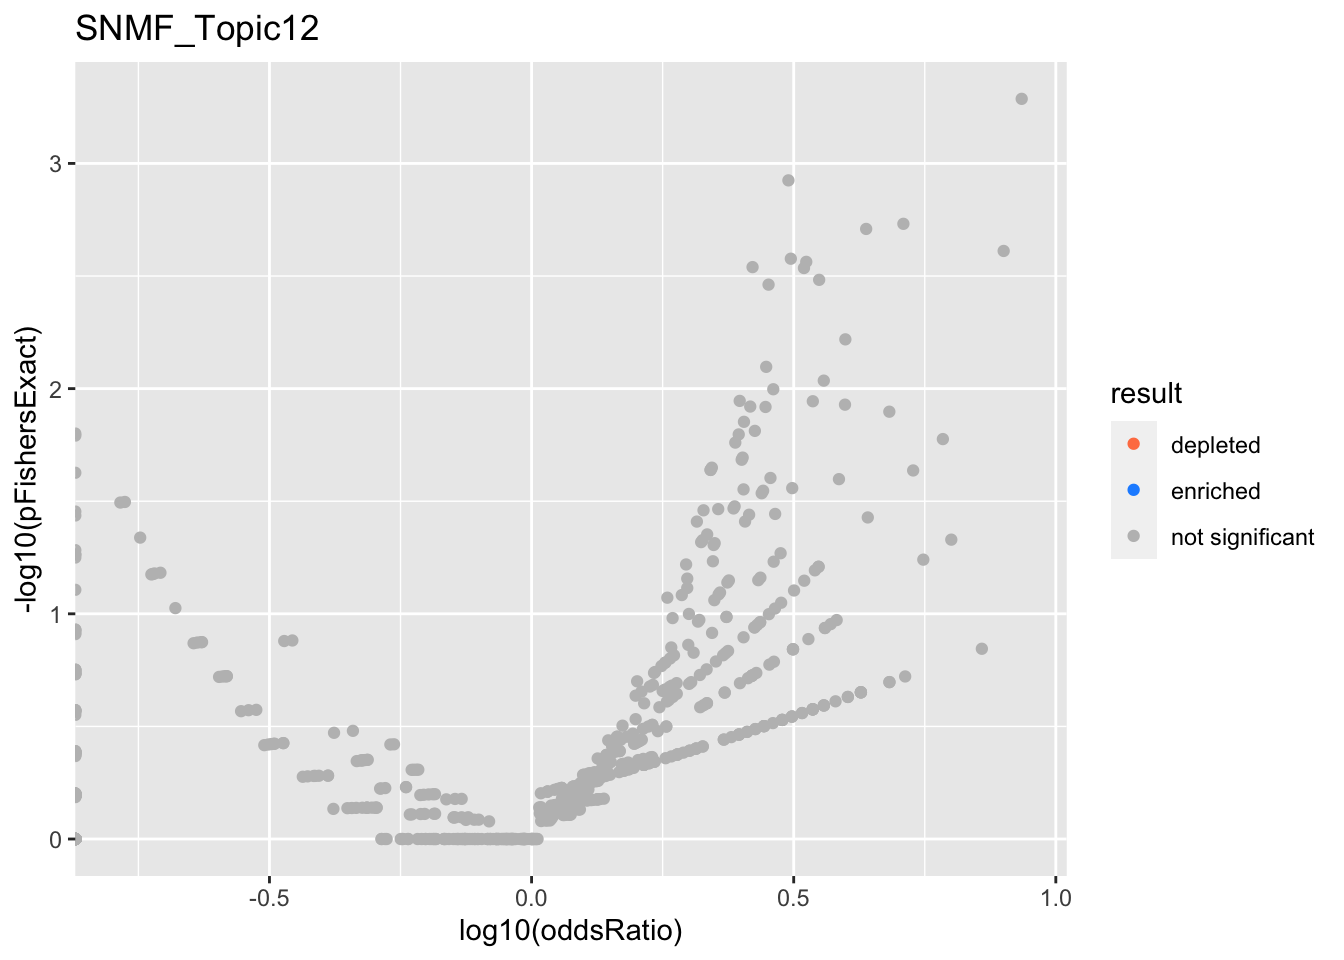
SNMF_Topic13
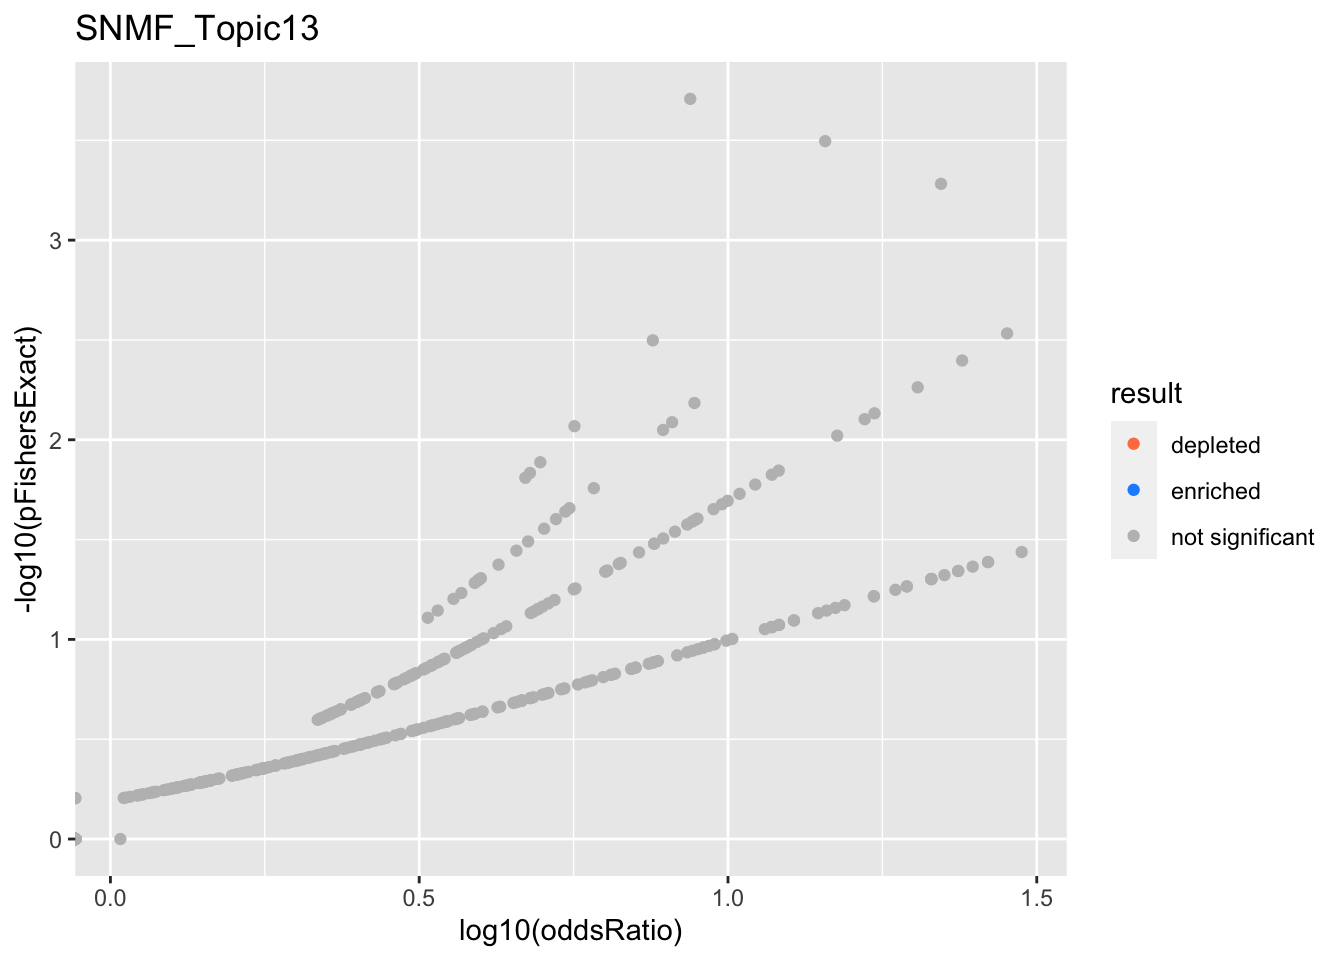
SNMF_Topic14
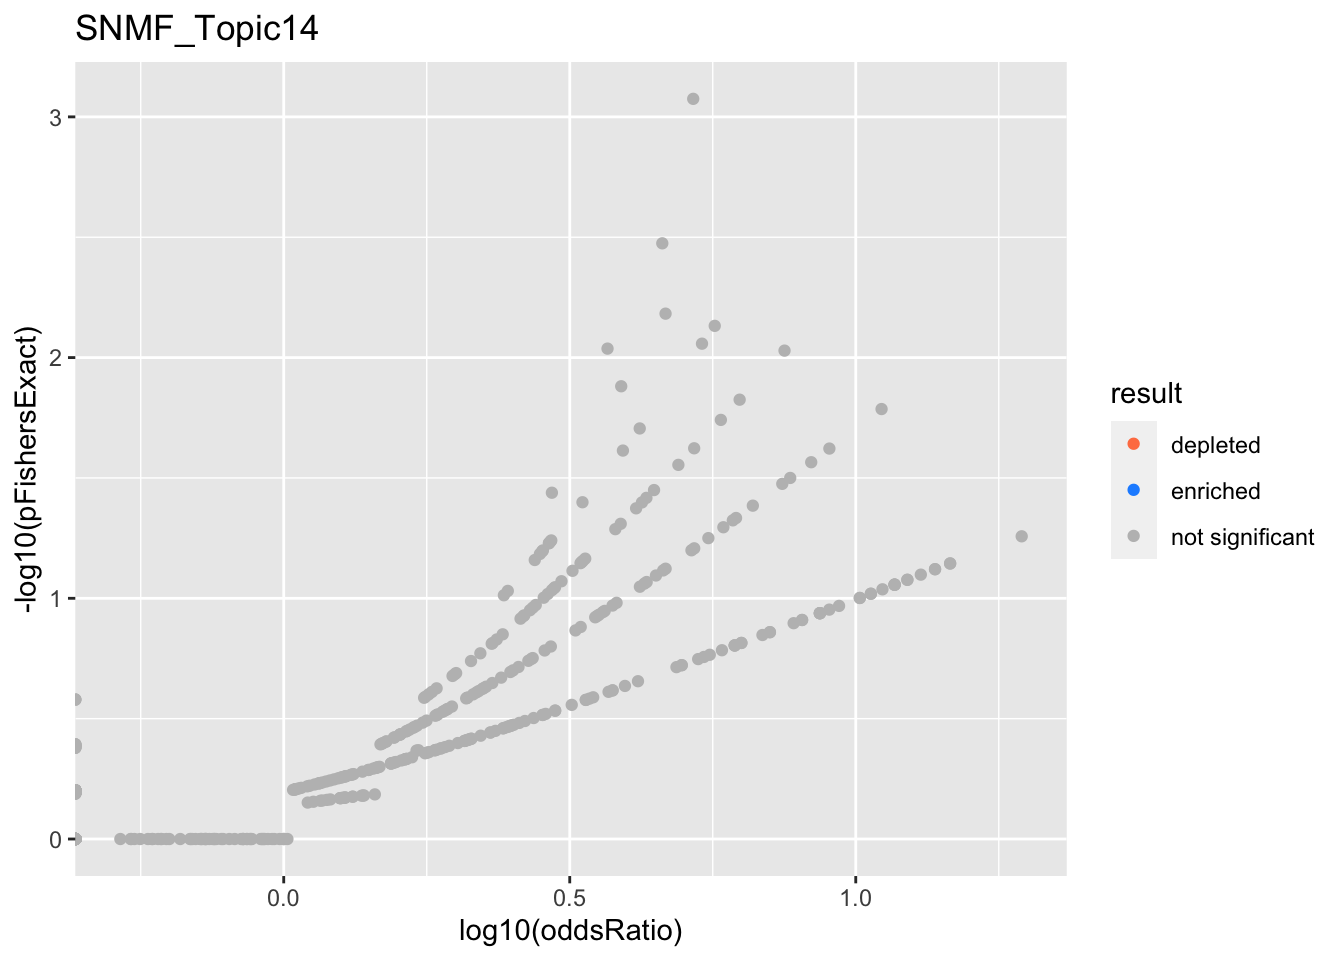
SNMF_Topic15
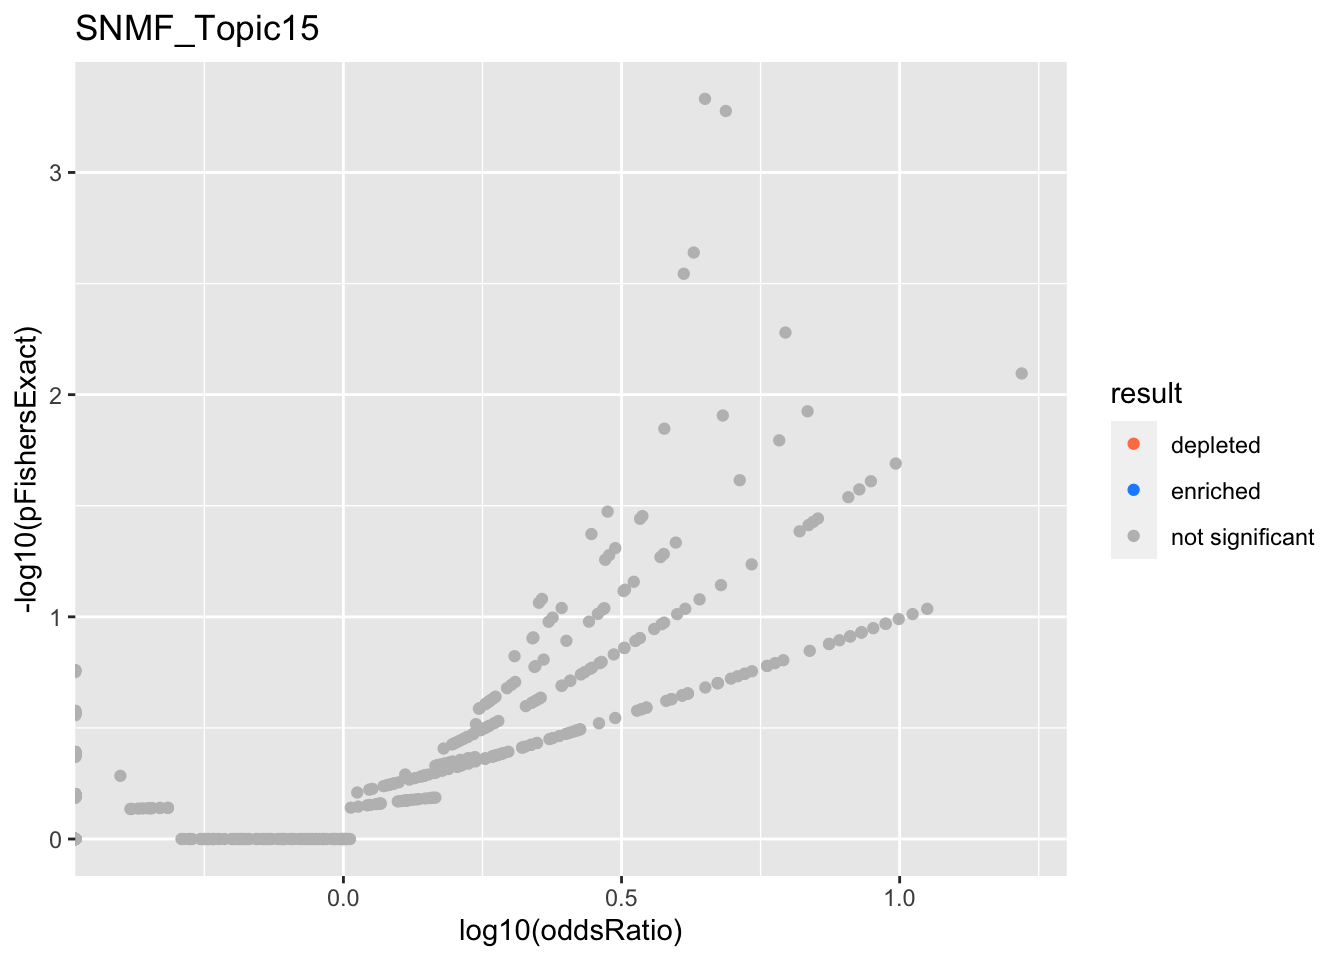
SNMF_Topic16
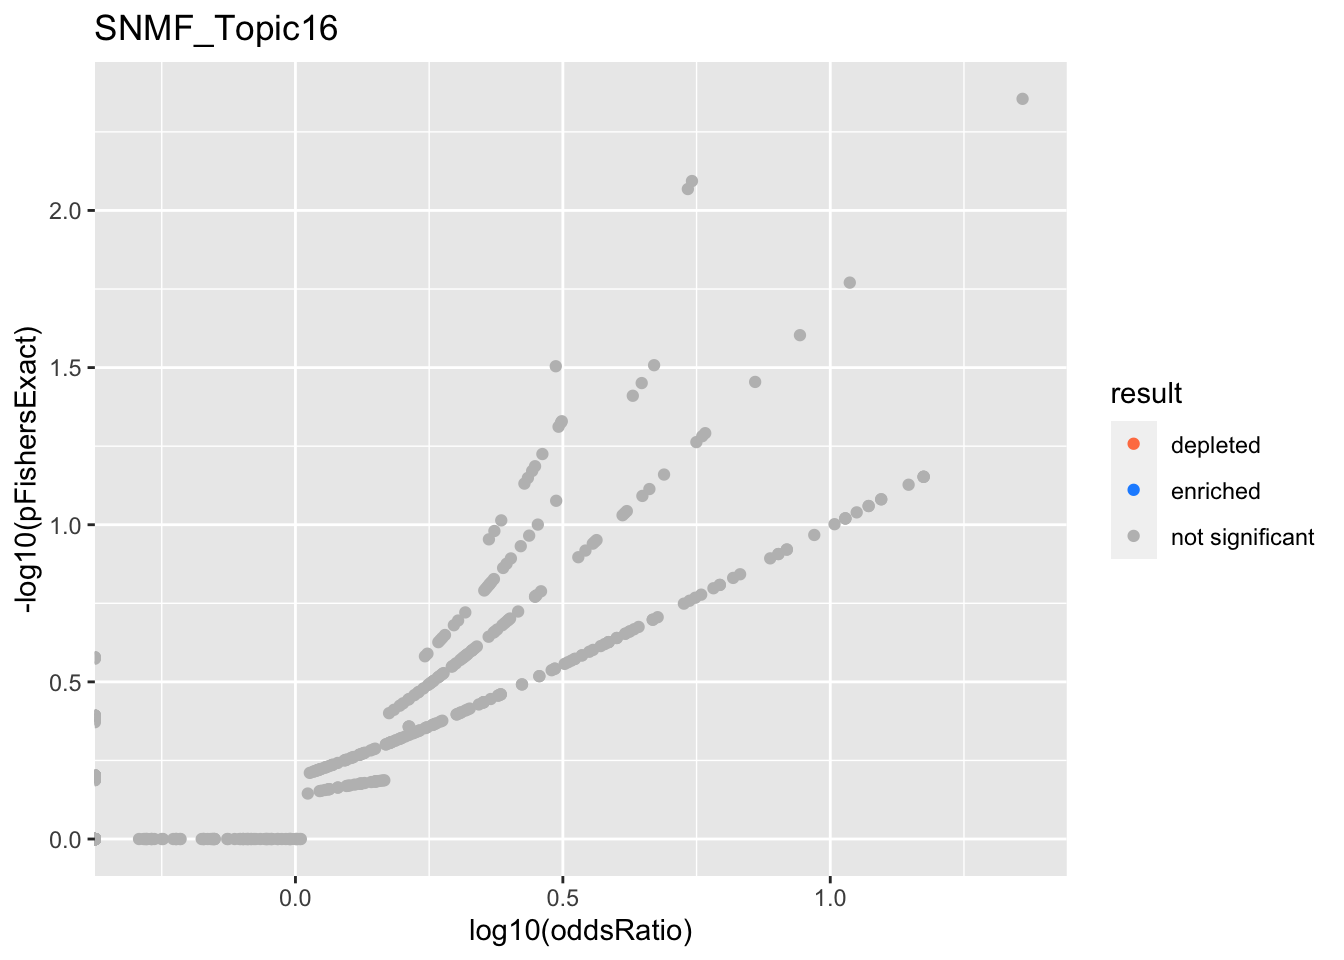
SNMF_Topic17
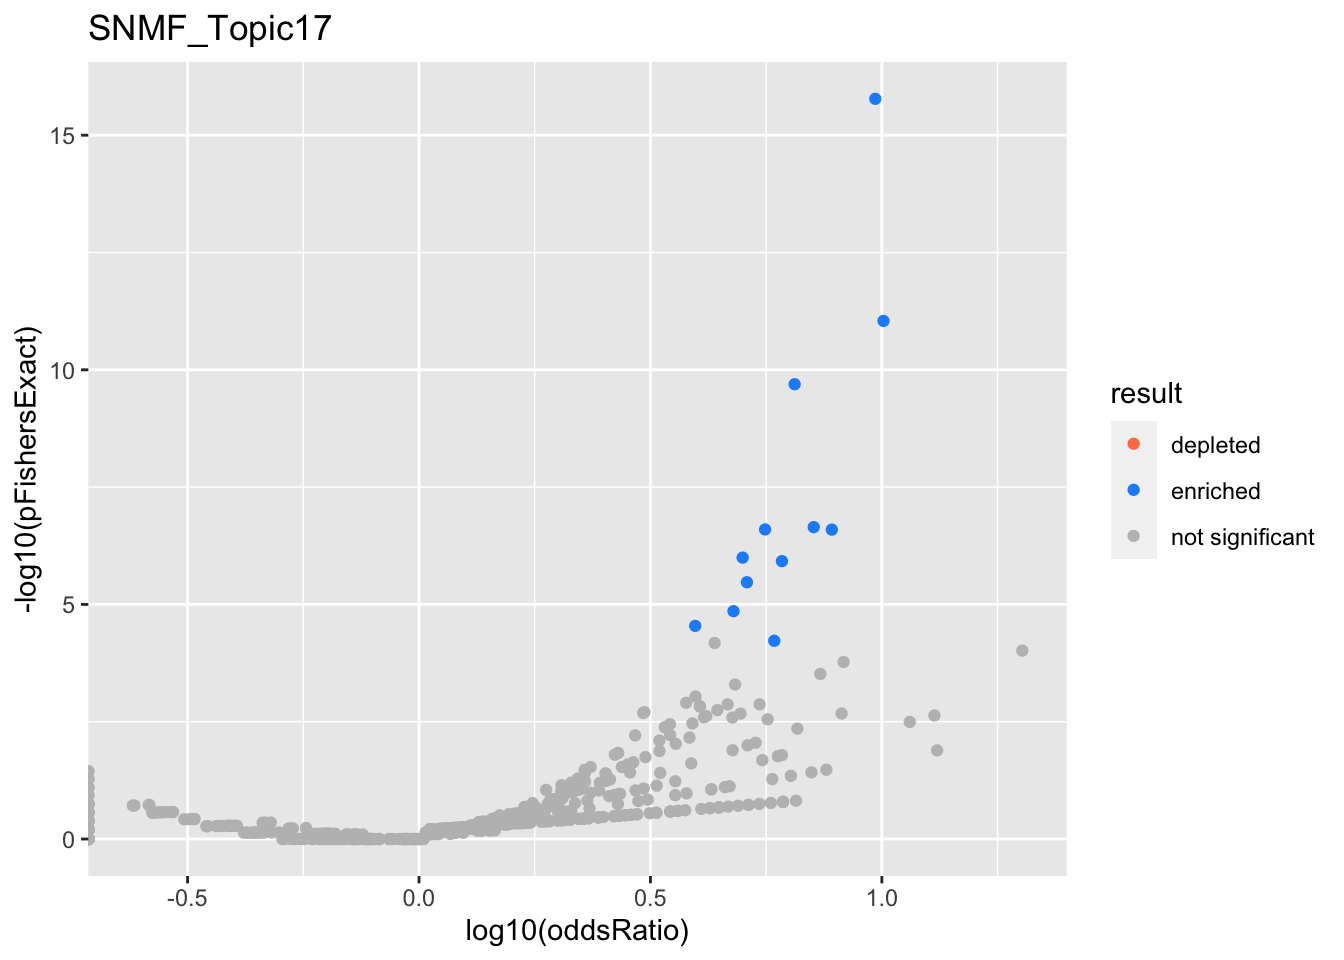
SNMF_Topic18
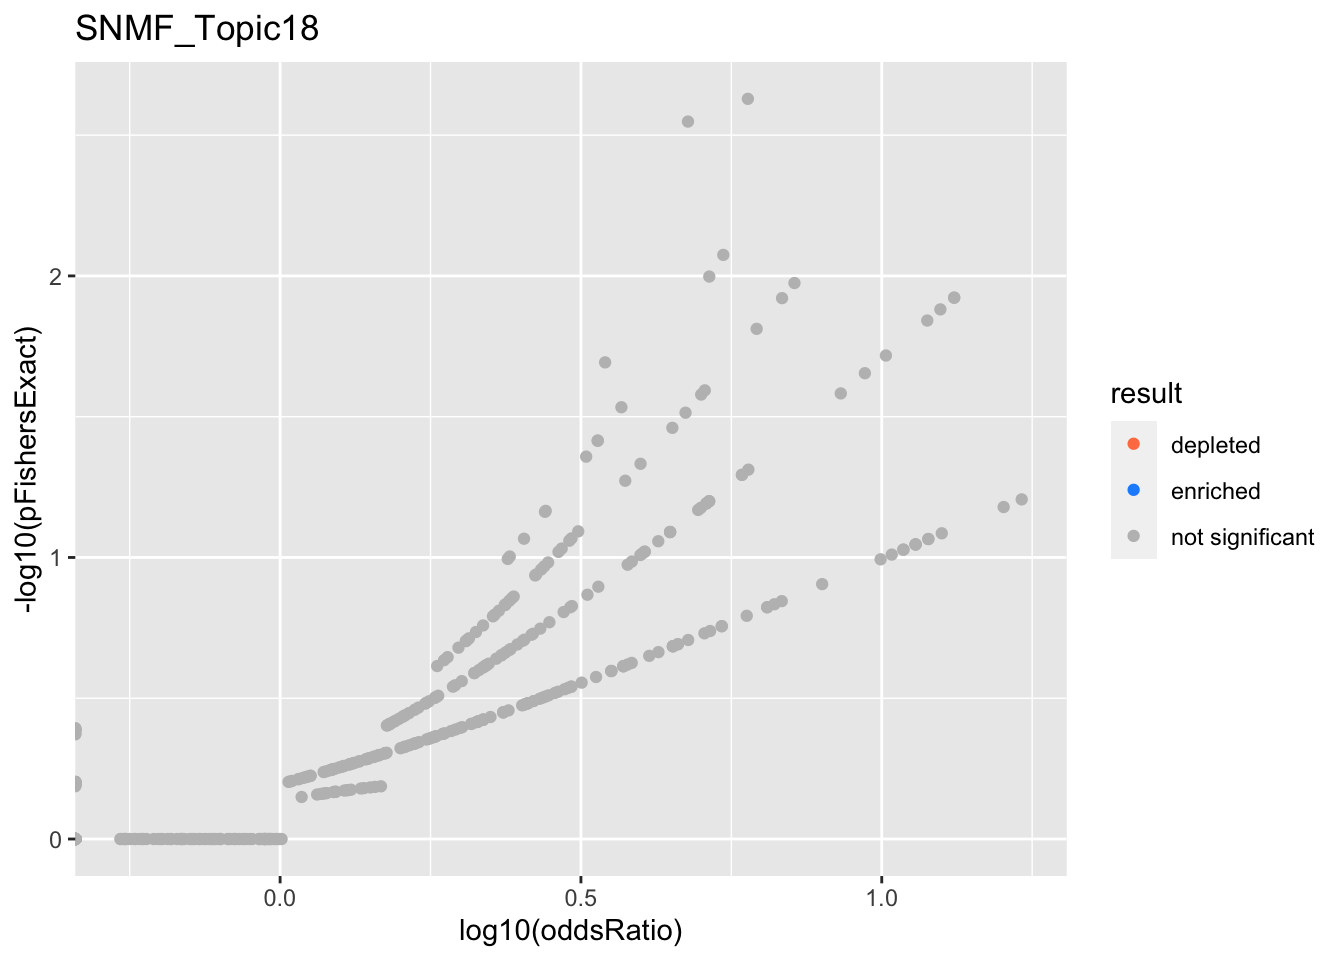
SNMF_Topic19
SNMF_Topic20
SNMF - Negative loadings
res <- negative.fits %>%
  filter(str_detect(experiment, '^SNMF*')) %>%
  get_plot_tbl(., negative.ora)

html_tables <- negative.fits %>%
  filter(str_detect(experiment, '^SNMF*')) %>%
  get_table_tbl(., negative.ora)

experiments <- unique(res$experiment)
for (i in 1:length(experiments)){
  this_experiment <- experiments[i]
  cat("\n")
  cat("###", this_experiment, "\n") # Create second level headings with the names.

  # print volcano plot
  p <- do.volcano(res %>% filter(experiment == this_experiment)) +
    labs(title=this_experiment)
  print(p)

  cat("\n\n")

  # print table
  for(db in names(html_tables[[this_experiment]])){
    cat("####", db, "\n") # Create second level headings with the names.
    to_print <- html_tables[[this_experiment]][[db]] %>% distinct()
    to_print %>% report_susie_credible_sets() %>% htmltools::HTML() %>% print()
    cat("\n")
  }}
SNMF_Topic2
gobp_nr
| geneSet | description | alpha | beta | beta.se | pHypergeometric | pFishersExact | overlap | geneSetSize | oddsRatio |
|---|---|---|---|---|---|---|---|---|---|
| L1 | |||||||||
| GO:0022613 | ribonucleoprotein complex biogenesis | 1 | -1.15 | 0.115 | 1.24e-53 | 1.24e-53 | 163 | 391 | 6.86 |
| L2 | |||||||||
| GO:0140053 | mitochondrial gene expression | 1 | -1.66 | 0.206 | 2.53e-17 | 2.53e-17 | 55 | 139 | 5.8 |
| L3 | |||||||||
| GO:0009123 | nucleoside monophosphate metabolic process | 0.906 | -0.781 | 0.135 | 1.45e-18 | 1.45e-18 | 82 | 255 | 4.26 |
| GO:0009141 | nucleoside triphosphate metabolic process | 0.0891 | -0.735 | 0.137 | 5.64e-17 | 5.64e-17 | 77 | 244 | 4.12 |
| L5 | |||||||||
| GO:0002446 | neutrophil mediated immunity | 0.805 | -0.571 | 0.107 | 3.72e-09 | 6.04e-09 | 85 | 386 | 2.51 |
| GO:0036230 | granulocyte activation | 0.192 | -0.542 | 0.107 | 2.86e-09 | 3.56e-09 | 85 | 384 | 2.53 |
SNMF_Topic3
gobp_nr
| geneSet | description | alpha | beta | beta.se | pHypergeometric | pFishersExact | overlap | geneSetSize | oddsRatio |
|---|---|---|---|---|---|---|---|---|---|
| L1 | |||||||||
| GO:0006413 | translational initiation | 1 | 2.15 | 0.156 | 0.909 | 0.269 | 14 | 177 | 0.806 |
| L2 | |||||||||
| GO:0010257 | NADH dehydrogenase complex assembly | 0.983 | 2.57 | 0.306 | 0.994 | 0.0131 | 0 | 46 | 0 |
| GO:0033108 | mitochondrial respiratory chain complex assembly | 0.0175 | 2.13 | 0.268 | 0.999 | 0.00157 | 0 | 64 | 0 |
| L3 | |||||||||
| GO:0070972 | protein localization to endoplasmic reticulum | 1 | 1.92 | 0.183 | 1 | 0.00239 | 4 | 131 | 0.294 |
| L4 | |||||||||
| GO:0009141 | nucleoside triphosphate metabolic process | 1 | 1.55 | 0.137 | 0.688 | 0.753 | 24 | 244 | 1.03 |
| L5 | |||||||||
| GO:0006414 | translational elongation | 1 | 2.05 | 0.189 | 0.991 | 0.0378 | 6 | 121 | 0.488 |
| L6 | |||||||||
| GO:0070671 | response to interleukin-12 | 1 | 2.41 | 0.306 | 0.993 | 0.0832 | 1 | 44 | 0.218 |
| L7 | |||||||||
| GO:0002446 | neutrophil mediated immunity | 0.795 | 0.997 | 0.114 | 0.991 | 0.0284 | 28 | 386 | 0.73 |
| GO:0036230 | granulocyte activation | 0.205 | 0.982 | 0.115 | 0.994 | 0.0181 | 27 | 384 | 0.705 |
| L8 | |||||||||
| GO:0070585 | protein localization to mitochondrion | 1 | 1.57 | 0.197 | 0.972 | 0.129 | 7 | 117 | 0.596 |
| L9 | |||||||||
| GO:0043687 | post-translational protein modification | 1 | 1.03 | 0.128 | 0.523 | 1 | 33 | 310 | 1.12 |
SNMF_Topic4
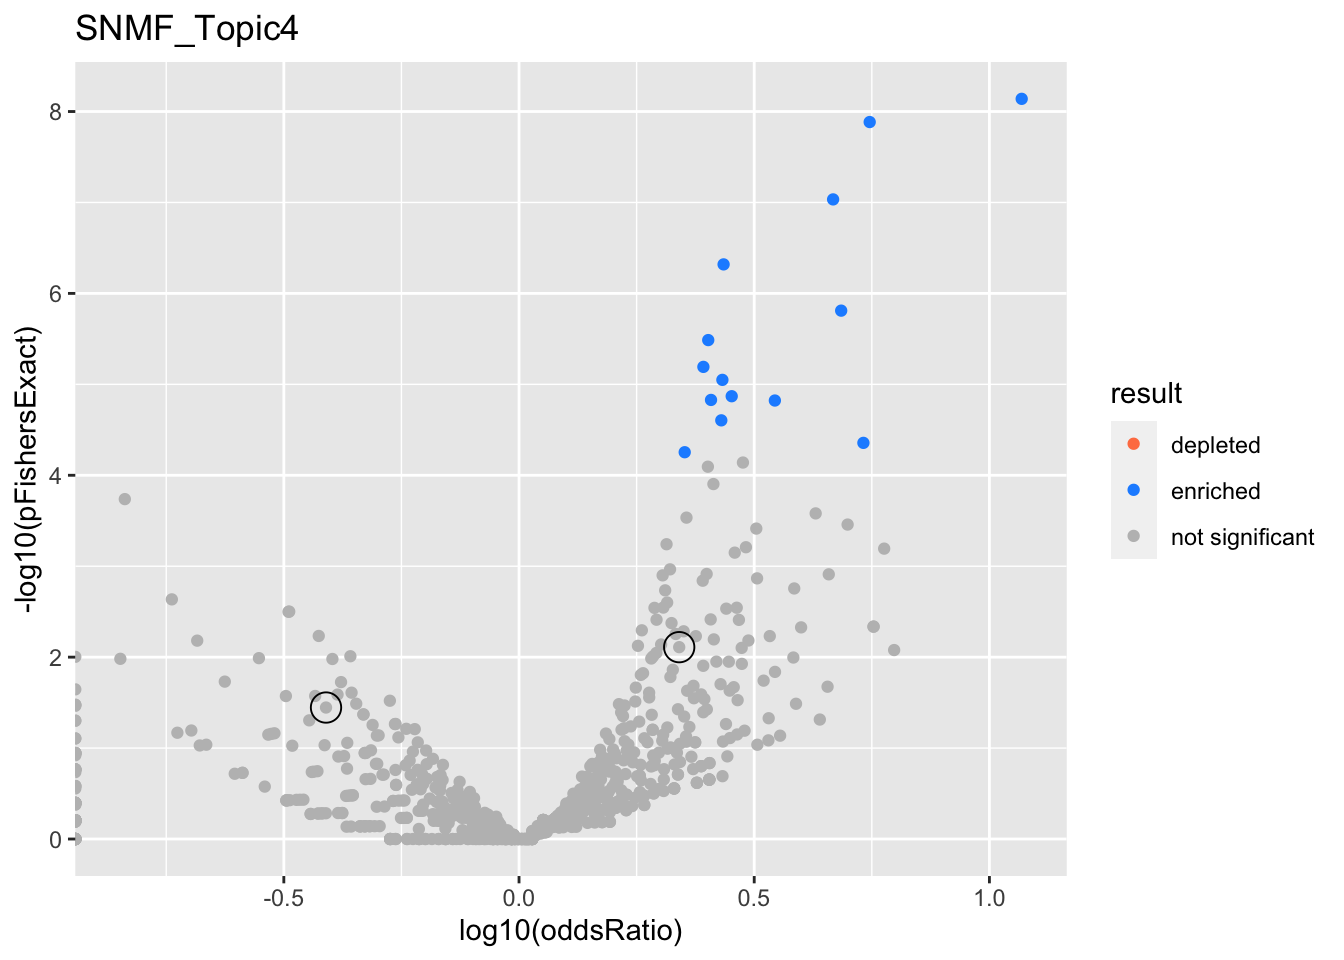
gobp_nr
| geneSet | description | alpha | beta | beta.se | pHypergeometric | pFishersExact | overlap | geneSetSize | oddsRatio |
|---|---|---|---|---|---|---|---|---|---|
| L1 | |||||||||
| GO:0016072 | rRNA metabolic process | 1 | 0.93 | 0.14 | 0.994 | 0.0358 | 4 | 210 | 0.389 |
| L2 | |||||||||
| GO:0006413 | translational initiation | 0.998 | 0.873 | 0.152 | 0.00653 | 0.00777 | 17 | 177 | 2.19 |
SNMF_Topic5
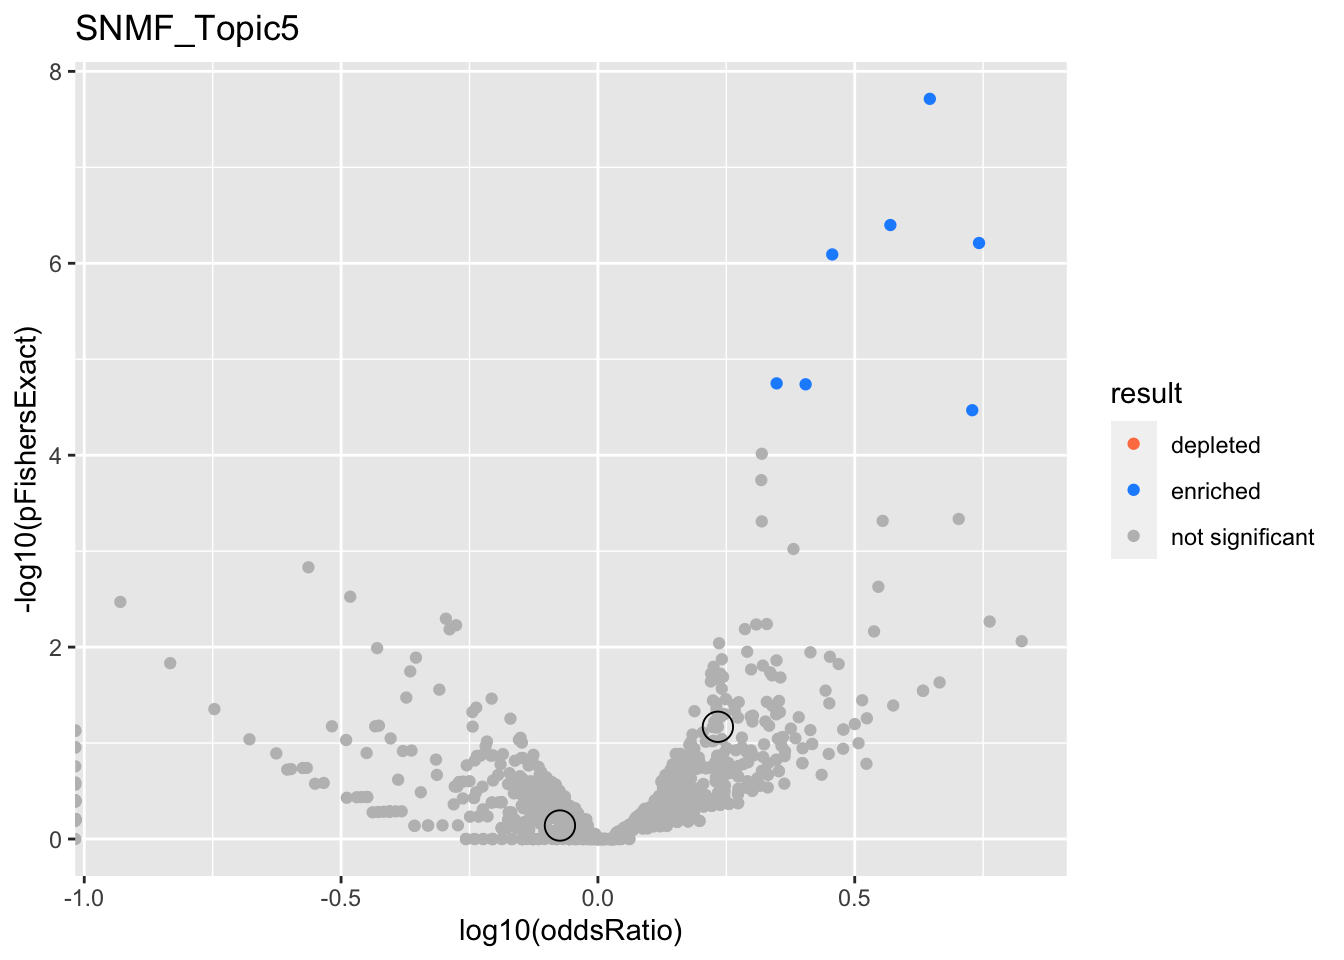
gobp_nr
| geneSet | description | alpha | beta | beta.se | pHypergeometric | pFishersExact | overlap | geneSetSize | oddsRatio |
|---|---|---|---|---|---|---|---|---|---|
| L1 | |||||||||
| GO:0006413 | translational initiation | 1 | 1.38 | 0.153 | 0.0488 | 0.0676 | 18 | 177 | 1.71 |
| L2 | |||||||||
| GO:0070972 | protein localization to endoplasmic reticulum | 1 | 1.33 | 0.177 | 0.781 | 0.723 | 7 | 131 | 0.843 |
SNMF_Topic6
gobp_nr
| geneSet | description | alpha | beta | beta.se | pHypergeometric | pFishersExact | overlap | geneSetSize | oddsRatio |
|---|---|---|---|---|---|---|---|---|---|
| L1 | |||||||||
| GO:0002521 | leukocyte differentiation | 1 | 1.19 | 0.113 | 0.0362 | 1 | 0 | 390 | 0 |
| L2 | |||||||||
| GO:0002250 | adaptive immune response | 1 | 1.19 | 0.135 | 0.0244 | 1 | 0 | 263 | 0 |
SNMF_Topic7
SNMF_Topic8
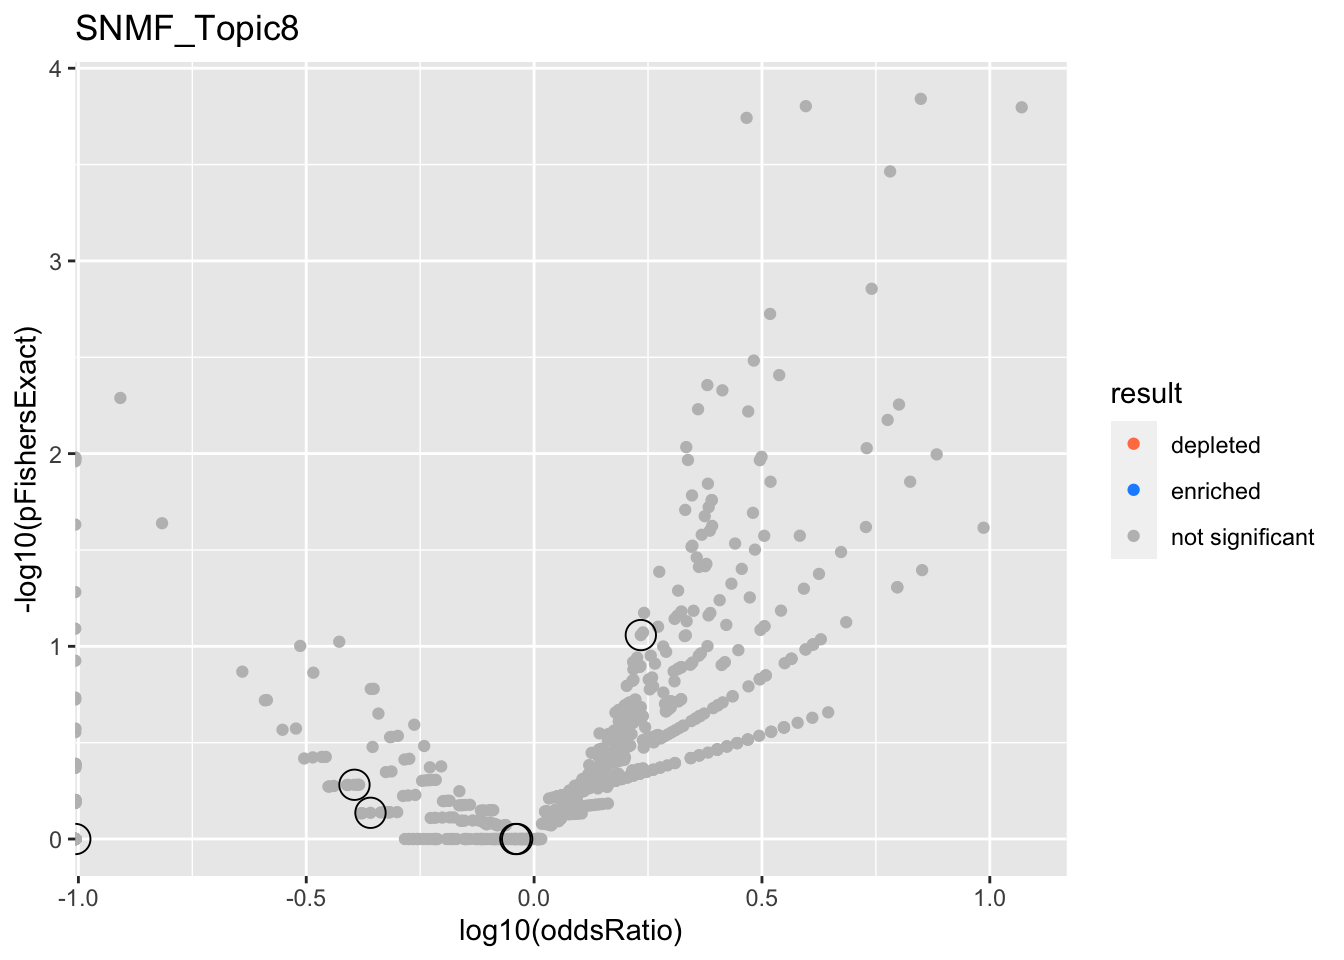
gobp_nr
| geneSet | description | alpha | beta | beta.se | pHypergeometric | pFishersExact | overlap | geneSetSize | oddsRatio |
|---|---|---|---|---|---|---|---|---|---|
| L1 | |||||||||
| GO:0070972 | protein localization to endoplasmic reticulum | 1 | 1.8 | 0.182 | 0.919 | 0.523 | 1 | 131 | 0.403 |
| L2 | |||||||||
| GO:0006414 | translational elongation | 1 | 1.65 | 0.184 | 0.902 | 0.731 | 1 | 121 | 0.437 |
| L3 | |||||||||
| GO:0022613 | ribonucleoprotein complex biogenesis | 1 | 0.866 | 0.107 | 0.068 | 0.0874 | 12 | 391 | 1.71 |
| L4 | |||||||||
| GO:0010257 | NADH dehydrogenase complex assembly | 0.983 | 1.93 | 0.294 | 0.586 | 1 | 0 | 46 | 0 |
| GO:0033108 | mitochondrial respiratory chain complex assembly | 0.0173 | 1.54 | 0.258 | 0.707 | 0.636 | 0 | 64 | 0 |
| L5 | |||||||||
| GO:0006413 | translational initiation | 1 | 1.26 | 0.156 | 0.655 | 1 | 3 | 177 | 0.91 |
| L6 | |||||||||
| GO:0070585 | protein localization to mitochondrion | 1 | 1.3 | 0.189 | 0.653 | 1 | 2 | 117 | 0.918 |
SNMF_Topic9
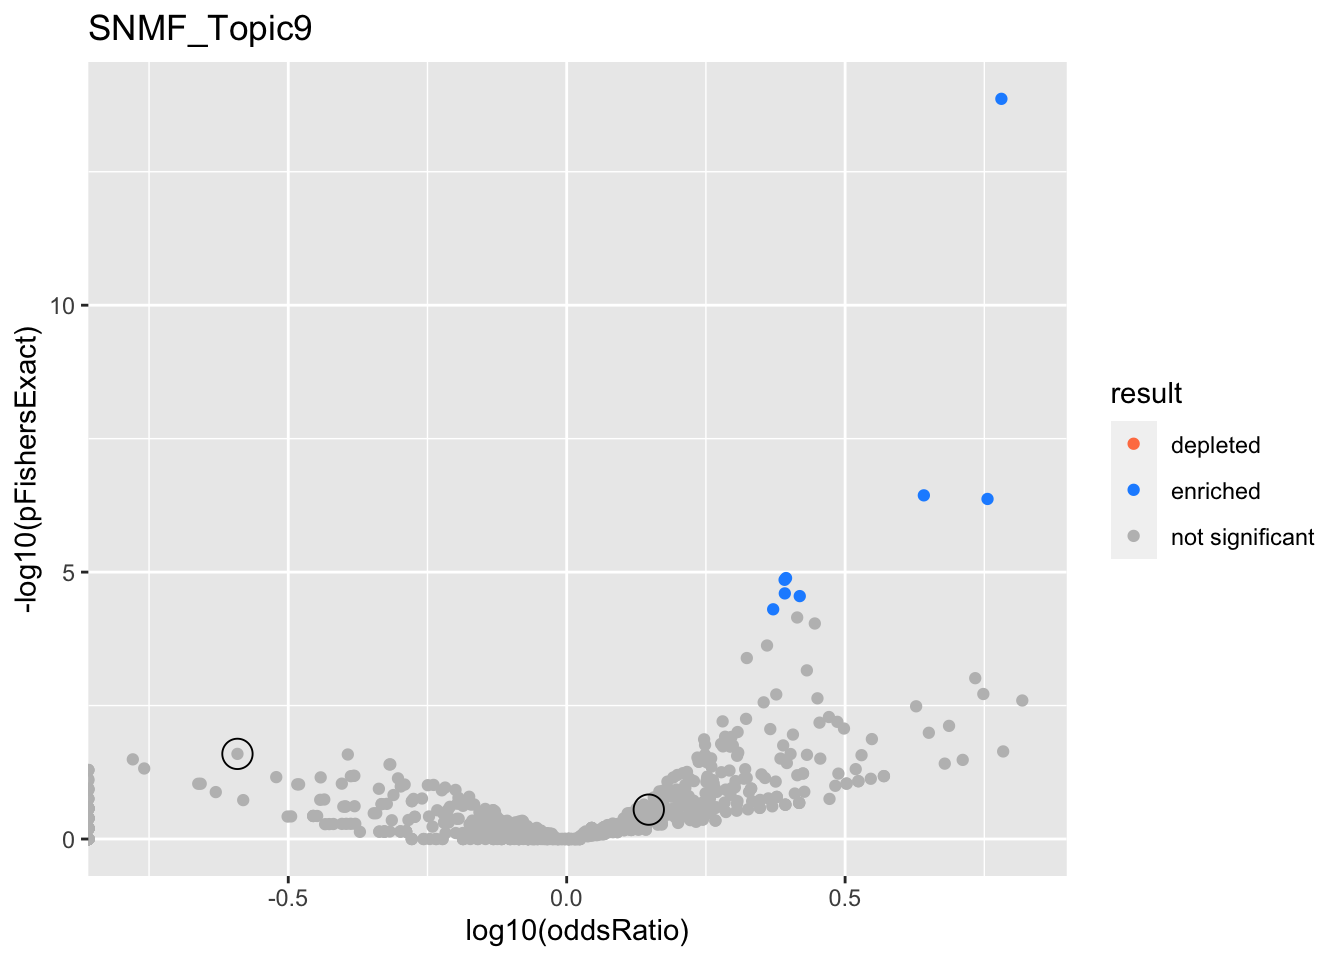
gobp_nr
| geneSet | description | alpha | beta | beta.se | pHypergeometric | pFishersExact | overlap | geneSetSize | oddsRatio |
|---|---|---|---|---|---|---|---|---|---|
| L1 | |||||||||
| GO:0006302 | double-strand break repair | 0.996 | 0.821 | 0.152 | 0.997 | 0.0254 | 2 | 173 | 0.256 |
| L2 | |||||||||
| GO:0006520 | cellular amino acid metabolic process | 0.994 | 0.697 | 0.126 | 0.174 | 0.281 | 15 | 254 | 1.4 |
SNMF_Topic10
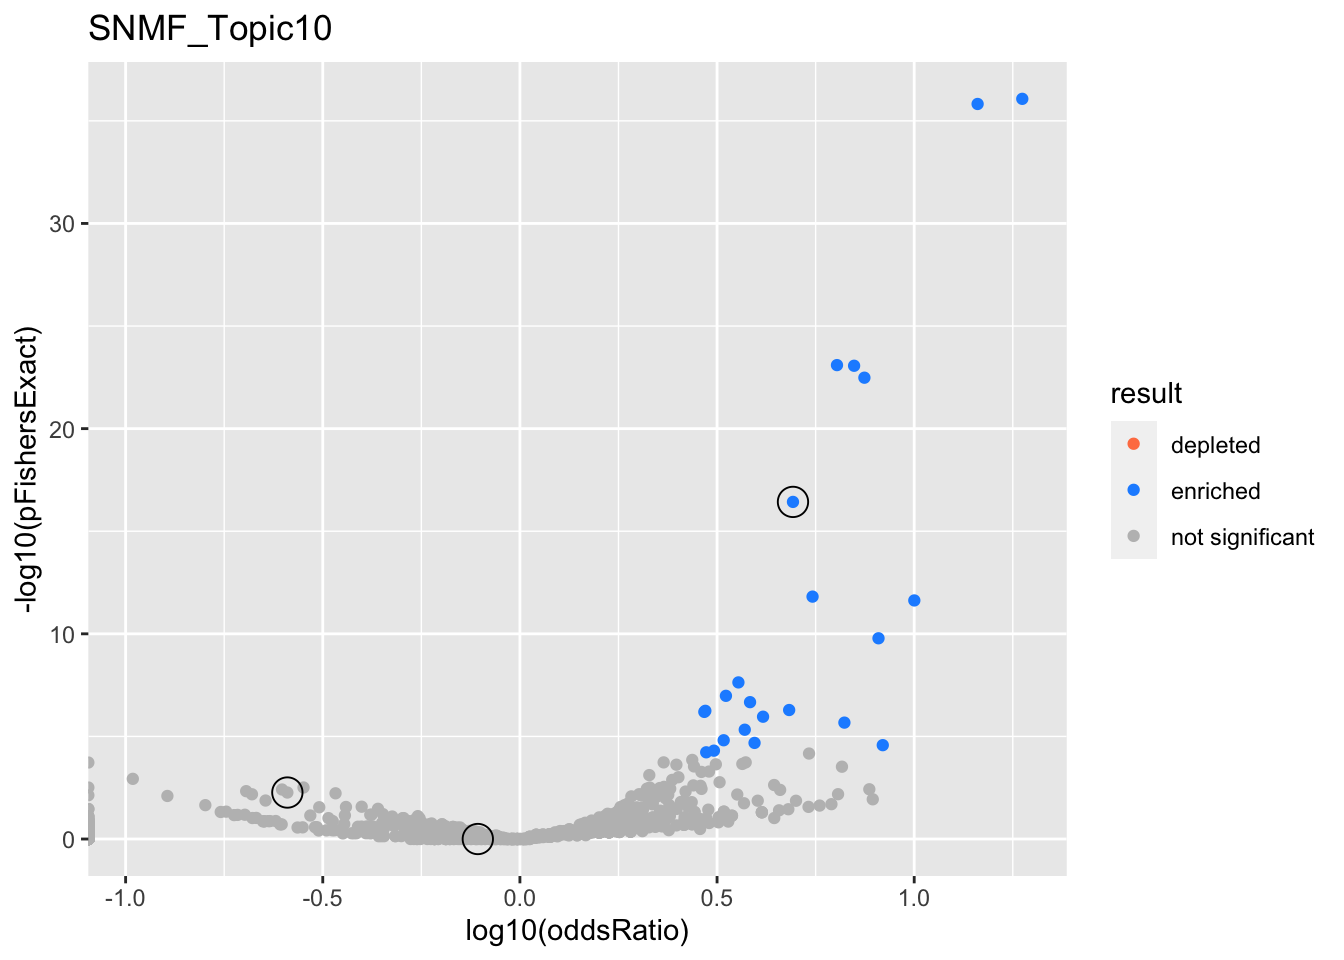
gobp_nr
| geneSet | description | alpha | beta | beta.se | pHypergeometric | pFishersExact | overlap | geneSetSize | oddsRatio |
|---|---|---|---|---|---|---|---|---|---|
| L1 | |||||||||
| GO:0007015 | actin filament organization | 1 | 0.781 | 0.113 | 0.999 | 0.00543 | 3 | 329 | 0.257 |
| L2 | |||||||||
| GO:0022613 | ribonucleoprotein complex biogenesis | 1 | -1.31 | 0.13 | 3.72e-17 | 3.72e-17 | 52 | 391 | 4.93 |
| L3 | |||||||||
| GO:0048013 | ephrin receptor signaling pathway | 0.999 | 1.28 | 0.23 | 0.744 | 1 | 2 | 75 | 0.782 |
SNMF_Topic11
SNMF_Topic12
SNMF_Topic13
SNMF_Topic14
SNMF_Topic15
SNMF_Topic16
SNMF_Topic17
SNMF_Topic18
SNMF_Topic19
SNMF_Topic20
knitr::knit_exit()