Demographic Data
Tina Lasisi
2024-03-03 20:03:14
Last updated: 2024-03-03
Checks: 7 0
Knit directory: PODFRIDGE/
This reproducible R Markdown analysis was created with workflowr (version 1.7.1). The Checks tab describes the reproducibility checks that were applied when the results were created. The Past versions tab lists the development history.
Great! Since the R Markdown file has been committed to the Git repository, you know the exact version of the code that produced these results.
Great job! The global environment was empty. Objects defined in the global environment can affect the analysis in your R Markdown file in unknown ways. For reproduciblity it’s best to always run the code in an empty environment.
The command set.seed(20230302) was run prior to running
the code in the R Markdown file. Setting a seed ensures that any results
that rely on randomness, e.g. subsampling or permutations, are
reproducible.
Great job! Recording the operating system, R version, and package versions is critical for reproducibility.
Nice! There were no cached chunks for this analysis, so you can be confident that you successfully produced the results during this run.
Great job! Using relative paths to the files within your workflowr project makes it easier to run your code on other machines.
Great! You are using Git for version control. Tracking code development and connecting the code version to the results is critical for reproducibility.
The results in this page were generated with repository version 2596546. See the Past versions tab to see a history of the changes made to the R Markdown and HTML files.
Note that you need to be careful to ensure that all relevant files for
the analysis have been committed to Git prior to generating the results
(you can use wflow_publish or
wflow_git_commit). workflowr only checks the R Markdown
file, but you know if there are other scripts or data files that it
depends on. Below is the status of the Git repository when the results
were generated:
Ignored files:
    Ignored:    .DS_Store
    Ignored:    .Rhistory
    Ignored:    .Rproj.user/
    Ignored:    analysis/.DS_Store
    Ignored:    output/.DS_Store
Note that any generated files, e.g. HTML, png, CSS, etc., are not included in this status report because it is ok for generated content to have uncommitted changes.
These are the previous versions of the repository in which changes were
made to the R Markdown (analysis/demo-data.Rmd) and HTML
(docs/demo-data.html) files. If you’ve configured a remote
Git repository (see ?wflow_git_remote), click on the
hyperlinks in the table below to view the files as they were in that
past version.
| File | Version | Author | Date | Message |
|---|---|---|---|---|
| Rmd | 2596546 | Tina Lasisi | 2024-03-03 | wflow_publish("analysis/*", republish = TRUE, all = TRUE, verbose = TRUE) |
| html | 48acb9f | Tina Lasisi | 2024-03-02 | Build site. |
| Rmd | 5352065 | Tina Lasisi | 2024-03-02 | workflowr::wflow_publish(files = "analysis/*", all = TRUE, update = TRUE, |
| html | aa3ff5c | Tina Lasisi | 2024-03-01 | Build site. |
| html | 9e71347 | Tina Lasisi | 2024-01-22 | Build site. |
| html | c280b6f | Tina Lasisi | 2023-04-16 | Build site. |
| html | f89a90f | Tina Lasisi | 2023-04-16 | Build site. |
| html | 5f805fe | Tina Lasisi | 2023-03-06 | Build site. |
| Rmd | 5106bab | Tina Lasisi | 2023-03-06 | add analyses |
| html | c3948af | Tina Lasisi | 2023-03-04 | Build site. |
| html | f02bc38 | Tina Lasisi | 2023-03-03 | Build site. |
| html | c9130d5 | Tina Lasisi | 2023-03-03 | wflow_git_commit(all = TRUE) |
| html | a4a7d45 | Tina Lasisi | 2023-03-03 | Build site. |
| html | 00073fd | Tina Lasisi | 2023-03-03 | Build site. |
| html | 51ed5a6 | Tina Lasisi | 2023-03-02 | Build site. |
| Rmd | 13ed9ae | Tina Lasisi | 2023-03-02 | Publishing POPFORGE |
| html | 13ed9ae | Tina Lasisi | 2023-03-02 | Publishing POPFORGE |
# Load necessary packages
library(wesanderson) # for color palettes
library(RColorBrewer)
library(tidyverse)
── Attaching core tidyverse packages ──────────────────────── tidyverse 2.0.0 ──
✔ dplyr 1.1.4 ✔ readr 2.1.5
✔ forcats 1.0.0 ✔ stringr 1.5.1
✔ ggplot2 3.4.4 ✔ tibble 3.2.1
✔ lubridate 1.9.3 ✔ tidyr 1.3.0
✔ purrr 1.0.2
── Conflicts ────────────────────────────────────────── tidyverse_conflicts() ──
✖ dplyr::filter() masks stats::filter()
✖ dplyr::lag() masks stats::lag()
ℹ Use the conflicted package (<http://conflicted.r-lib.org/>) to force all conflicts to become errorslibrary(patchwork)
knitr::opts_knit$set(root.dir = "..")
knitr::opts_chunk$set(eval = TRUE, echo = FALSE, warning = FALSE, fig.width = 7, fig.height = 6)Demographic data
The population size data (as well as number of children) in our analyses is based on the US Census data hosted at IPUMS USA.
Detailed demographic data
The website here has some figures from an exploratory analysis of birth rate-related data from IPUMS. Due to the terms of agreement for using this data, we cannot share the full dataset but our repo contains the subset that was used to calculate the mean number of offspring and variance.
“STANDARD REDISTRIBUTION TERM You will not redistribute the data without permission. You may publish a subset of the data to meet journal requirements for accessing data related to a particular publication. Contact us for permission for any other redistribution; we will consider requests for free and commercial redistribution.”
citation: Steven Ruggles, Sarah Flood, Matthew Sobek, Daniel Backman, Annie Chen, Grace Cooper, Stephanie Richards, Renae Rogers, and Megan Schouweiler. IPUMS USA: Version 14.0 [dataset]. Minneapolis, MN: IPUMS, 2023. https://doi.org/10.18128/D010.V14.0
Number of children
We start by loading our pre-processed dataset which focuses on the number of children per family from the US Census data.
Attaching package: 'data.table'The following objects are masked from 'package:lubridate':
hour, isoweek, mday, minute, month, quarter, second, wday, week,
yday, yearThe following objects are masked from 'package:dplyr':
between, first, lastThe following object is masked from 'package:purrr':
transposeNext, we identify the unique values of the number of children to understand the range of family sizes.
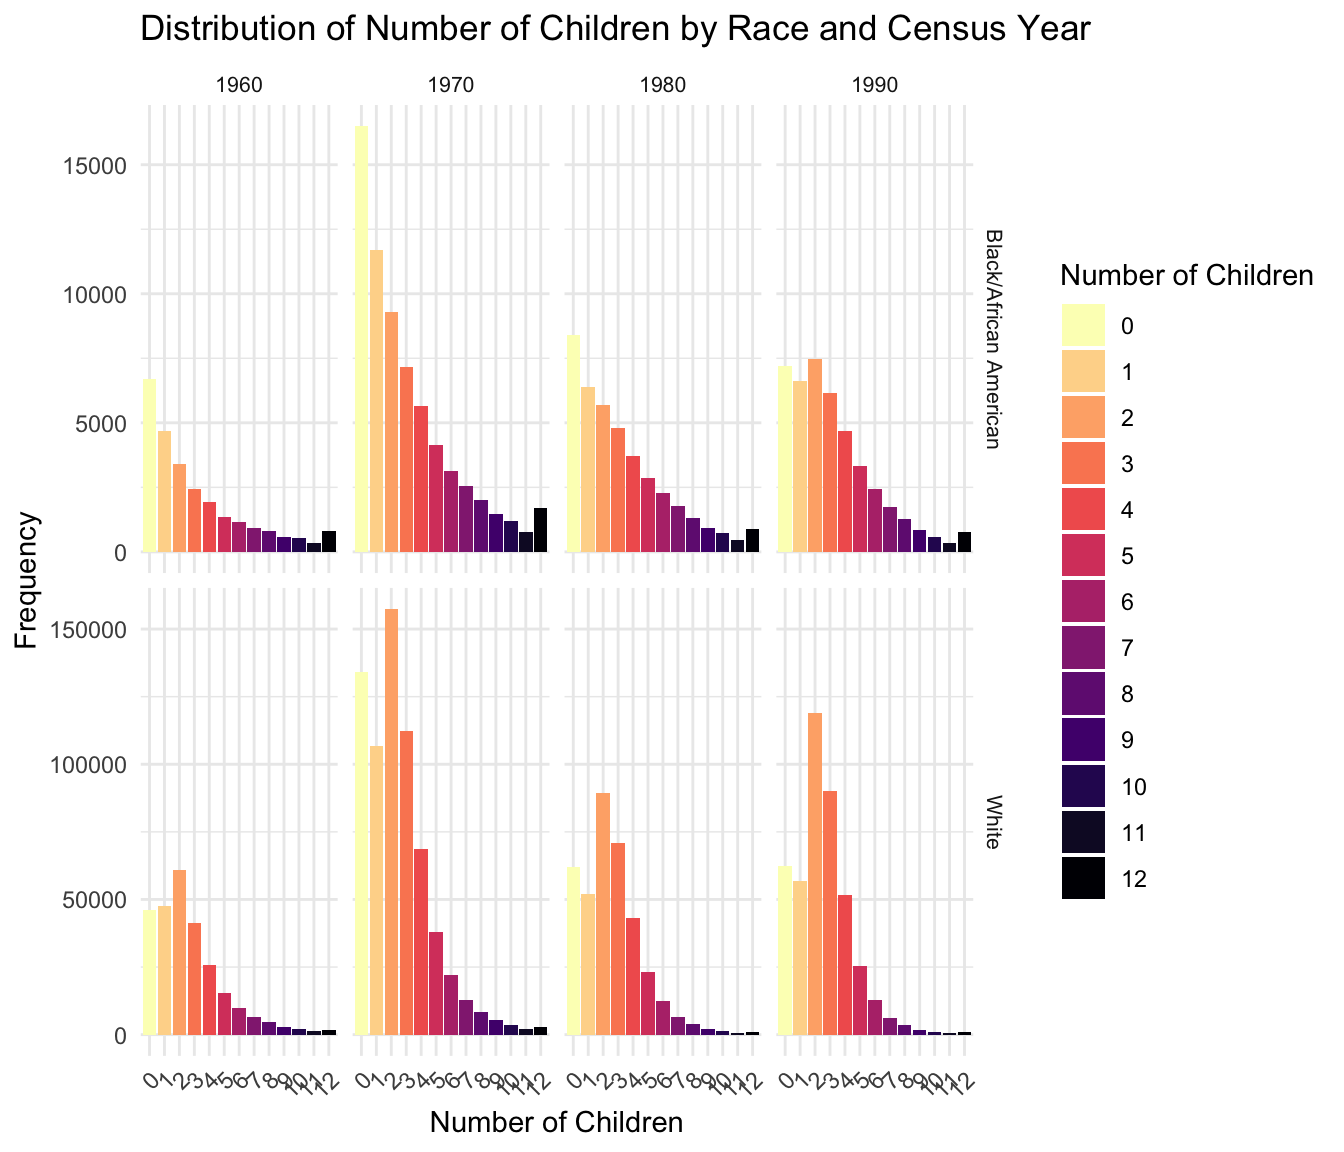
[1] 0 1 2 3 4 5 6 7 8 9 10 11 12We then create a frequency table to analyze the distribution of family sizes across race and census years.
                      RACE YEAR chborn_num      n
1   Black/African American 1960          0   6697
2   Black/African American 1960          1   4698
3   Black/African American 1960          2   3411
4   Black/African American 1960          3   2445
5   Black/African American 1960          4   1949
6   Black/African American 1960          5   1361
7   Black/African American 1960          6   1162
8   Black/African American 1960          7    932
9   Black/African American 1960          8    810
10  Black/African American 1960          9    588
11  Black/African American 1960         10    549
12  Black/African American 1960         11    326
13  Black/African American 1960         12    821
14  Black/African American 1970          0  16490
15  Black/African American 1970          1  11686
16  Black/African American 1970          2   9275
17  Black/African American 1970          3   7161
18  Black/African American 1970          4   5659
19  Black/African American 1970          5   4147
20  Black/African American 1970          6   3147
21  Black/African American 1970          7   2542
22  Black/African American 1970          8   2012
23  Black/African American 1970          9   1473
24  Black/African American 1970         10   1194
25  Black/African American 1970         11    784
26  Black/African American 1970         12   1682
27  Black/African American 1980          0   8417
28  Black/African American 1980          1   6383
29  Black/African American 1980          2   5681
30  Black/African American 1980          3   4797
31  Black/African American 1980          4   3732
32  Black/African American 1980          5   2870
33  Black/African American 1980          6   2264
34  Black/African American 1980          7   1782
35  Black/African American 1980          8   1310
36  Black/African American 1980          9    943
37  Black/African American 1980         10    717
38  Black/African American 1980         11    452
39  Black/African American 1980         12    870
40  Black/African American 1990          0   7193
41  Black/African American 1990          1   6635
42  Black/African American 1990          2   7485
43  Black/African American 1990          3   6161
44  Black/African American 1990          4   4673
45  Black/African American 1990          5   3333
46  Black/African American 1990          6   2445
47  Black/African American 1990          7   1752
48  Black/African American 1990          8   1263
49  Black/African American 1990          9    853
50  Black/African American 1990         10    590
51  Black/African American 1990         11    348
52  Black/African American 1990         12    772
53                   White 1960          0  46202
54                   White 1960          1  47433
55                   White 1960          2  60732
56                   White 1960          3  41272
57                   White 1960          4  25666
58                   White 1960          5  15327
59                   White 1960          6   9697
60                   White 1960          7   6347
61                   White 1960          8   4518
62                   White 1960          9   2990
63                   White 1960         10   2148
64                   White 1960         11   1280
65                   White 1960         12   1747
66                   White 1970          0 133940
67                   White 1970          1 106663
68                   White 1970          2 157405
69                   White 1970          3 112397
70                   White 1970          4  68603
71                   White 1970          5  38000
72                   White 1970          6  22023
73                   White 1970          7  12927
74                   White 1970          8   8534
75                   White 1970          9   5342
76                   White 1970         10   3593
77                   White 1970         11   2082
78                   White 1970         12   2858
79                   White 1980          0  61909
80                   White 1980          1  51856
81                   White 1980          2  89551
82                   White 1980          3  70716
83                   White 1980          4  43190
84                   White 1980          5  23170
85                   White 1980          6  12556
86                   White 1980          7   6589
87                   White 1980          8   3874
88                   White 1980          9   2254
89                   White 1980         10   1368
90                   White 1980         11    757
91                   White 1980         12   1073
92                   White 1990          0  62471
93                   White 1990          1  56647
94                   White 1990          2 119054
95                   White 1990          3  90170
96                   White 1990          4  51511
97                   White 1990          5  25385
98                   White 1990          6  12698
99                   White 1990          7   6292
100                  White 1990          8   3479
101                  White 1990          9   1876
102                  White 1990         10   1132
103                  White 1990         11    623
104                  White 1990         12    828
Loading required package: viridisLite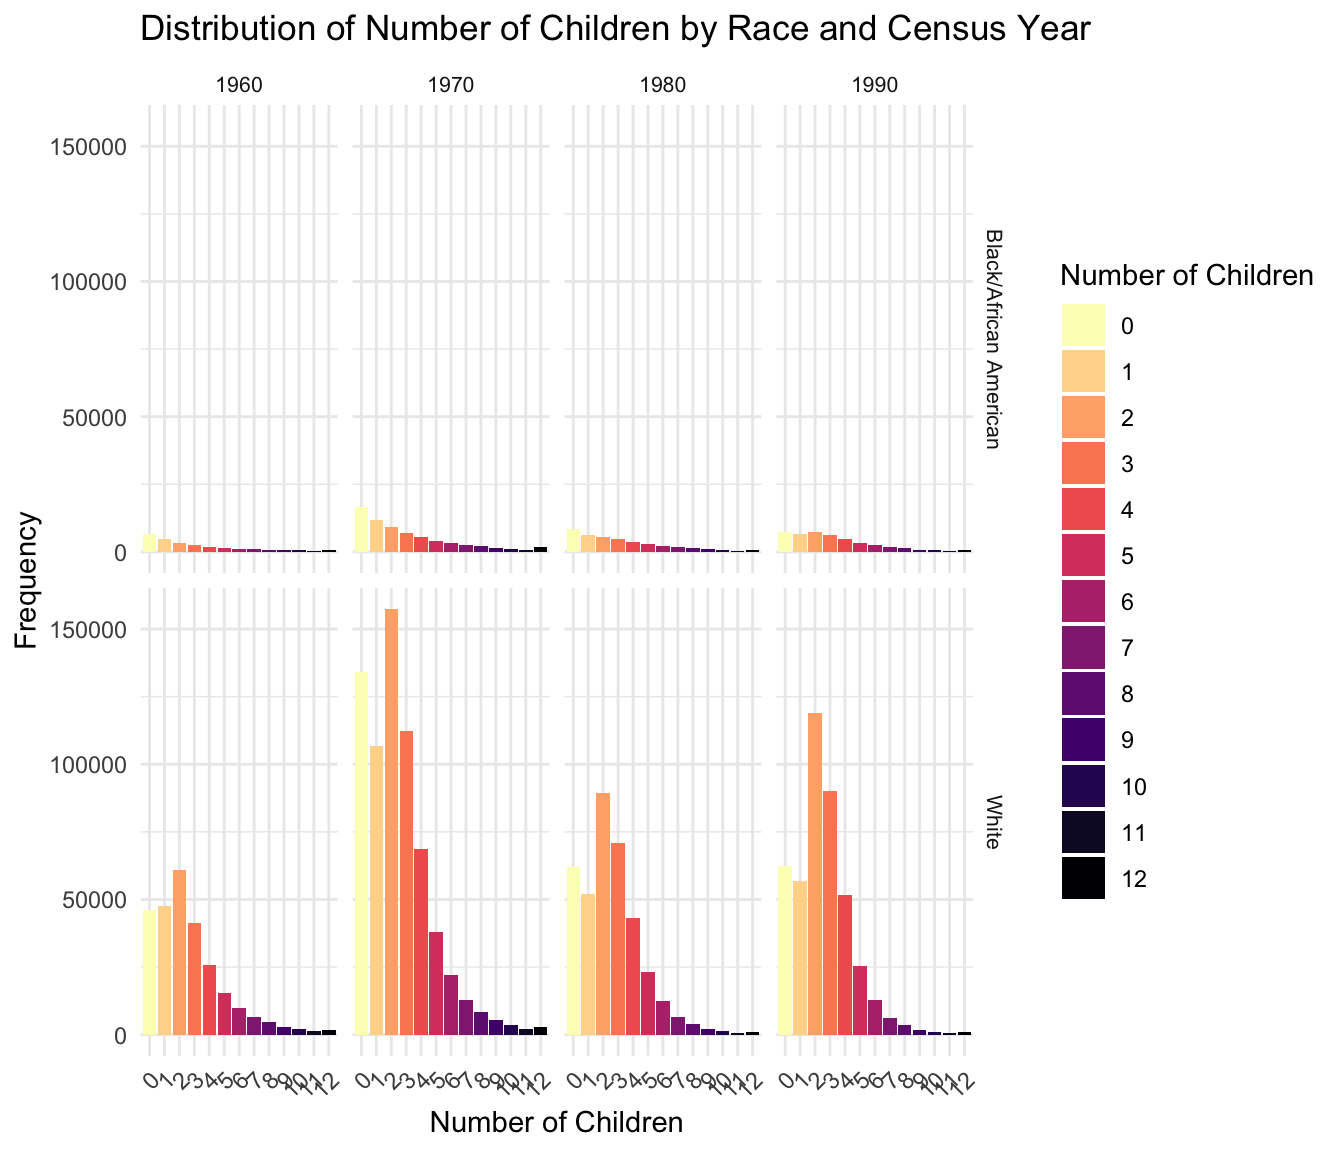
| Version | Author | Date |
|---|---|---|
| 48acb9f | Tina Lasisi | 2024-03-02 |
| Version | Author | Date |
|---|---|---|
| 48acb9f | Tina Lasisi | 2024-03-02 |
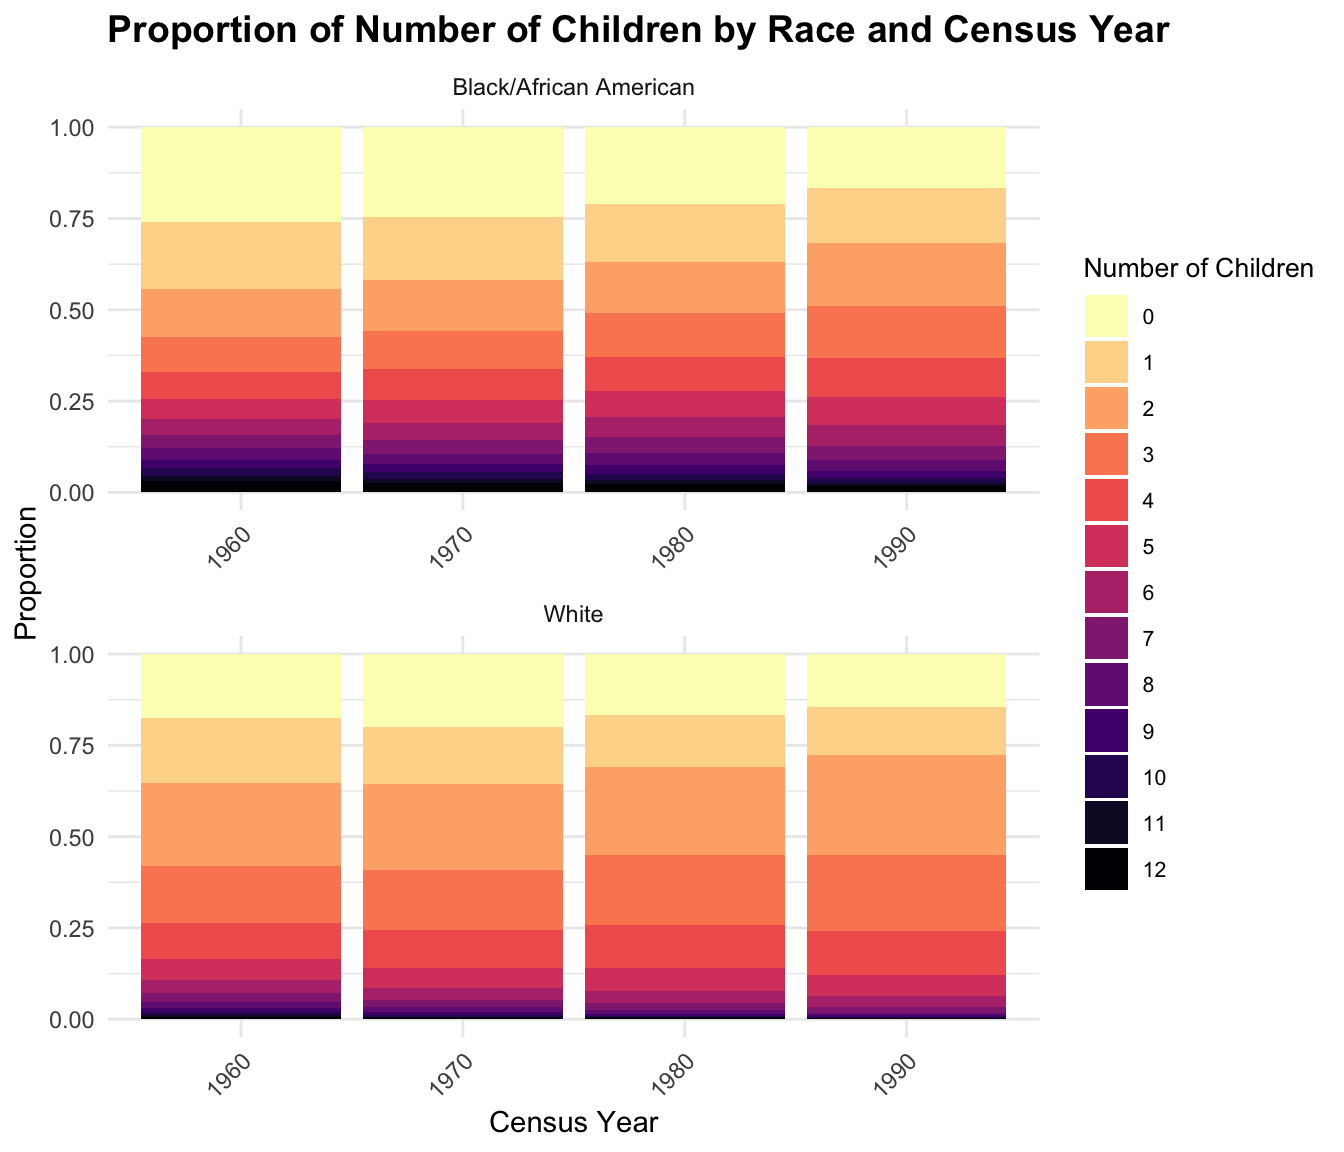
To compare distributions within the context of the total population, we calculate and visualize proportions.
| Version | Author | Date |
|---|---|---|
| 48acb9f | Tina Lasisi | 2024-03-02 |
And we summarize the mean and variance per year
`summarise()` has grouped output by 'RACE'. You can override using the
`.groups` argument.
# A tibble: 8 × 4
# Groups: RACE [2]
RACE YEAR Mean Variance
<chr> <int> <dbl> <dbl>
1 Black/African American 1960 3.02 10.5
2 Black/African American 1970 3.00 9.57
3 Black/African American 1980 3.21 9.21
4 Black/African American 1990 3.20 7.84
5 White 1960 2.62 5.47
6 White 1970 2.45 4.69
7 White 1980 2.55 4.10
8 White 1990 2.53 3.46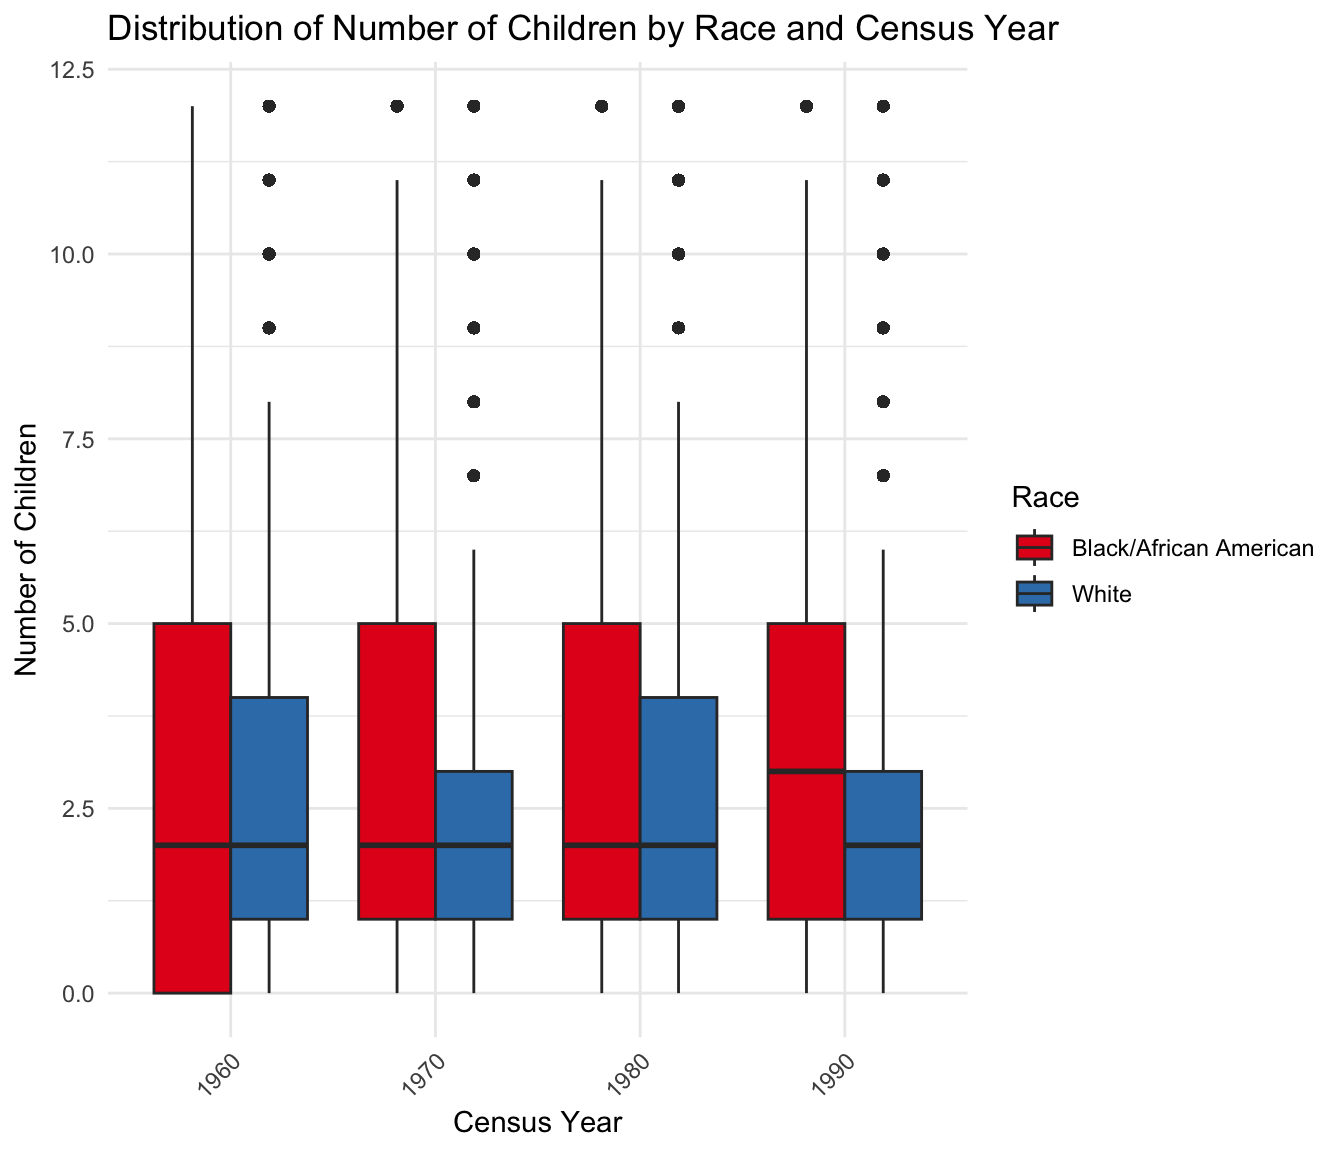
| Version | Author | Date |
|---|---|---|
| 48acb9f | Tina Lasisi | 2024-03-02 |
Database size
What are realistic database sizes for US European- and African American populations? From 23andMe publications it seems that 80% of their customers identify as White (non-Hispanic) and that around 3% of their customers identify as African American or Black (see here where they say that their sample represents their customer database and the US population). This broadly agrees with data seen in a 23andme poster presented in 2011 (see here)
For now, the analyses will use an estimate of 80% for White Americans and 5% for Black Americans in the DTC databases.
R version 4.3.2 (2023-10-31)
Platform: aarch64-apple-darwin20 (64-bit)
Running under: macOS Sonoma 14.3.1

Matrix products: default
BLAS:   /Library/Frameworks/R.framework/Versions/4.3-arm64/Resources/lib/libRblas.0.dylib
LAPACK: /Library/Frameworks/R.framework/Versions/4.3-arm64/Resources/lib/libRlapack.dylib;  LAPACK version 3.11.0

locale:
[1] en_US.UTF-8/en_US.UTF-8/en_US.UTF-8/C/en_US.UTF-8/en_US.UTF-8

time zone: America/Detroit
tzcode source: internal

attached base packages:
[1] stats     graphics  grDevices utils     datasets  methods   base

other attached packages:
 [1] viridis_0.6.5      viridisLite_0.4.2  data.table_1.14.10 patchwork_1.2.0
 [5] lubridate_1.9.3    forcats_1.0.0      stringr_1.5.1      dplyr_1.1.4
 [9] purrr_1.0.2        readr_2.1.5        tidyr_1.3.0        tibble_3.2.1
[13] ggplot2_3.4.4      tidyverse_2.0.0    RColorBrewer_1.1-3 wesanderson_0.3.7
[17] workflowr_1.7.1

loaded via a namespace (and not attached):
 [1] gtable_0.3.4      xfun_0.41         bslib_0.6.1       processx_3.8.3
 [5] callr_3.7.3       tzdb_0.4.0        vctrs_0.6.5       tools_4.3.2
 [9] ps_1.7.5          generics_0.1.3    fansi_1.0.6       highr_0.10
[13] pkgconfig_2.0.3   lifecycle_1.0.4   compiler_4.3.2    farver_2.1.1
[17] git2r_0.33.0      munsell_0.5.0     getPass_0.2-4     httpuv_1.6.13
[21] htmltools_0.5.7   sass_0.4.8        yaml_2.3.8        later_1.3.2
[25] pillar_1.9.0      jquerylib_0.1.4   whisker_0.4.1     cachem_1.0.8
[29] tidyselect_1.2.0  digest_0.6.34     stringi_1.8.3     labeling_0.4.3
[33] rprojroot_2.0.4   fastmap_1.1.1     grid_4.3.2        colorspace_2.1-0
[37] cli_3.6.2         magrittr_2.0.3    utf8_1.2.4        withr_2.5.2
[41] scales_1.3.0      promises_1.2.1    timechange_0.2.0  rmarkdown_2.25
[45] httr_1.4.7        gridExtra_2.3     hms_1.1.3         evaluate_0.23
[49] knitr_1.45        rlang_1.1.3       Rcpp_1.0.12       glue_1.7.0
[53] rstudioapi_0.15.0 jsonlite_1.8.8    R6_2.5.1          fs_1.6.3