Database composition
Tina Lasisi, Stella BooydeGraaff
2024-09-16 21:02:13
Last updated: 2024-09-16
Checks: 7 0
Knit directory: PODFRIDGE/
This reproducible R Markdown analysis was created with workflowr (version 1.7.1). The Checks tab describes the reproducibility checks that were applied when the results were created. The Past versions tab lists the development history.
Great! Since the R Markdown file has been committed to the Git repository, you know the exact version of the code that produced these results.
Great job! The global environment was empty. Objects defined in the global environment can affect the analysis in your R Markdown file in unknown ways. For reproduciblity it’s best to always run the code in an empty environment.
The command set.seed(20230302) was run prior to running
the code in the R Markdown file. Setting a seed ensures that any results
that rely on randomness, e.g. subsampling or permutations, are
reproducible.
Great job! Recording the operating system, R version, and package versions is critical for reproducibility.
Nice! There were no cached chunks for this analysis, so you can be confident that you successfully produced the results during this run.
Great job! Using relative paths to the files within your workflowr project makes it easier to run your code on other machines.
Great! You are using Git for version control. Tracking code development and connecting the code version to the results is critical for reproducibility.
The results in this page were generated with repository version 6176bd3. See the Past versions tab to see a history of the changes made to the R Markdown and HTML files.
Note that you need to be careful to ensure that all relevant files for
the analysis have been committed to Git prior to generating the results
(you can use wflow_publish or
wflow_git_commit). workflowr only checks the R Markdown
file, but you know if there are other scripts or data files that it
depends on. Below is the status of the Git repository when the results
were generated:
Ignored files:
    Ignored:    .DS_Store
    Ignored:    .Rhistory
    Ignored:    .Rproj.user/
    Ignored:    data/.DS_Store
    Ignored:    output/.DS_Store
Note that any generated files, e.g. HTML, png, CSS, etc., are not included in this status report because it is ok for generated content to have uncommitted changes.
These are the previous versions of the repository in which changes were
made to the R Markdown (analysis/database-composition.Rmd)
and HTML (docs/database-composition.html) files. If you’ve
configured a remote Git repository (see ?wflow_git_remote),
click on the hyperlinks in the table below to view the files as they
were in that past version.
| File | Version | Author | Date | Message |
|---|---|---|---|---|
| Rmd | c7eb982 | Stella-Joy | 2024-09-04 | Small color shift in Race gradient |
| html | 70651c7 | Stella-Joy | 2024-09-04 | knit DTC figures |
| Rmd | 785760b | Stella-Joy | 2024-09-04 | Creating DTC figures |
| Rmd | f3f52cd | Stella-Joy | 2024-09-03 | DTC access visual |
| html | cf281b6 | Tina Lasisi | 2024-03-03 | Build site. |
| Rmd | 2596546 | Tina Lasisi | 2024-03-03 | wflow_publish("analysis/*", republish = TRUE, all = TRUE, verbose = TRUE) |
| html | 48acb9f | Tina Lasisi | 2024-03-02 | Build site. |
| html | aa3ff5c | Tina Lasisi | 2024-03-01 | Build site. |
| html | e4c698e | Tina Lasisi | 2024-02-27 | Publish new pages + update plots |
| Rmd | b6c047d | Tina Lasisi | 2024-01-26 | update extensions |
| html | 9e71347 | Tina Lasisi | 2024-01-22 | Build site. |
| Rmd | 1f3a662 | Tina Lasisi | 2024-01-22 | Republish website with database composition page. |
| Rmd | 9bbc7fb | Tina Lasisi | 2024-01-21 | Add new page for database composition + data |
Forensic
Data based on Murphy & Tong
Analysis of Demographic Group Representation in Database vs Population
This document presents an analysis of the representation of various demographic groups in a database compared to their representation in the general population across different states.
Data Loading and Preparation
We start by loading the necessary libraries and the dataset.
Rows: 77 Columns: 4
── Column specification ────────────────────────────────────────────────────────
Delimiter: ","
chr (4): State, Demographic Group, Context, Value

ℹ Use `spec()` to retrieve the full column specification for this data.
ℹ Specify the column types or set `show_col_types = FALSE` to quiet this message.
Rows: 14 Columns: 3
── Column specification ────────────────────────────────────────────────────────
Delimiter: ","
chr (3): Demographic, Region, Value

ℹ Use `spec()` to retrieve the full column specification for this data.
ℹ Specify the column types or set `show_col_types = FALSE` to quiet this message.
Data Cleaning
The data contains demographic information with percentages in two contexts: ‘Database’ and ‘Population’. We need to clean and transform the data for analysis.
Data Visualization
We create a visualization to show the differences in representation for each demographic group by state.
Warning: Removed 5 rows containing missing values or values outside the scale range
(`geom_bar()`).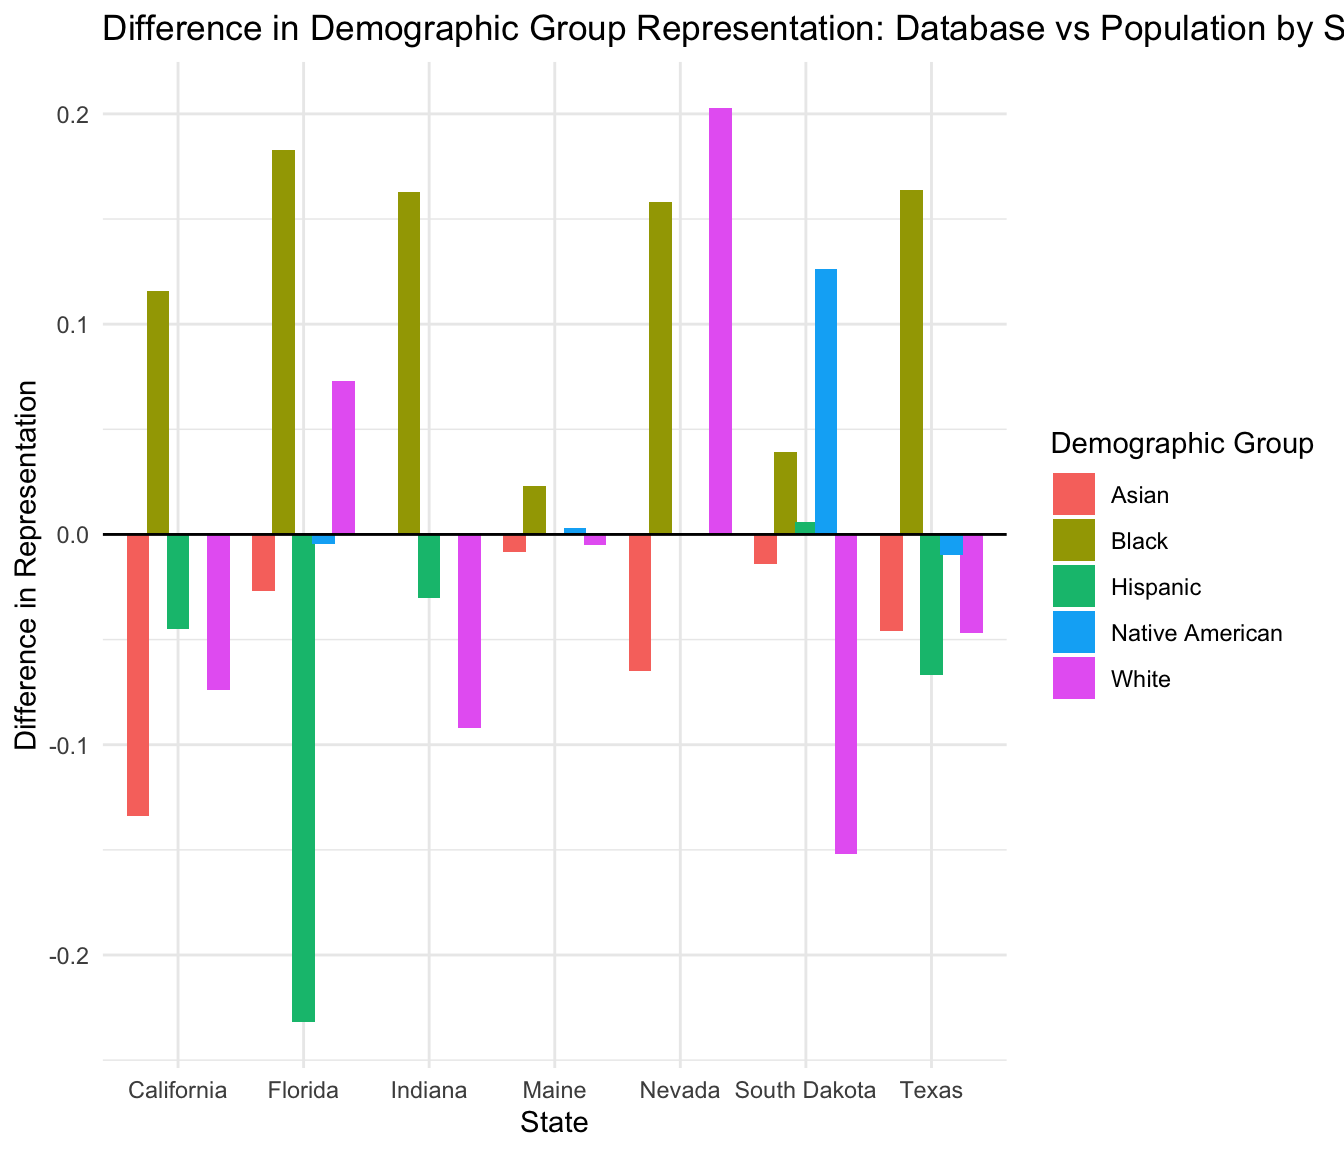
Summary Table
Finally, we create a summary table showing the difference in representation for each state and demographic group.
`summarise()` has grouped output by 'State'. You can override using the
`.groups` argument.
# A tibble: 35 × 3
State `Demographic Group` Difference
<chr> <chr> <dbl>
1 California Asian -0.134
2 California Black 0.116
3 California Hispanic -0.045
4 California Native American NA
5 California White -0.0740
6 Florida Asian -0.0267
7 Florida Black 0.183
8 Florida Hispanic -0.232
9 Florida Native American -0.0044
10 Florida White 0.0730
# ℹ 25 more rows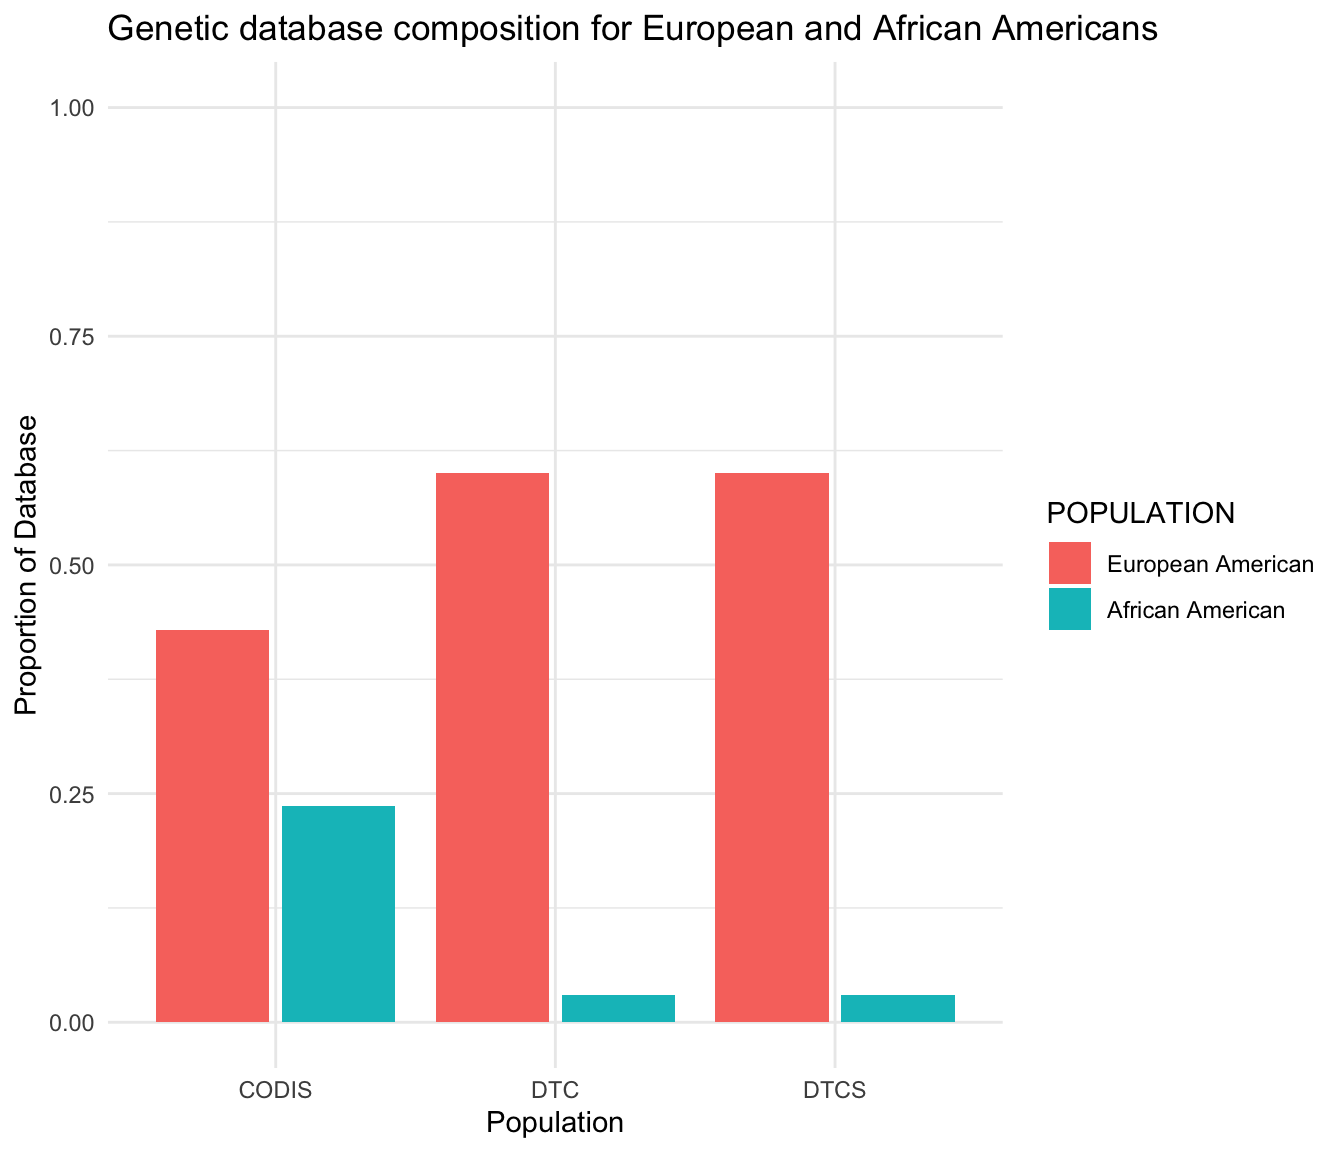
Direct-to-Consumer Database Statistics
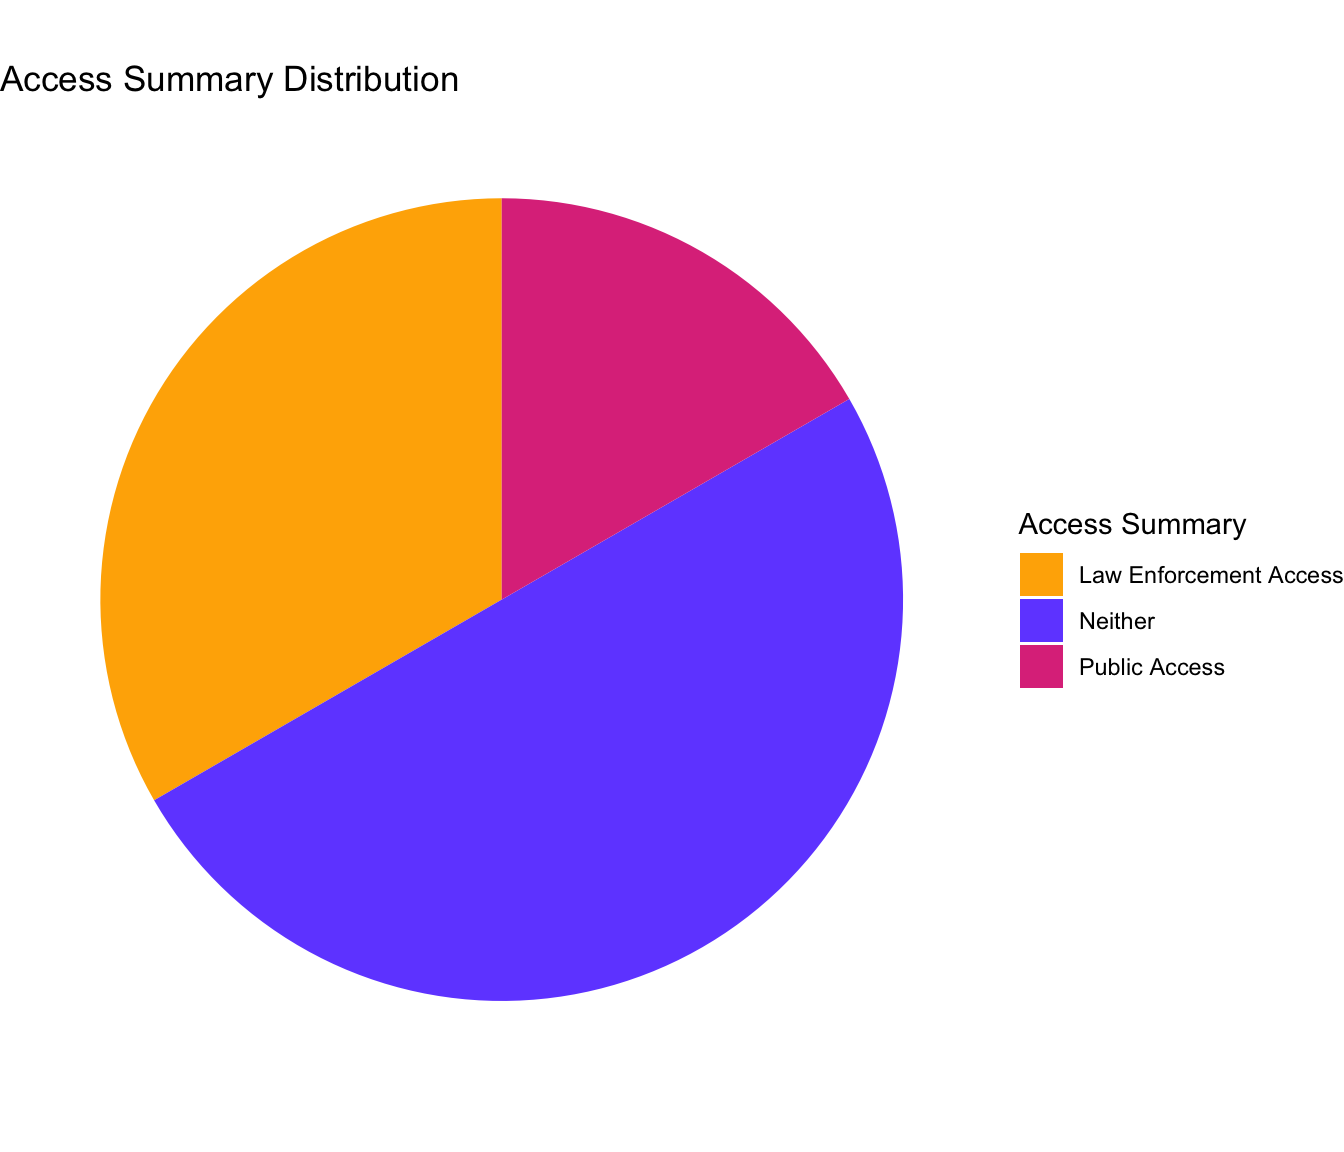
Accessibility of Direct-to-Consumer Databases
Each Direct-to-Consumer company has different policies on whether their databases are accessible to law enforcement or to the public. The following chart shows the ratio of which of the six main companies allow for which group to access them.
| Version | Author | Date |
|---|---|---|
| 70651c7 | Stella-Joy | 2024-09-04 |
The companies that law enforcement can access are FamilyTreeDNA and GEDmatch. FamilyTreeDNA allows users to opt out but have a history of violating their Terms of Service. GEDmatch also sells access to law enforcement and has a history of violating their Terms of Service, but since the law enforcement used this database to find the Golden State Killer in 2018, they have created an opt-in option for sharing data with law enforcement.
The company whose database is open to the public is MyHeritage. Genetic data is not publicly available, but records such as birth, marriage, death, burial, census, military, immigration, yearbooks are. Family sites and certain settings can allow for publicly accessible genetic data as well.
The other Direct-to-Consumer companies are characterized as allowing access to neither law enforcement or the public. Ancestry DNA requires valid legal reasoning to share data with law enforcement. 23andMe has an opt-in option for scientific researcher that 81% of users do. Living DNA shares anonymous data with third parties, and has an opt-in option to share data with researchers, however, they do not sell data to law enforcement unless feel they are legally compelled.
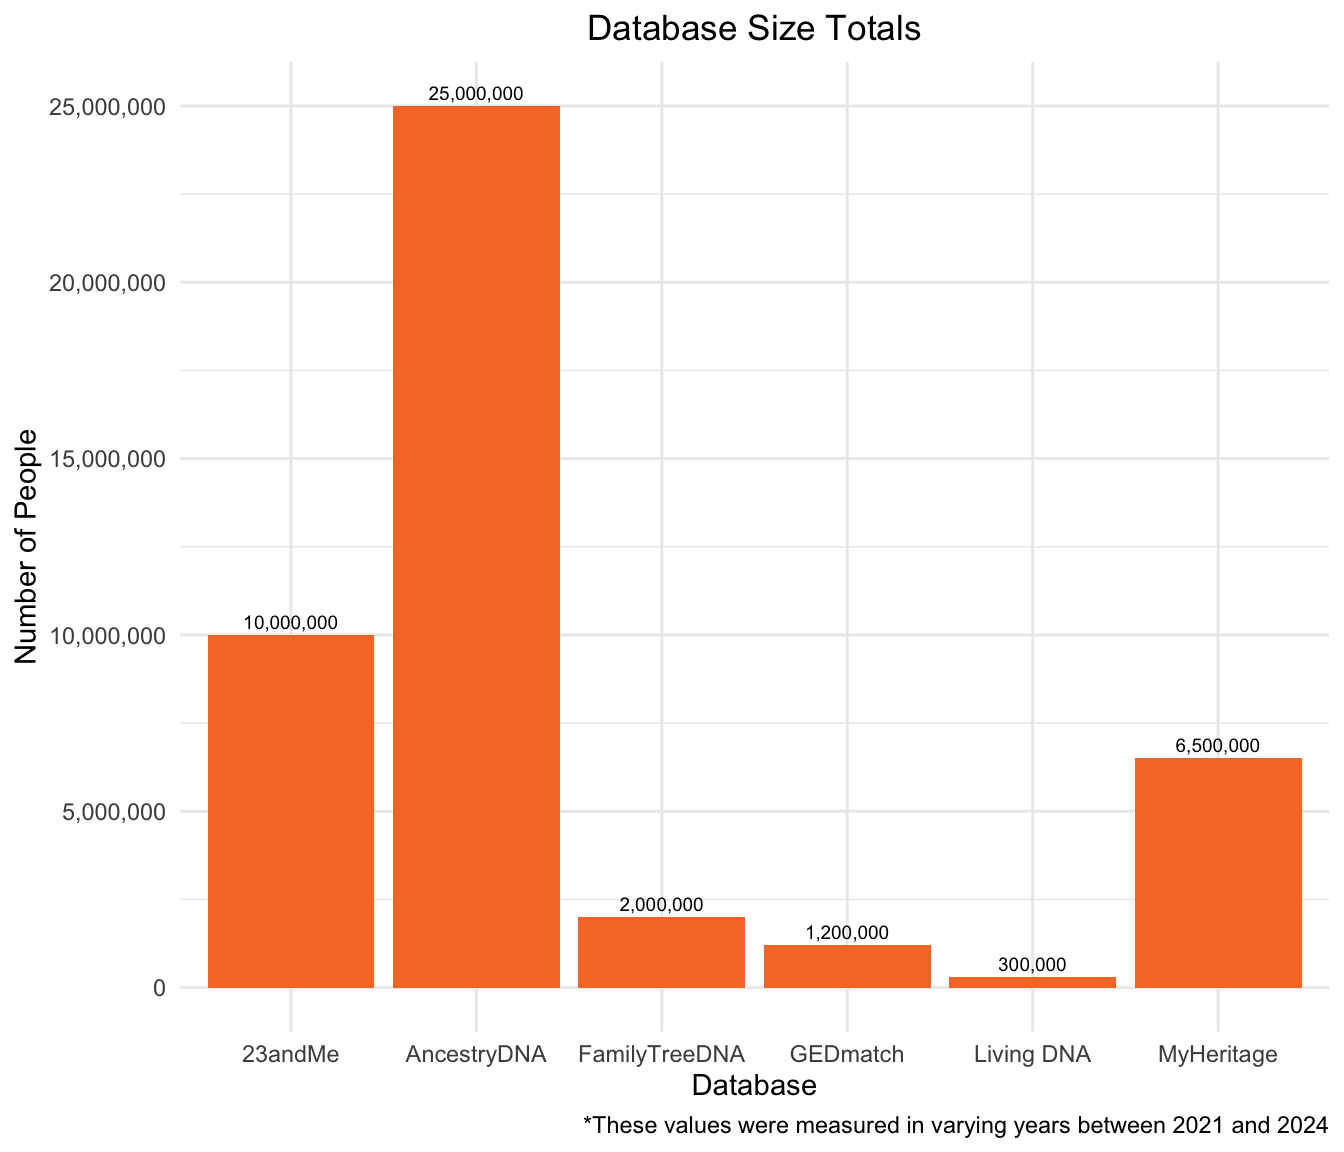
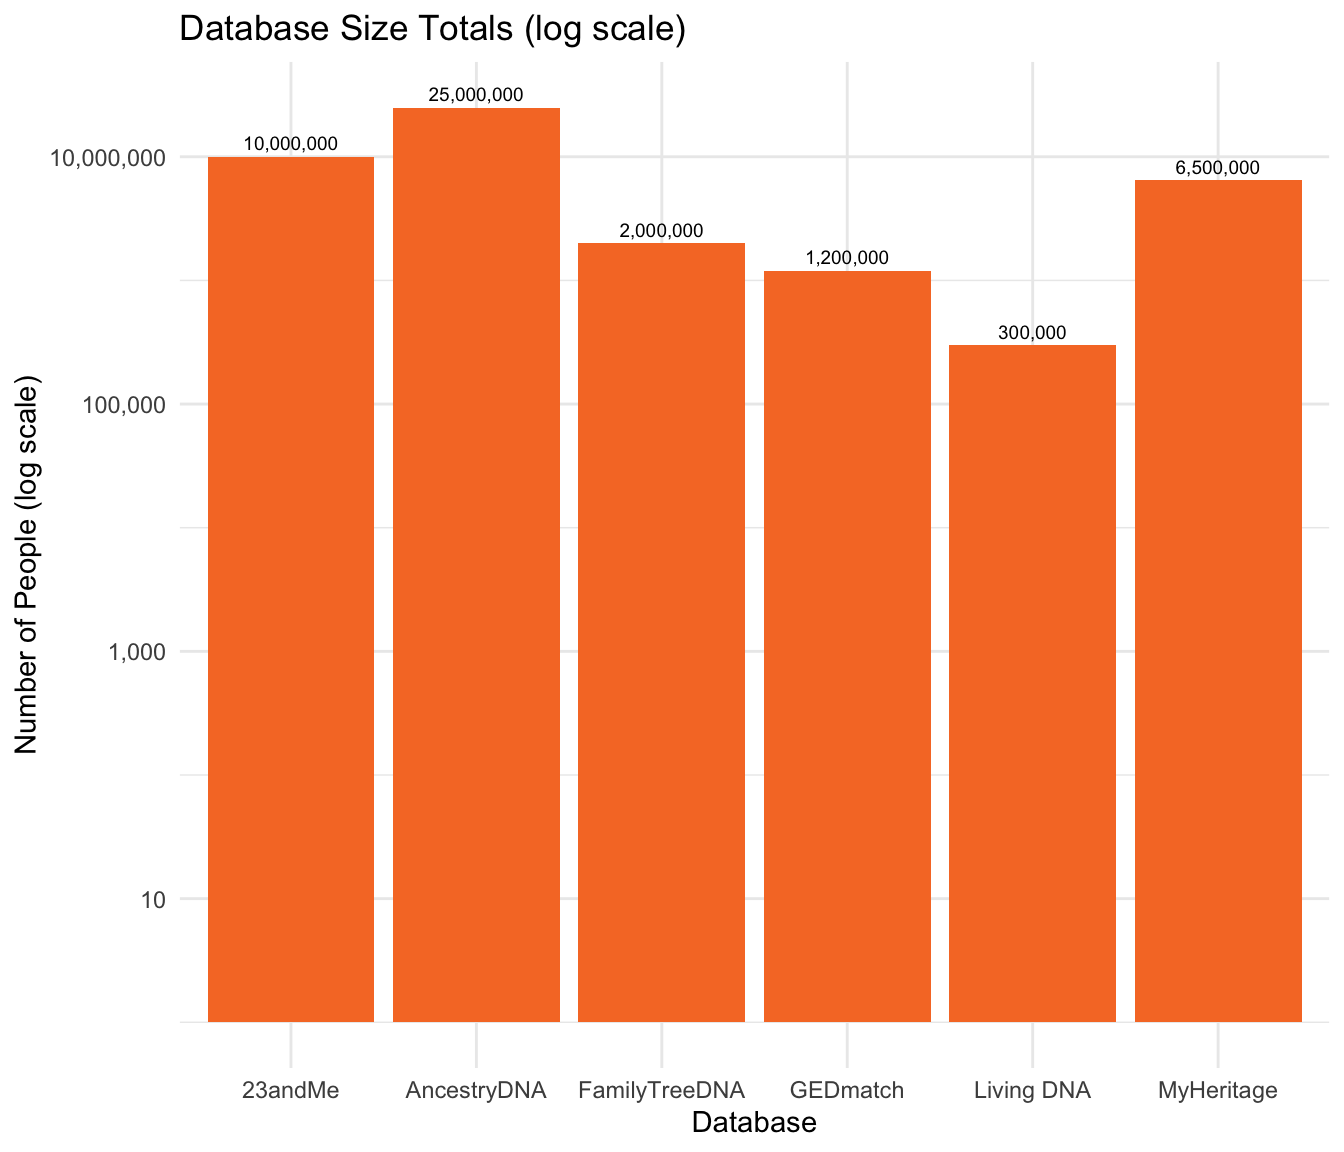
Direct-to-Consumer Database Total Size
The following graph demonstrates the total number of people in each Direct-to-Consumer Database. AncestryDNA has the largest DNA database at 25,000,000. The second-largest database is 23andMe, which has 10,000,000 DNA samples. Living DNA has the smallest database, with 300,000 DNA samples.
| Version | Author | Date |
|---|---|---|
| 70651c7 | Stella-Joy | 2024-09-04 |
Another option is to show this on a log scale:
| Version | Author | Date |
|---|---|---|
| 70651c7 | Stella-Joy | 2024-09-04 |
Racial Composition of Direct-to-Consumer Databases
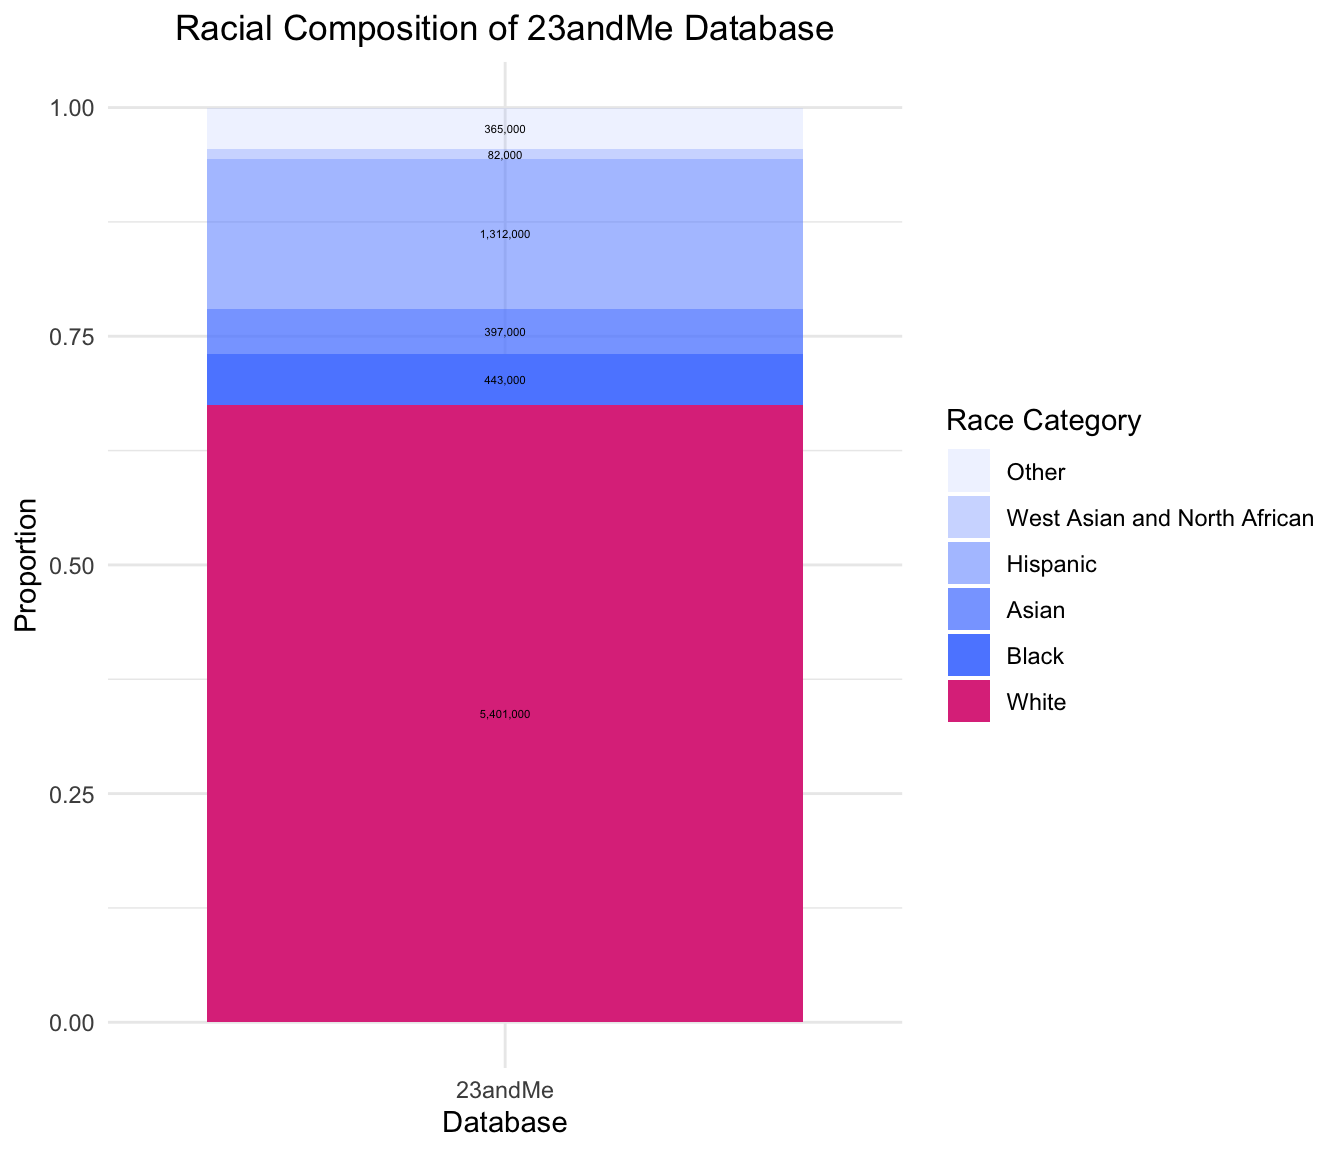
Most Direct-to-Consumer companies do not publish the racial or gender breakdown of their DNA samples. We have data from the 23andMe Research Innovation Collaborations and Replications Program, which is a portion of their database used for scientific research. The total number of DNA samples in this cohort is 8,000,000. The racial breakdown of this sample of the 23andMe database is shown below.
| Version | Author | Date |
|---|---|---|
| 70651c7 | Stella-Joy | 2024-09-04 |
From this data, we see that the majority of the 23andMe database is White (67.5%), then the order of biggest proportion to smallest proportion is Hispanic (16.4%), Black (5.5%), Asian (5%), Other (4.6%), and West Asian and North African (1%).
R version 4.4.1 (2024-06-14)
Platform: x86_64-apple-darwin20
Running under: macOS Sonoma 14.6.1

Matrix products: default
BLAS:   /Library/Frameworks/R.framework/Versions/4.4-x86_64/Resources/lib/libRblas.0.dylib
LAPACK: /Library/Frameworks/R.framework/Versions/4.4-x86_64/Resources/lib/libRlapack.dylib;  LAPACK version 3.12.0

locale:
[1] en_US.UTF-8/en_US.UTF-8/en_US.UTF-8/C/en_US.UTF-8/en_US.UTF-8

time zone: America/Detroit
tzcode source: internal

attached base packages:
[1] stats     graphics  grDevices utils     datasets  methods   base

other attached packages:
 [1] patchwork_1.2.0 lubridate_1.9.3 forcats_1.0.0   stringr_1.5.1
 [5] dplyr_1.1.4     purrr_1.0.2     readr_2.1.5     tidyr_1.3.1
 [9] tibble_3.2.1    ggplot2_3.5.1   tidyverse_2.0.0 workflowr_1.7.1

loaded via a namespace (and not attached):
 [1] sass_0.4.9        utf8_1.2.4        generics_0.1.3    stringi_1.8.4
 [5] hms_1.1.3         digest_0.6.36     magrittr_2.0.3    timechange_0.3.0
 [9] evaluate_0.24.0   grid_4.4.1        fastmap_1.2.0     rprojroot_2.0.4
[13] jsonlite_1.8.8    processx_3.8.4    whisker_0.4.1     ps_1.7.7
[17] promises_1.3.0    httr_1.4.7        fansi_1.0.6       scales_1.3.0
[21] jquerylib_0.1.4   cli_3.6.3         crayon_1.5.3      rlang_1.1.4
[25] bit64_4.0.5       munsell_0.5.1     withr_3.0.0       cachem_1.1.0
[29] yaml_2.3.9        parallel_4.4.1    tools_4.4.1       tzdb_0.4.0
[33] colorspace_2.1-0  httpuv_1.6.15     vctrs_0.6.5       R6_2.5.1
[37] lifecycle_1.0.4   git2r_0.33.0      bit_4.0.5         fs_1.6.4
[41] vroom_1.6.5       pkgconfig_2.0.3   callr_3.7.6       pillar_1.9.0
[45] bslib_0.7.0       later_1.3.2       gtable_0.3.5      glue_1.7.0
[49] Rcpp_1.0.12       highr_0.11        xfun_0.45         tidyselect_1.2.1
[53] rstudioapi_0.16.0 knitr_1.48        farver_2.1.2      htmltools_0.5.8.1
[57] labeling_0.4.3    rmarkdown_2.27    compiler_4.4.1    getPass_0.2-4