Skin Optics Analysis based on ISSA Data
Junhui He and Tina Lasisi
2025-12-18
Last updated: 2025-12-18
Checks: 5 2
Knit directory: SkinOptics/
This reproducible R Markdown analysis was created with workflowr (version 1.7.1). The Checks tab describes the reproducibility checks that were applied when the results were created. The Past versions tab lists the development history.
The R Markdown file has unstaged changes. To know which version of
the R Markdown file created these results, you’ll want to first commit
it to the Git repo. If you’re still working on the analysis, you can
ignore this warning. When you’re finished, you can run
wflow_publish to commit the R Markdown file and build the
HTML.
Great job! The global environment was empty. Objects defined in the global environment can affect the analysis in your R Markdown file in unknown ways. For reproduciblity it’s best to always run the code in an empty environment.
The command set.seed(20251211) was run prior to running
the code in the R Markdown file. Setting a seed ensures that any results
that rely on randomness, e.g. subsampling or permutations, are
reproducible.
Great job! Recording the operating system, R version, and package versions is critical for reproducibility.
- derivatives-face
- derivatives-palm
To ensure reproducibility of the results, delete the cache directory
JID_SkinOptics_cache and re-run the analysis. To have
workflowr automatically delete the cache directory prior to building the
file, set delete_cache = TRUE when running
wflow_build() or wflow_publish().
Great job! Using relative paths to the files within your workflowr project makes it easier to run your code on other machines.
Great! You are using Git for version control. Tracking code development and connecting the code version to the results is critical for reproducibility.
The results in this page were generated with repository version 243e344. See the Past versions tab to see a history of the changes made to the R Markdown and HTML files.
Note that you need to be careful to ensure that all relevant files for
the analysis have been committed to Git prior to generating the results
(you can use wflow_publish or
wflow_git_commit). workflowr only checks the R Markdown
file, but you know if there are other scripts or data files that it
depends on. Below is the status of the Git repository when the results
were generated:
Ignored files:
    Ignored:    .DS_Store
    Ignored:    analysis/skin-map_cache/
    Ignored:    data/worldclim/

Untracked files:
    Untracked:  analysis/figure/JID_SkinOptics.Rmd/faceei-facemi-correlation-1.png
    Untracked:  analysis/figure/JID_SkinOptics.Rmd/faceei-facemi-log-1.png
    Untracked:  analysis/figure/JID_SkinOptics.Rmd/palmei-facemi-log-1.png
    Untracked:  analysis/figure/JID_SkinOptics.Rmd/reflectance-delta-vs-mi-1.png
    Untracked:  analysis/figure/JID_SkinOptics.Rmd/reflectance-delta-vs-mi-log-1.png
    Untracked:  output/face_ei_face_mi_correlation.pdf
    Untracked:  output/face_ei_face_mi_log.pdf
    Untracked:  output/palm_ei_face_mi_log.pdf
    Untracked:  output/reflectance_delta_vs_mi.pdf
    Untracked:  output/reflectance_delta_vs_mi_log.pdf

Unstaged changes:
    Modified:   analysis/JID_SkinOptics.Rmd
    Modified:   analysis/figure/JID_SkinOptics.Rmd/palmei-facemi-correlation-1.png
    Modified:   output/absorbance_derivative_face.pdf
    Modified:   output/absorbance_derivative_palm.pdf
    Modified:   output/absorbance_derivative_palm_face.pdf
    Modified:   output/absorbance_mi_sd.pdf
    Modified:   output/absorbance_mi_sd_log.pdf
    Modified:   output/composite_reflectance_derivatives.pdf
    Modified:   output/ei_mi_correlation.pdf
    Modified:   output/ei_sd_mi_correlation.pdf
    Modified:   output/heatmap.pdf
    Modified:   output/mi_distribution.pdf
    Modified:   output/palm_ei_face_mi_correlation.pdf
    Modified:   output/palm_ei_face_mi_sd_correlation.pdf
    Modified:   output/peak_valley_delta_vs_mi.pdf
    Modified:   output/peak_valley_delta_vs_mi_log.pdf
    Modified:   output/peak_valley_value_distribution.pdf
    Modified:   output/peak_valley_value_vs_mi.pdf
    Modified:   output/peak_valley_value_vs_mi_log.pdf
    Modified:   output/peak_valley_wavelength_distribution.pdf
    Modified:   output/peak_valley_wavelength_vs_mi.pdf
    Modified:   output/peak_valley_wavelength_vs_mi_log.pdf
    Modified:   output/reflectance_derivative_face.pdf
    Modified:   output/reflectance_derivative_palm.pdf
    Modified:   output/reflectance_derivative_palm_face.pdf
    Modified:   output/reflectance_face.pdf
    Modified:   output/reflectance_mi_sd.pdf
    Modified:   output/reflectance_mi_sd_log.pdf
    Modified:   output/reflectance_mi_sd_regression.pdf
    Modified:   output/reflectance_palm.pdf
    Modified:   output/reflectance_palm_face.pdf
Note that any generated files, e.g. HTML, png, CSS, etc., are not included in this status report because it is ok for generated content to have uncommitted changes.
These are the previous versions of the repository in which changes were
made to the R Markdown (analysis/JID_SkinOptics.Rmd) and
HTML (docs/JID_SkinOptics.html) files. If you’ve configured
a remote Git repository (see ?wflow_git_remote), click on
the hyperlinks in the table below to view the files as they were in that
past version.
| File | Version | Author | Date | Message |
|---|---|---|---|---|
| Rmd | 243e344 | tinalasisi | 2025-12-18 | Fixed the regressions |
| html | 243e344 | tinalasisi | 2025-12-18 | Fixed the regressions |
| Rmd | c4b2199 | tinalasisi | 2025-12-18 | Added statistical tests to log-relationships |
| html | c4b2199 | tinalasisi | 2025-12-18 | Added statistical tests to log-relationships |
| Rmd | 40b4375 | tinalasisi | 2025-12-18 | updates to tests |
| html | 40b4375 | tinalasisi | 2025-12-18 | updates to tests |
| Rmd | 90b5102 | tinalasisi | 2025-12-18 | Revise Skin Optics analysis: improved deduplication, plotting, and reproducibility |
| html | 90b5102 | tinalasisi | 2025-12-18 | Revise Skin Optics analysis: improved deduplication, plotting, and reproducibility |
| html | 9956d2d | Junhui He | 2025-12-17 | Build site. |
| Rmd | a6f7dc4 | Junhui He | 2025-12-17 | update JID_SkinOptics.Rmd |
| html | 32c3e8f | Junhui He | 2025-12-11 | Rebuild site to apply navbar layout |
| html | b2cbe44 | Junhui He | 2025-12-11 | Build site. |
| Rmd | df71367 | Junhui He | 2025-12-11 | modify face site |
| html | d98f12d | Junhui He | 2025-12-11 | Build site. |
| Rmd | 2fc3d03 | Junhui He | 2025-12-11 | add correlation analysis |
| html | 81580b5 | Junhui He | 2025-12-11 | build workflowr |
| Rmd | e11deee | Junhui He | 2025-12-11 | calculate EI |
| html | e11deee | Junhui He | 2025-12-11 | calculate EI |
| Rmd | 53d4f9c | Junhui He | 2025-12-11 | create SkinOptics |
| html | 53d4f9c | Junhui He | 2025-12-11 | create SkinOptics |
Clarifications
Melanin index (MI) is calculated from skin reflectance at 680 nm, where \(R_{680}\) is the measured reflectance percentage (0-100):
- \[MI = -100 \times \log_{10}(R_{680} / 100)\]
- This is equivalent to the standard formula \(MI = 100 \times \log_{10}(1/R)\), where \(R\) is reflectance as a decimal (0-1)
- Internally, this is computed by first calculating absorbance (\(A_{680} = -\log_{10}(R_{680} / 100)\)), then multiplying by 100
Erythema index (EI) is calculated as: \[EI = 100 \times \log_{10}\left(\frac{R_{680}}{(R_{550} + R_{560})/2}\right)\] where \(R_{550}\), \(R_{560}\), and \(R_{680}\) are the reflectance percentages at 550 nm, 560 nm, and 680 nm, respectively.
EI variability is measured by the standard deviation of EIs within a sliding window of MI values. The window size is set to 20 MI units, and the step size is 1 MI unit.
- For each center MI value in the sequence, all EI values corresponding to MI values within the window (center MI \(\pm\) 10) are collected, and their standard deviation is computed.
- The center MI values range from the 1st to the 99th percentile of observed MI values.
FACE site refers to Forehead or Cheek, while PALM site refers to the palm of the hand.
Representative FACE MI:
- For each subject, the FACE MI is given by the Forehead MI if the Forehead MI is available; otherwise, it is the Cheek MI.
- For subjects with multiple measurements at the same FACE site, we randomly select one measurement.
- Each subject has only one representative FACE reflectance spectra.
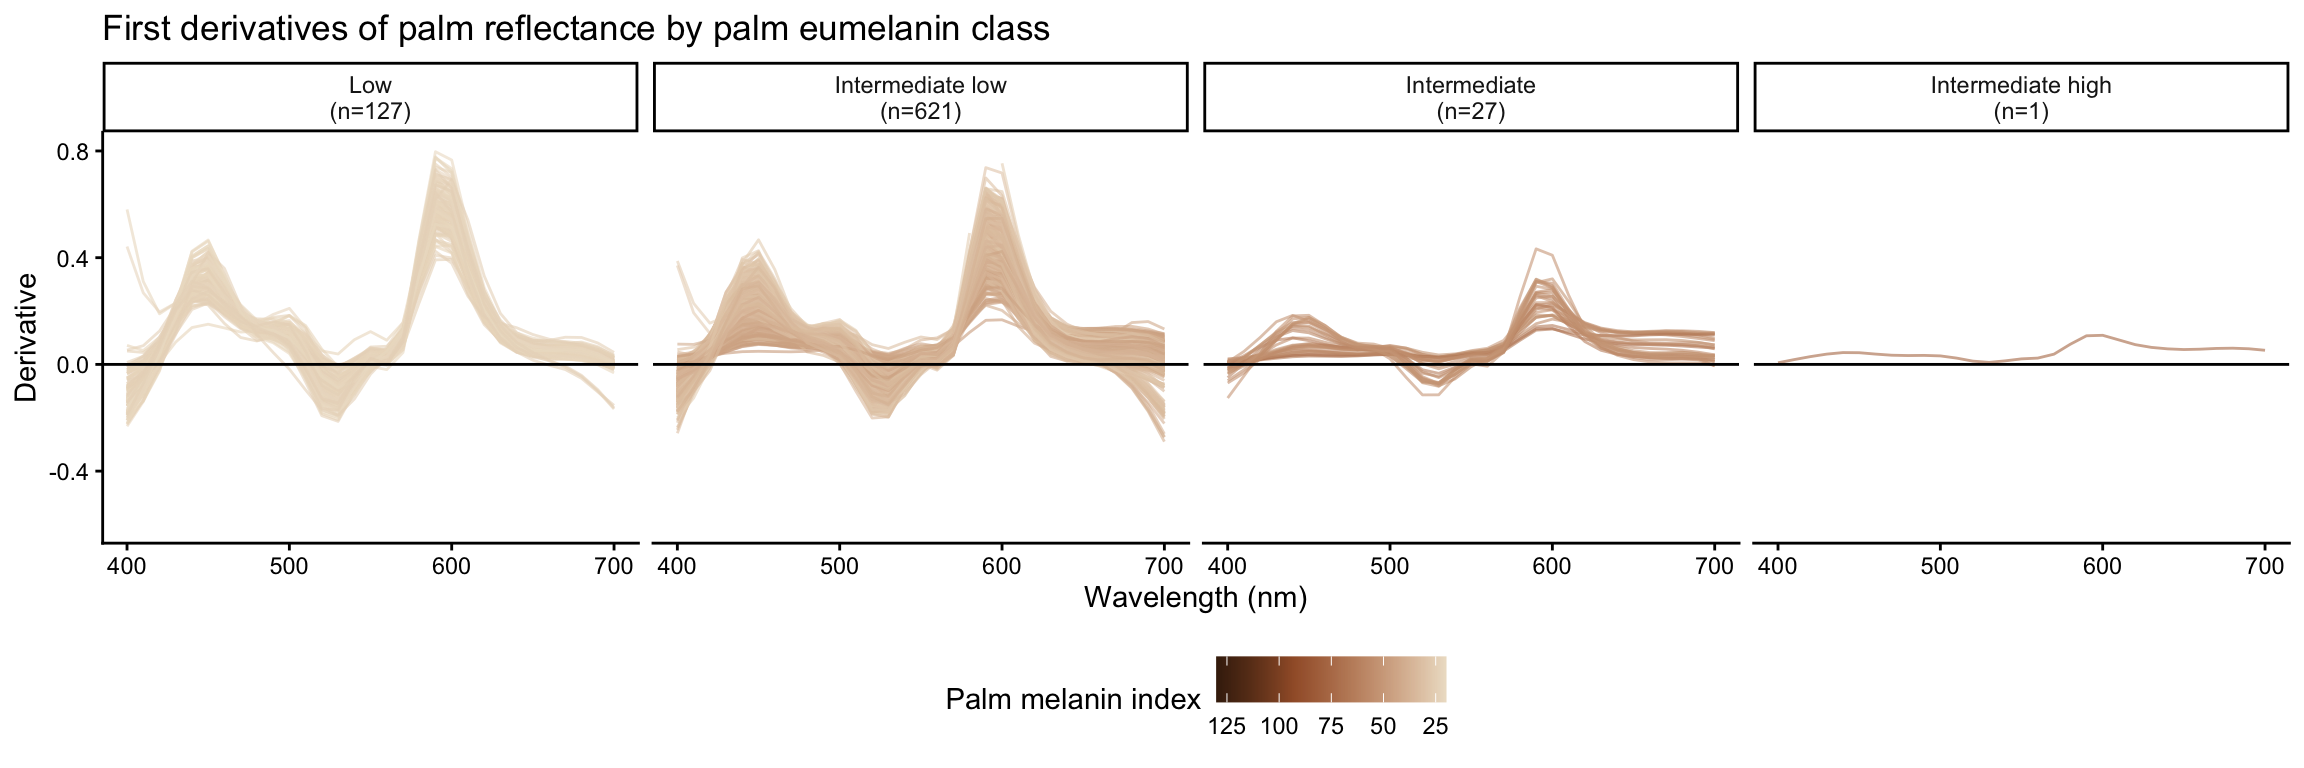
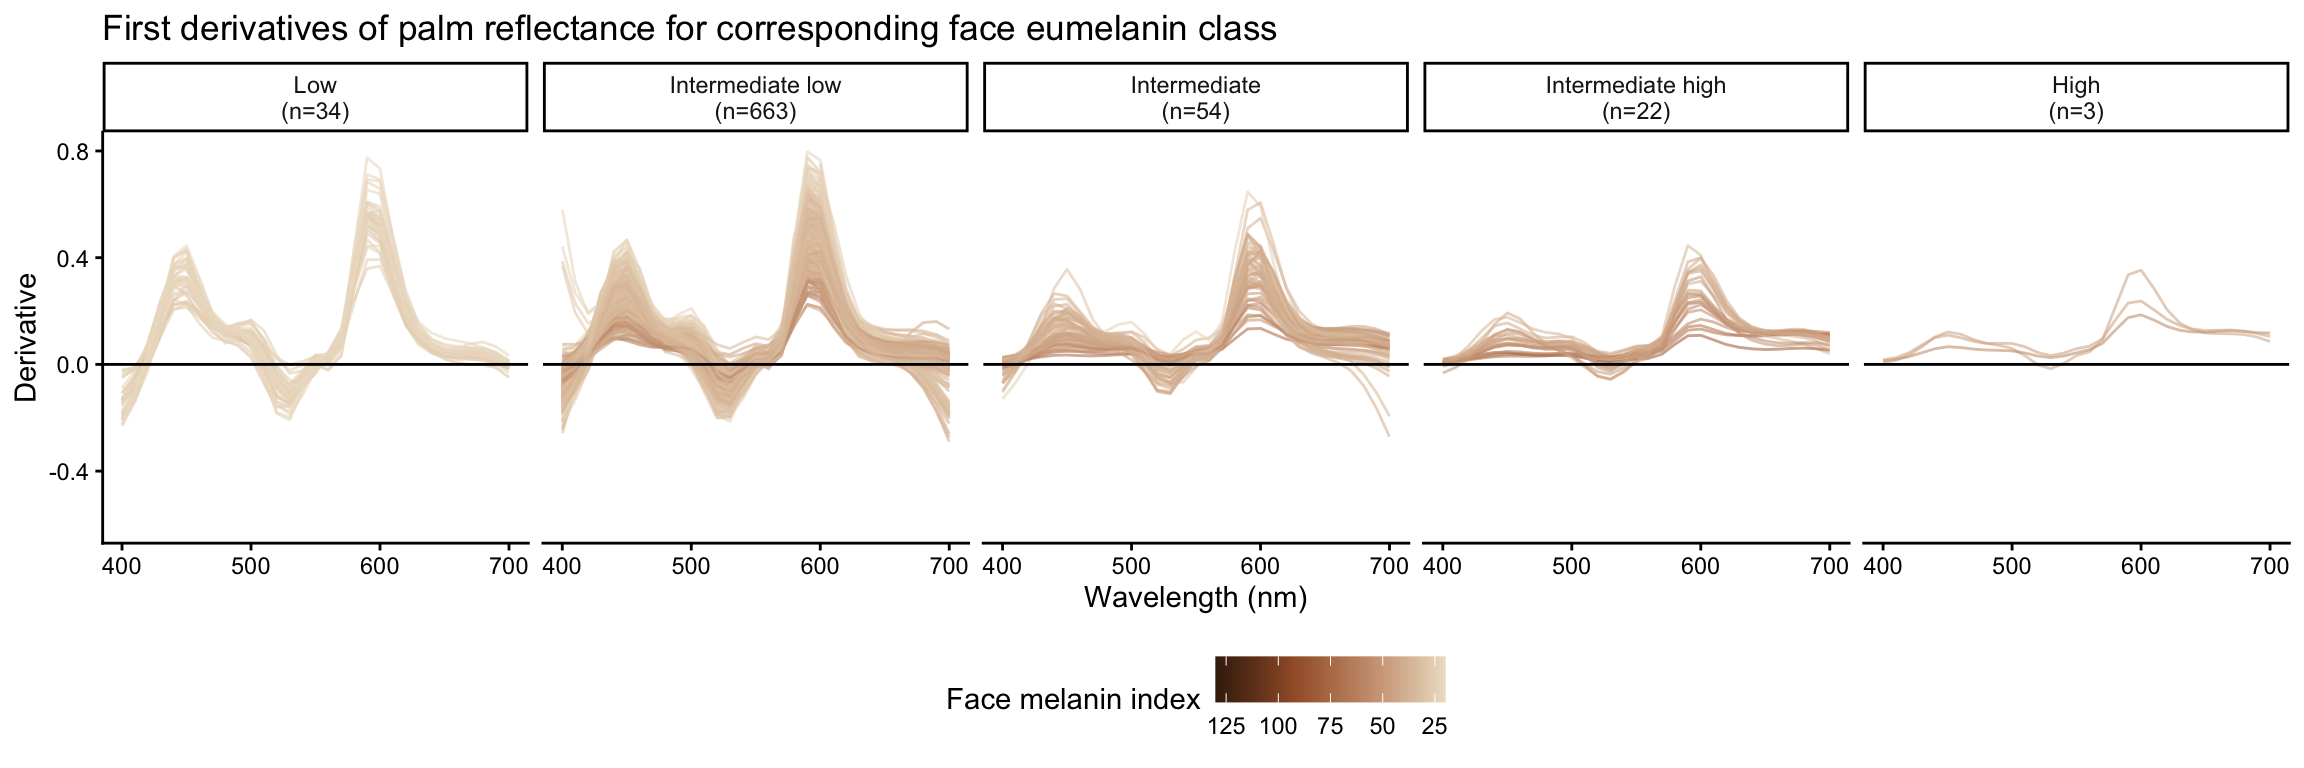
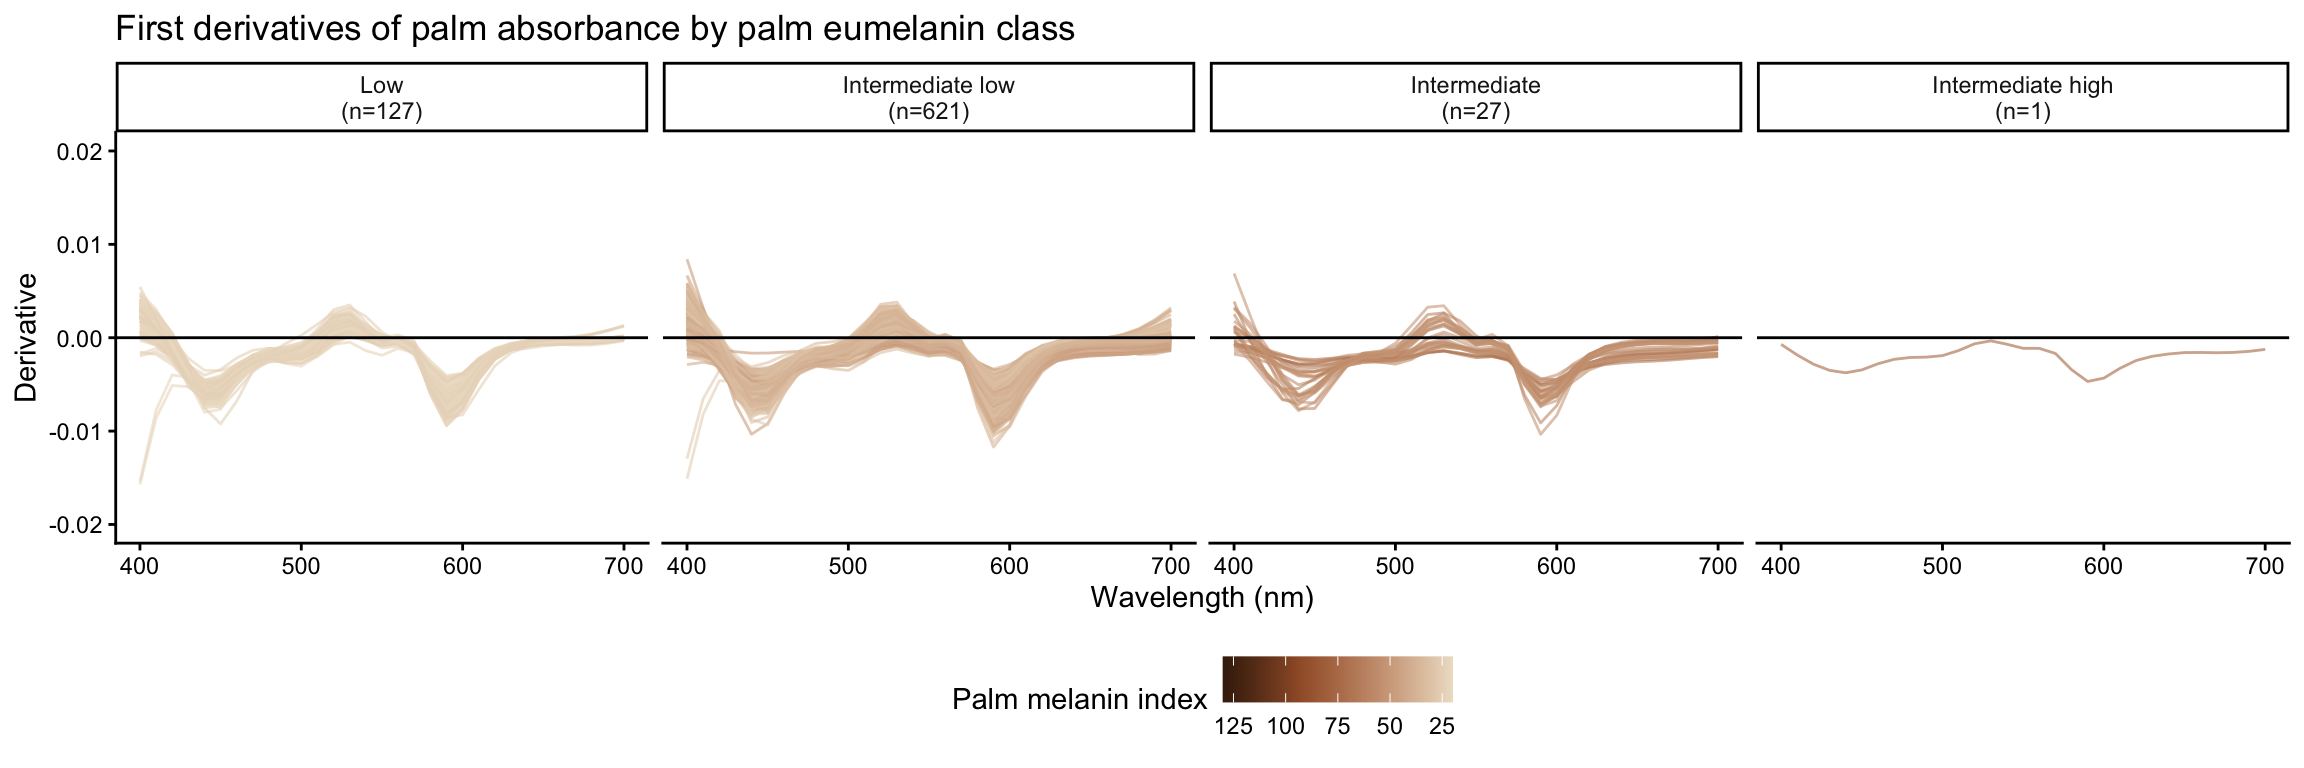
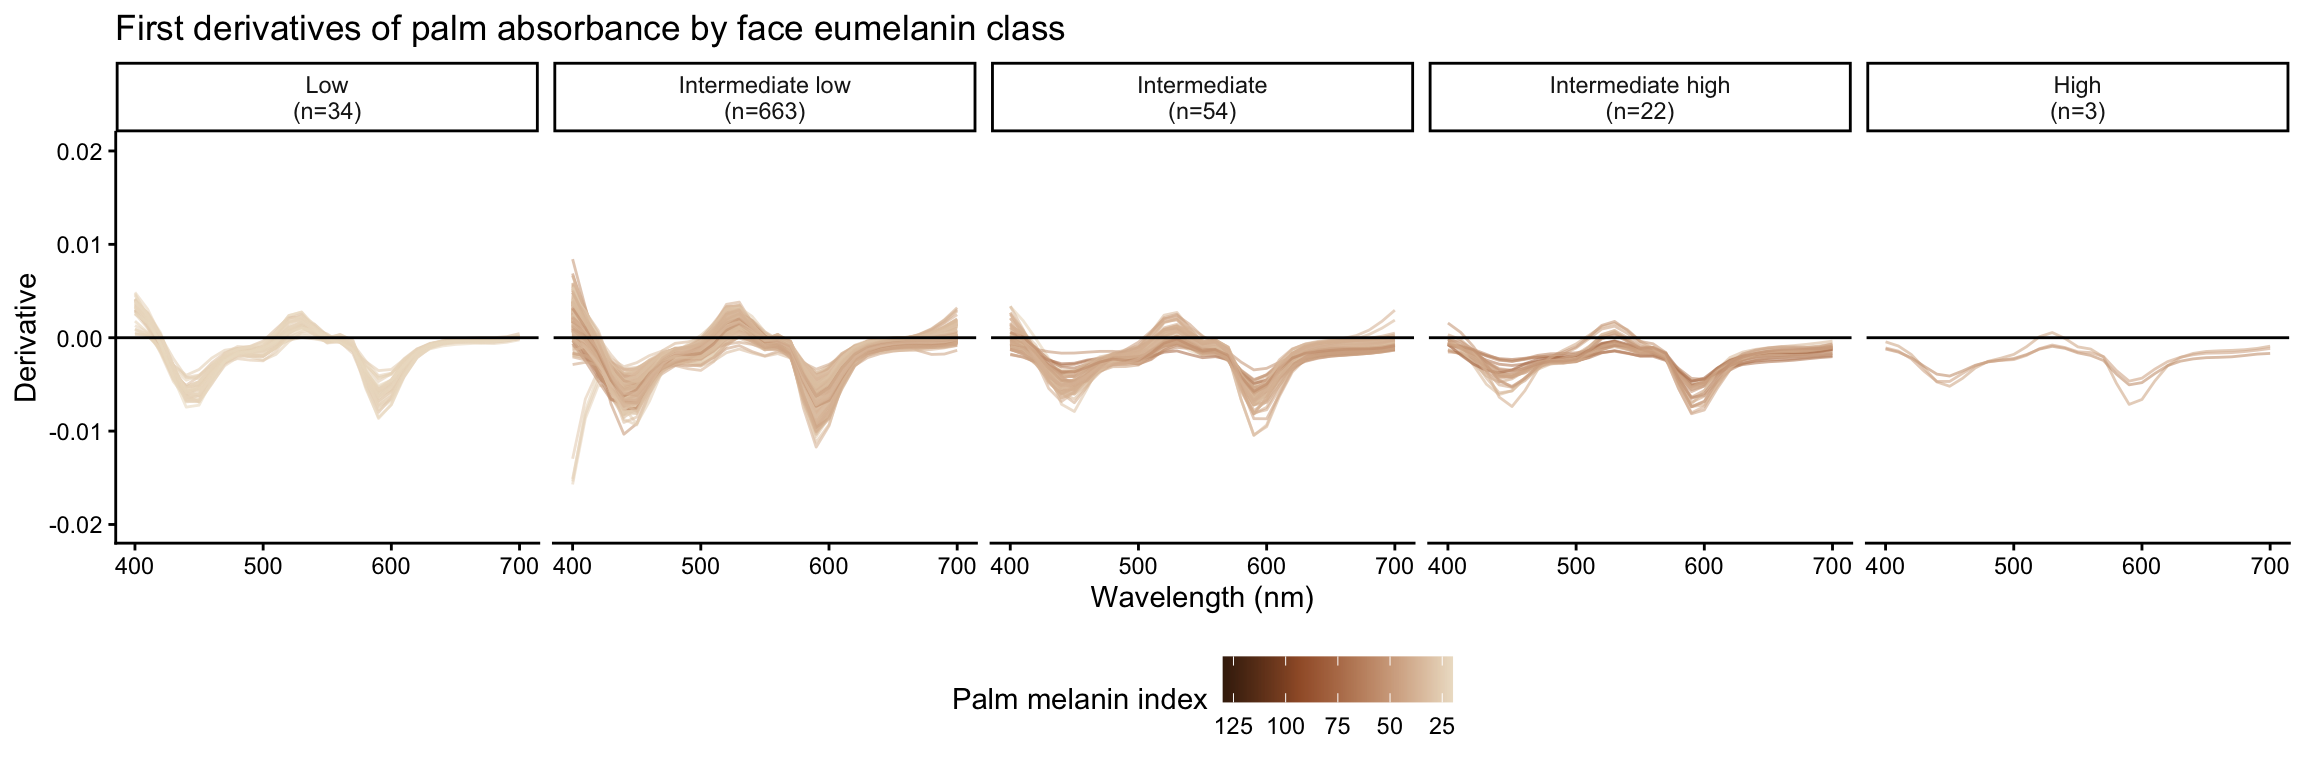
First derivatives of skin spectra are estimated using local polynomial regression with bandwidth selected by the dpill function, scaled by a factor of 0.7.
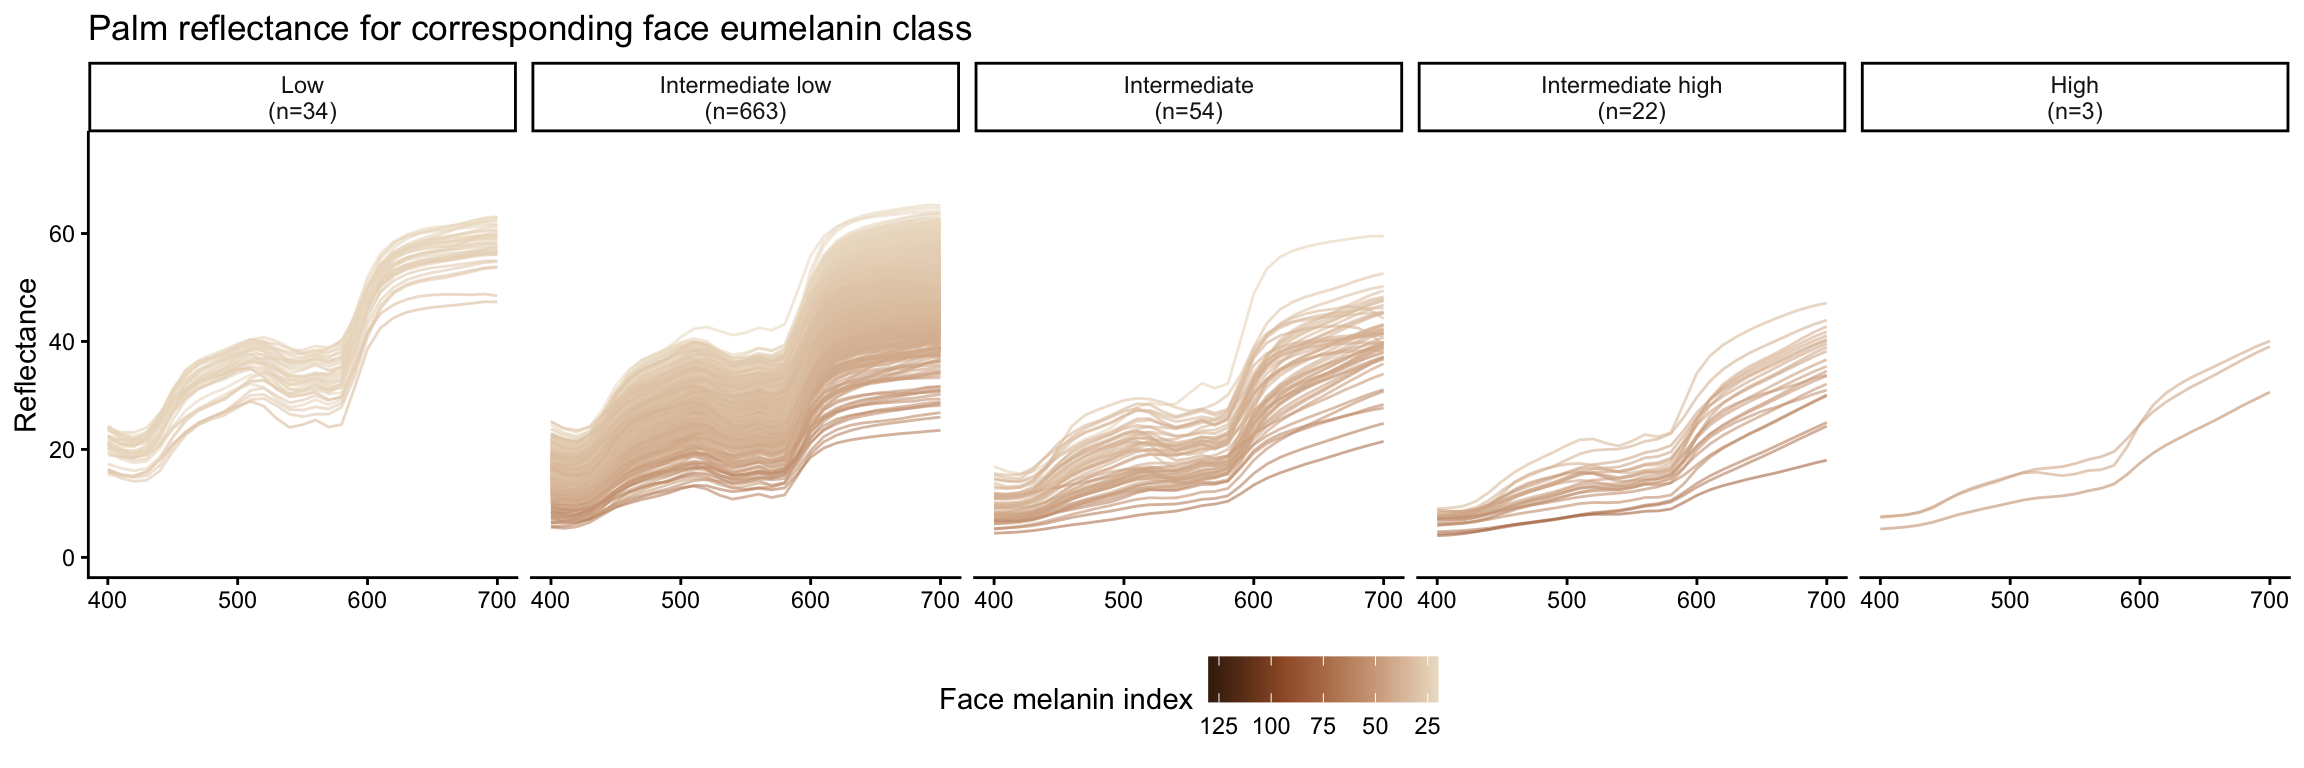
Eumelanin class are defined based on melanin index ranges as follows:
- Low: \(MI < 25\)
- Intermediate low: \(25 \leq MI < 50\)
- Intermediate: \(50 \leq MI < 75\)
- Intermediate high: \(75 \leq MI < 100\)
- High: \(MI \geq 100\)
The pdf files generated in this analysis are saved in the “output” directory.
Visualizations
Face readings before deduplication: 4603 Unique individuals with face readings: 2102 Face readings after deduplication: 2102 Palm readings before deduplication: 776 Unique individuals with palm readings: 776 Palm readings after deduplication: 776 Distribution of melanin index by site
Final data summary:Face: n = 2101 | Unique individuals: 2101 Palm: n = 776 | Unique individuals: 776 Combined: n = 2877 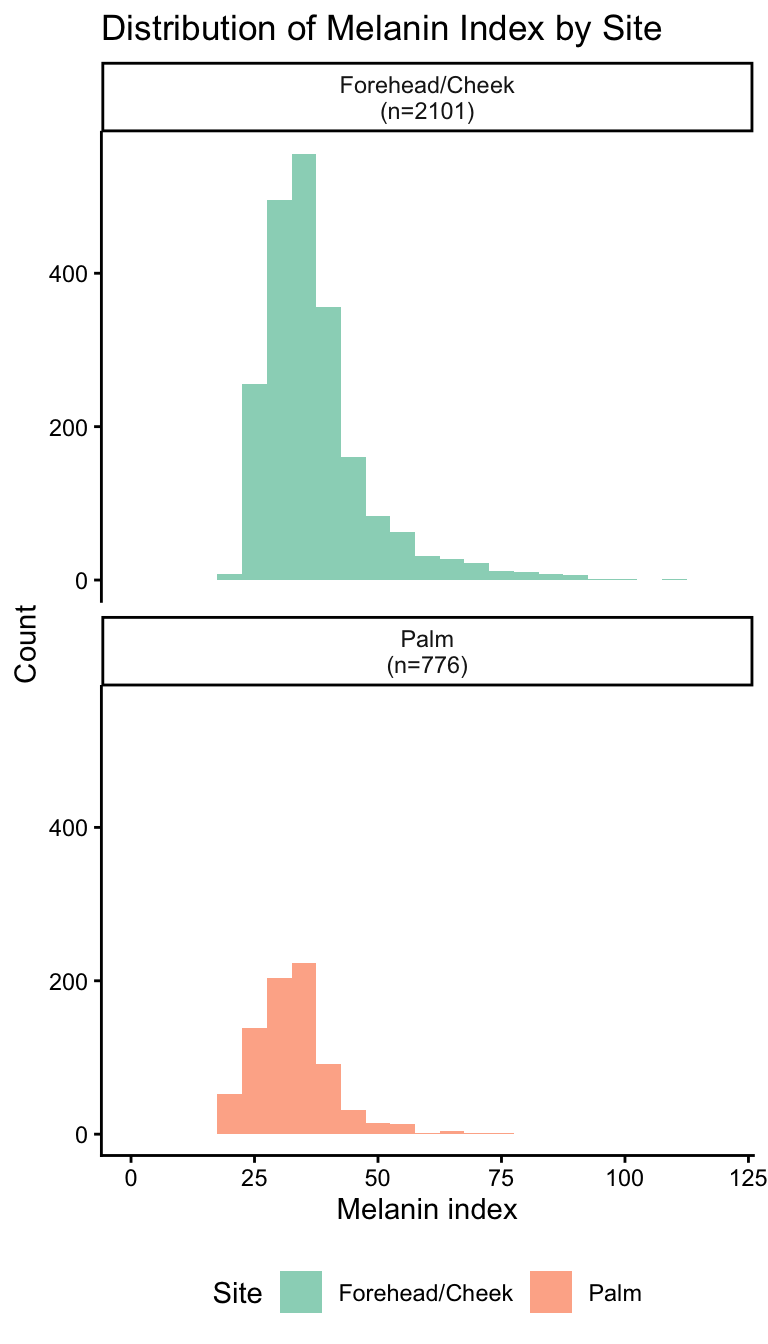
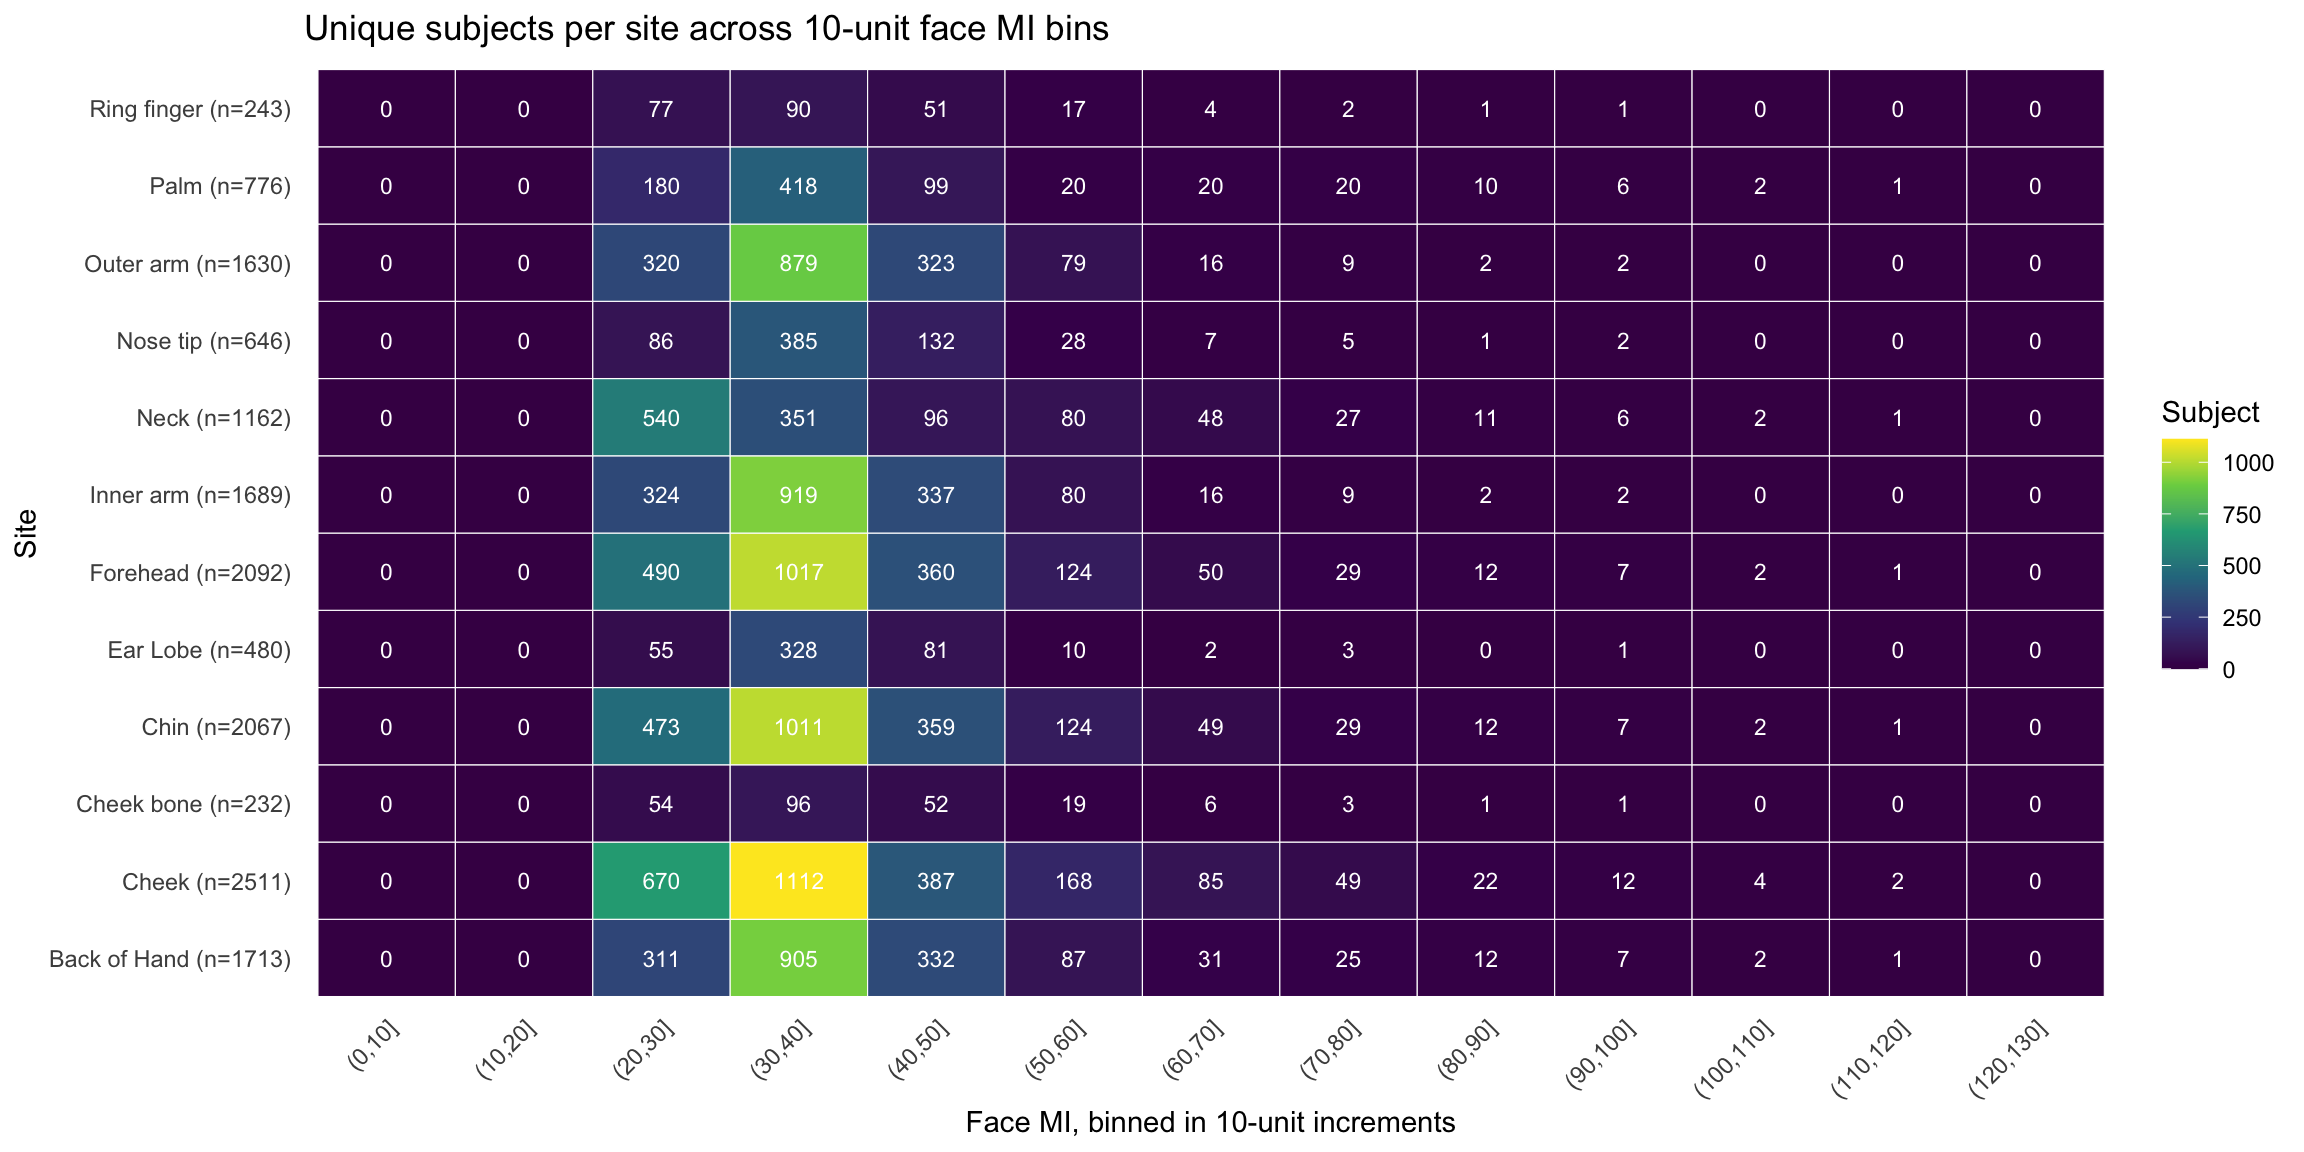
Unique subjects per site across representative face melanin index bins (Heatmap)
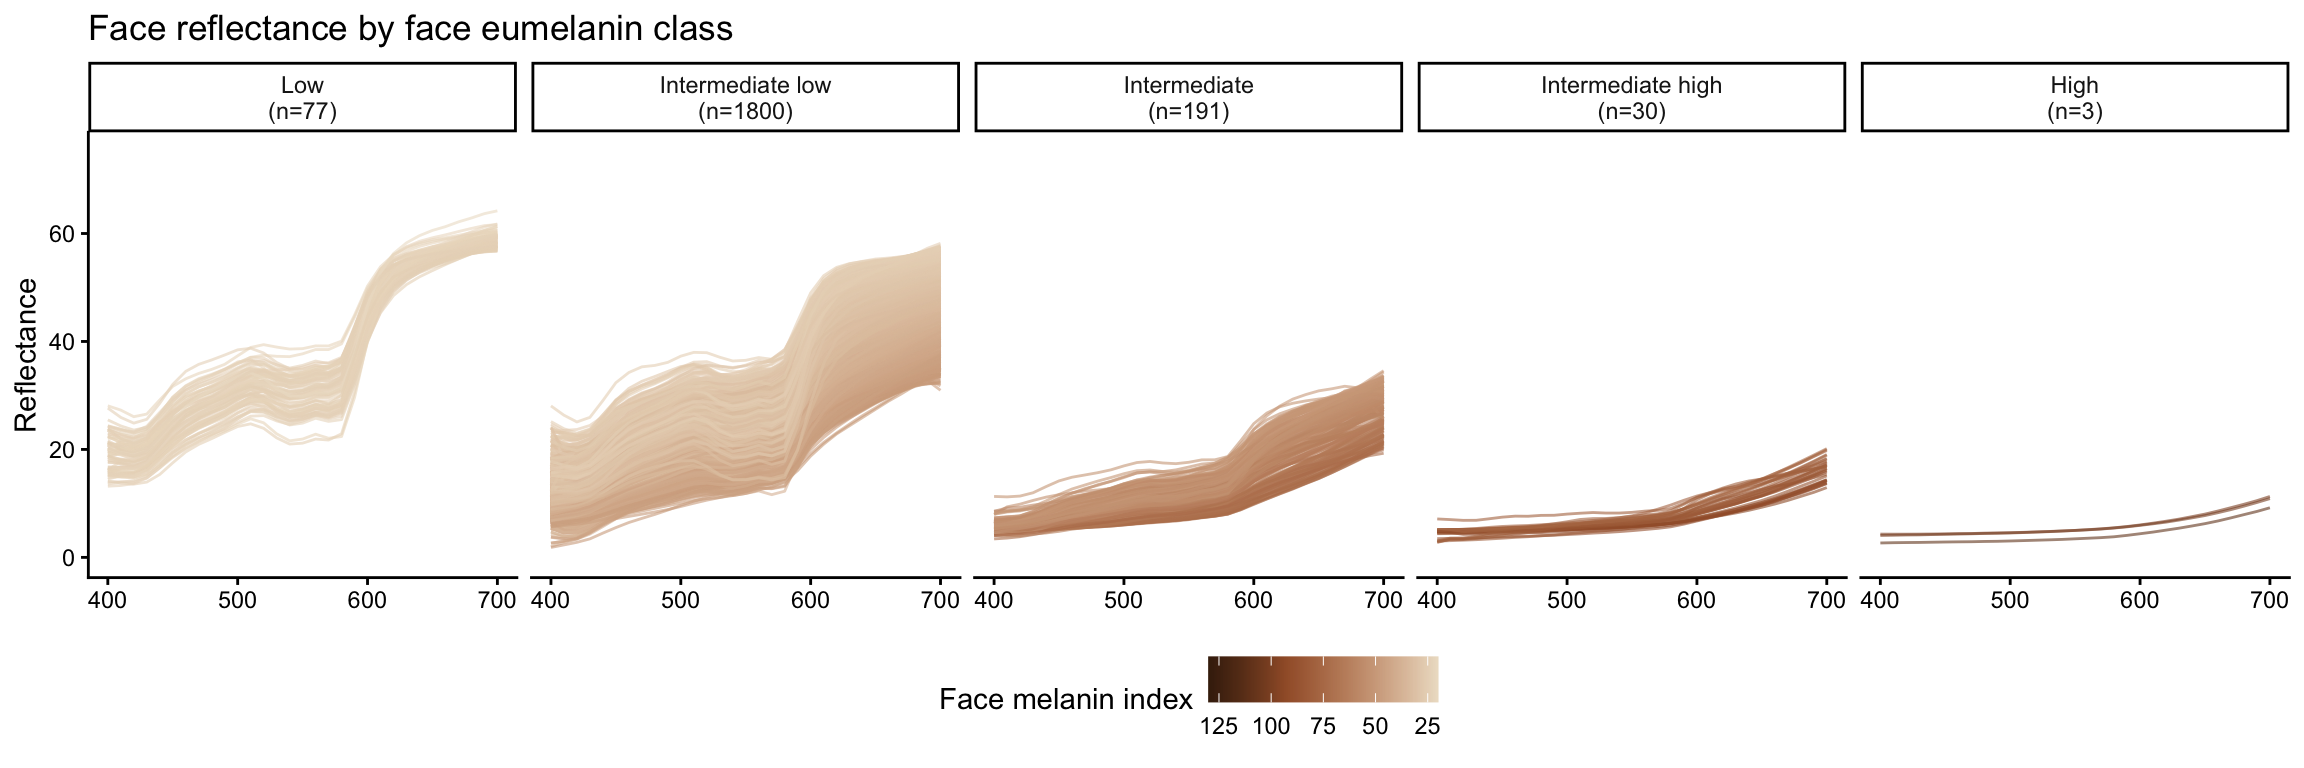
| Eumelanin class | Number of subjects |
|---|---|
| Low | 77 |
| Intermediate low | 1800 |
| Intermediate | 191 |
| Intermediate high | 30 |
| High | 3 |
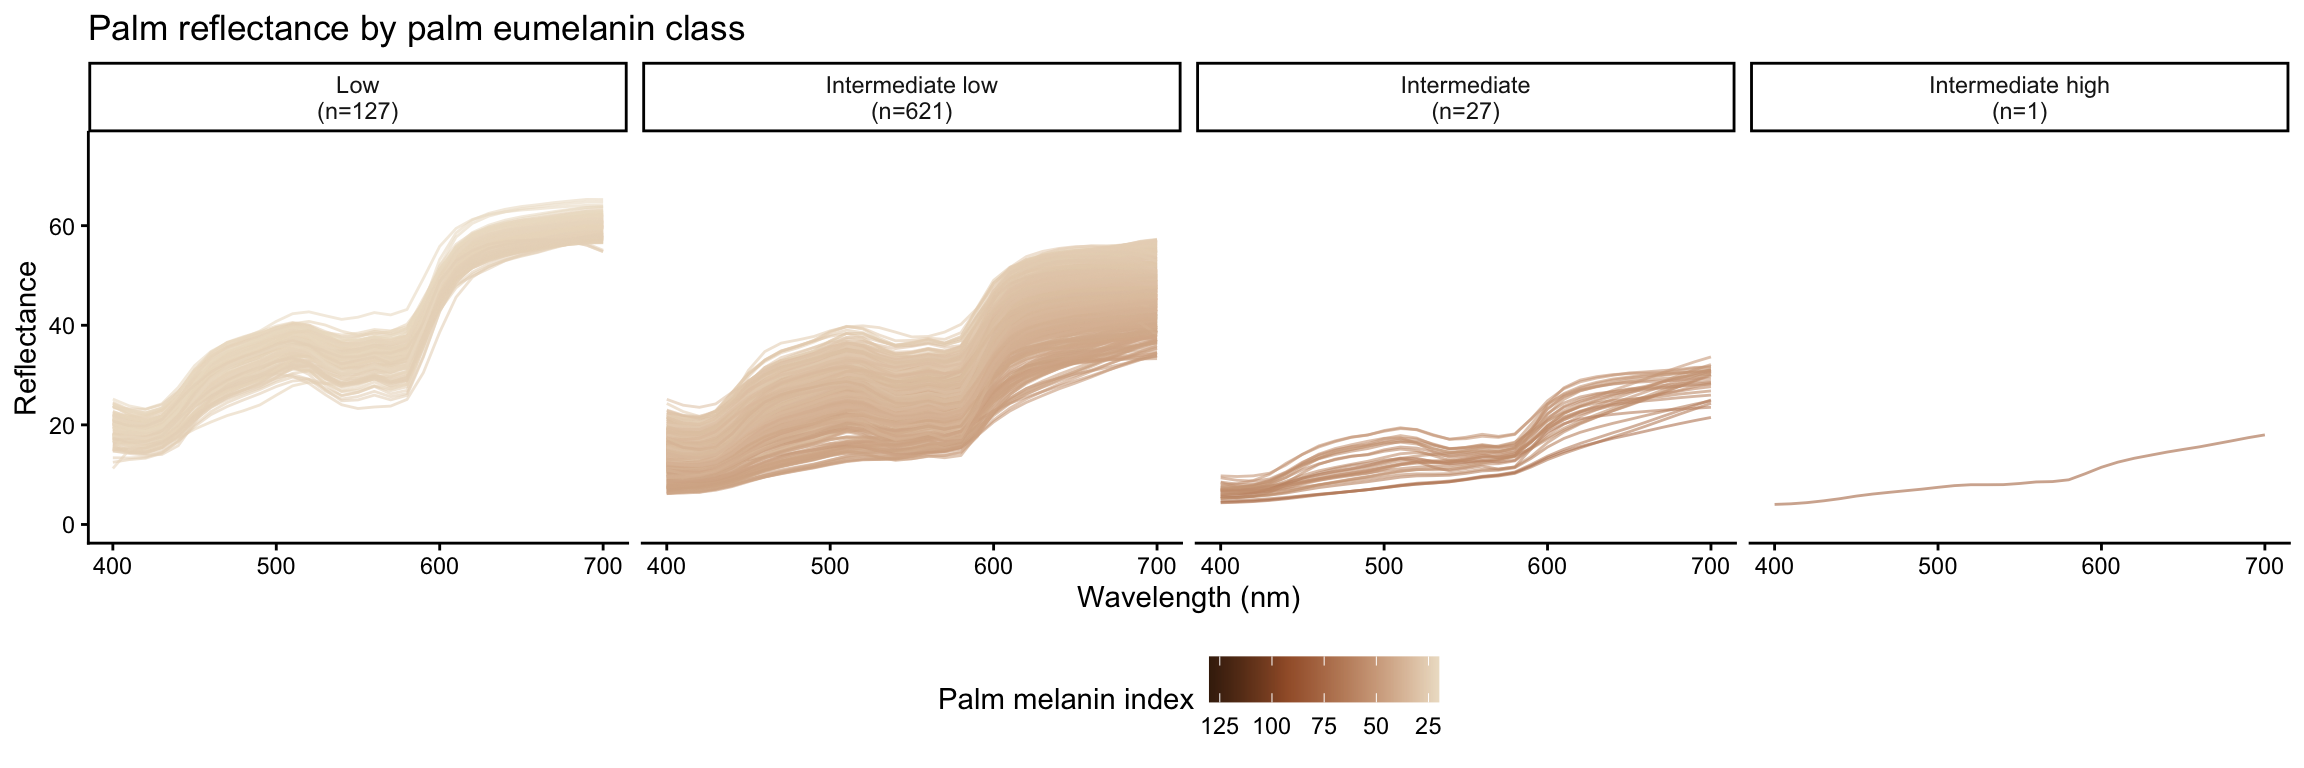
| Eumelanin class | Number of subjects |
|---|---|
| Low | 127 |
| Intermediate low | 621 |
| Intermediate | 27 |
| Intermediate high | 1 |
Reflectance by eumelanin class
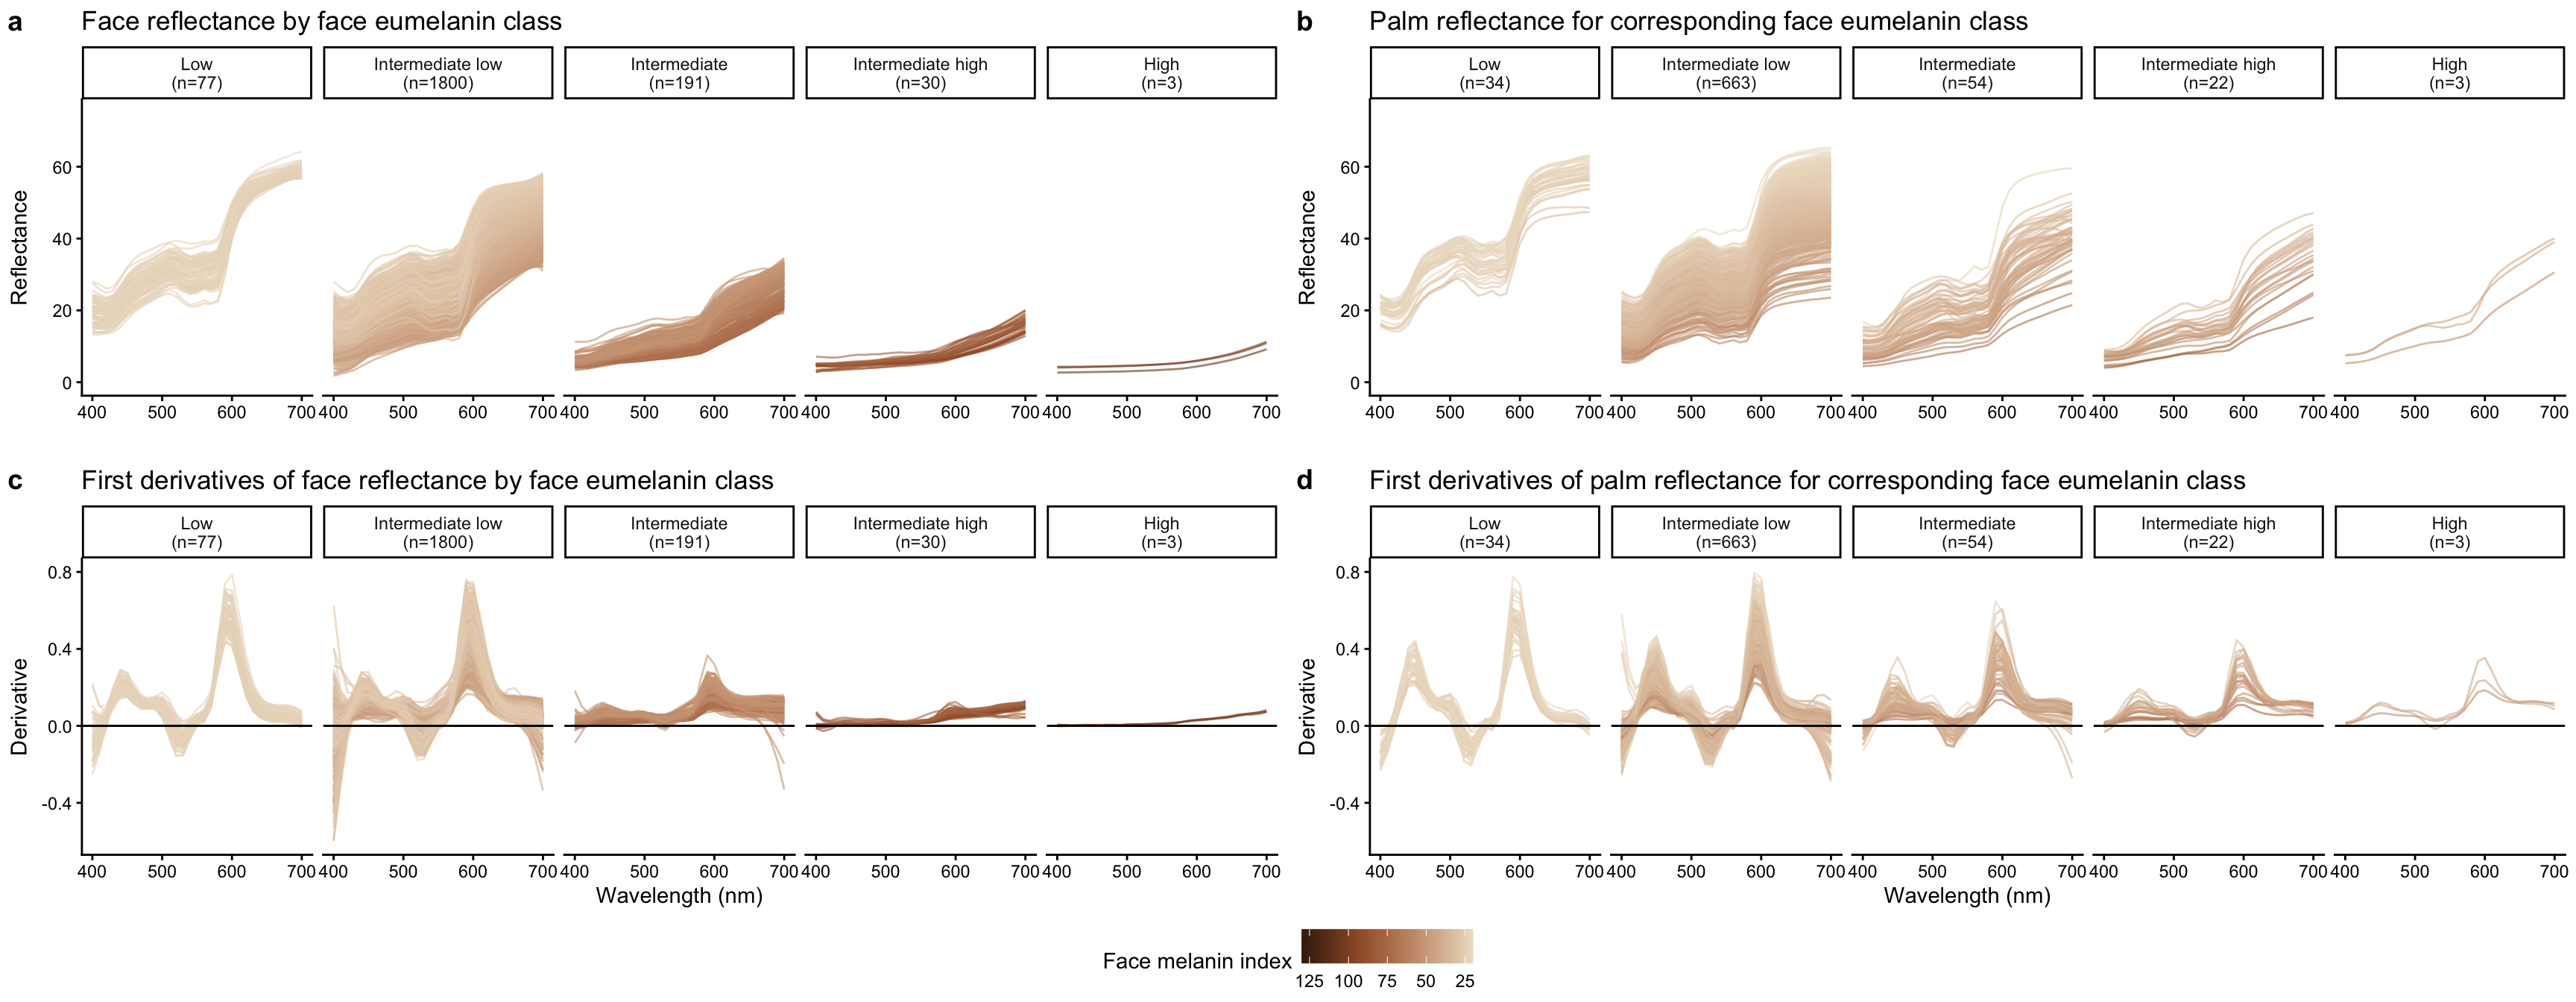
face reflectance by face eumelanin class
palm reflectance by palm eumelanin class
First derivatives of reflectance by eumelanin class
face reflectance derivatives by face eumelanin class

palm reflectance derivatives by palm eumelanin class
Composite figure: face reflectance and derivatives by eumelanin class
First derivatives of absorbance by eumelanin class
face absorbance derivatives by face eumelanin class

palm absorbance derivatives by palm eumelanin class
Correlation between reflectance derivative sd and melanin index

- Regression analysis
Call:
lm(formula = sd_ref ~ log_mi + I(log_mi^2), data = sd_face)

Residuals:
      Min        1Q    Median        3Q       Max
-0.069033 -0.014140 -0.001695  0.011080  0.100513

Coefficients:
             Estimate Std. Error t value Pr(>|t|)
(Intercept)  1.558619   0.066400   23.47   <2e-16 ***
log_mi      -0.681307   0.035862  -19.00   <2e-16 ***
I(log_mi^2)  0.076171   0.004826   15.78   <2e-16 ***
---
Signif. codes:  0 '***' 0.001 '**' 0.01 '*' 0.05 '.' 0.1 ' ' 1

Residual standard error: 0.02264 on 2098 degrees of freedom
Multiple R-squared:  0.6497,    Adjusted R-squared:  0.6494
F-statistic:  1946 on 2 and 2098 DF,  p-value: < 2.2e-16
Call:
lm(formula = sd_ref ~ log_mi, data = sd_palm)

Residuals:
      Min        1Q    Median        3Q       Max
-0.066053 -0.016370  0.000337  0.015371  0.071971

Coefficients:
             Estimate Std. Error t value Pr(>|t|)
(Intercept)  0.560165   0.013160   42.56   <2e-16 ***
log_mi      -0.120567   0.003789  -31.82   <2e-16 ***
---
Signif. codes:  0 '***' 0.001 '**' 0.01 '*' 0.05 '.' 0.1 ' ' 1

Residual standard error: 0.0238 on 774 degrees of freedom
Multiple R-squared:  0.5668,    Adjusted R-squared:  0.5662
F-statistic:  1013 on 1 and 774 DF,  p-value: < 2.2e-16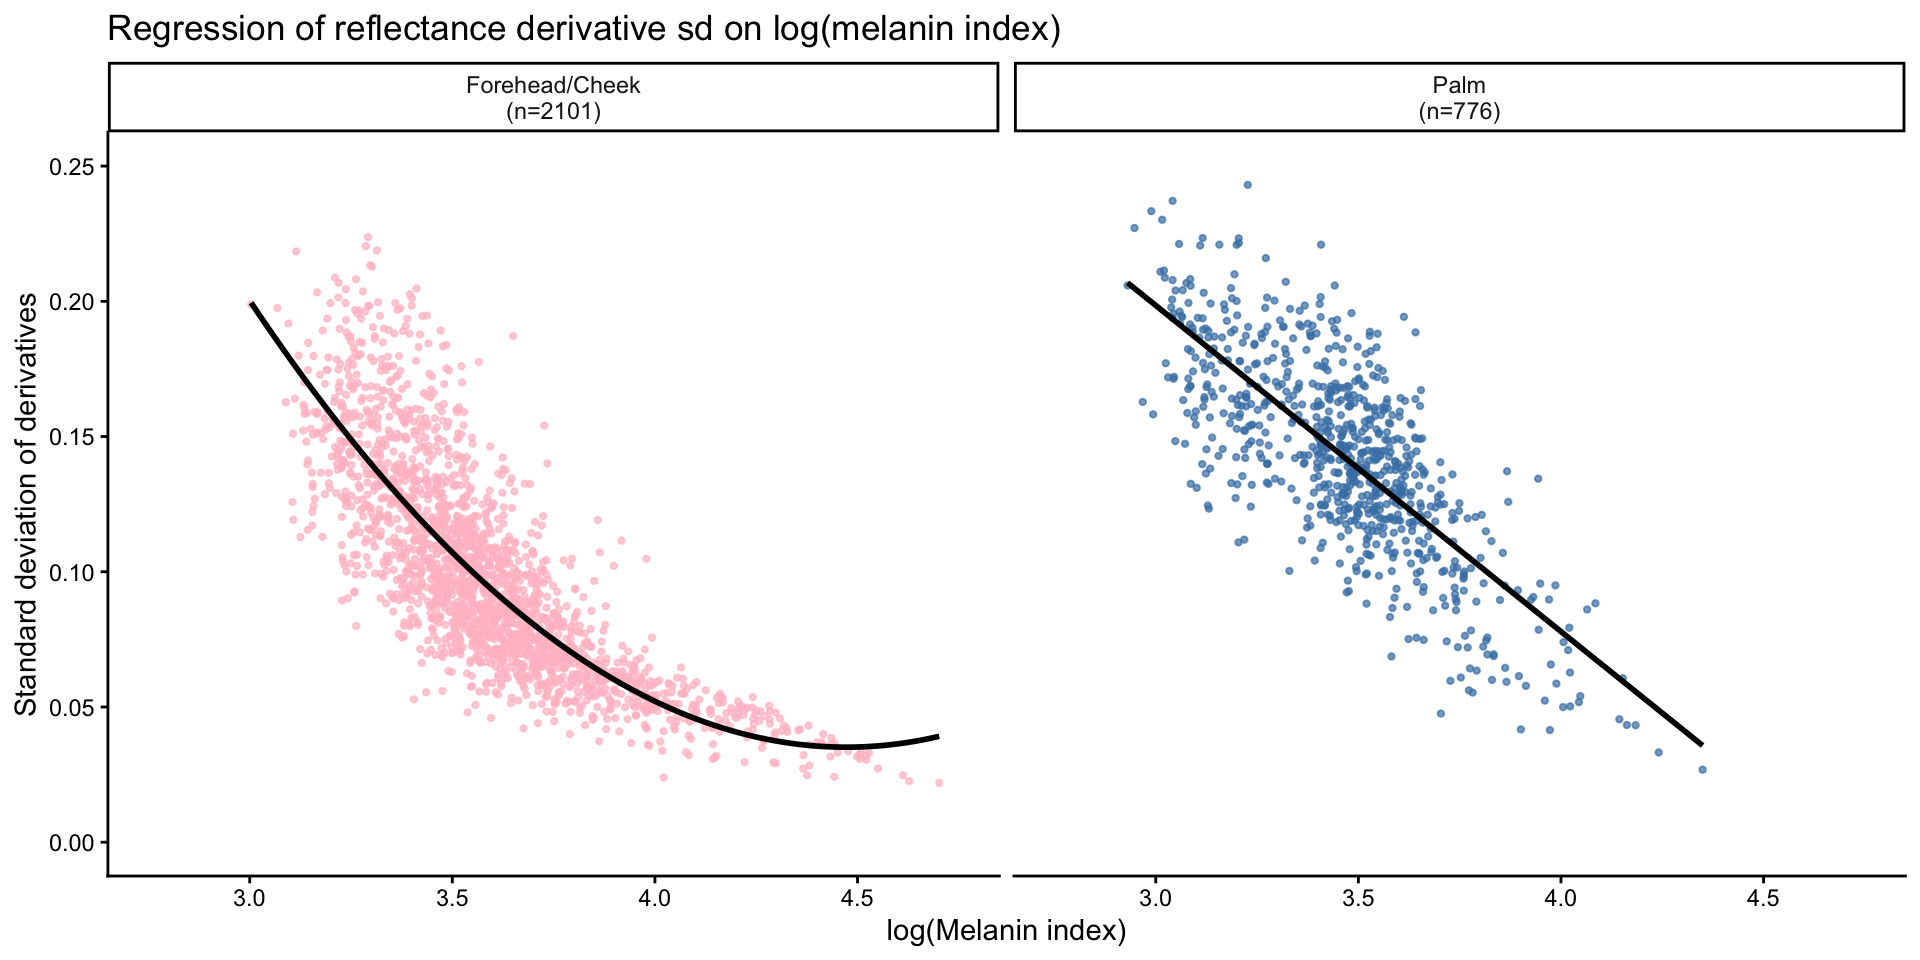
Log-transformed: Derivative SD vs melanin index (reflectance)
A log-log regression tests for a power-law relationship between derivative variability and melanin content. The slope in log-log space represents the exponent of this power-law relationship.
=== Log-log regression: log(sd_ref) ~ log(mi) ===FACE:
Call:
lm(formula = log(sd_ref) ~ log(mi), data = sd_face)

Residuals:
     Min       1Q   Median       3Q      Max
-0.80045 -0.14091  0.00135  0.13879  0.78775

Coefficients:
            Estimate Std. Error t value Pr(>|t|)
(Intercept)  2.35968    0.06520   36.19   <2e-16 ***
log(mi)     -1.32148    0.01813  -72.89   <2e-16 ***
---
Signif. codes:  0 '***' 0.001 '**' 0.01 '*' 0.05 '.' 0.1 ' ' 1

Residual standard error: 0.2134 on 2099 degrees of freedom
Multiple R-squared:  0.7168,    Adjusted R-squared:  0.7166
F-statistic:  5312 on 1 and 2099 DF,  p-value: < 2.2e-16
PALM:
Call:
lm(formula = log(sd_ref) ~ log(mi), data = sd_palm)

Residuals:
     Min       1Q   Median       3Q      Max
-0.81944 -0.10556  0.01225  0.13604  0.49637

Coefficients:
            Estimate Std. Error t value Pr(>|t|)
(Intercept)  1.46811    0.10826   13.56   <2e-16 ***
log(mi)     -0.99743    0.03117  -32.00   <2e-16 ***
---
Signif. codes:  0 '***' 0.001 '**' 0.01 '*' 0.05 '.' 0.1 ' ' 1

Residual standard error: 0.1958 on 774 degrees of freedom
Multiple R-squared:  0.5695,    Adjusted R-squared:  0.569
F-statistic:  1024 on 1 and 774 DF,  p-value: < 2.2e-16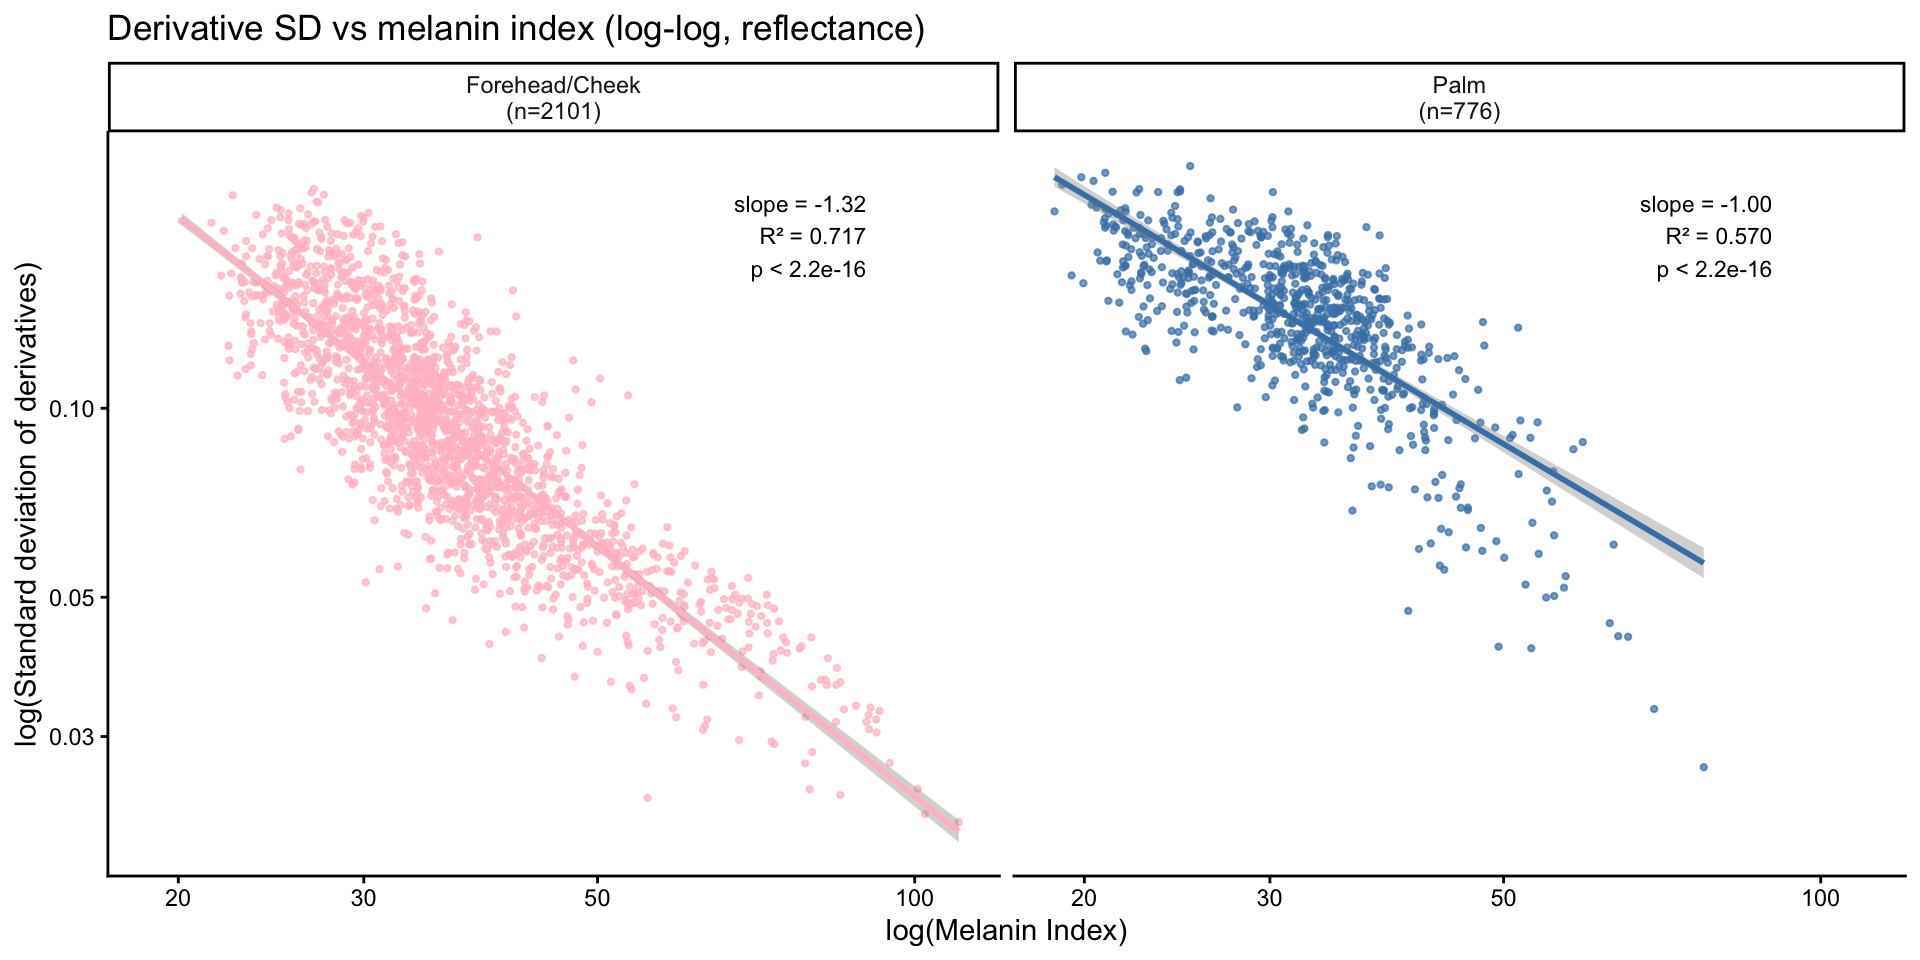
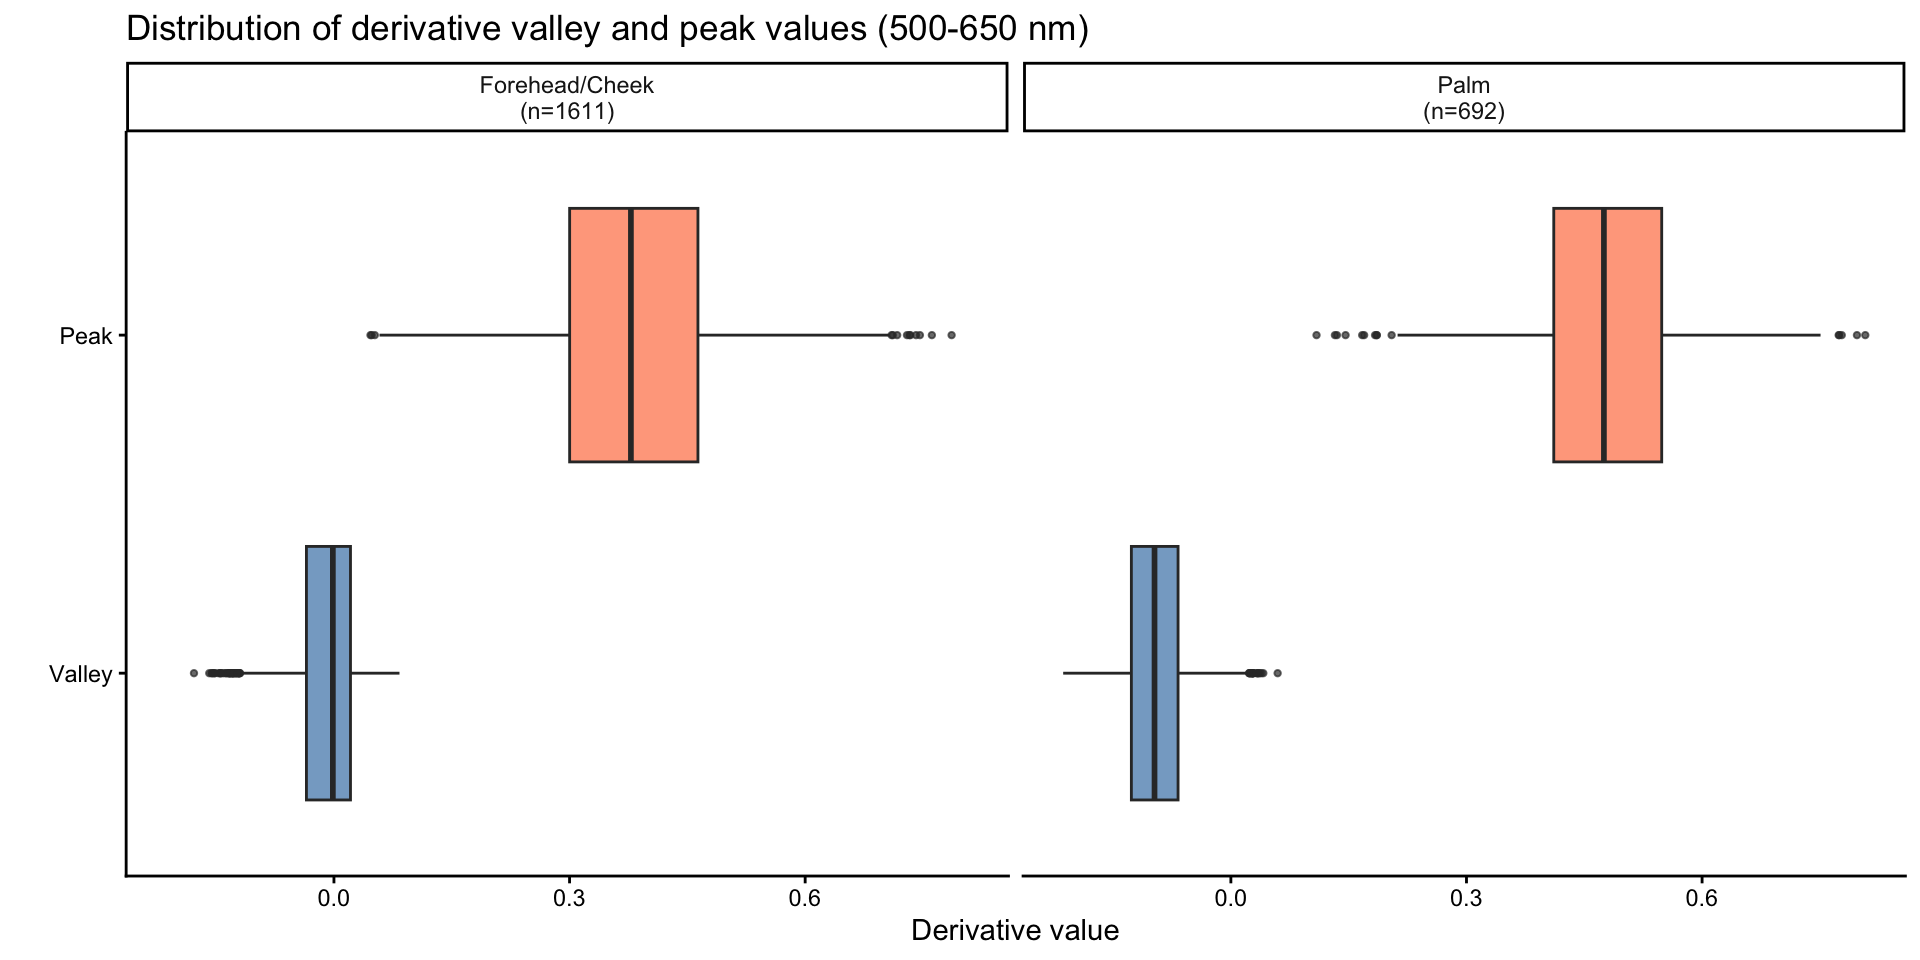
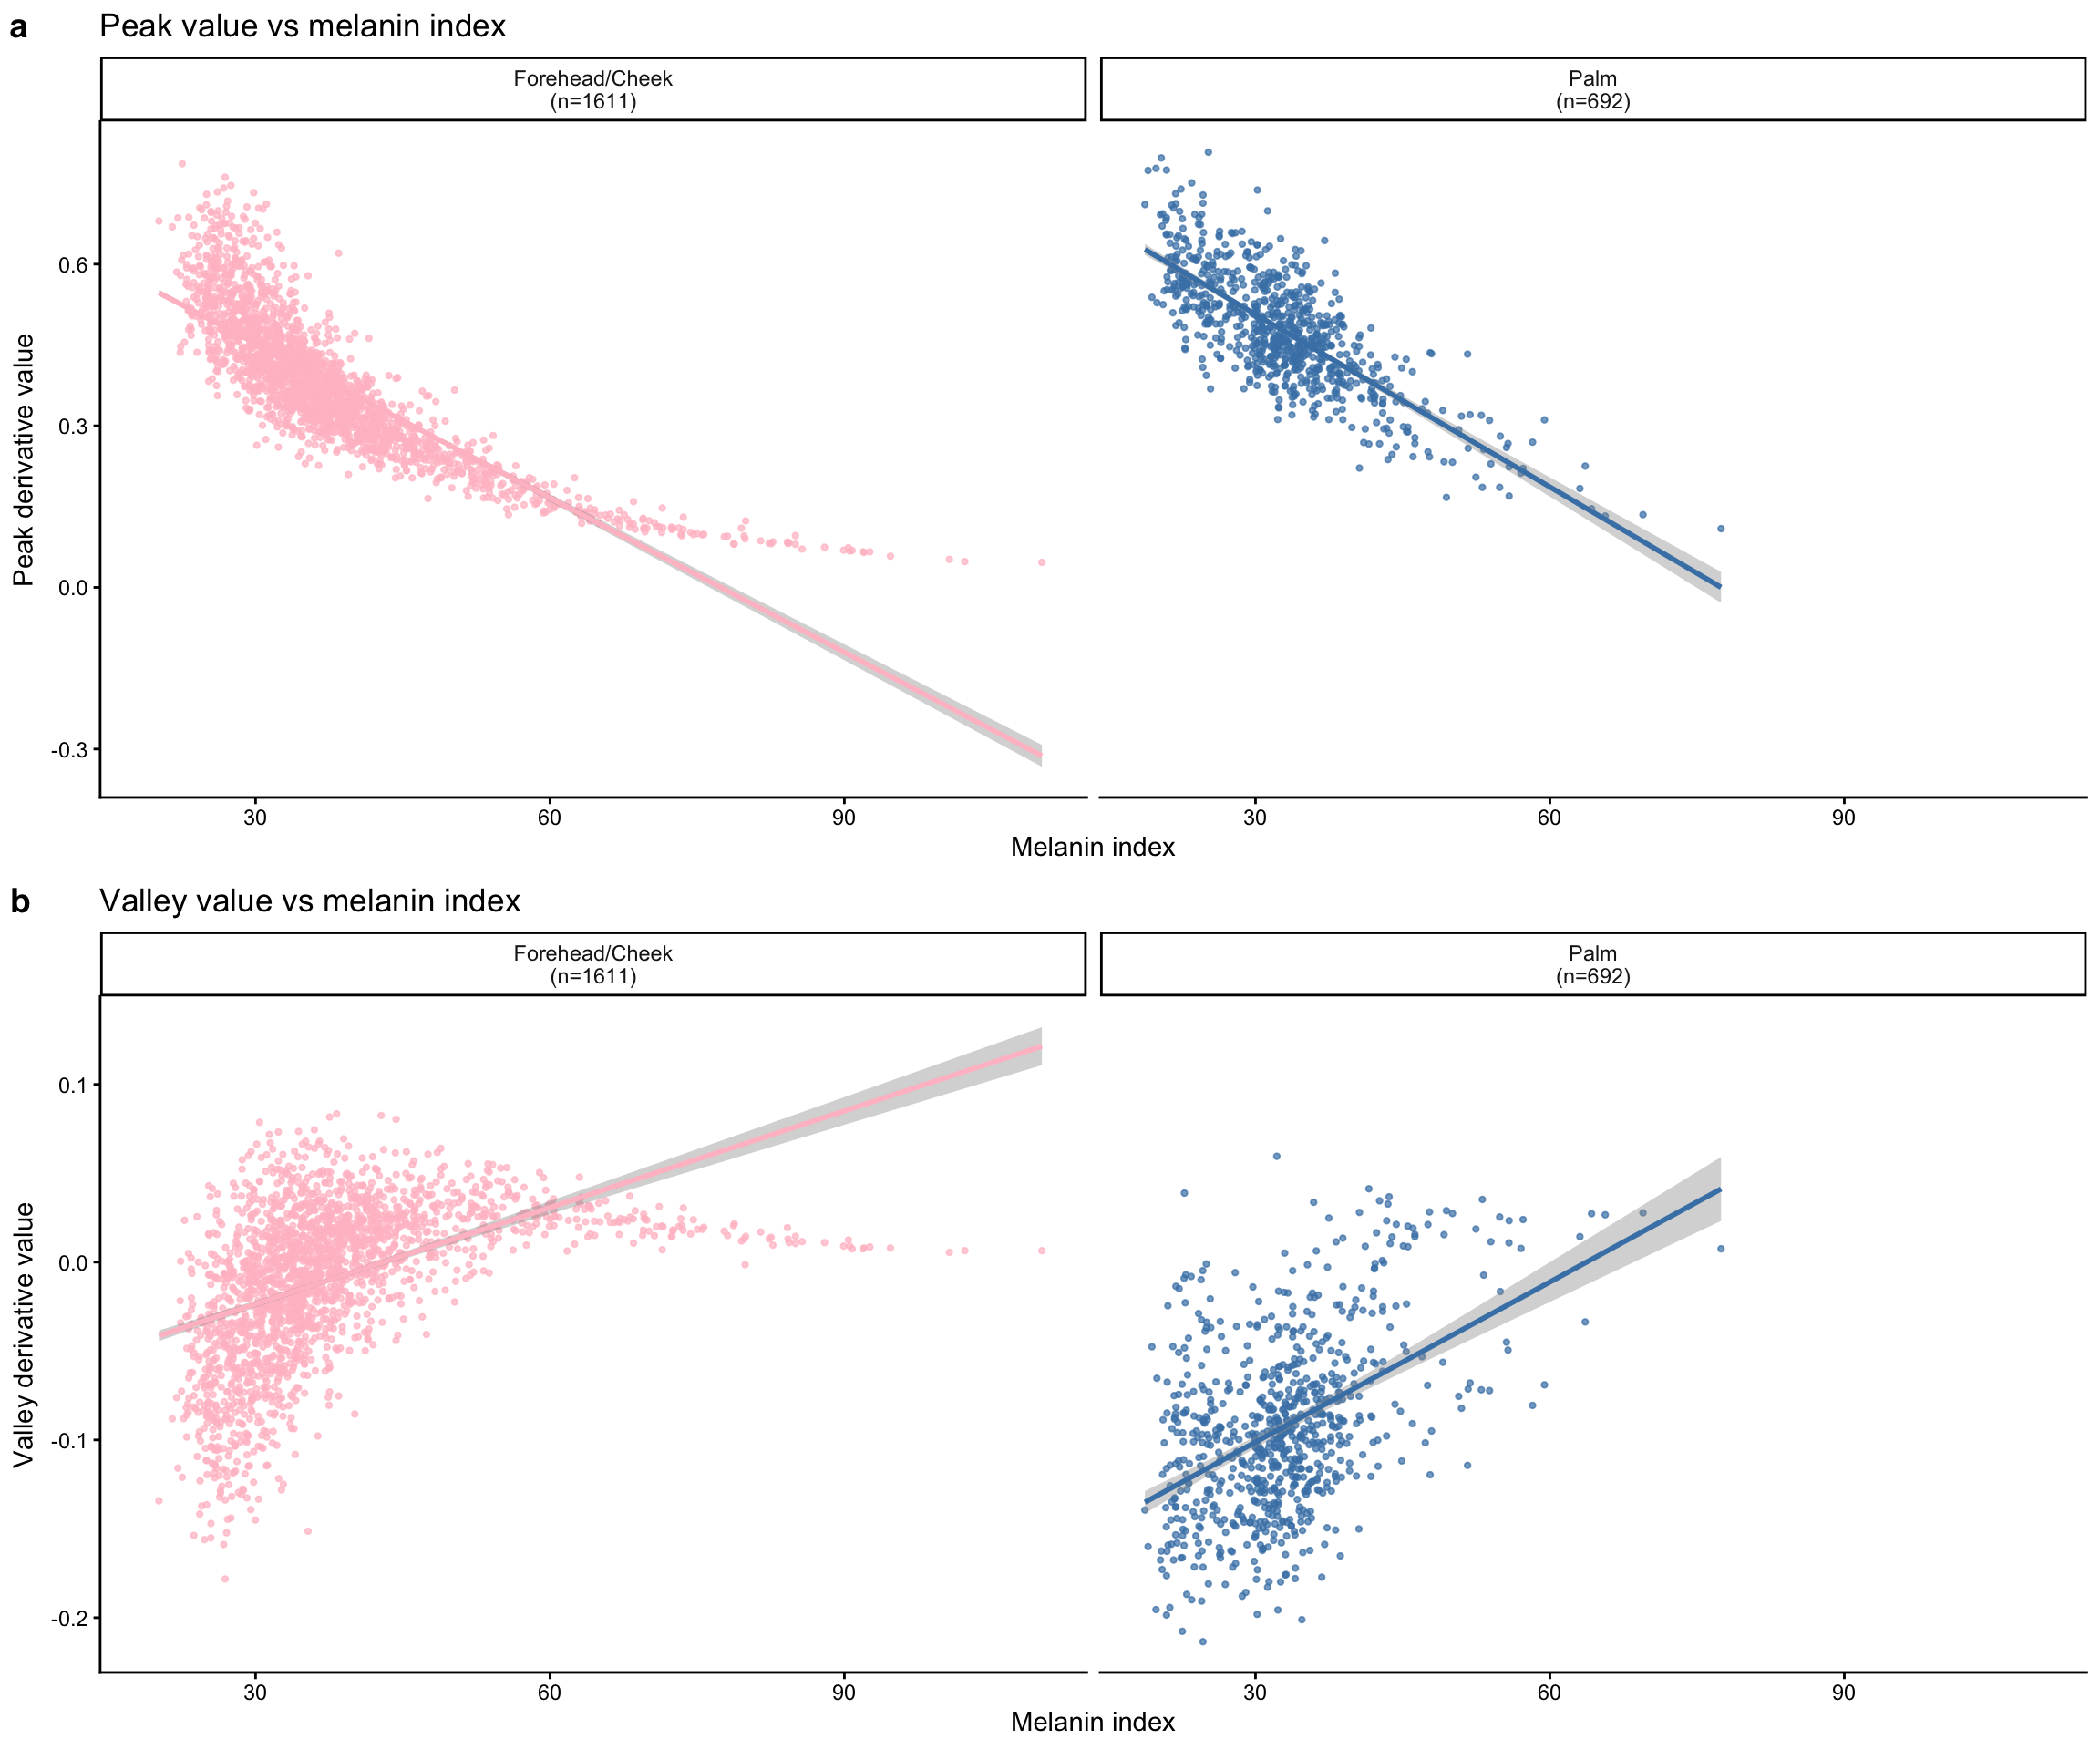
Derivative peak and valley analysis (500-650 nm)
For each individual spectrum, we identify the peak (maximum) and valley (minimum) of the first derivative within the 500-650 nm wavelength range. This range captures the hemoglobin absorption features.
Face derivative peak/valley summary (500-650 nm):Peak wavelength - Mean: 593.4 SD: 8.8 Valley wavelength - Mean: 530.1 SD: 11.2
Palm derivative peak/valley summary (500-650 nm):Peak wavelength - Mean: 591.2 SD: 3.2 Valley wavelength - Mean: 529.8 SD: 1.6 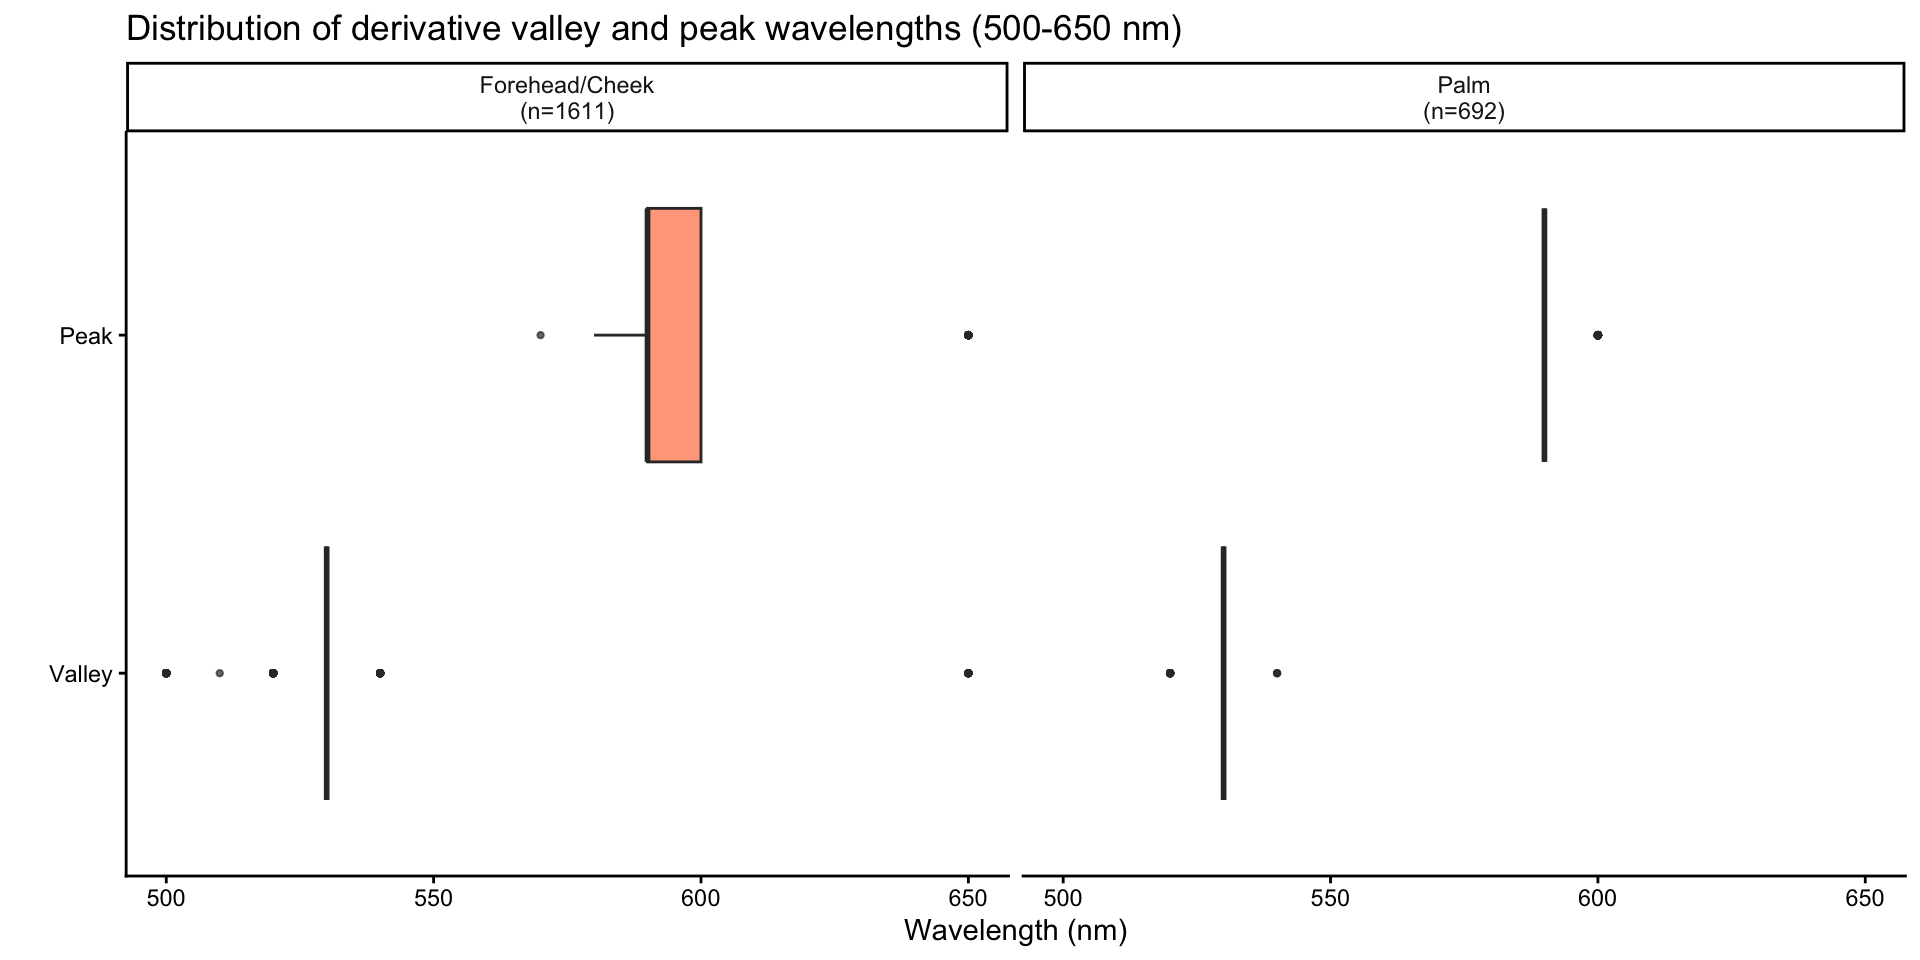
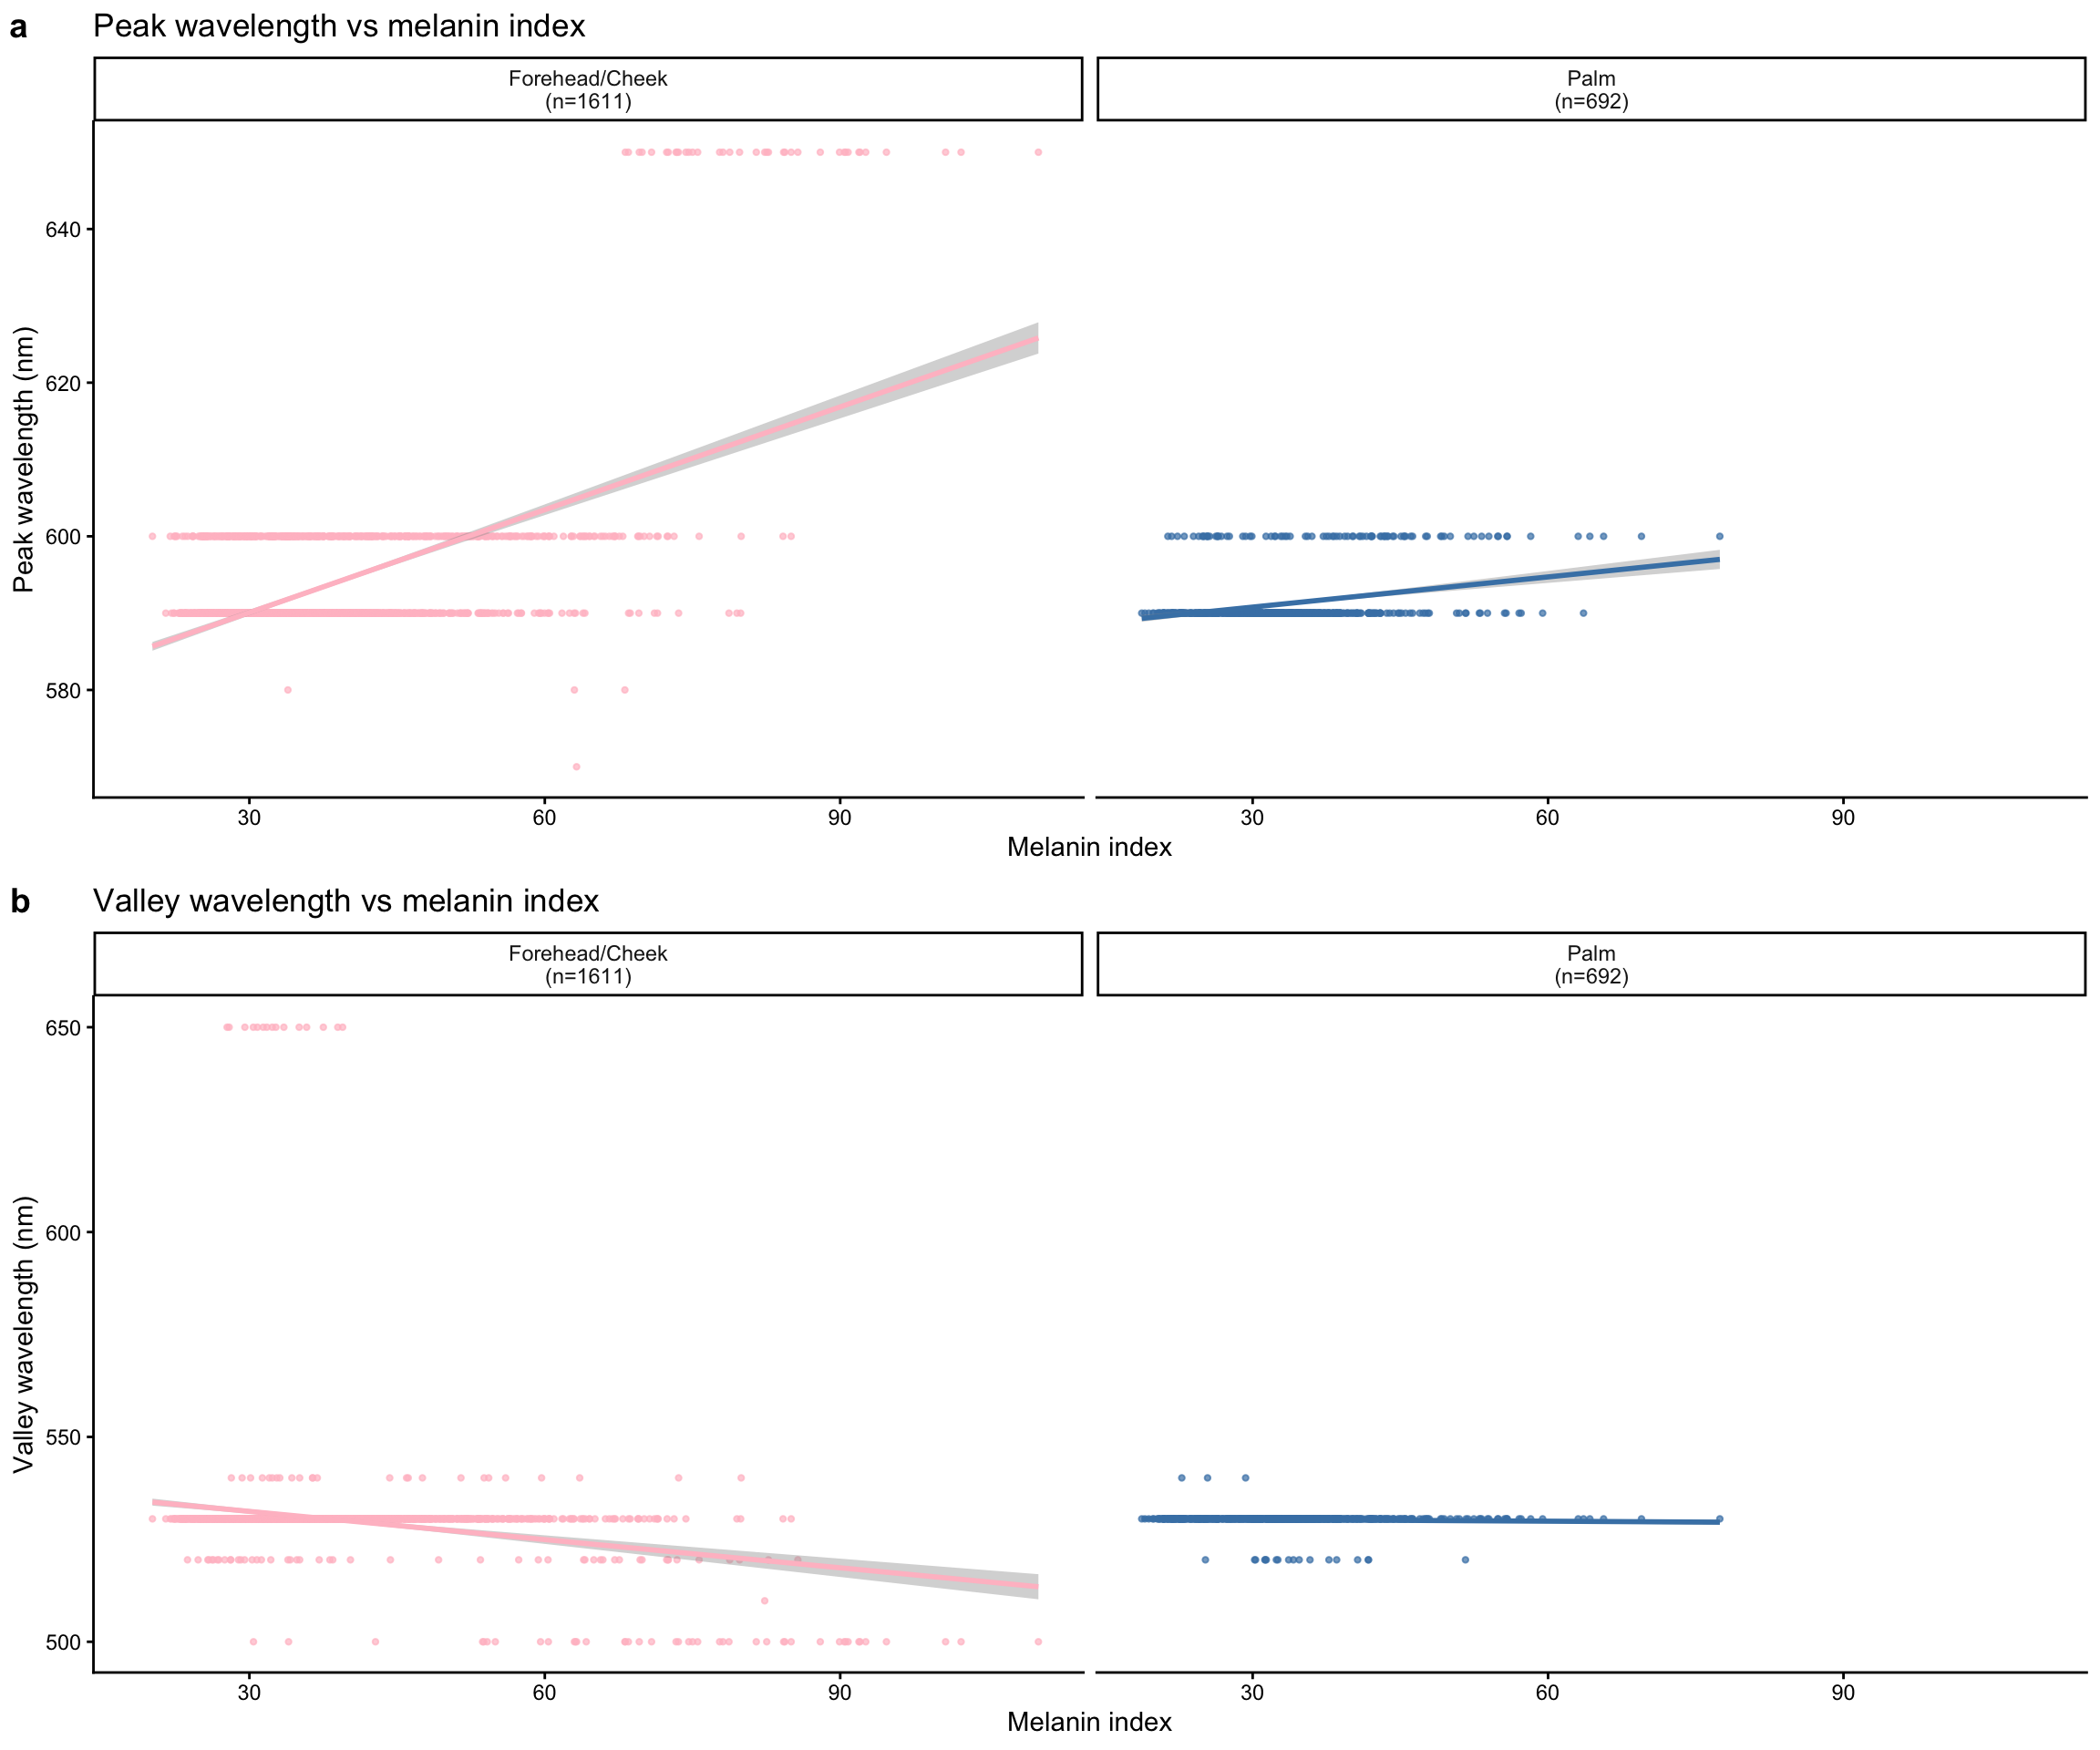
Regression: Peak/valley location and value vs melanin index
=== FACE: Peak and Valley vs Melanin Index ===Peak wavelength ~ MI:
Call:
lm(formula = peak_wavelength ~ mi, data = face_peak_valley)

Residuals:
    Min      1Q  Median      3Q     Max
-34.898  -3.530  -1.138   1.738  42.895

Coefficients:
             Estimate Std. Error t value Pr(>|t|)
(Intercept) 576.68823    0.55179  1045.1   <2e-16 ***
mi            0.44617    0.01412    31.6   <2e-16 ***
---
Signif. codes:  0 '***' 0.001 '**' 0.01 '*' 0.05 '.' 0.1 ' ' 1

Residual standard error: 7.239 on 2099 degrees of freedom
Multiple R-squared:  0.3223,    Adjusted R-squared:  0.322
F-statistic: 998.3 on 1 and 2099 DF,  p-value: < 2.2e-16
Valley wavelength ~ MI:
Call:
lm(formula = valley_wavelength ~ mi, data = face_peak_valley)

Residuals:
    Min      1Q  Median      3Q     Max
-31.727  -1.898  -0.790   0.548 120.351

Coefficients:
             Estimate Std. Error t value Pr(>|t|)
(Intercept) 538.70815    0.82978  649.22   <2e-16 ***
mi           -0.22953    0.02123  -10.81   <2e-16 ***
---
Signif. codes:  0 '***' 0.001 '**' 0.01 '*' 0.05 '.' 0.1 ' ' 1

Residual standard error: 10.89 on 2099 degrees of freedom
Multiple R-squared:  0.05273,   Adjusted R-squared:  0.05228
F-statistic: 116.8 on 1 and 2099 DF,  p-value: < 2.2e-16
Peak value ~ MI:
Call:
lm(formula = peak_value ~ mi, data = face_peak_valley)

Residuals:
     Min       1Q   Median       3Q      Max
-0.18771 -0.04834 -0.01068  0.03352  0.35911

Coefficients:
              Estimate Std. Error t value Pr(>|t|)
(Intercept)  0.7393814  0.0054962  134.53   <2e-16 ***
mi          -0.0095523  0.0001407  -67.92   <2e-16 ***
---
Signif. codes:  0 '***' 0.001 '**' 0.01 '*' 0.05 '.' 0.1 ' ' 1

Residual standard error: 0.0721 on 2099 degrees of freedom
Multiple R-squared:  0.6872,    Adjusted R-squared:  0.6871
F-statistic:  4612 on 1 and 2099 DF,  p-value: < 2.2e-16
Valley value ~ MI:
Call:
lm(formula = valley_value ~ mi, data = face_peak_valley)

Residuals:
      Min        1Q    Median        3Q       Max
-0.149037 -0.021909  0.004065  0.025444  0.101464

Coefficients:
              Estimate Std. Error t value Pr(>|t|)
(Intercept) -7.788e-02  2.892e-03  -26.93   <2e-16 ***
mi           1.810e-03  7.401e-05   24.46   <2e-16 ***
---
Signif. codes:  0 '***' 0.001 '**' 0.01 '*' 0.05 '.' 0.1 ' ' 1

Residual standard error: 0.03794 on 2099 degrees of freedom
Multiple R-squared:  0.2218,    Adjusted R-squared:  0.2214
F-statistic: 598.3 on 1 and 2099 DF,  p-value: < 2.2e-16
=== PALM: Peak and Valley vs Melanin Index ===Peak wavelength ~ MI:
Call:
lm(formula = peak_wavelength ~ mi, data = palm_peak_valley)

Residuals:
    Min      1Q  Median      3Q     Max
-5.1837 -1.4310 -0.9626 -0.0740 10.3396

Coefficients:
             Estimate Std. Error  t value Pr(>|t|)
(Intercept) 586.86185    0.47421 1237.565   <2e-16 ***
mi            0.13084    0.01405    9.313   <2e-16 ***
---
Signif. codes:  0 '***' 0.001 '**' 0.01 '*' 0.05 '.' 0.1 ' ' 1

Residual standard error: 3.04 on 774 degrees of freedom
Multiple R-squared:  0.1008,    Adjusted R-squared:  0.09961
F-statistic: 86.74 on 1 and 774 DF,  p-value: < 2.2e-16
Valley wavelength ~ MI:
Call:
lm(formula = valley_wavelength ~ mi, data = palm_peak_valley)

Residuals:
    Min      1Q  Median      3Q     Max
-9.9124  0.1110  0.1858  0.2405 10.1440

Coefficients:
              Estimate Std. Error  t value Pr(>|t|)
(Intercept) 530.260853   0.254584 2082.852   <2e-16 ***
mi           -0.013826   0.007542   -1.833   0.0672 .
---
Signif. codes:  0 '***' 0.001 '**' 0.01 '*' 0.05 '.' 0.1 ' ' 1

Residual standard error: 1.632 on 774 degrees of freedom
Multiple R-squared:  0.004323,  Adjusted R-squared:  0.003036
F-statistic:  3.36 on 1 and 774 DF,  p-value: 0.06717
Peak value ~ MI:
Call:
lm(formula = peak_value ~ mi, data = palm_peak_valley)

Residuals:
      Min        1Q    Median        3Q       Max
-0.187325 -0.048439 -0.007921  0.049163  0.249649

Coefficients:
              Estimate Std. Error t value Pr(>|t|)
(Intercept)  0.8273744  0.0109182   75.78   <2e-16 ***
mi          -0.0106817  0.0003235  -33.02   <2e-16 ***
---
Signif. codes:  0 '***' 0.001 '**' 0.01 '*' 0.05 '.' 0.1 ' ' 1

Residual standard error: 0.07 on 774 degrees of freedom
Multiple R-squared:  0.5849,    Adjusted R-squared:  0.5843
F-statistic:  1091 on 1 and 774 DF,  p-value: < 2.2e-16
Valley value ~ MI:
Call:
lm(formula = valley_value ~ mi, data = palm_peak_valley)

Residuals:
      Min        1Q    Median        3Q       Max
-0.114064 -0.031746 -0.004144  0.027809  0.161850

Coefficients:
              Estimate Std. Error t value Pr(>|t|)
(Intercept) -0.1913198  0.0068269  -28.02   <2e-16 ***
mi           0.0030023  0.0002023   14.84   <2e-16 ***
---
Signif. codes:  0 '***' 0.001 '**' 0.01 '*' 0.05 '.' 0.1 ' ' 1

Residual standard error: 0.04377 on 774 degrees of freedom
Multiple R-squared:  0.2216,    Adjusted R-squared:  0.2206
F-statistic: 220.3 on 1 and 774 DF,  p-value: < 2.2e-16
Visualization: Peak/valley wavelength vs melanin index
| Version | Author | Date |
|---|---|---|
| 40b4375 | tinalasisi | 2025-12-18 |
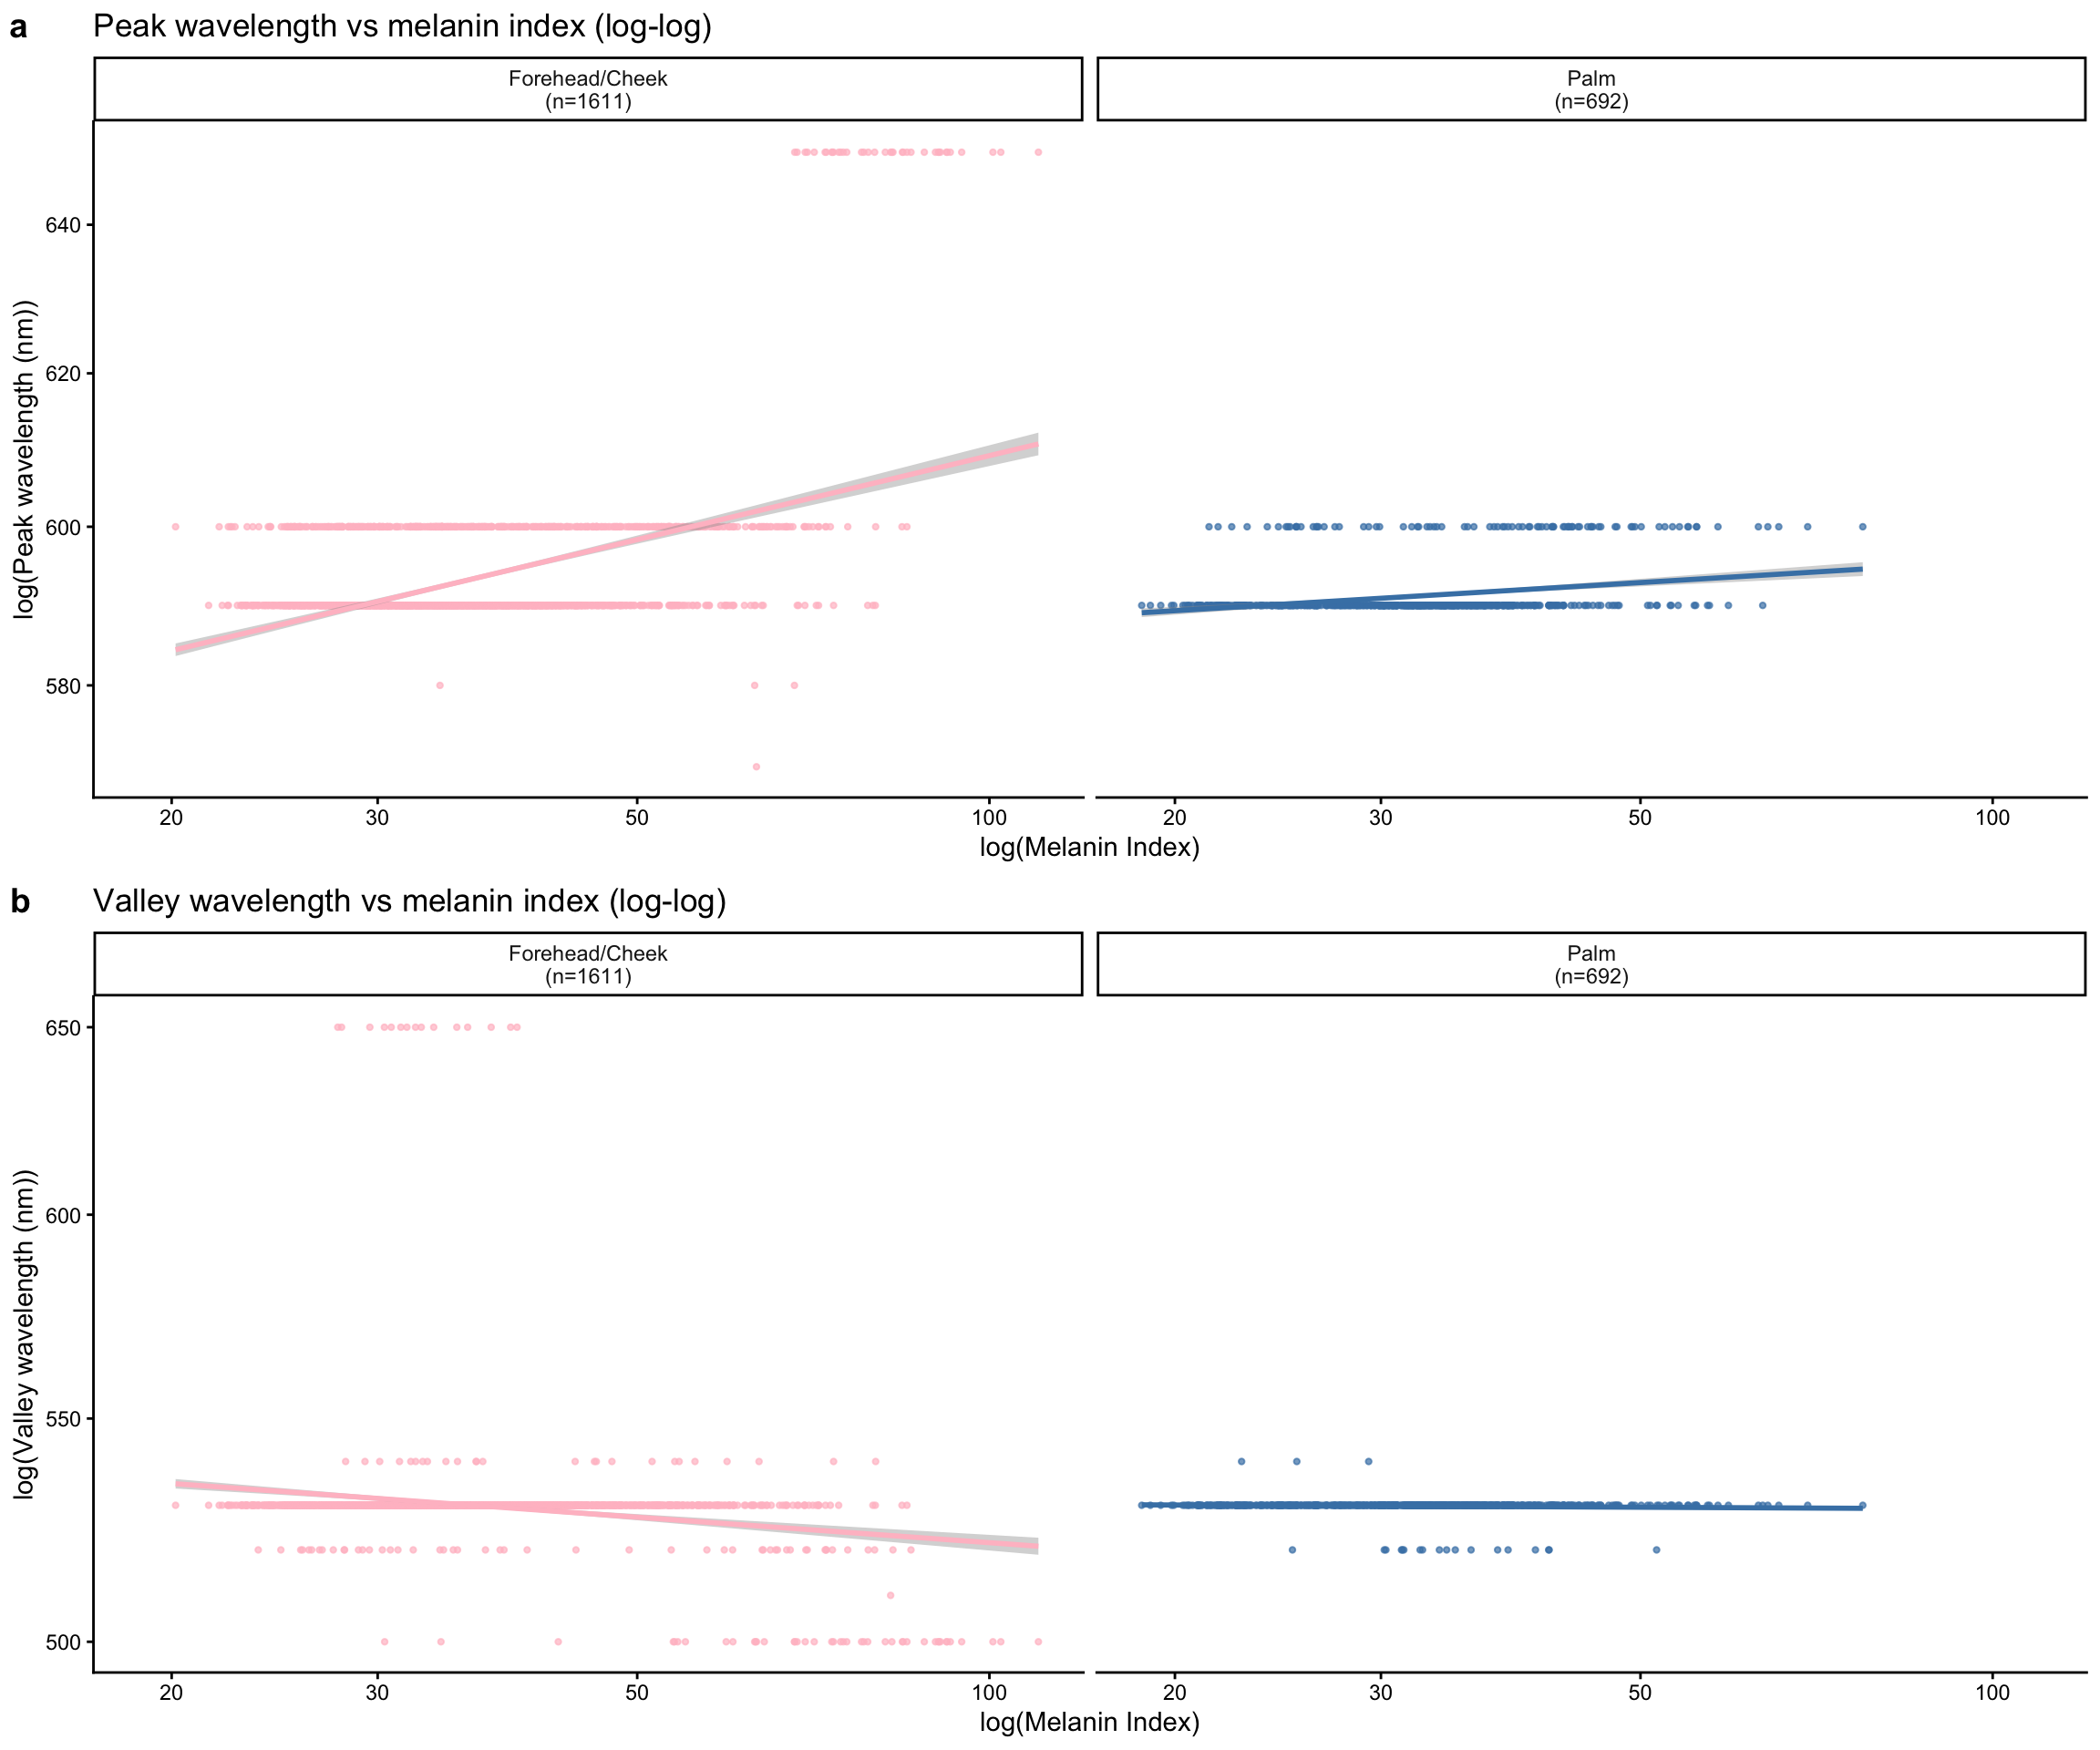
Log-transformed: Peak/valley wavelength vs melanin index
Log-transforming both axes tests whether peak and valley wavelength positions follow a power-law relationship with melanin content. Since wavelengths vary little, we expect minimal relationships.
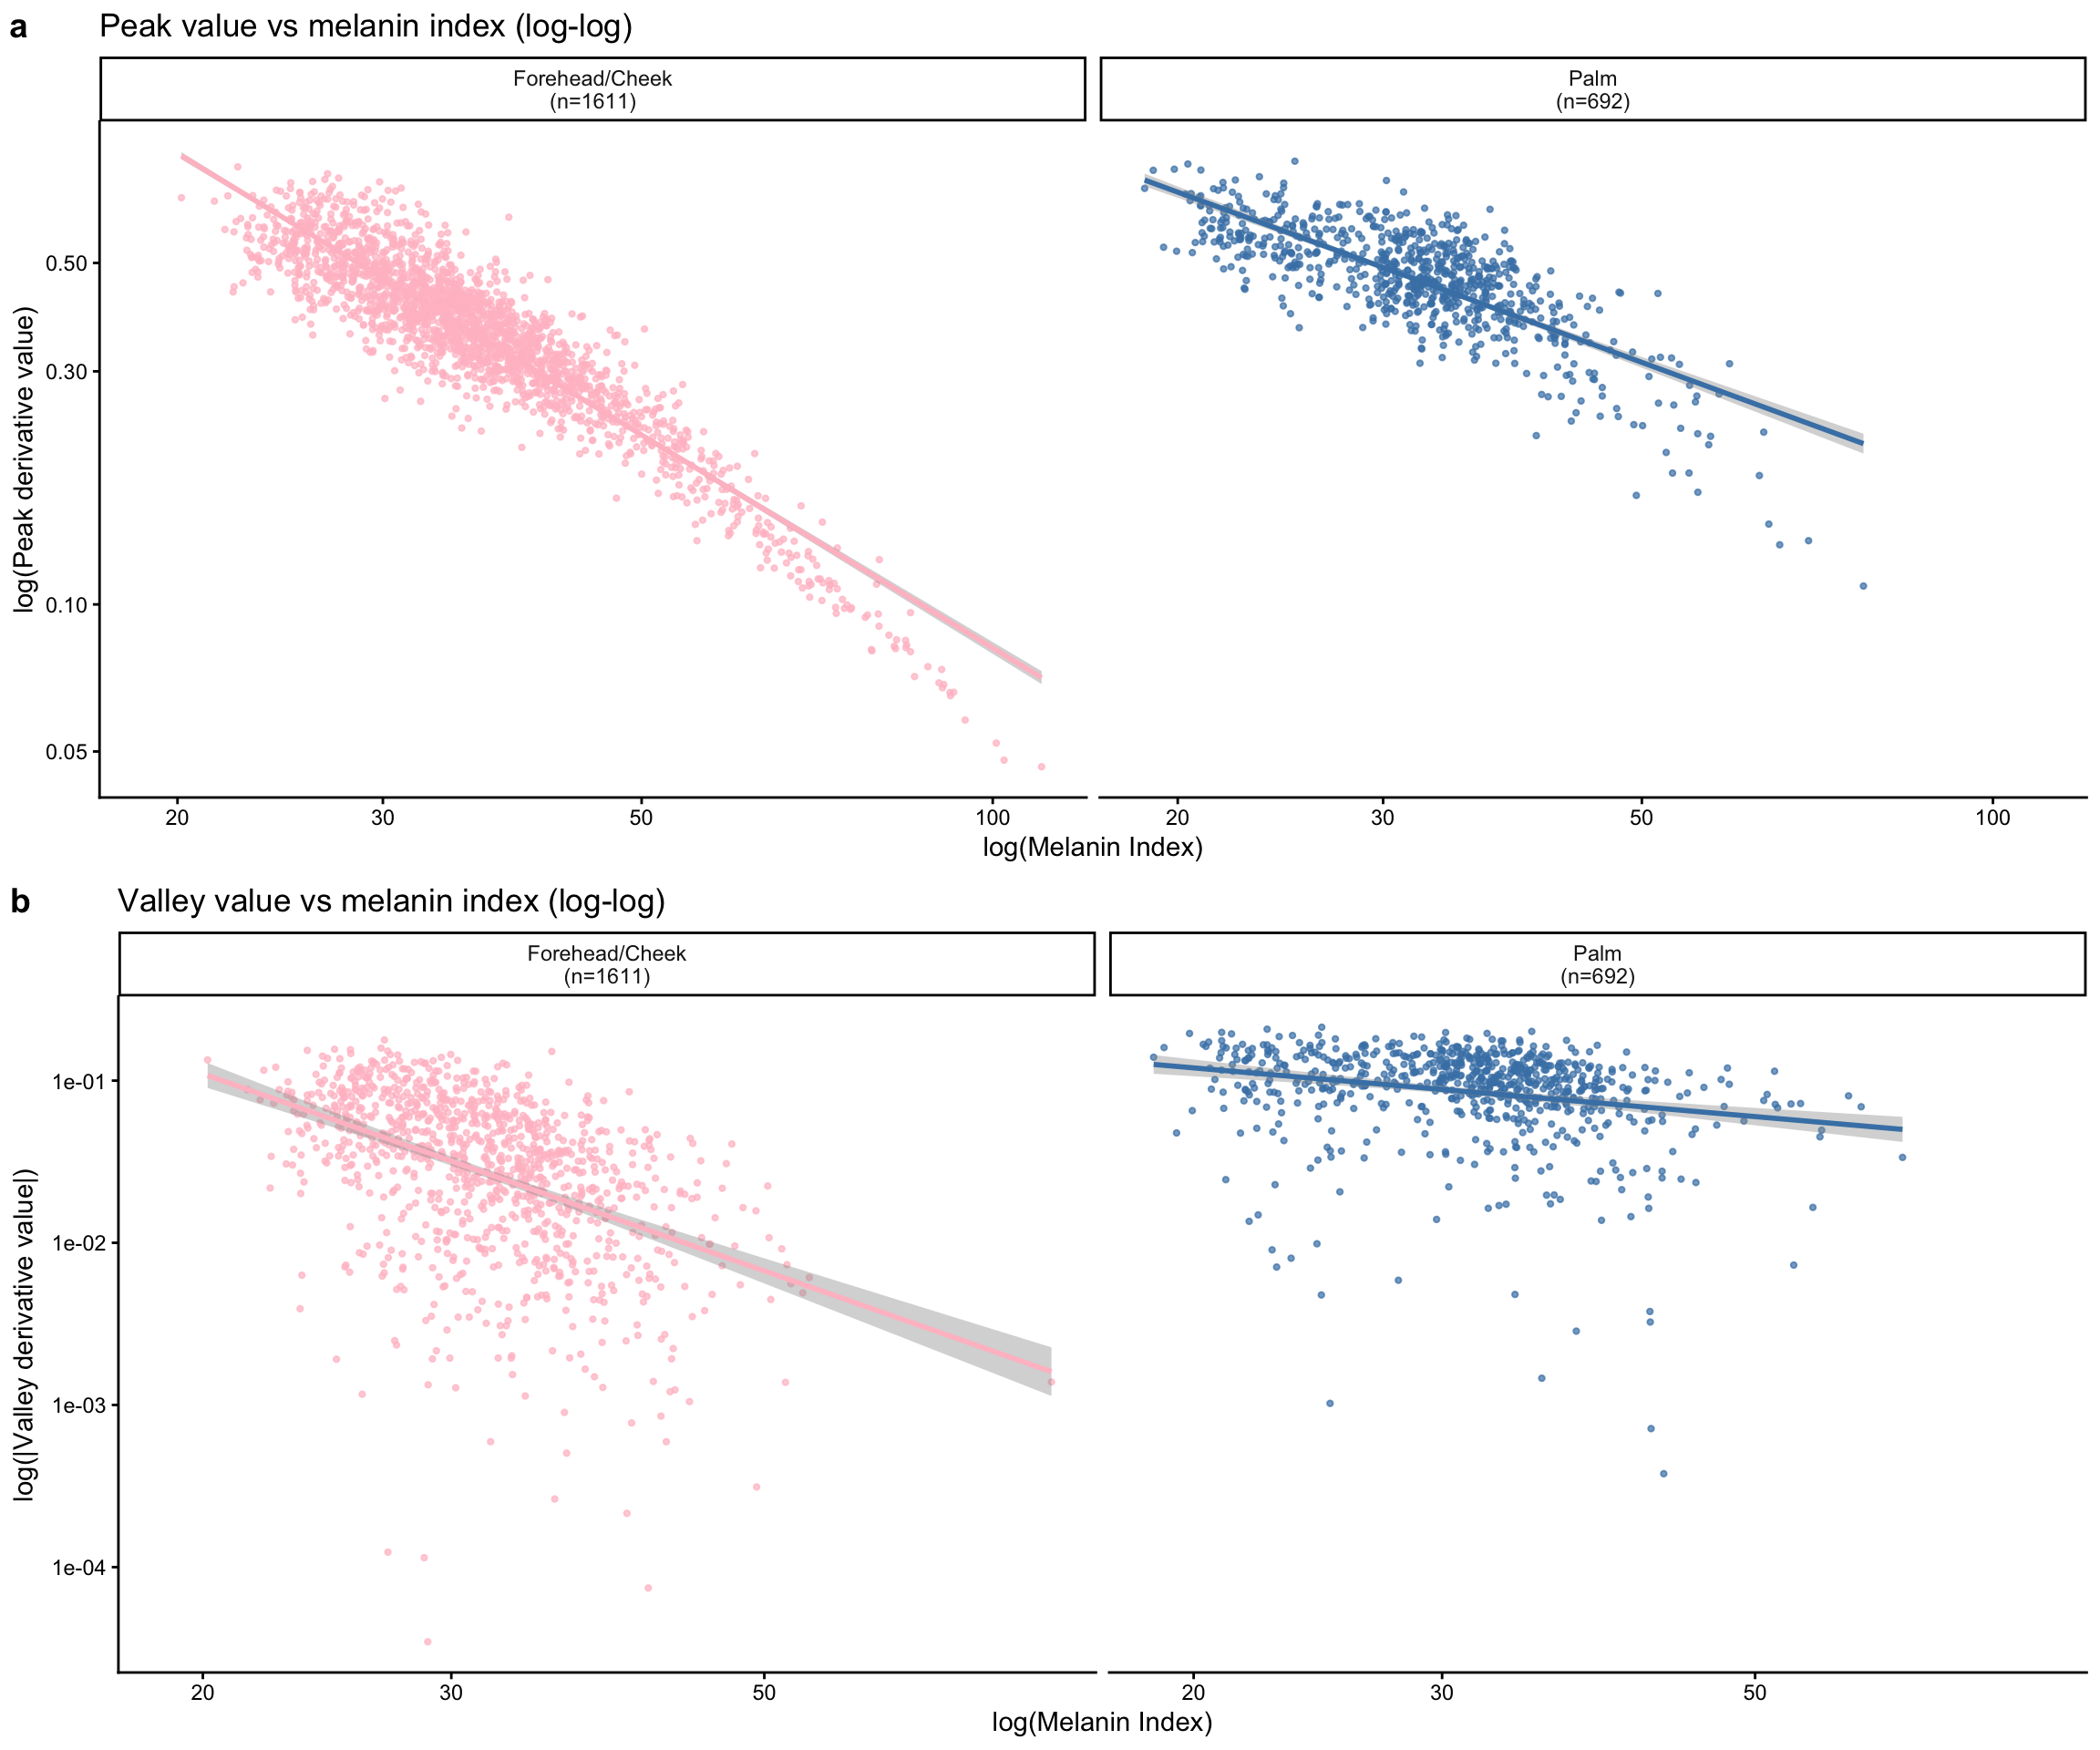
Log-transformed: Peak/valley value vs melanin index
Log-log regression tests whether the amplitude of derivative peak and valley values follow a power-law relationship with melanin content. Note that valley values are negative, so we use absolute values for the log transformation.
Delta (peak - valley) vs melanin index
The delta represents the amplitude of the hemoglobin absorption feature in the derivative spectrum - the difference between the peak and valley values.
Delta (peak - valley) summary:Face: Min. 1st Qu. Median Mean 3rd Qu. Max.
0.04004 0.27772 0.37771 0.39182 0.49500 0.93954
Palm: Min. 1st Qu. Median Mean 3rd Qu. Max.
0.1015 0.4844 0.5746 0.5692 0.6605 0.9887 === FACE: Delta (peak - valley) vs Melanin Index ===
Call:
lm(formula = delta ~ mi, data = face_peak_valley)

Residuals:
     Min       1Q   Median       3Q      Max
-0.27745 -0.07247 -0.01447  0.05338  0.47412

Coefficients:
              Estimate Std. Error t value Pr(>|t|)
(Intercept)  0.8172622  0.0081496  100.28   <2e-16 ***
mi          -0.0113627  0.0002086  -54.48   <2e-16 ***
---
Signif. codes:  0 '***' 0.001 '**' 0.01 '*' 0.05 '.' 0.1 ' ' 1

Residual standard error: 0.1069 on 2099 degrees of freedom
Multiple R-squared:  0.5858,    Adjusted R-squared:  0.5856
F-statistic:  2968 on 1 and 2099 DF,  p-value: < 2.2e-16
=== PALM: Delta (peak - valley) vs Melanin Index ===
Call:
lm(formula = delta ~ mi, data = palm_peak_valley)

Residuals:
      Min        1Q    Median        3Q       Max
-0.282128 -0.069668 -0.003611  0.075198  0.314928

Coefficients:
              Estimate Std. Error t value Pr(>|t|)
(Intercept)  1.0186942  0.0161829   62.95   <2e-16 ***
mi          -0.0136839  0.0004794  -28.54   <2e-16 ***
---
Signif. codes:  0 '***' 0.001 '**' 0.01 '*' 0.05 '.' 0.1 ' ' 1

Residual standard error: 0.1038 on 774 degrees of freedom
Multiple R-squared:  0.5128,    Adjusted R-squared:  0.5122
F-statistic: 814.6 on 1 and 774 DF,  p-value: < 2.2e-16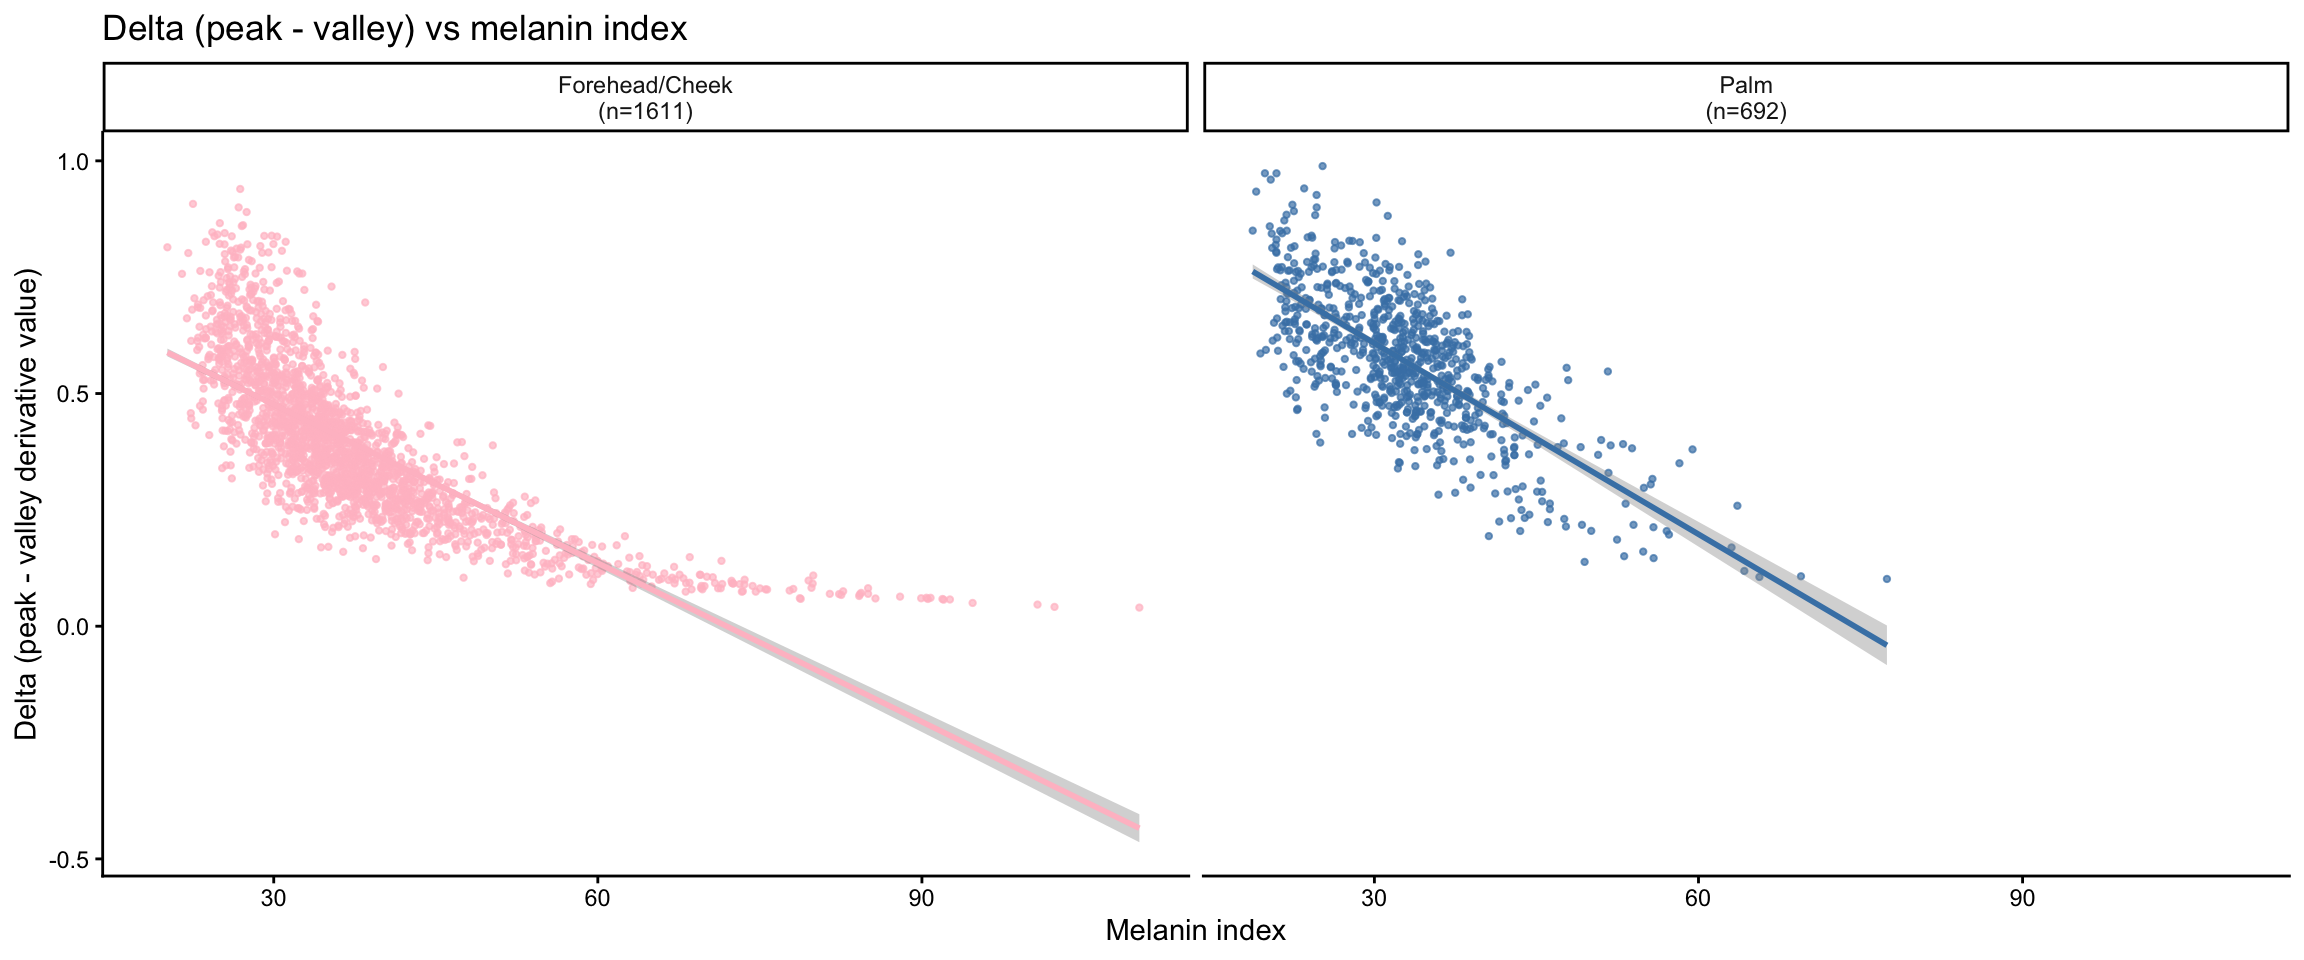
Log-transformed: Delta vs melanin index
The delta (peak minus valley) represents the amplitude of the hemoglobin absorption feature in the first derivative. Log-log regression tests whether this amplitude follows a power-law relationship with melanin content.
=== Log-log regression: log(delta) ~ log(mi) ===FACE:
Call:
lm(formula = log(delta) ~ log(mi), data = delta_face)

Residuals:
     Min       1Q   Median       3Q      Max
-0.89324 -0.15612  0.00565  0.15903  0.79202

Coefficients:
            Estimate Std. Error t value Pr(>|t|)
(Intercept)  5.20782    0.07044   73.93   <2e-16 ***
log(mi)     -1.74330    0.01959  -89.00   <2e-16 ***
---
Signif. codes:  0 '***' 0.001 '**' 0.01 '*' 0.05 '.' 0.1 ' ' 1

Residual standard error: 0.2306 on 2099 degrees of freedom
Multiple R-squared:  0.7905,    Adjusted R-squared:  0.7904
F-statistic:  7921 on 1 and 2099 DF,  p-value: < 2.2e-16
PALM:
Call:
lm(formula = log(delta) ~ log(mi), data = delta_palm)

Residuals:
     Min       1Q   Median       3Q      Max
-0.94014 -0.11438  0.02426  0.15211  0.53171

Coefficients:
            Estimate Std. Error t value Pr(>|t|)
(Intercept)   2.8407     0.1233   23.04   <2e-16 ***
log(mi)      -0.9945     0.0355  -28.02   <2e-16 ***
---
Signif. codes:  0 '***' 0.001 '**' 0.01 '*' 0.05 '.' 0.1 ' ' 1

Residual standard error: 0.223 on 774 degrees of freedom
Multiple R-squared:  0.5035,    Adjusted R-squared:  0.5029
F-statistic: 784.9 on 1 and 774 DF,  p-value: < 2.2e-16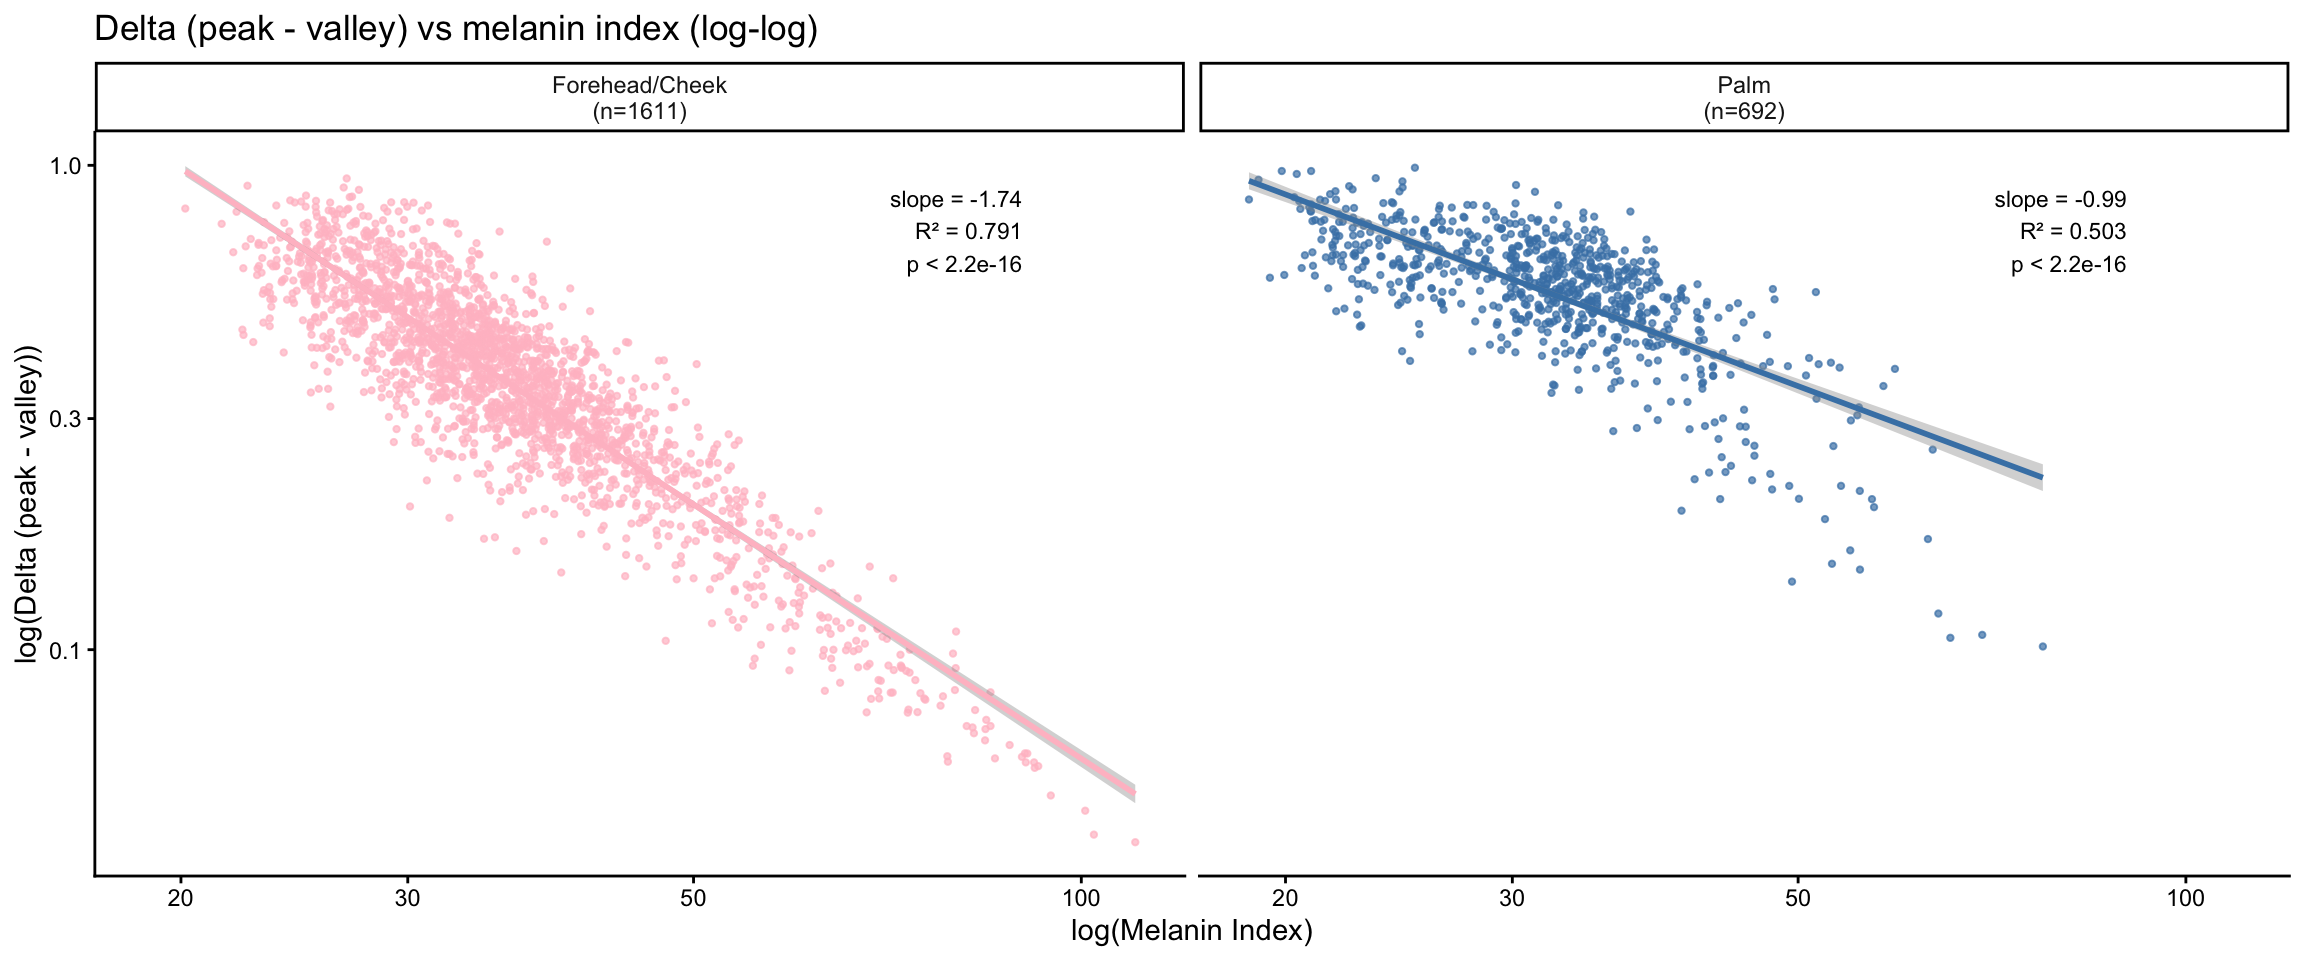
Correlation between absorbance derivative sd and melanin index

Log-transformed: Derivative SD vs melanin index (absorbance)
This log-log regression tests for a power-law relationship between absorbance derivative variability and melanin content.
=== Log-log regression: log(sd_abs) ~ log(mi) ===FACE:
Call:
lm(formula = log(sd_abs) ~ log(mi), data = sd_face)

Residuals:
     Min       1Q   Median       3Q      Max
-0.85684 -0.18033 -0.01627  0.13516  1.14607

Coefficients:
            Estimate Std. Error t value Pr(>|t|)
(Intercept) -4.23656    0.08862  -47.81   <2e-16 ***
log(mi)     -0.61138    0.02464  -24.81   <2e-16 ***
---
Signif. codes:  0 '***' 0.001 '**' 0.01 '*' 0.05 '.' 0.1 ' ' 1

Residual standard error: 0.2901 on 2099 degrees of freedom
Multiple R-squared:  0.2267,    Adjusted R-squared:  0.2264
F-statistic: 615.5 on 1 and 2099 DF,  p-value: < 2.2e-16
PALM:
Call:
lm(formula = log(sd_abs) ~ log(mi), data = sd_palm)

Residuals:
     Min       1Q   Median       3Q      Max
-1.13969 -0.11919  0.00882  0.14246  0.72193

Coefficients:
            Estimate Std. Error t value Pr(>|t|)
(Intercept) -5.12360    0.11652 -43.974   <2e-16 ***
log(mi)     -0.28220    0.03355  -8.412   <2e-16 ***
---
Signif. codes:  0 '***' 0.001 '**' 0.01 '*' 0.05 '.' 0.1 ' ' 1

Residual standard error: 0.2107 on 774 degrees of freedom
Multiple R-squared:  0.08377,   Adjusted R-squared:  0.08259
F-statistic: 70.77 on 1 and 774 DF,  p-value: < 2.2e-16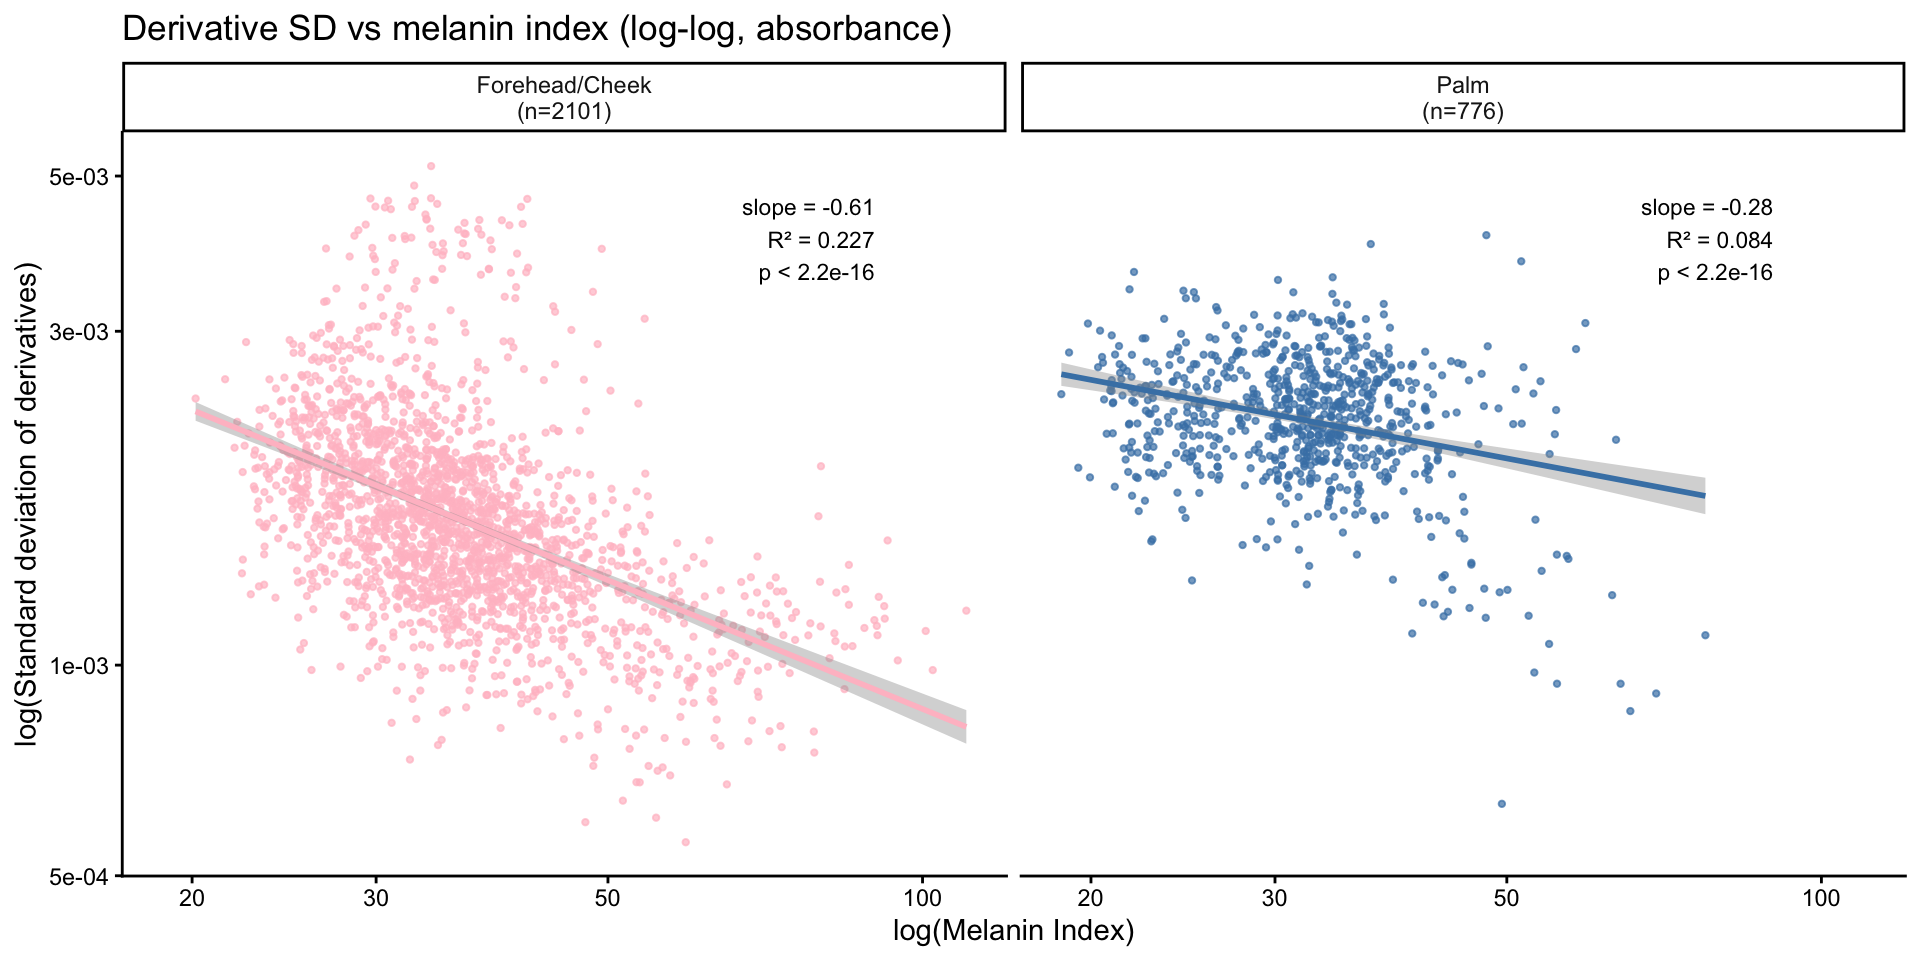
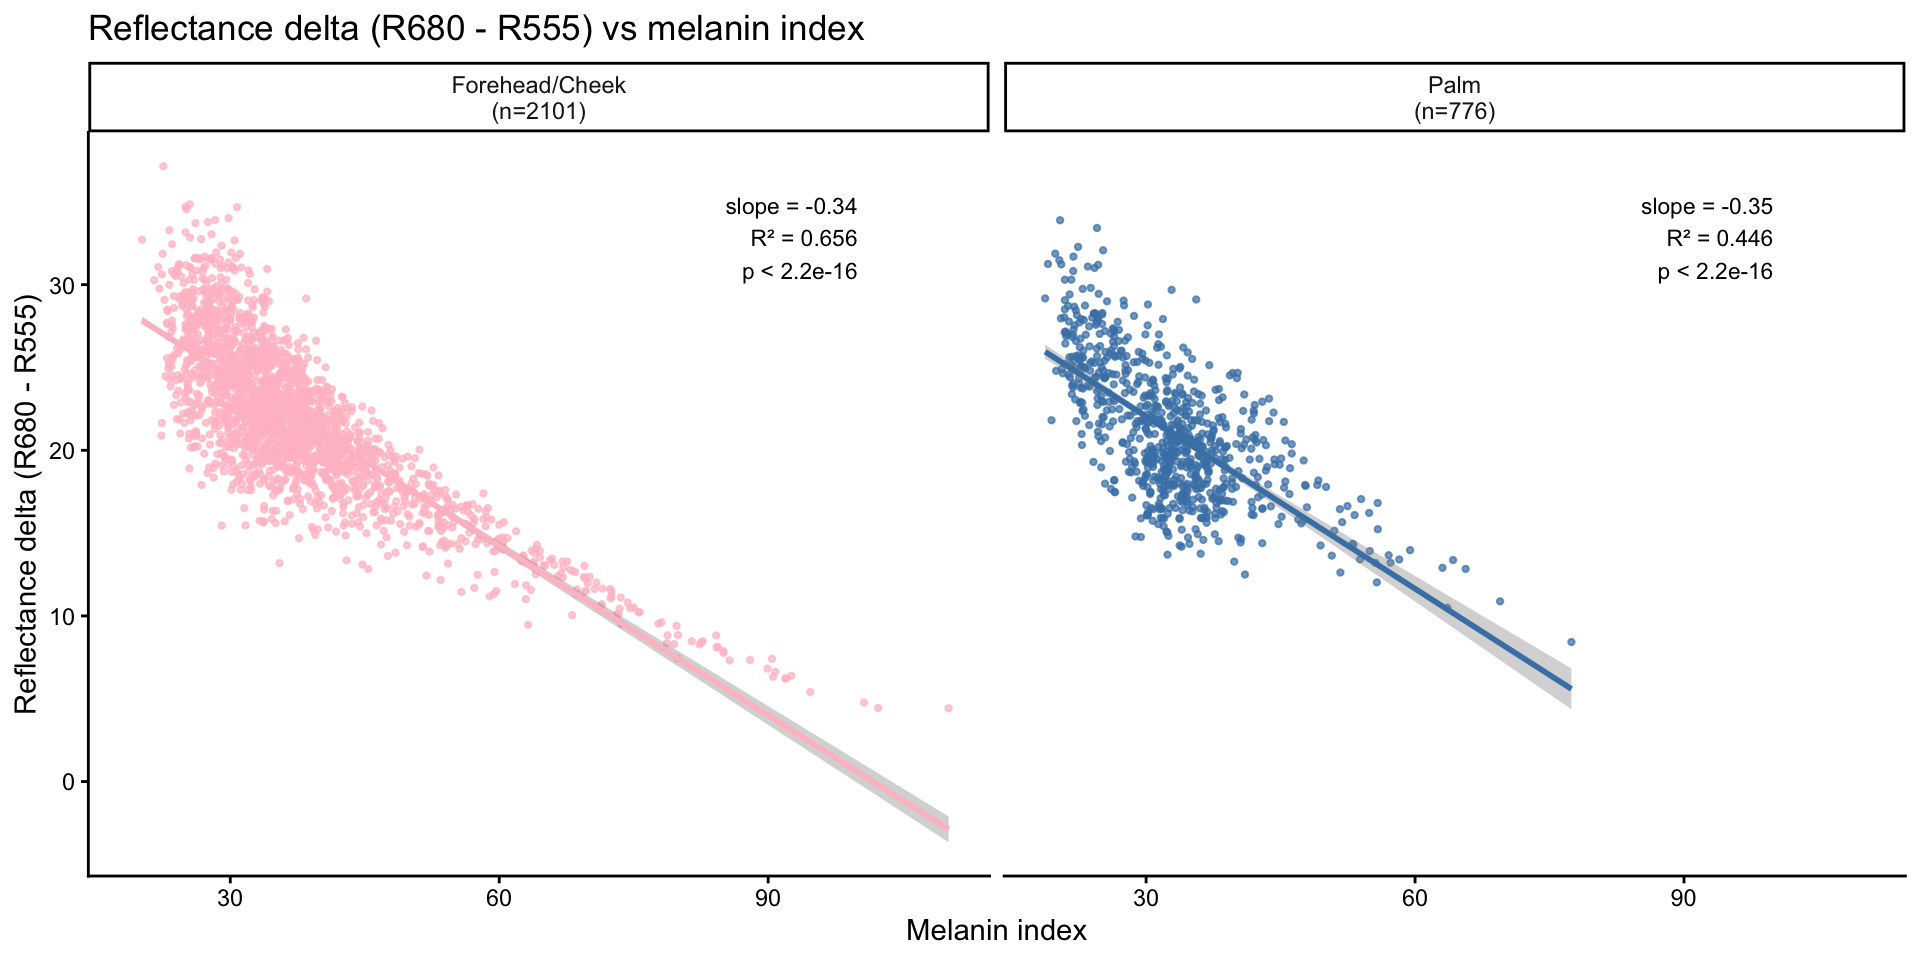
Reflectance delta (680 nm - 555 nm) vs melanin index
The erythema index is based on the ratio of reflectance at 680 nm to the average reflectance at 550-560 nm (approximating 555 nm). Here we examine the raw reflectance difference (delta) between these wavelengths as a function of melanin index.
=== Reflectance delta (R680 - R555_approx) summary ===# A tibble: 2 × 7
site mean_delta sd_delta min_delta max_delta mean_R680 mean_R555
<chr> <dbl> <dbl> <dbl> <dbl> <dbl> <dbl>
1 Forehead/Cheek 21.9 4.72 4.42 37.2 43.4 21.5
2 Palm 21.1 4.04 8.42 33.9 47.6 26.6Visualization: Reflectance delta vs melanin index
Log-transformed: Reflectance delta vs melanin index
Log-log regression tests whether the reflectance difference between 680 nm and ~555 nm follows a power-law relationship with melanin content. Note: only positive delta values can be log-transformed.
Face: 2101 of 2101 have positive deltaPalm: 776 of 776 have positive delta
=== Log-log regression: log(ref_delta) ~ log(mi) ===FACE:
Call:
lm(formula = log(ref_delta) ~ log(mi), data = delta_face_pos)

Residuals:
     Min       1Q   Median       3Q      Max
-0.72504 -0.07492  0.01592  0.09346  0.36331

Coefficients:
            Estimate Std. Error t value Pr(>|t|)
(Intercept)  5.97324    0.04102  145.62   <2e-16 ***
log(mi)     -0.81198    0.01141  -71.18   <2e-16 ***
---
Signif. codes:  0 '***' 0.001 '**' 0.01 '*' 0.05 '.' 0.1 ' ' 1

Residual standard error: 0.1343 on 2099 degrees of freedom
Multiple R-squared:  0.7071,    Adjusted R-squared:  0.7069
F-statistic:  5067 on 1 and 2099 DF,  p-value: < 2.2e-16
PALM:
Call:
lm(formula = log(ref_delta) ~ log(mi), data = delta_palm_pos)

Residuals:
     Min       1Q   Median       3Q      Max
-0.40429 -0.09321  0.00782  0.09911  0.40584

Coefficients:
            Estimate Std. Error t value Pr(>|t|)
(Intercept)  5.11102    0.07690   66.46   <2e-16 ***
log(mi)     -0.60078    0.02214  -27.13   <2e-16 ***
---
Signif. codes:  0 '***' 0.001 '**' 0.01 '*' 0.05 '.' 0.1 ' ' 1

Residual standard error: 0.1391 on 774 degrees of freedom
Multiple R-squared:  0.4875,    Adjusted R-squared:  0.4868
F-statistic: 736.2 on 1 and 774 DF,  p-value: < 2.2e-16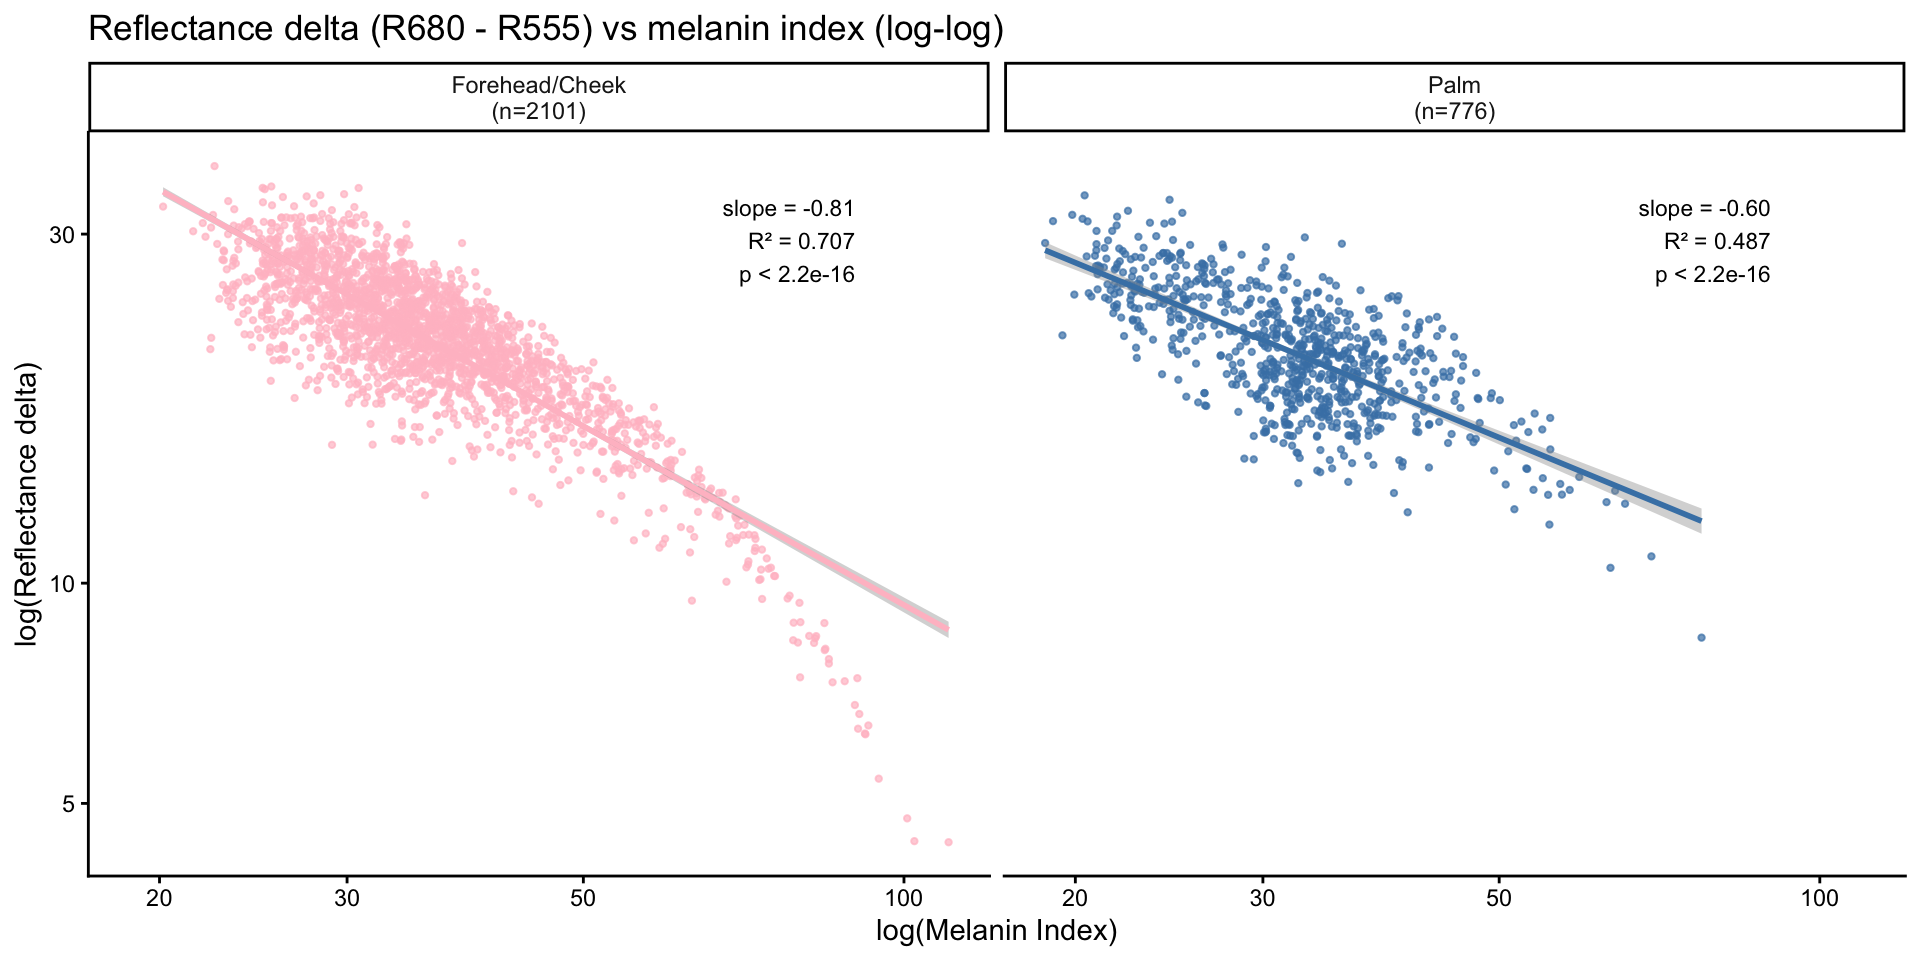
Correlation between erythema index and melanin index by site
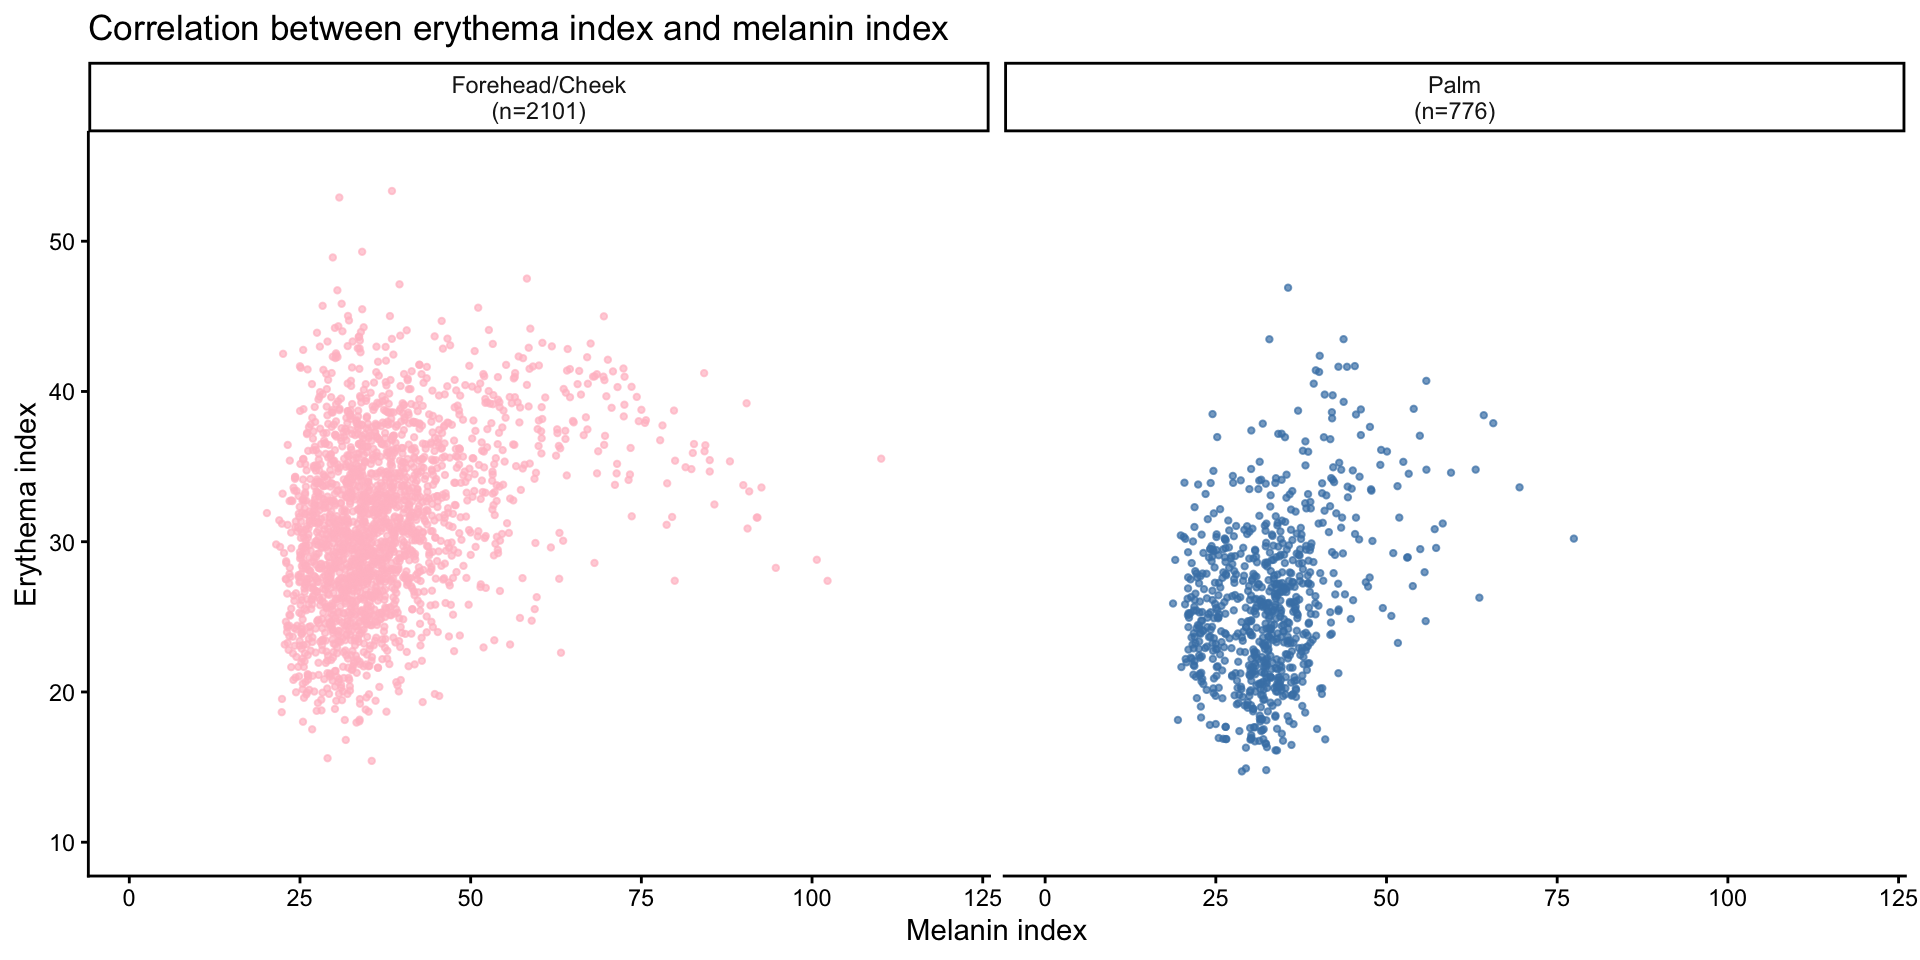
Face erythema index vs face melanin index
=== Linear regression: face_ei ~ face_mi ===
Call:
lm(formula = ei ~ mi, data = face_spectrum)

Residuals:
     Min       1Q   Median       3Q      Max
-15.5732  -3.6643  -0.1162   3.5673  22.7126

Coefficients:
            Estimate Std. Error t value Pr(>|t|)
(Intercept) 25.08333    0.40679   61.66   <2e-16 ***
mi           0.16625    0.01041   15.97   <2e-16 ***
---
Signif. codes:  0 '***' 0.001 '**' 0.01 '*' 0.05 '.' 0.1 ' ' 1

Residual standard error: 5.337 on 2099 degrees of freedom
Multiple R-squared:  0.1083,    Adjusted R-squared:  0.1079
F-statistic:   255 on 1 and 2099 DF,  p-value: < 2.2e-16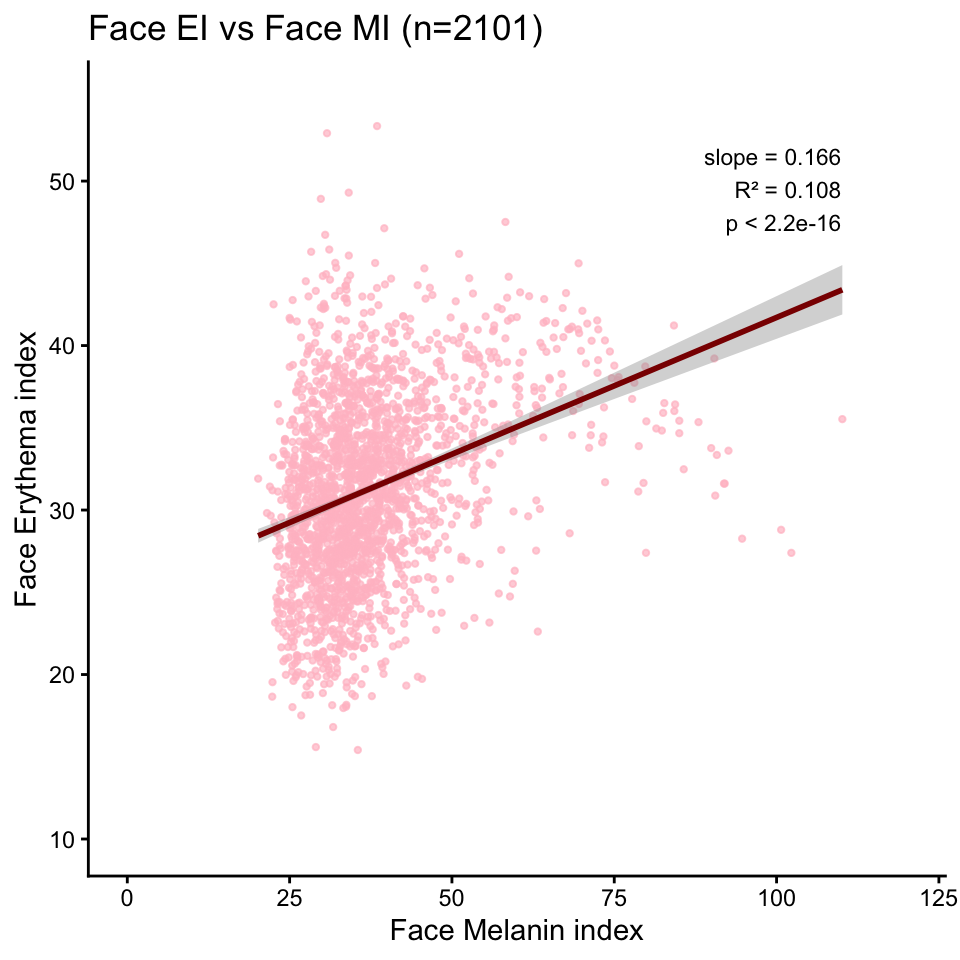
Log-transformed: Face erythema index vs face melanin index
Log-log regression tests whether face erythema index follows a power-law relationship with face melanin content.
=== Log-log regression: log(face_ei) ~ log(face_mi) ===
Call:
lm(formula = log(ei) ~ log(mi), data = face_spectrum %>% filter(ei >
    0, mi > 0))

Residuals:
     Min       1Q   Median       3Q      Max
-0.68767 -0.10831  0.01047  0.12229  0.58094

Coefficients:
            Estimate Std. Error t value Pr(>|t|)
(Intercept)  2.54659    0.05325   47.82   <2e-16 ***
log(mi)      0.24548    0.01481   16.58   <2e-16 ***
---
Signif. codes:  0 '***' 0.001 '**' 0.01 '*' 0.05 '.' 0.1 ' ' 1

Residual standard error: 0.1743 on 2099 degrees of freedom
Multiple R-squared:  0.1158,    Adjusted R-squared:  0.1153
F-statistic: 274.8 on 1 and 2099 DF,  p-value: < 2.2e-16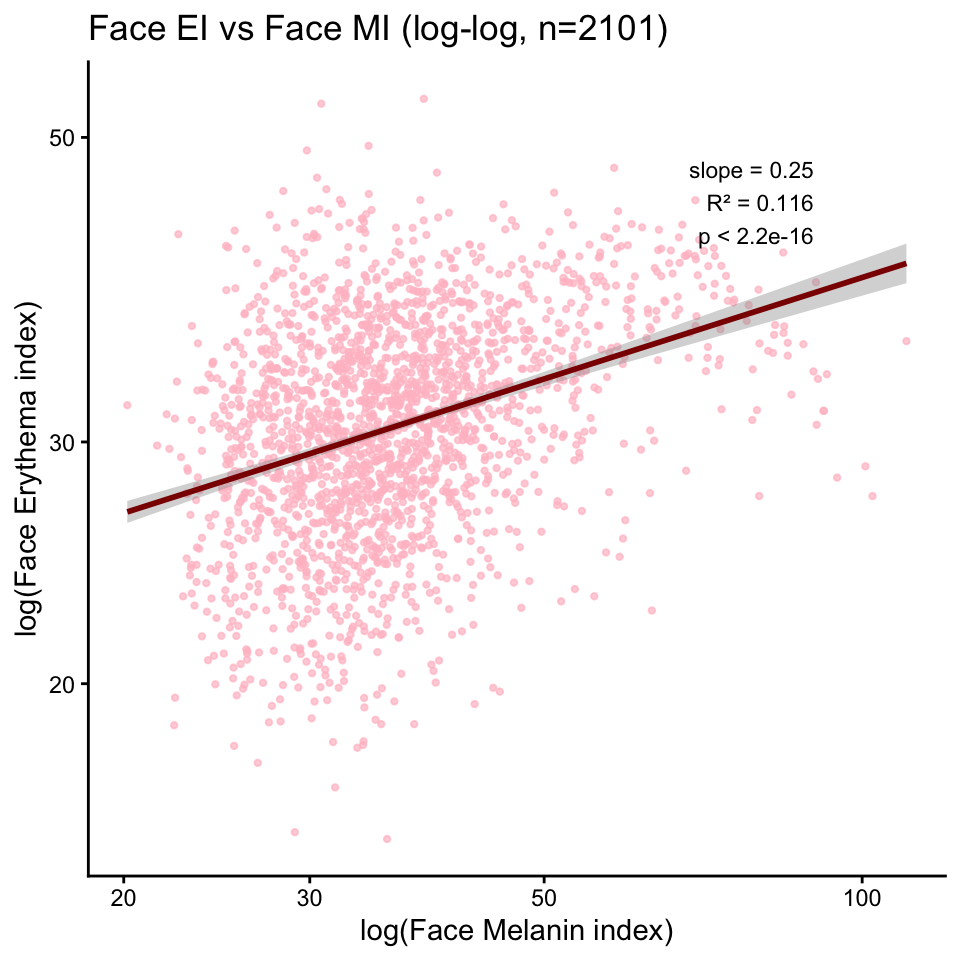
Palm erythema index vs face melanin index
=== Linear regression: palm_ei ~ face_mi ===
Call:
lm(formula = ei ~ face_mi, data = palm_spectrum)

Residuals:
     Min       1Q   Median       3Q      Max
-11.1036  -3.3381  -0.0785   2.9910  16.9668

Coefficients:
            Estimate Std. Error t value Pr(>|t|)
(Intercept) 18.59875    0.51007   36.46   <2e-16 ***
face_mi      0.19474    0.01283   15.18   <2e-16 ***
---
Signif. codes:  0 '***' 0.001 '**' 0.01 '*' 0.05 '.' 0.1 ' ' 1

Residual standard error: 4.689 on 774 degrees of freedom
Multiple R-squared:  0.2294,    Adjusted R-squared:  0.2284
F-statistic: 230.5 on 1 and 774 DF,  p-value: < 2.2e-16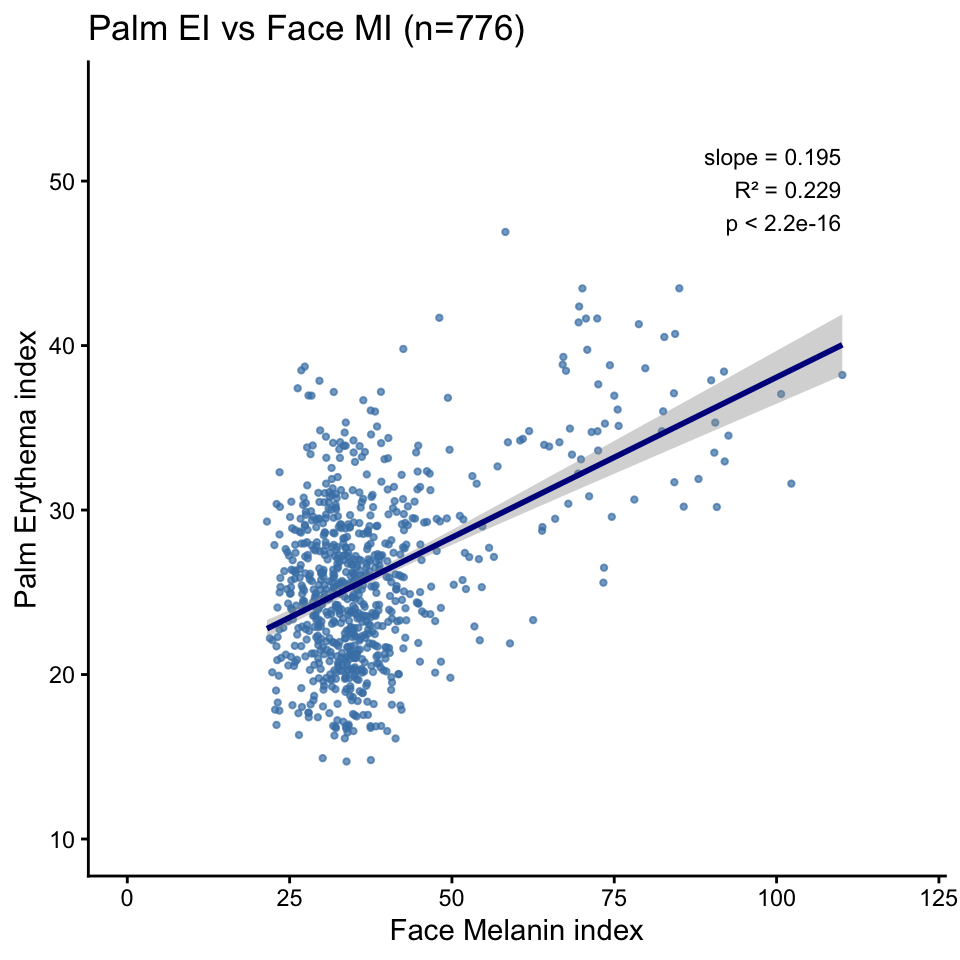
Log-transformed: Palm erythema index vs face melanin index
Log-log regression tests whether palm erythema index follows a power-law relationship with face melanin content. This cross-site comparison may reveal systemic hemoglobin patterns independent of local melanin.
=== Log-log regression: log(palm_ei) ~ log(face_mi) ===
Call:
lm(formula = log(ei) ~ log(face_mi), data = palm_spectrum %>%
    filter(ei > 0, face_mi > 0))

Residuals:
     Min       1Q   Median       3Q      Max
-0.55226 -0.12605  0.01504  0.12895  0.50267

Coefficients:
             Estimate Std. Error t value Pr(>|t|)
(Intercept)   2.17983    0.08561   25.46   <2e-16 ***
log(face_mi)  0.29439    0.02384   12.35   <2e-16 ***
---
Signif. codes:  0 '***' 0.001 '**' 0.01 '*' 0.05 '.' 0.1 ' ' 1

Residual standard error: 0.1854 on 774 degrees of freedom
Multiple R-squared:  0.1646,    Adjusted R-squared:  0.1635
F-statistic: 152.5 on 1 and 774 DF,  p-value: < 2.2e-16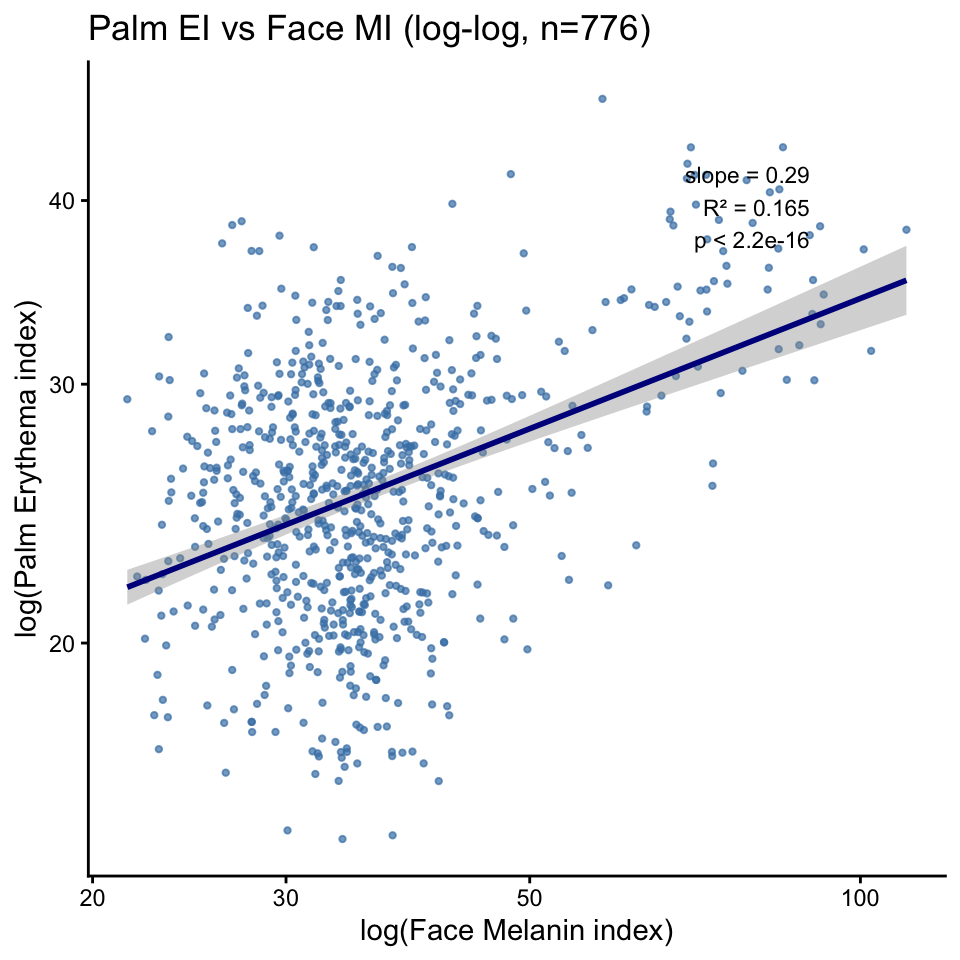
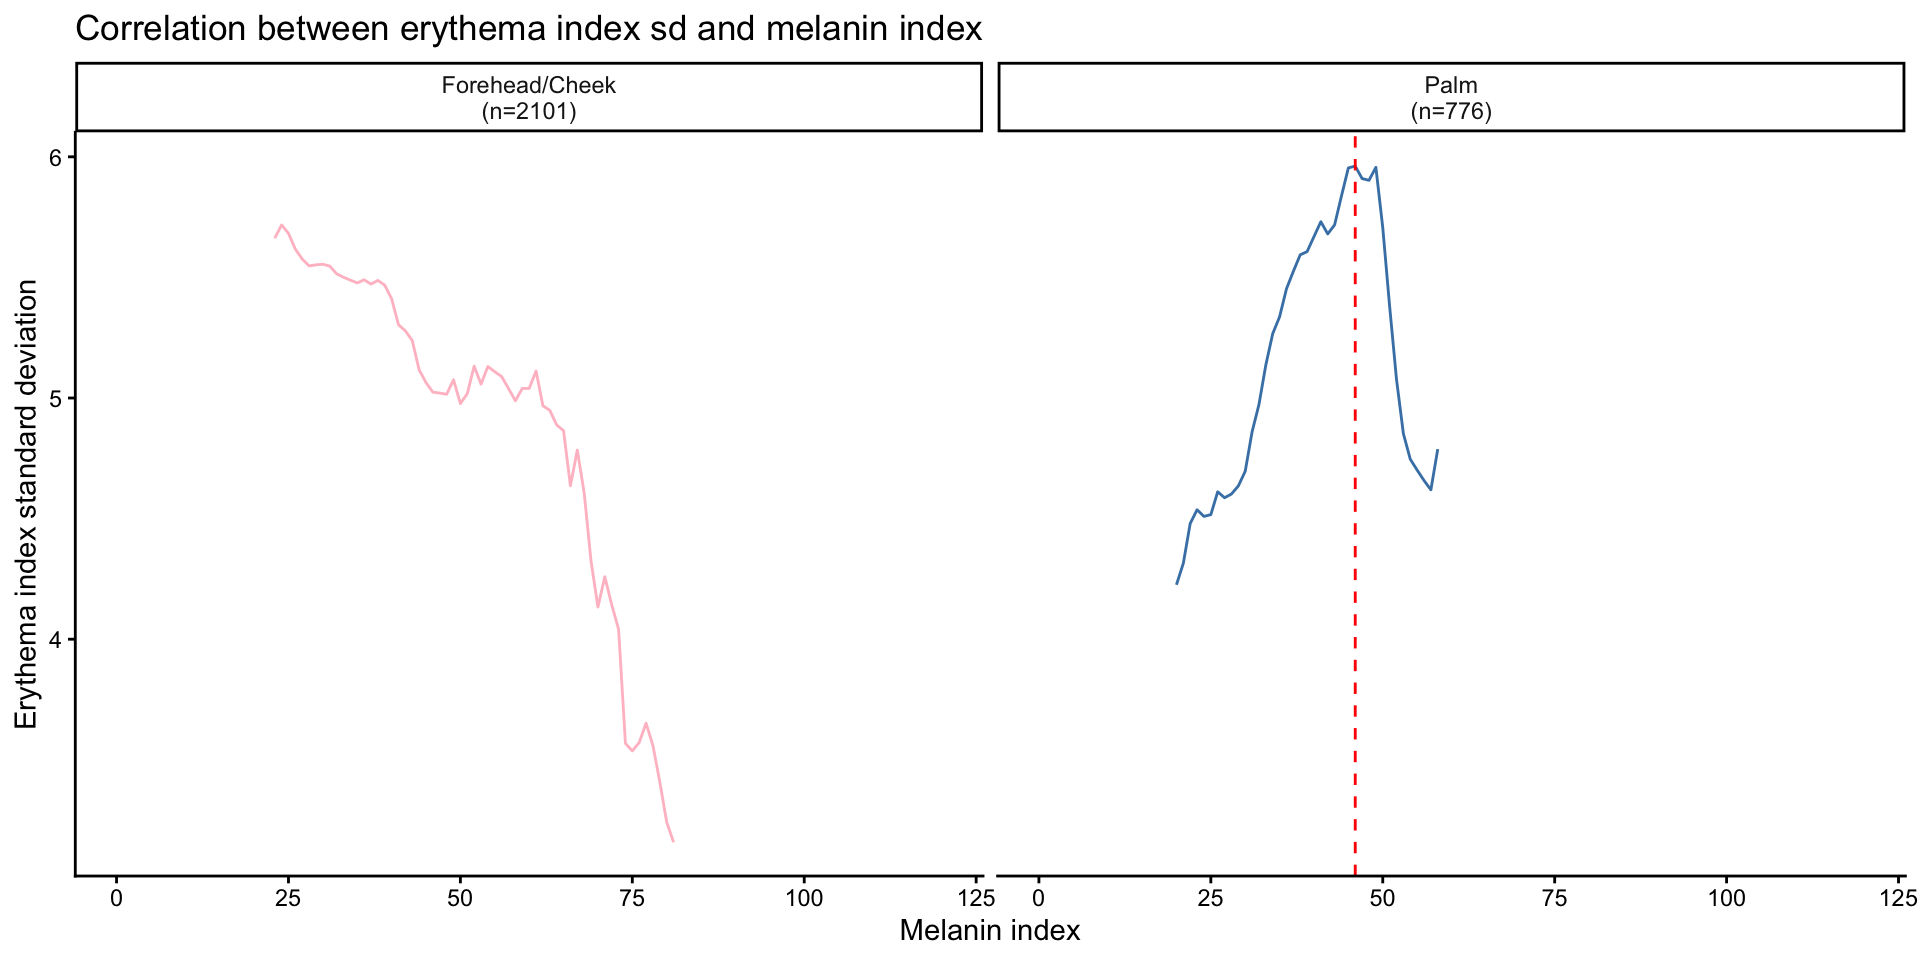
Correlation between erythema index variability and melanin index by site
- EI variability is measured by the standard deviation of EIs within a
sliding window of MI values. The window size is set to 20 MI units, and
the step size is 1 MI unit.
- For each center MI value in the sequence, all EI values corresponding to MI values within the window (center MI ± 10) are collected, and their standard deviation is computed.
- The center MI values range from the 1st to the 99th percentile of observed MI values.
R version 4.5.2 (2025-10-31)
Platform: aarch64-apple-darwin20
Running under: macOS Tahoe 26.1

Matrix products: default
BLAS:   /System/Library/Frameworks/Accelerate.framework/Versions/A/Frameworks/vecLib.framework/Versions/A/libBLAS.dylib
LAPACK: /Library/Frameworks/R.framework/Versions/4.5-arm64/Resources/lib/libRlapack.dylib;  LAPACK version 3.12.1

locale:
[1] en_US.UTF-8/en_US.UTF-8/en_US.UTF-8/C/en_US.UTF-8/en_US.UTF-8

time zone: America/Detroit
tzcode source: internal

attached base packages:
[1] stats     graphics  grDevices utils     datasets  methods   base

other attached packages:
 [1] ggpubr_0.6.0       here_1.0.1         KernSmooth_2.23-26 openxlsx_4.2.8.1
 [5] scales_1.4.0       lubridate_1.9.4    forcats_1.0.0      stringr_1.5.1
 [9] dplyr_1.1.4        purrr_1.0.4        readr_2.1.5        tidyr_1.3.1
[13] tibble_3.2.1       ggplot2_4.0.1      tidyverse_2.0.0    knitr_1.50

loaded via a namespace (and not attached):
 [1] gtable_0.3.6       xfun_0.54          bslib_0.9.0        rstatix_0.7.2
 [5] lattice_0.22-7     tzdb_0.5.0         vctrs_0.6.5        tools_4.5.2
 [9] generics_0.1.4     pkgconfig_2.0.3    Matrix_1.7-4       RColorBrewer_1.1-3
[13] S7_0.2.0           lifecycle_1.0.4    compiler_4.5.2     farver_2.1.2
[17] git2r_0.36.2       textshaping_1.0.1  codetools_0.2-20   carData_3.0-5
[21] httpuv_1.6.16      htmltools_0.5.8.1  sass_0.4.10        yaml_2.3.10
[25] Formula_1.2-5      later_1.4.2        pillar_1.10.2      car_3.1-3
[29] jquerylib_0.1.4    whisker_0.4.1      cachem_1.1.0       abind_1.4-8
[33] nlme_3.1-168       tidyselect_1.2.1   zip_2.3.3          digest_0.6.37
[37] stringi_1.8.7      splines_4.5.2      labeling_0.4.3     cowplot_1.1.3
[41] rprojroot_2.0.4    fastmap_1.2.0      grid_4.5.2         cli_3.6.5
[45] magrittr_2.0.3     utf8_1.2.5         dichromat_2.0-0.1  broom_1.0.8
[49] withr_3.0.2        promises_1.3.3     backports_1.5.0    timechange_0.3.0
[53] rmarkdown_2.29     gridExtra_2.3      ggsignif_0.6.4     workflowr_1.7.1
[57] ragg_1.4.0         hms_1.1.3          evaluate_1.0.3     viridisLite_0.4.2
[61] mgcv_1.9-3         rlang_1.1.6        Rcpp_1.1.0         glue_1.8.0
[65] jsonlite_2.0.0     R6_2.6.1           systemfonts_1.3.1  fs_1.6.6