Community Buildings
Dinela & Emma
03/30/26
Last updated: 2026-03-30
Checks: 6 1
Knit directory: dickinson_power/
This reproducible R Markdown analysis was created with workflowr (version 1.7.2). The Checks tab describes the reproducibility checks that were applied when the results were created. The Past versions tab lists the development history.
The R Markdown file has unstaged changes. To know which version of
the R Markdown file created these results, you’ll want to first commit
it to the Git repo. If you’re still working on the analysis, you can
ignore this warning. When you’re finished, you can run
wflow_publish to commit the R Markdown file and build the
HTML.
Great job! The global environment was empty. Objects defined in the global environment can affect the analysis in your R Markdown file in unknown ways. For reproduciblity it’s best to always run the code in an empty environment.
The command set.seed(20260107) was run prior to running
the code in the R Markdown file. Setting a seed ensures that any results
that rely on randomness, e.g. subsampling or permutations, are
reproducible.
Great job! Recording the operating system, R version, and package versions is critical for reproducibility.
Nice! There were no cached chunks for this analysis, so you can be confident that you successfully produced the results during this run.
Great job! Using relative paths to the files within your workflowr project makes it easier to run your code on other machines.
Great! You are using Git for version control. Tracking code development and connecting the code version to the results is critical for reproducibility.
The results in this page were generated with repository version 10db689. See the Past versions tab to see a history of the changes made to the R Markdown and HTML files.
Note that you need to be careful to ensure that all relevant files for
the analysis have been committed to Git prior to generating the results
(you can use wflow_publish or
wflow_git_commit). workflowr only checks the R Markdown
file, but you know if there are other scripts or data files that it
depends on. Below is the status of the Git repository when the results
were generated:
Ignored files:
    Ignored:    .DS_Store
    Ignored:    .Rhistory
    Ignored:    .Rproj.user/
    Ignored:    analysis/.DS_Store
    Ignored:    analysis/.Rhistory
    Ignored:    analysis_to-fix/.DS_Store
    Ignored:    data/.DS_Store
    Ignored:    data/FY25 Main Meter Data.xlsx
    Ignored:    data/building_list_FY25_updated.xlsx
    Ignored:    data/graph_data_life_exp.csv
    Ignored:    data/housing_counts.csv
    Ignored:    keys/.DS_Store
    Ignored:    output/annual_kwh.csv
    Ignored:    output/building_check.csv
    Ignored:    output/building_check.xlsx
    Ignored:    output/daily_kwh.csv
    Ignored:    output/kwh_academic_2026-03-16.csv
    Ignored:    output/kwh_academic_2026-03-17.csv
    Ignored:    output/kwh_academic_2026-03-18.csv
    Ignored:    output/kwh_academic_2026-03-22.csv
    Ignored:    output/kwh_academic_2026-03-23.csv
    Ignored:    output/kwh_academic_2026-03-25.csv
    Ignored:    output/kwh_academic_2026-03-30.csv
    Ignored:    output/kwh_annual.csv
    Ignored:    output/kwh_annual_2026-03-04.csv
    Ignored:    output/kwh_annual_2026-03-12.csv
    Ignored:    output/kwh_annual_2026-03-16.csv
    Ignored:    output/kwh_annual_2026-03-17.csv
    Ignored:    output/kwh_annual_2026-03-18.csv
    Ignored:    output/kwh_annual_2026-03-22.csv
    Ignored:    output/kwh_annual_2026-03-23.csv
    Ignored:    output/kwh_annual_2026-03-25.csv
    Ignored:    output/kwh_annual_2026-03-30.csv
    Ignored:    output/kwh_annual_20260225.csv
    Ignored:    output/kwh_annual_20260226.csv
    Ignored:    output/kwh_daily.csv
    Ignored:    output/kwh_daily_2026-03-04.csv
    Ignored:    output/kwh_daily_2026-03-12.csv
    Ignored:    output/kwh_daily_2026-03-16.csv
    Ignored:    output/kwh_daily_2026-03-17.csv
    Ignored:    output/kwh_daily_2026-03-18.csv
    Ignored:    output/kwh_daily_2026-03-22.csv
    Ignored:    output/kwh_daily_2026-03-23.csv
    Ignored:    output/kwh_daily_2026-03-25.csv
    Ignored:    output/kwh_daily_2026-03-30.csv
    Ignored:    output/kwh_daily_20260225.csv
    Ignored:    output/kwh_daily_20260226.csv
    Ignored:    output/kwh_main_annual.csv
    Ignored:    output/kwh_main_daily.csv

Unstaged changes:
    Modified:   analysis/Report_I_Academic.Rmd
    Modified:   analysis/Report_I_Admin.rmd
    Modified:   analysis/Report_I_Community.Rmd
    Modified:   analysis/Report_I_Medium.Rmd
    Modified:   analysis/Report_I_Other.Rmd
    Modified:   analysis/Report_I_Residential-L.Rmd
    Modified:   analysis/Report_I_Small_Residence_Halls.Rmd
    Modified:   analysis/_site.yml
    Modified:   analysis/main_meter_anova.Rmd
    Modified:   analysis/main_meter_regression.Rmd
Note that any generated files, e.g. HTML, png, CSS, etc., are not included in this status report because it is ok for generated content to have uncommitted changes.
These are the previous versions of the repository in which changes were
made to the R Markdown (analysis/Report_I_Community.Rmd)
and HTML (docs/Report_I_Community.html) files. If you’ve
configured a remote Git repository (see ?wflow_git_remote),
click on the hyperlinks in the table below to view the files as they
were in that past version.
| File | Version | Author | Date | Message |
|---|---|---|---|---|
| Rmd | 10db689 | maggiedouglas | 2026-03-30 | change navigation bar and add student report sections |
Background
There are 10 buildings within the Community Building group that are used for a wide variety of functions including private residency, dining services, daycare, social space, and healthcare. The Community Buildings take up a relatively significant amount of space on the Dickinson campus as the category includes larger buildings like the Holland Union Building (HUB) in addition to smaller buildings like Landis House that have a difference of about 100,000 square feet.
This drastic difference in square footage is consistent within the community group alongside other features such as differences in age and cooling. Allison Hall is the only building in the community group that utilizes window units for cooling and is also among the oldest of the buildings in the group, being constructed in 1958 with no renovations since then. The Quarry was built in 1899 but was renovated in 2000, about the same time the Kline Center Annex was built in 1998. The variety in usage, air conditioning, size, and age in the community group makes it particularly difficult to define the parameters that make up a “community” building, thus rendering some buildings incomparable to one another.
The data for the Community Buildings group is not complete as there are four buildings on the main meter: The HUB, The Quarry, ATS, and the Kline Center Annex. The HUB and The Quarry also contain disaggregated meters that provide some data. Two buildings, The Asbell Center and the Historic President’s House are on the Weis Meter, and so they are also lacking data.
Electricity Use Summary
Table 1
datatable(community_kwh_annual,
          caption="Table 1. Total electricity use, estimated financial cost, and estimated greenhouse gas emissions of Community buildings during fiscal year 2025.",
          colnames=c("Meter","Building","Days of Data (%)","kWh","kWh (corrected)","Square Footage","kWh per sqft","Cost($)","CO2e(MT)"),
          rownames=FALSE,
          class="compact",
          options = list(autoWidth = TRUE, dom = 't'))
# Allison Hall had the highest kWh usage in the fiscal year 2025 and the highest electricity intensity of the buildings in the community group despite not being the smallest building in the group.
# The smallest building, Landis House, had the least kWh usage and the lowest electricity intensity. Landis house also released the least CO2 emissions and cost the least to power throughout the fiscal year 2025.
# Allison Hall is over 20,000 square feet larger than The Quarry and the largest building in the community building group. Yet, The Quarry used only ~2000 less kWh than Allison Hall and also has a similar electricity intensity and cost to power.
# Despite using the most kWh, Allison Hall released the second least CO2 emissions, with Landis House releasing the least CO2. On the other hand, The Quarry released the most CO2 emissions in the fiscal year 2025, nearly 4 times the amount as Allison Hall.
# The Quarry cost about $22k to power in 2025, a little less than double the amount it took to power the DCCC ($12k) which has a square footage ~4,000 sqft larger than The Quarry.Table 2
datatable(community_kwh_academicYr,
          caption="Table 2. Total electricity use, estimated financial cost, and estimated greenhouse gas emissions of Community buildings during academic year 2024/2025.",
          colnames=c("Meter","Building","Days of Data (%)","kWh","kWh (corrected)","Square Footage","kWh per sqft","Cost($)","CO2e(MT)"),
          rownames=FALSE,
          class="compact",
          options = list(autoWidth = TRUE, dom = 't'))
# Despite having less square footage, The Quarry used between ~11-12,000 more kWh than the largest building, Allison Hall, when limited to the 2024/2025 academic year.
# When limited to the 2024/2025 academic year, The Quarry overtook Allison Hall as the most electricity intensive building in the community group in addition to becoming the most expensive.
# The Quarry remains the building that releases the most CO2 emissions in the community group during the 2024/2025 academic year.
# With the exception of The Quarry, the buildings in the community group are less electricity intensive per square foot per year than other buildings at different colleges and universities across the United States as described by the Energy Information Administration (EIA) report.
# The President's House (New) can be described as having nearly double the kWh usage, electricity intensity, cost, and CO2 emissions than Landis House. However, this would be an unfair comparison considering that The President's House (New) is a building used for full-time residence by the Dickinson President and his wife whereas Landis House is not always occupied and certainly not a residential space. Figure 1
#create bar plot
ggplot(comm_dailyfix, aes(x = month, y = kwh, fill=NAME)) +
  geom_bar(stat = "identity") +
  facet_wrap(.~NAME)+
  scale_fill_paletteer_d("ggthemes::Tableau_20")+
  theme_bw()+
  theme(legend.position = "none")+
  theme(axis.text.x = element_text(angle = 90, vjust = 0.5, hjust = 1))+
  labs(x="",
       y="Electricity use (kWh)",
       title = "Figure 1. Monthly patterns in electricity use by building for Community
Buildings in FY25")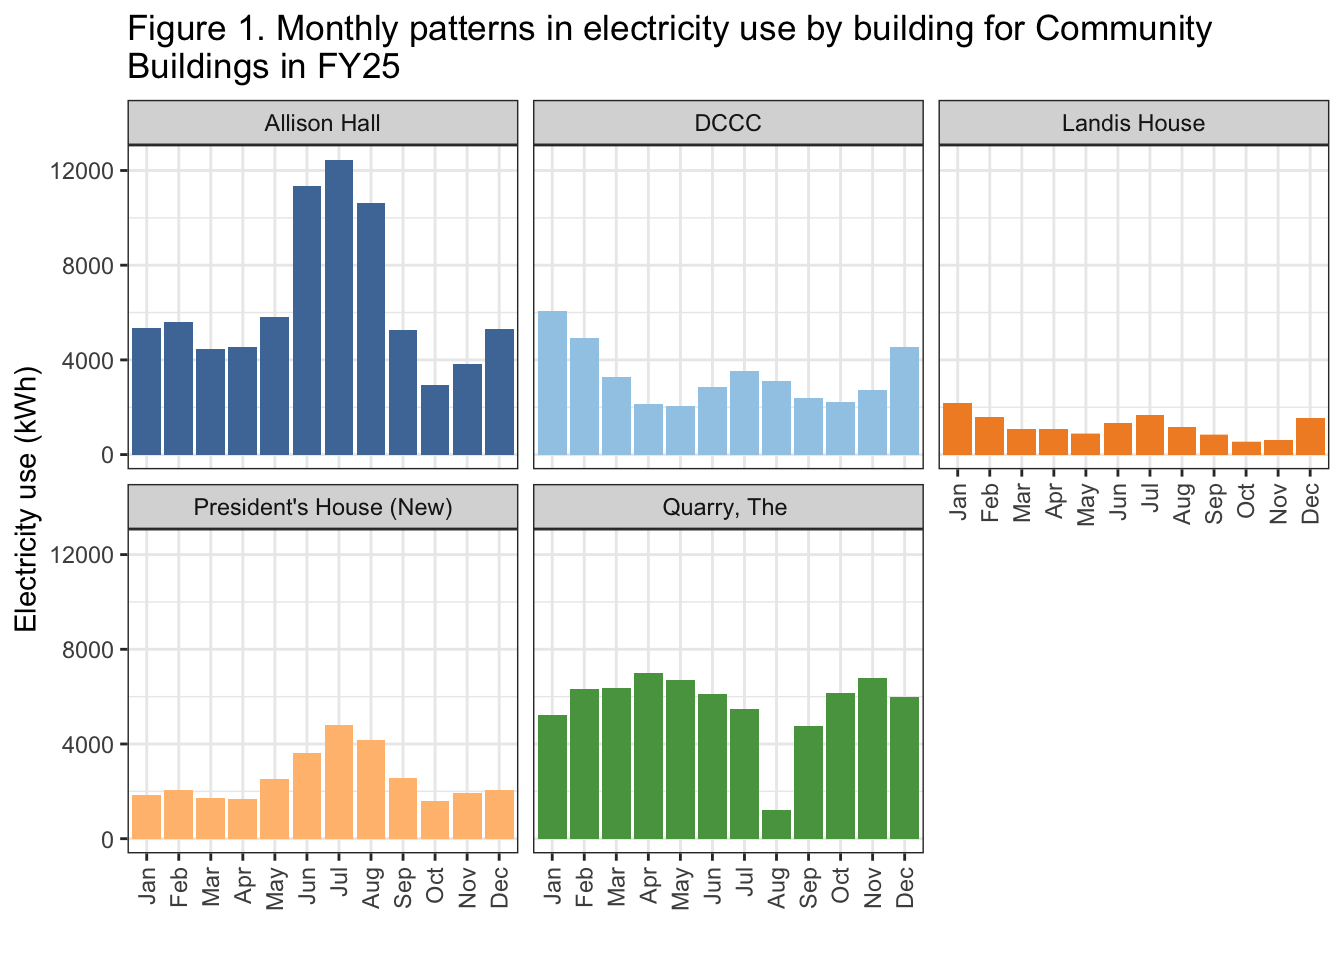
# "Allison Hall", "Quarry, The", and "DCCC" (Dickinson College Children's Center) show the highest total electricity use over the course of the year.

# "Landis House" and the "President's House (New)" show the lowest total electricity use over the course of the year.

# There is a relatively similar, shared pattern in total electricity use over the year for all buildings but the Quarry. These three buildings show peaks in electricity use during the winter and summer months, and dips during the transitional spring and fall months (though the relative size of the peaks and dips each season varies with each building). "Quarry, The", on the other hand, shows overall high electricity use throughout the year, with slight peaks in April and November, and a sharp and sudden drop in August.
Figure 2
#Create boxplot
ggplot(comm_dailyfix, aes(x = reorder(NAME, kwh_sqft_yr), y = kwh_sqft_yr, fill = NAME))+
  annotate("rect", xmin = -Inf, xmax = Inf, ymin = 7.4, ymax = 14.3, color = "lightgray", alpha = 0.3) +
geom_hline(yintercept = 10.3, linetype = "dashed", color = "white") +
  geom_boxplot()+
  coord_flip()+
  facet_wrap(.~period)+
  theme_bw()+
  theme(legend.position = "none")+
  scale_fill_paletteer_d("ggthemes::Tableau_20")+
  labs(x = "",
       y = "Electricity Intensity (kWh/sqft/yr)",
       title = "Figure 2. Electricity intensity by building for Community
buildings in FY25")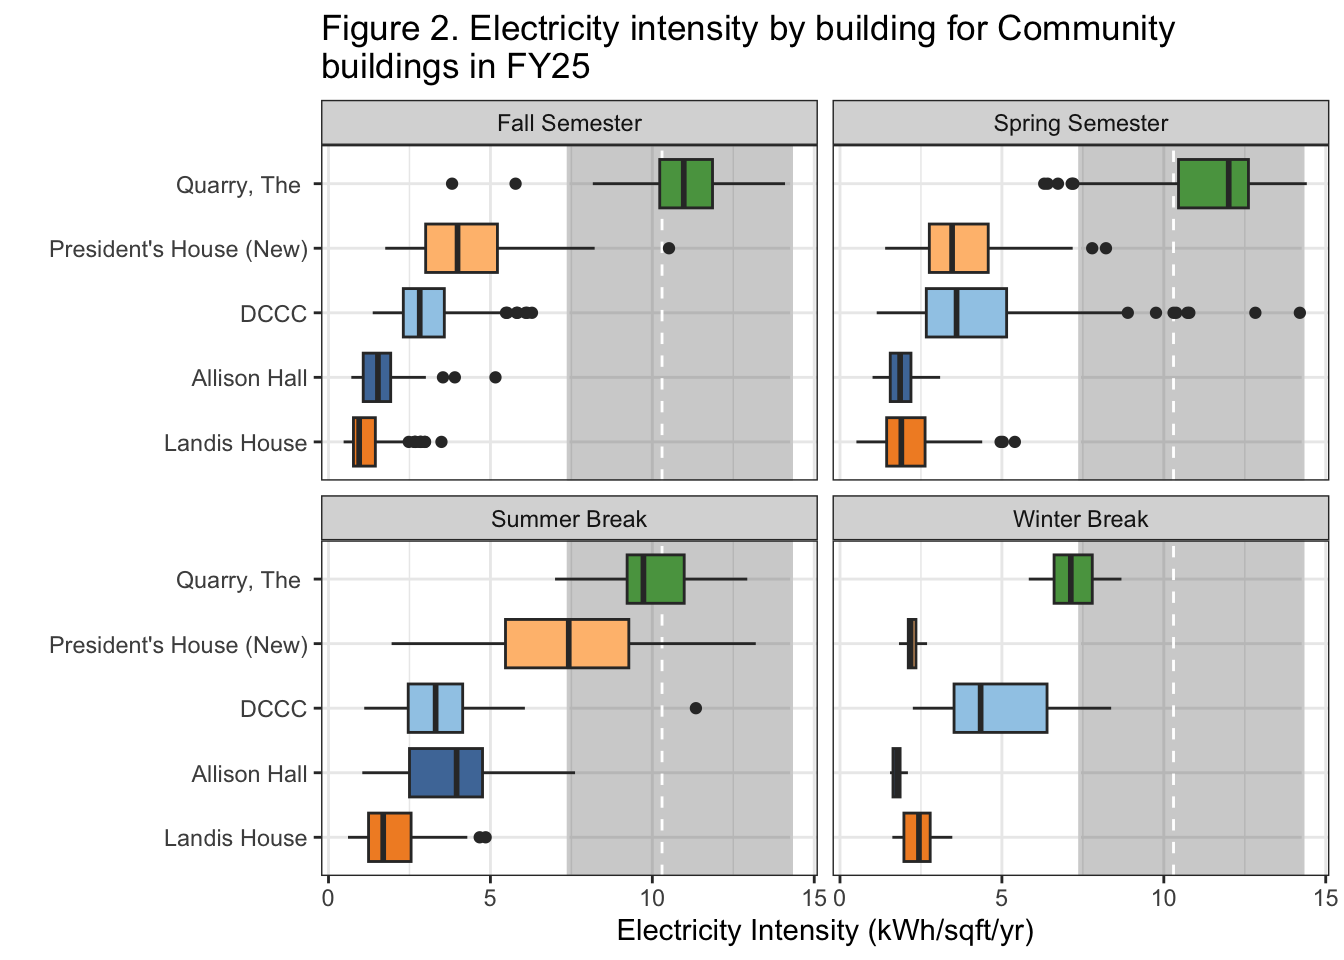
# "Quarry, The" shows the highest electricity intensity in kwh/sqft/yr of all the buildings in our category.

# "Landis House" shows the lowest electricity intensity in kwh/sqft/yr of all the buildings in our category.

# The Electricity intensity (kWh/sqft/yr) of the "Quarry, The" ranks higher than the average values for colleges and universities as listed by the EIA for all points of the year except for Winter Break.

# The "President's House (New) and "Allion Hall" show significant variability in electricity intensity at different points in the year. The Fall and Spring semesters seem to plot relatively the same for the "President's House (New)" and "Allison Hall", while the summer shows a decent increase in electricity use (in median and spread of data) and the winter shows a significant decrease (in both median and spread).

# "DCCC" remains roughly the same throughout the year, plotting slightly larger in the Spring Semester and over Winter Break compared to Fall Semester and Summer Break.

# "Landis House" plots consistently the lowest electricity intensity throughout the year and remains relatively the same between the Fall and Spring Semesters, as well as Summer and Winter Breaks.
Discussion
Given that there is a decent variety in the uses for each of these buildings (as highlighted at our first ‘stakeholder presentation’) for this particular dataset, we recommend that further attention be given to the “community” category prior to moving any further with major parts of our analysis.
Further, we recommend adjusting the criteria of what makes a building a “community” building; while there seems to be points of interest in our data, it is hard to responsibly draw real, meaningful conclusions when we are essentially comparing apples to oranges. Although we can clearly see that the building “Quarry, The” (otherwise known as “Denim Coffee”, or “the Quarry”) stands far above the other buildings in this category in terms of both total electricity use AND electricity intensity, (AND that it even surpasses the listed EIA average electricity intensity for college and university buildings), we cannot reasonably compare the results of this building to, for example, the second largest consumer in our category, the “President’s House (New)” because their uses are so different. Although we can see there may be something meaningful in our data, we cannot responsibly draw conclusions that will truly reveal anything meaningful to CSE. Thus, we recommend refining this category prior to moving forward with our examination so we can provide the most accurate and meaningful analysis of that data to CSE.
Sources
Energy Information Administration (EIA). (2022). 2018 Commercial Buildings Energy Consumption Survey (CBECS). https://www.eia.gov/consumption/commercial/
Leary, N. (2025). Dickinson College Greenhouse Gas Inventory 2008-2023. Center for Sustainability Education.
Partner Contributions
I, Dinela worked on wrangling the annual and academic year data in addition to creating the two data tables. I also completed the Background section of the report and the integrated text explaining key take-aways within the tables.
I, Emma Keane, contributed to this work by providing the code for Figures 1 & 2 (as well as providing integrated text explaining key take-aways within ggplot code chunks), and writing up the Recommendations Section.
No AI was used in writing code, notes, or recommendations.
sessionInfo()R version 4.5.2 (2025-10-31)
Platform: x86_64-apple-darwin20
Running under: macOS Ventura 13.7.8
Matrix products: default
BLAS: /Library/Frameworks/R.framework/Versions/4.5-x86_64/Resources/lib/libRblas.0.dylib
LAPACK: /Library/Frameworks/R.framework/Versions/4.5-x86_64/Resources/lib/libRlapack.dylib; LAPACK version 3.12.1
locale:
[1] en_US.UTF-8/en_US.UTF-8/en_US.UTF-8/C/en_US.UTF-8/en_US.UTF-8
time zone: America/New_York
tzcode source: internal
attached base packages:
[1] stats graphics grDevices utils datasets methods base
other attached packages:
[1] paletteer_1.7.0 DT_0.34.0 lubridate_1.9.5 forcats_1.0.1
[5] stringr_1.6.0 dplyr_1.2.0 purrr_1.2.1 readr_2.2.0
[9] tidyr_1.3.2 tibble_3.3.1 ggplot2_4.0.2 tidyverse_2.0.0
loaded via a namespace (and not attached):
[1] sass_0.4.10 generics_0.1.4 prismatic_1.1.2 stringi_1.8.7
[5] hms_1.1.4 digest_0.6.39 magrittr_2.0.4 timechange_0.4.0
[9] evaluate_1.0.5 grid_4.5.2 RColorBrewer_1.1-3 fastmap_1.2.0
[13] rprojroot_2.1.1 workflowr_1.7.2 jsonlite_2.0.0 whisker_0.4.1
[17] rematch2_2.1.2 promises_1.5.0 crosstalk_1.2.2 scales_1.4.0
[21] jquerylib_0.1.4 cli_3.6.5 rlang_1.1.7 withr_3.0.2
[25] cachem_1.1.0 yaml_2.3.12 otel_0.2.0 tools_4.5.2
[29] tzdb_0.5.0 httpuv_1.6.16 vctrs_0.7.1 R6_2.6.1
[33] lifecycle_1.0.5 git2r_0.36.2 htmlwidgets_1.6.4 fs_1.6.7
[37] pkgconfig_2.0.3 pillar_1.11.1 bslib_0.10.0 later_1.4.8
[41] gtable_0.3.6 glue_1.8.0 Rcpp_1.1.1 xfun_0.56
[45] tidyselect_1.2.1 rstudioapi_0.18.0 knitr_1.51 farver_2.1.2
[49] htmltools_0.5.9 labeling_0.4.3 rmarkdown_2.30 compiler_4.5.2
[53] S7_0.2.1