Merge samples
Mechthild Lütge
14 May 2020
Last updated: 2022-05-02
Checks: 6 1
Knit directory: humanCardiacFibroblasts/
This reproducible R Markdown analysis was created with workflowr (version 1.7.0). The Checks tab describes the reproducibility checks that were applied when the results were created. The Past versions tab lists the development history.
The R Markdown is untracked by Git. To know which version of the R Markdown file created these results, you’ll want to first commit it to the Git repo. If you’re still working on the analysis, you can ignore this warning. When you’re finished, you can run wflow_publish to commit the R Markdown file and build the HTML.
Great job! The global environment was empty. Objects defined in the global environment can affect the analysis in your R Markdown file in unknown ways. For reproduciblity it’s best to always run the code in an empty environment.
The command set.seed(20210903) was run prior to running the code in the R Markdown file. Setting a seed ensures that any results that rely on randomness, e.g. subsampling or permutations, are reproducible.
Great job! Recording the operating system, R version, and package versions is critical for reproducibility.
Nice! There were no cached chunks for this analysis, so you can be confident that you successfully produced the results during this run.
Great job! Using relative paths to the files within your workflowr project makes it easier to run your code on other machines.
Great! You are using Git for version control. Tracking code development and connecting the code version to the results is critical for reproducibility.
The results in this page were generated with repository version 004eedd. See the Past versions tab to see a history of the changes made to the R Markdown and HTML files.
Note that you need to be careful to ensure that all relevant files for the analysis have been committed to Git prior to generating the results (you can use wflow_publish or wflow_git_commit). workflowr only checks the R Markdown file, but you know if there are other scripts or data files that it depends on. Below is the status of the Git repository when the results were generated:
Ignored files:
    Ignored:    .DS_Store
    Ignored:    .Rhistory
    Ignored:    .Rproj.user/
    Ignored:    data/humanFibroblast/

Untracked files:
    Untracked:  analysis/Vis_plus_analyse_NormlaHFMyo.Rmd
    Untracked:  analysis/Vis_plus_analyse_NormlaHFMyo_woECMO4.Rmd
Note that any generated files, e.g. HTML, png, CSS, etc., are not included in this status report because it is ok for generated content to have uncommitted changes.
There are no past versions. Publish this analysis with wflow_publish() to start tracking its development.
load packages
suppressPackageStartupMessages({
  library(SingleCellExperiment)
  library(tidyverse)
  library(Seurat)
  library(magrittr)
  library(dplyr)
  library(purrr)
  library(ggplot2)
  library(here)
  library(runSeurat3)
  library(ggsci)
  library(ggpubr)
  library(pheatmap)
  library(viridis)
})
sign plot funct
## adapted from CellMixS
visGroup_adapt <- function (sce,group,dim_red = "TSNE",col_group=pal_nejm()(8))
{
    if (!is(sce, "SingleCellExperiment")) {
        stop("Error:'sce' must be a 'SingleCellExperiment' object.")
    }
    if (!group %in% names(colData(sce))) {
        stop("Error: 'group' variable must be in 'colData(sce)'")
    }
    cell_names <- colnames(sce)
    if (!dim_red %in% "TSNE") {
        if (!dim_red %in% reducedDimNames(sce)) {
            stop("Please provide a dim_red method listed in reducedDims of sce")
        }
        red_dim <- as.data.frame(reducedDim(sce, dim_red))
    }
    else {
        if (!"TSNE" %in% reducedDimNames(sce)) {
            if ("logcounts" %in% names(assays(sce))) {
                sce <- runTSNE(sce)
            }
            else {
                sce <- runTSNE(sce, exprs_values = "counts")
            }
        }
        red_dim <- as.data.frame(reducedDim(sce, "TSNE"))
    }
    colnames(red_dim) <- c("red_dim1", "red_dim2")
    df <- data.frame(sample_id = cell_names, group_var = colData(sce)[,
        group], red_Dim1 = red_dim$red_dim1, red_Dim2 = red_dim$red_dim2)
    t <- ggplot(df, aes_string(x = "red_Dim1", y = "red_Dim2")) +
        xlab(paste0(dim_red, "_1")) + ylab(paste0(dim_red, "_2")) +
        theme_void() + theme(aspect.ratio = 1,
                             panel.grid.minor = element_blank(),
        panel.grid.major = element_line(color = "grey", size = 0.3))
    t_group <- t + geom_point(size = 1.5, alpha = 0.8,
                              aes_string(color = "group_var")) +
        guides(color = guide_legend(override.aes = list(size = 1),
            title = group)) + ggtitle(group)
    if (is.numeric(df$group_var)) {
        t_group <- t_group + scale_color_viridis(option = "D")
    }
    else {
        t_group <- t_group + scale_color_manual(values = col_group)
    }
    t_group
}
set dir
basedir <- here()
seurat <- readRDS(file = paste0(basedir,
                              "/data/humanHearts_merged_seurat.rds"))
seurat$ID[which(seurat$ID == "ID23_25")] <- "ID2325"

## subset on sel patients
selPat <- c("ID2325", "ID28", "ID30", "ID31", "ID21", "ID26")
seurat <- subset(seurat, ID %in% selPat)
seurat <- rerunSeurat3(seurat)
Modularity Optimizer version 1.3.0 by Ludo Waltman and Nees Jan van Eck
Number of nodes: 6877
Number of edges: 250752
Running Louvain algorithm...
Maximum modularity in 10 random starts: 0.9574
Number of communities: 14
Elapsed time: 0 seconds
Modularity Optimizer version 1.3.0 by Ludo Waltman and Nees Jan van Eck
Number of nodes: 6877
Number of edges: 250752
Running Louvain algorithm...
Maximum modularity in 10 random starts: 0.9176
Number of communities: 16
Elapsed time: 0 seconds
Modularity Optimizer version 1.3.0 by Ludo Waltman and Nees Jan van Eck
Number of nodes: 6877
Number of edges: 250752
Running Louvain algorithm...
Maximum modularity in 10 random starts: 0.8978
Number of communities: 20
Elapsed time: 0 seconds
Modularity Optimizer version 1.3.0 by Ludo Waltman and Nees Jan van Eck
Number of nodes: 6877
Number of edges: 250752
Running Louvain algorithm...
Maximum modularity in 10 random starts: 0.9397
Number of communities: 15
Elapsed time: 0 secondsseurat$grp <- "normal"
seurat$grp[which(seurat$ID %in% c("ID21", "ID26"))] <- "HF"
seurat$grp[which(seurat$ID %in% c("ID30", "ID31"))] <- "Myocarditis"
Idents(seurat) <- seurat$RNA_snn_res.0.25color vectors
colPal <- pal_igv()(length(levels(seurat)))
colTec <- pal_jama()(length(unique(seurat$technique)))
colSmp <- c(pal_uchicago()(8), pal_npg()(8), pal_aaas()(10))[1:length(unique(seurat$dataset))]
colLoc <- pal_npg()(length(unique(seurat$location)))
colBatch <- c(pal_jco()(10), pal_npg()(10))[1:length(unique(seurat$ID))]
colOrig <- pal_futurama()(length(unique(seurat$origin)))
colIso <- pal_nejm()(length(unique(seurat$isolation)))
colGrp <- c("#b6bcbb", "#a32d25", "#2544a3")


names(colPal) <- levels(seurat)
names(colTec) <- unique(seurat$technique)
names(colSmp) <- unique(seurat$dataset)
names(colLoc) <- unique(seurat$location)
names(colBatch) <- unique(seurat$ID)
names(colOrig) <- unique(seurat$origin)
names(colIso) <- unique(seurat$isolation)
names(colGrp) <- c("normal", "Myocarditis", "HF")
vis data
clusters
DimPlot(seurat, reduction = "umap", cols=colPal)+
  theme_bw() +
  theme(axis.text = element_blank(), axis.ticks = element_blank(),
        panel.grid.minor = element_blank()) +
  xlab("UMAP1") +
  ylab("UMAP2")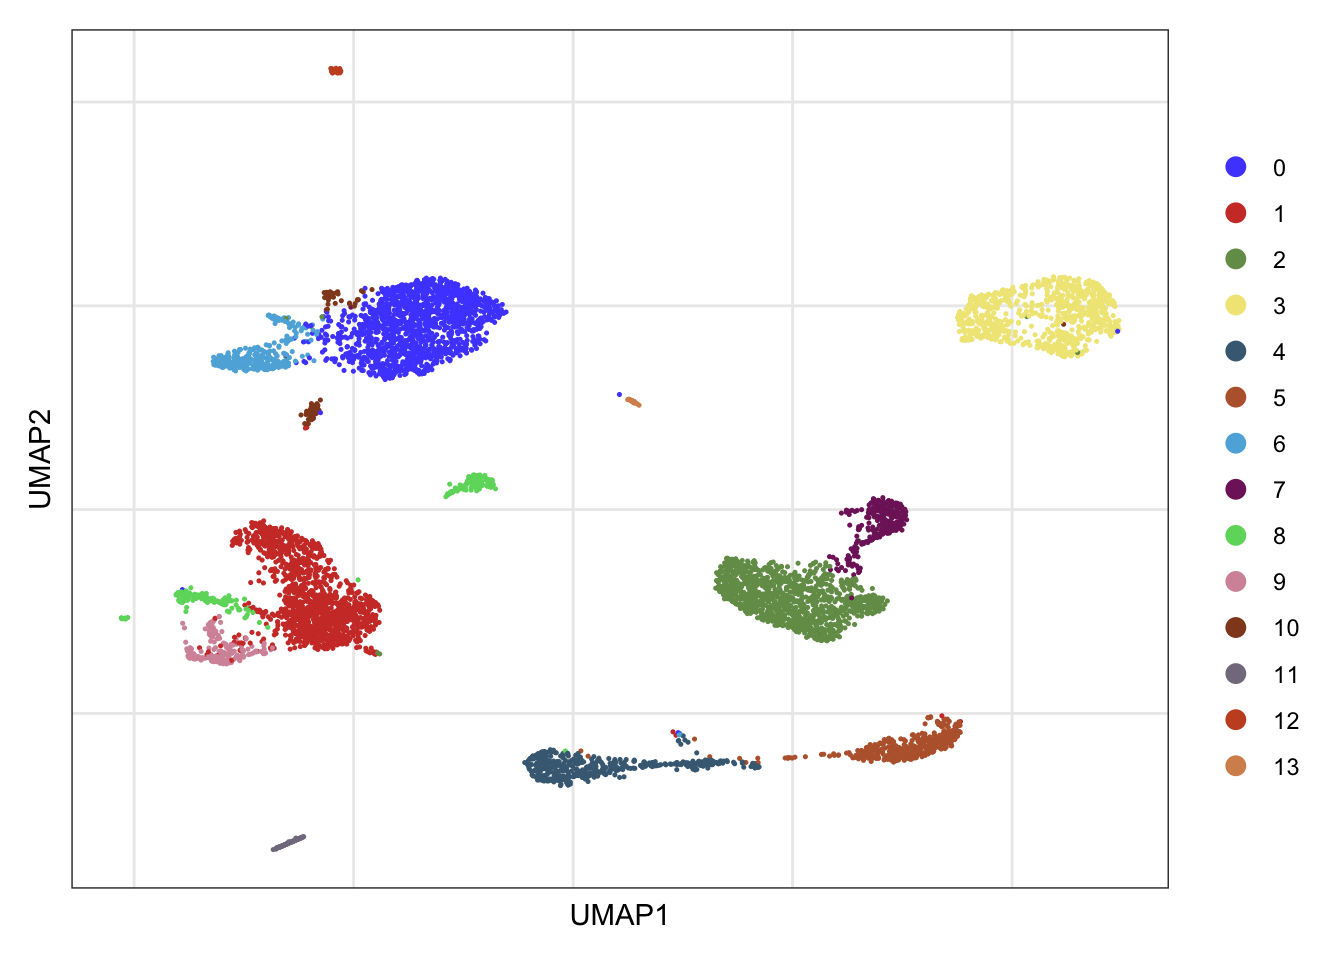
DimPlot(seurat, reduction = "umap", cols=colPal,
        pt.size=0.6)+
  theme_void()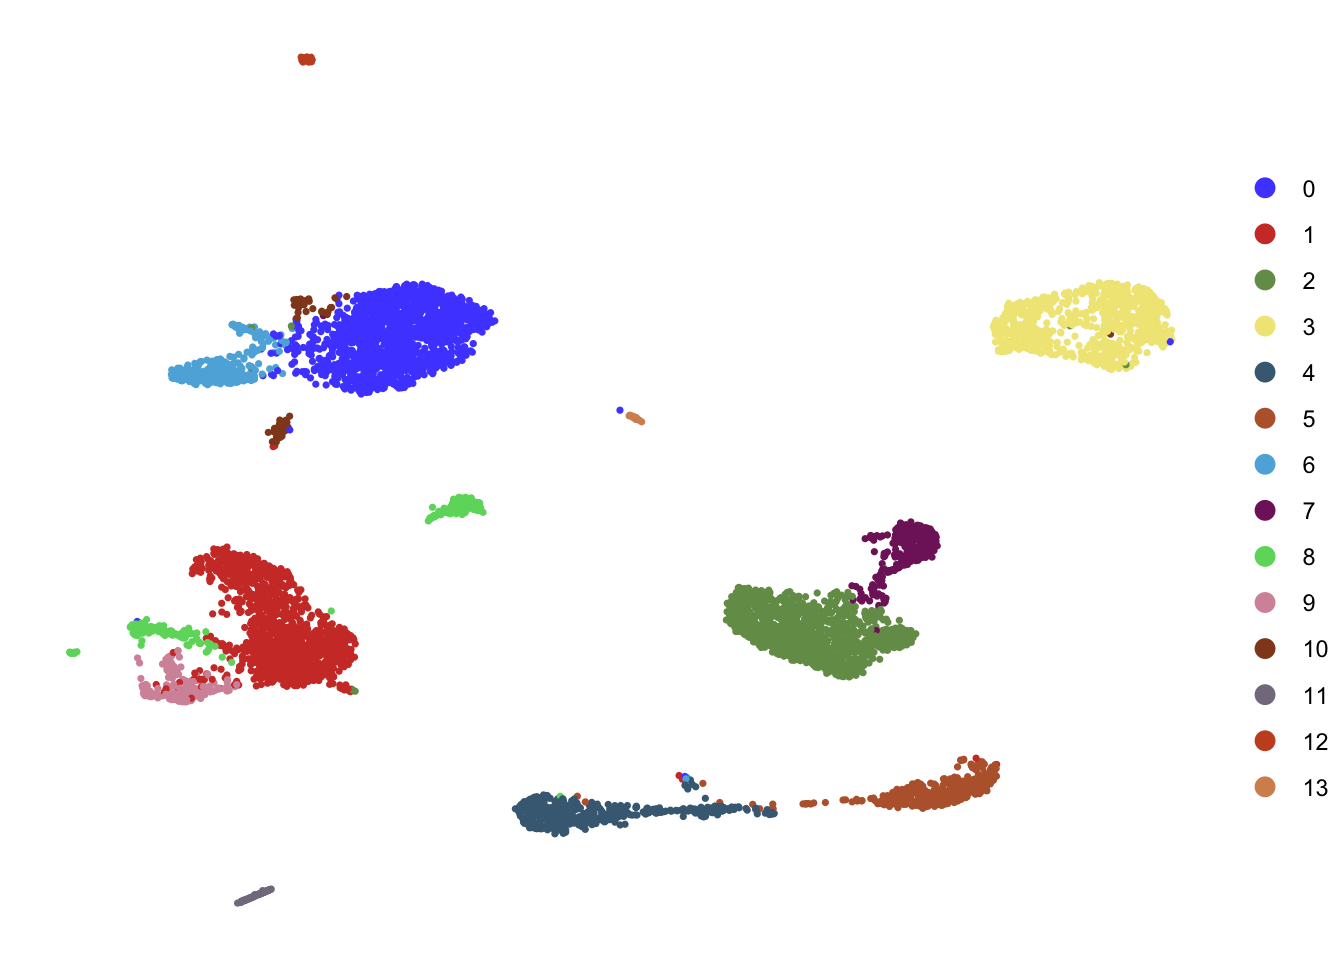
technique
DimPlot(seurat, reduction = "umap", group.by = "technique", cols=colTec)+
  theme_bw() +
  theme(axis.text = element_blank(), axis.ticks = element_blank(),
        panel.grid.minor = element_blank()) +
  xlab("UMAP1") +
  ylab("UMAP2")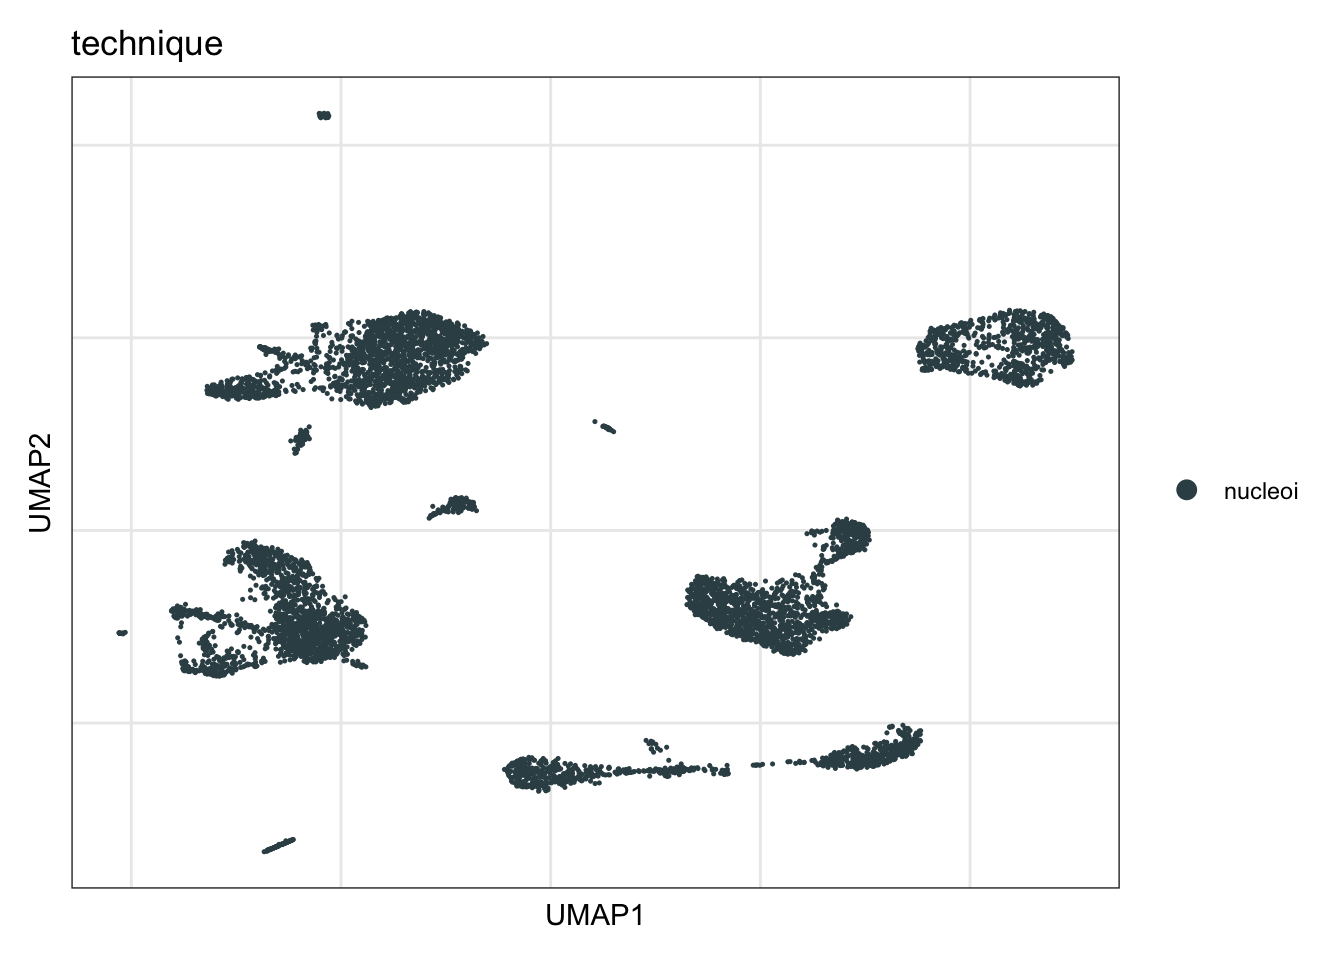
Sample
DimPlot(seurat, reduction = "umap", group.by = "dataset", cols=colSmp)+
  theme_bw() +
  theme(axis.text = element_blank(), axis.ticks = element_blank(),
        panel.grid.minor = element_blank()) +
  xlab("UMAP1") +
  ylab("UMAP2")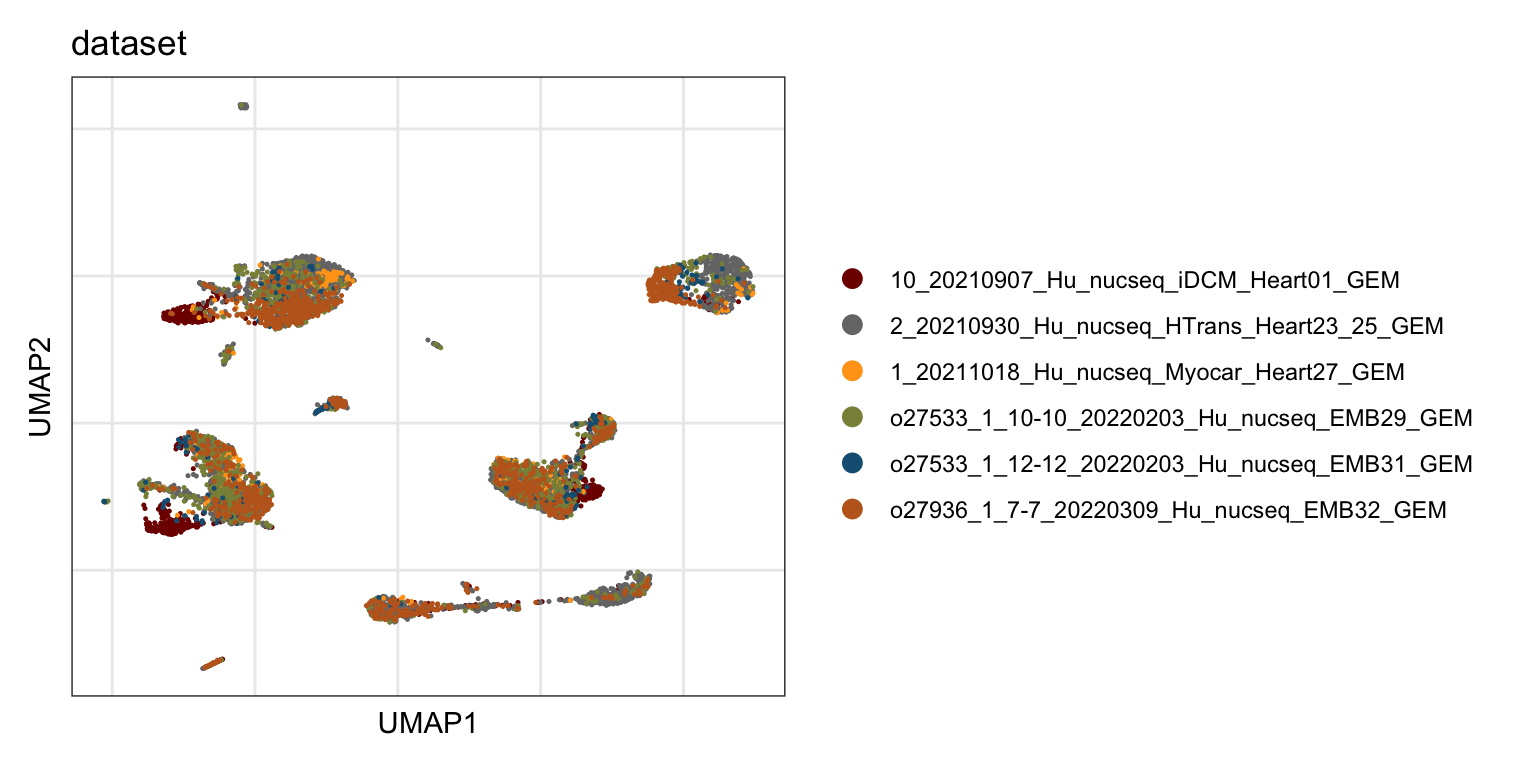
ID
DimPlot(seurat, reduction = "umap", group.by = "ID", cols=colBatch)+
  theme_bw() +
  theme(axis.text = element_blank(), axis.ticks = element_blank(),
        panel.grid.minor = element_blank()) +
  xlab("UMAP1") +
  ylab("UMAP2")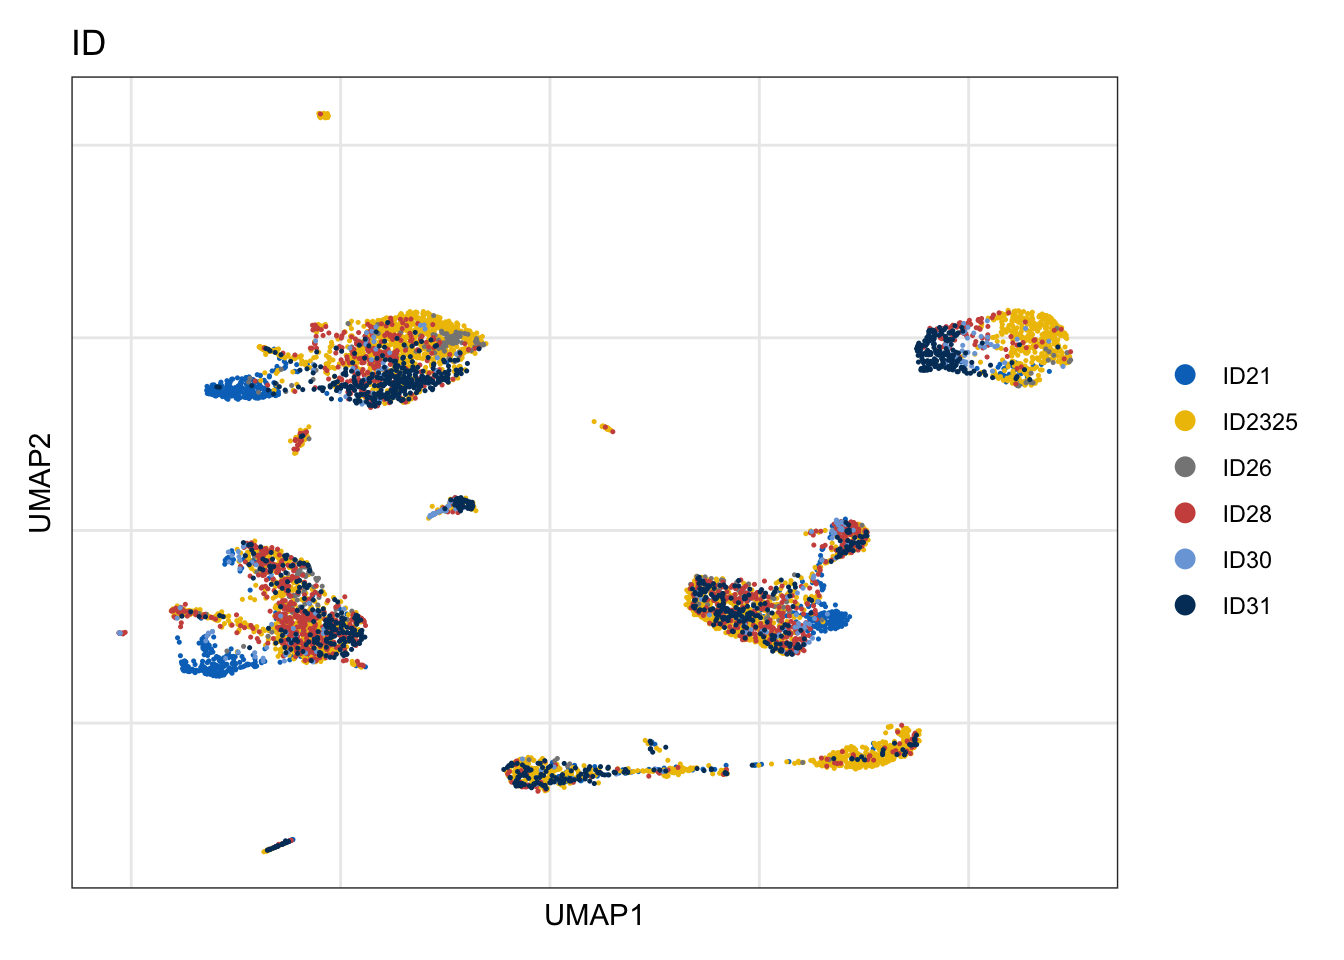
DimPlot(seurat, reduction = "umap", group.by = "ID", cols=colBatch,
        pt.size=0.6, shuffle = T)+
  theme_void()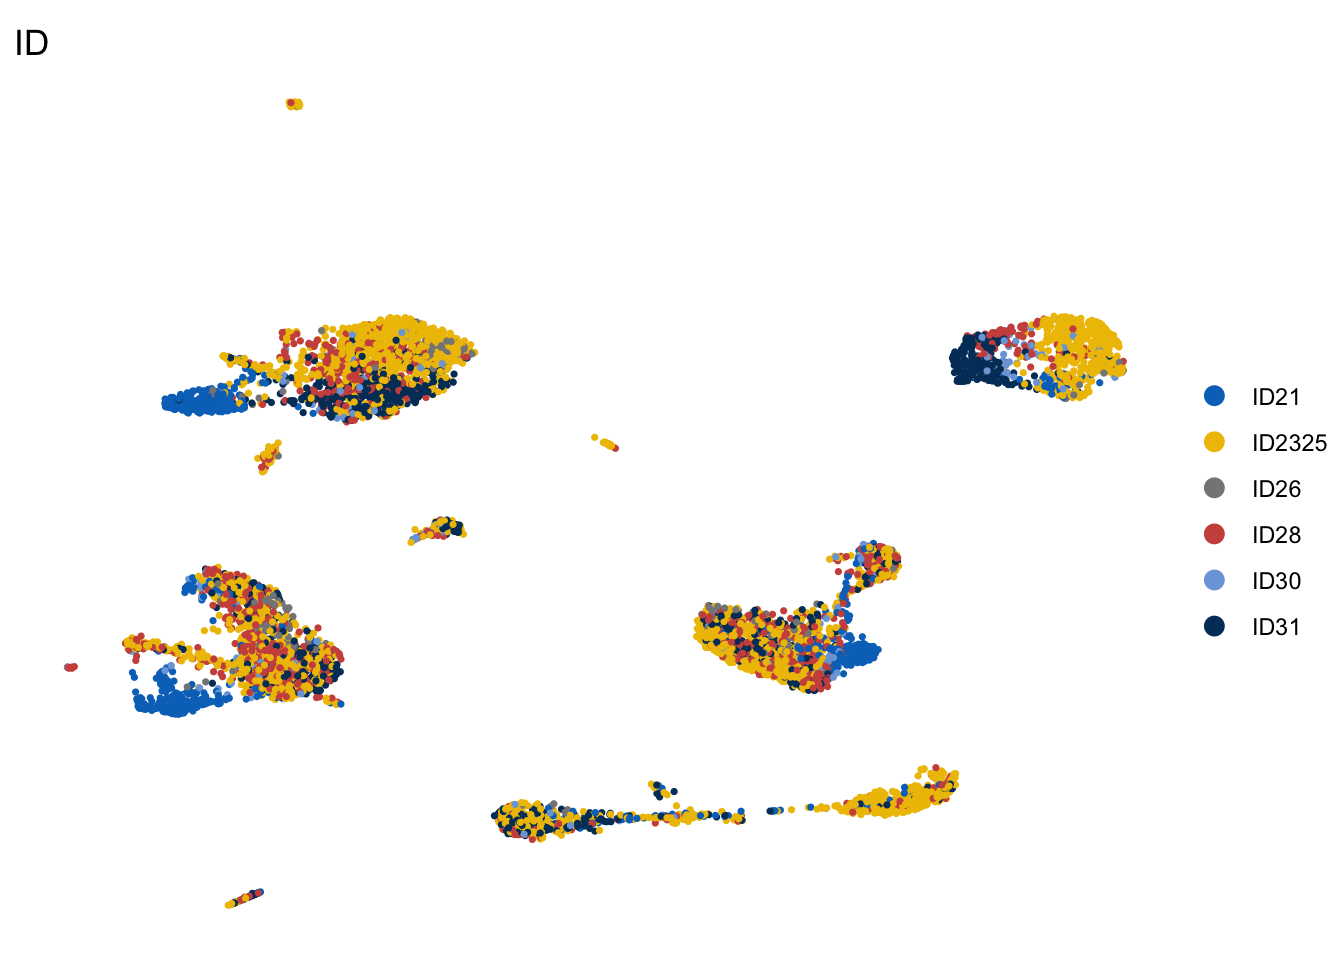
Origin
DimPlot(seurat, reduction = "umap", group.by = "origin", cols=colOrig)+
  theme_bw() +
  theme(axis.text = element_blank(), axis.ticks = element_blank(),
        panel.grid.minor = element_blank()) +
  xlab("UMAP1") +
  ylab("UMAP2")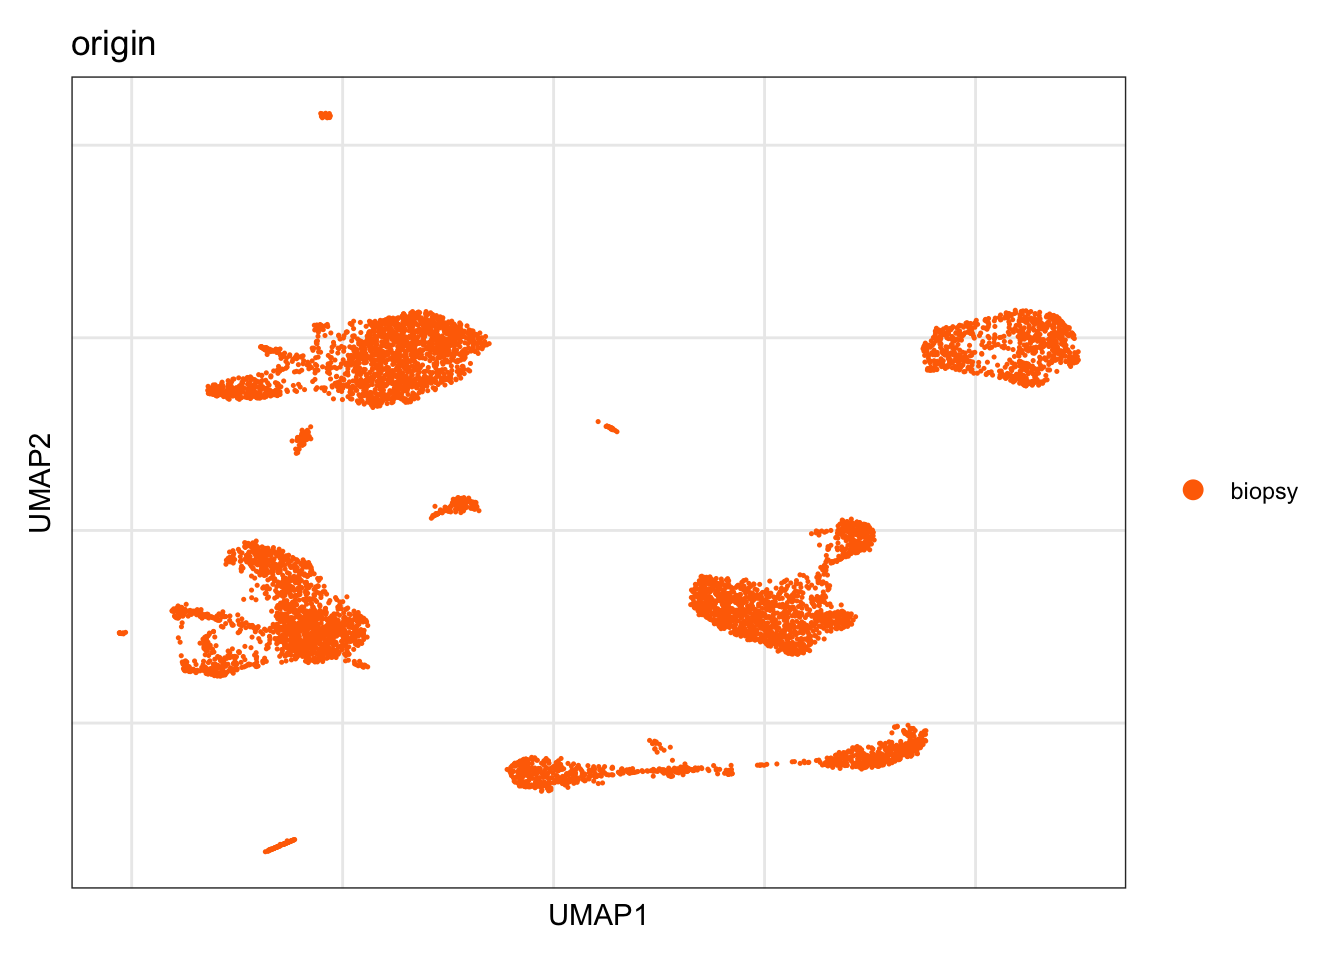
isolation
DimPlot(seurat, reduction = "umap", group.by = "isolation", cols=colIso)+
  theme_bw() +
  theme(axis.text = element_blank(), axis.ticks = element_blank(),
        panel.grid.minor = element_blank()) +
  xlab("UMAP1") +
  ylab("UMAP2")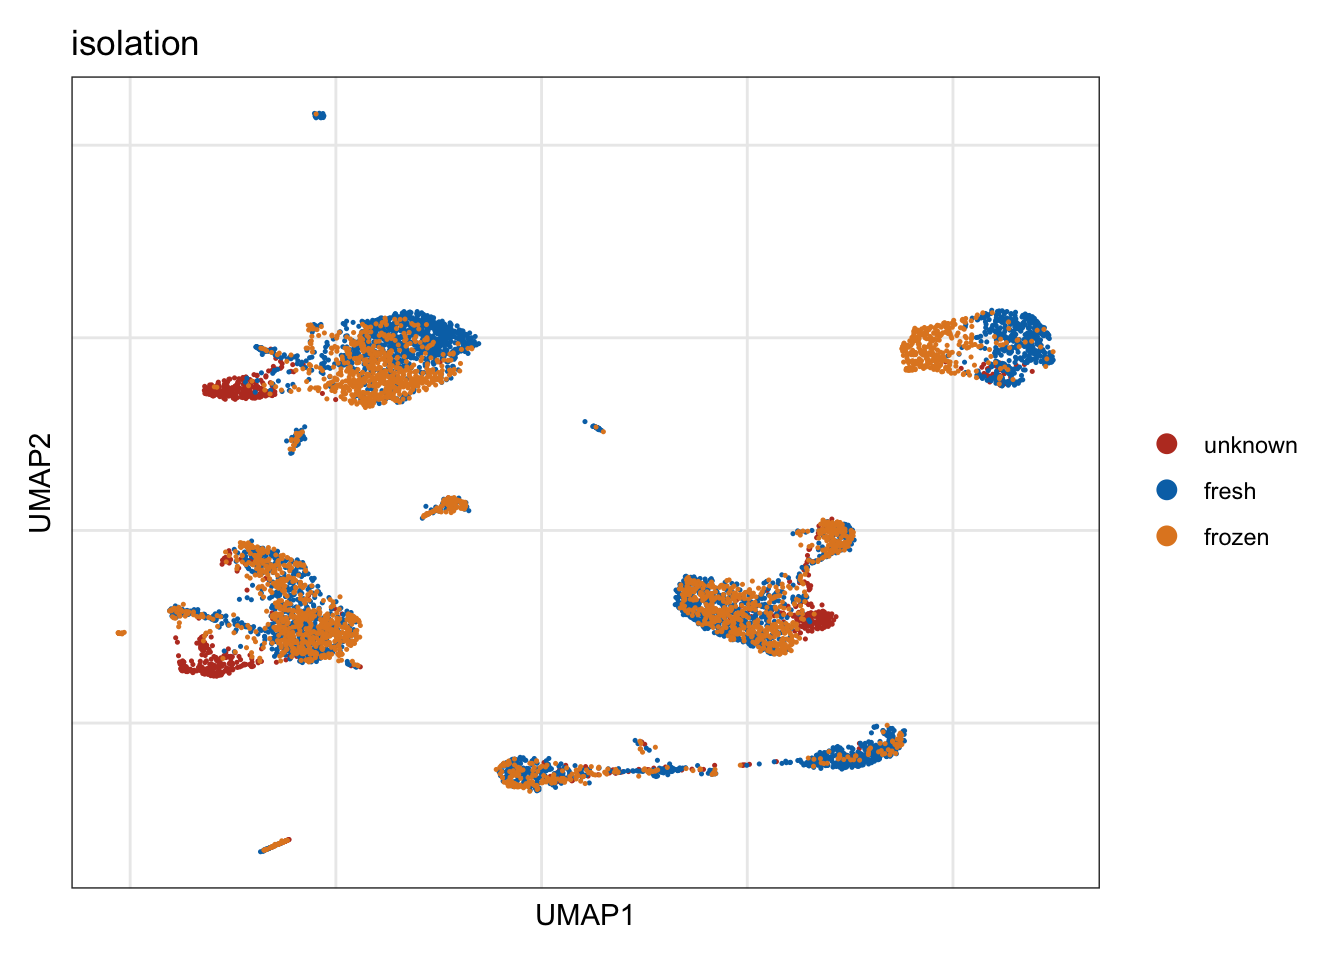
location
DimPlot(seurat, reduction = "umap", group.by = "location", cols=colLoc)+
  theme_bw() +
  theme(axis.text = element_blank(), axis.ticks = element_blank(),
        panel.grid.minor = element_blank()) +
  xlab("UMAP1") +
  ylab("UMAP2")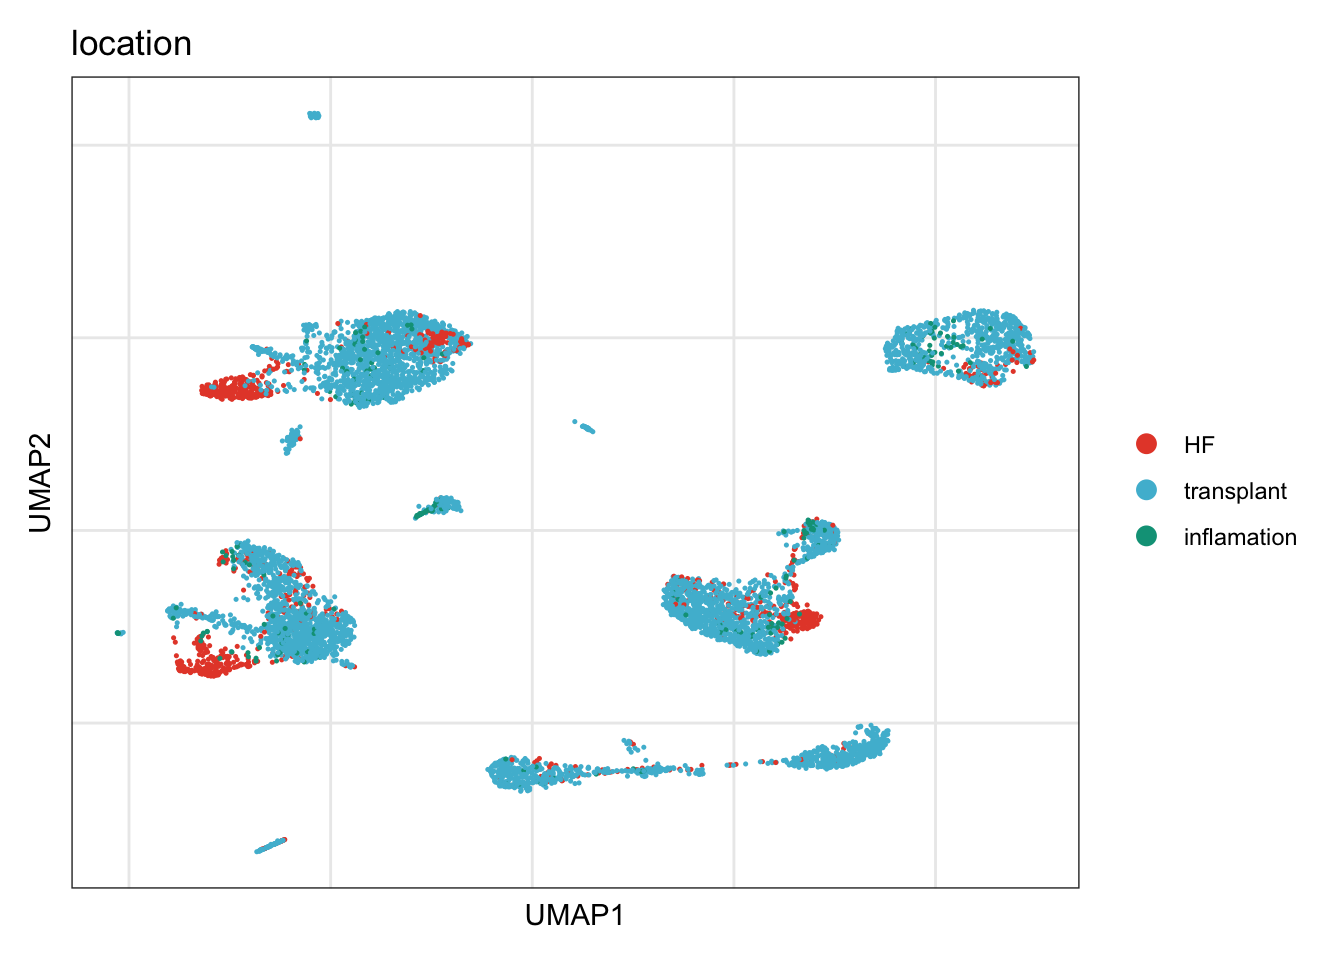
grp
DimPlot(seurat, reduction = "umap", group.by = "grp", cols=colGrp)+
  theme_bw() +
  theme(axis.text = element_blank(), axis.ticks = element_blank(),
        panel.grid.minor = element_blank()) +
  xlab("UMAP1") +
  ylab("UMAP2")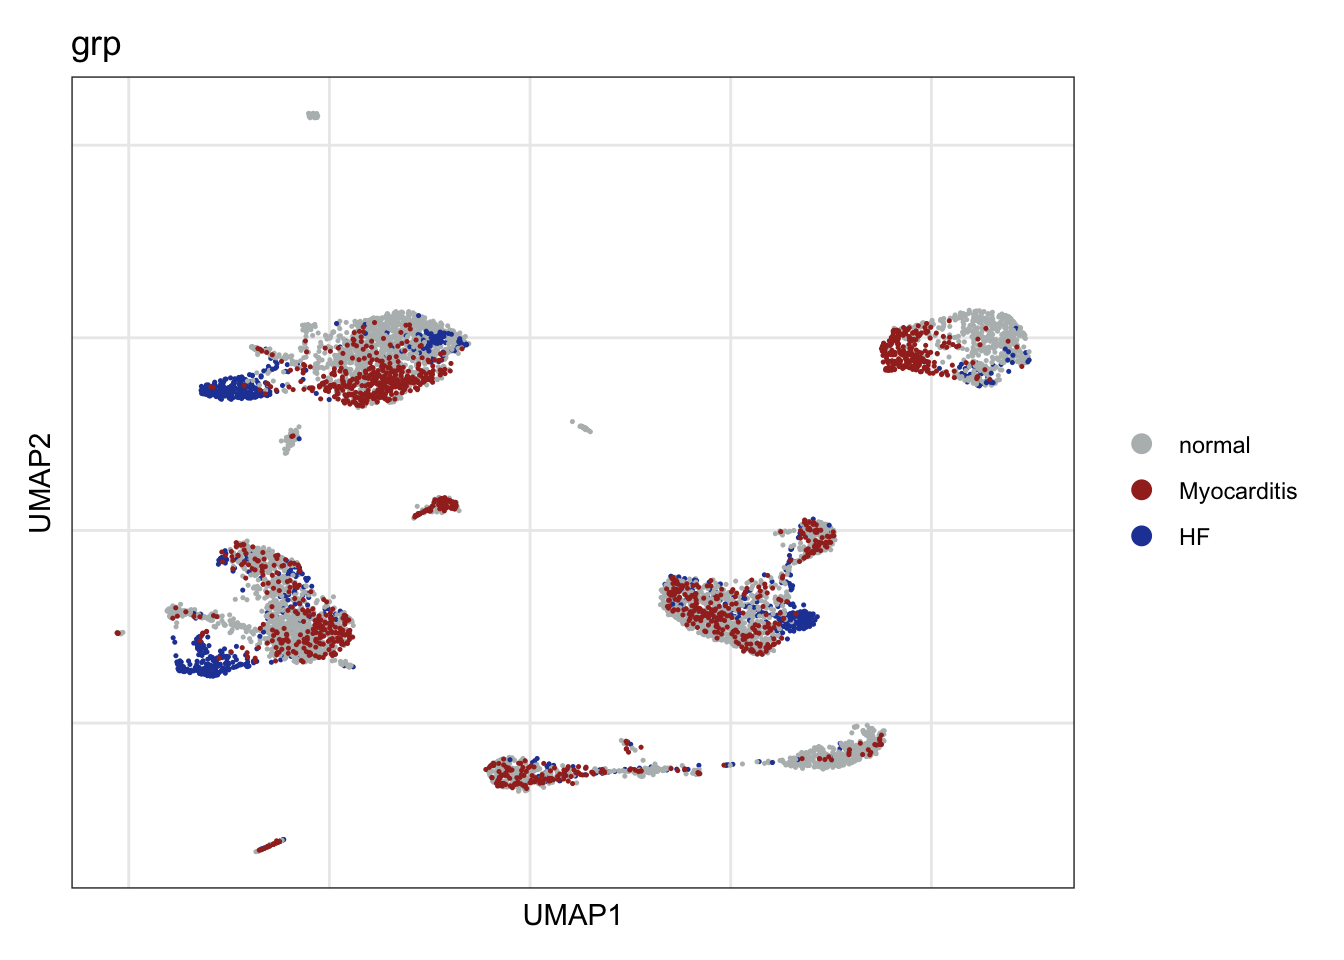
DimPlot(seurat, reduction = "umap", group.by = "grp", cols=colGrp,
        pt.size=0.6)+
  theme_void()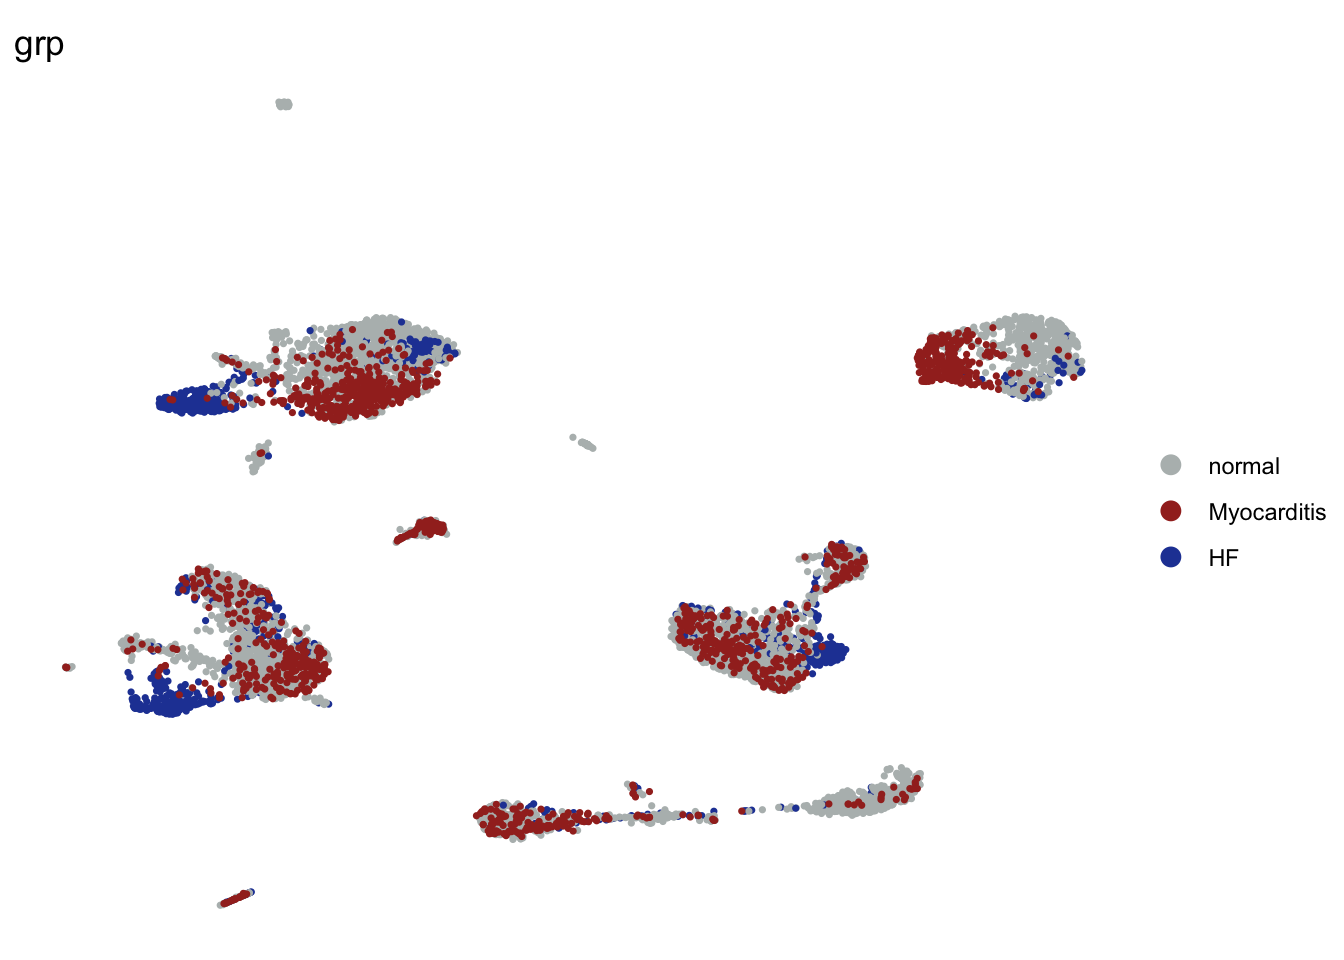
grp without HF
seuratSub <- subset(seurat, grp == "HF", invert=T)


DimPlot(seuratSub, reduction = "umap", group.by = "grp", cols=colGrp,
        pt.size=0.6, order = "Myocarditis")+
  theme_void()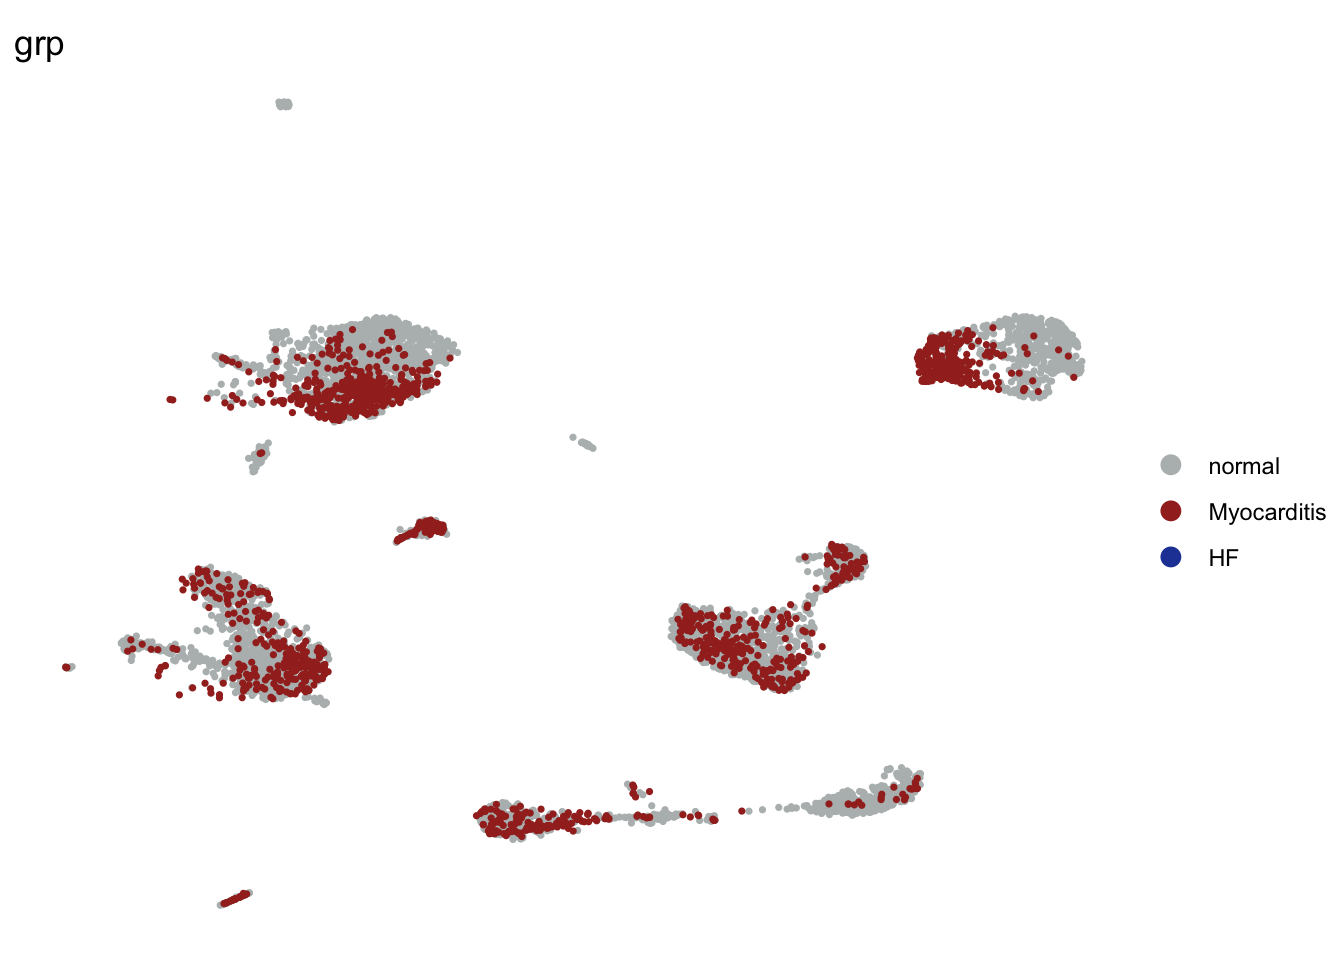
grp without M
seuratSub2 <- subset(seurat, grp == "Myocarditis", invert=T)


DimPlot(seuratSub2, reduction = "umap", group.by = "grp", cols=colGrp,
        pt.size=0.6, order = "HF")+
  theme_void()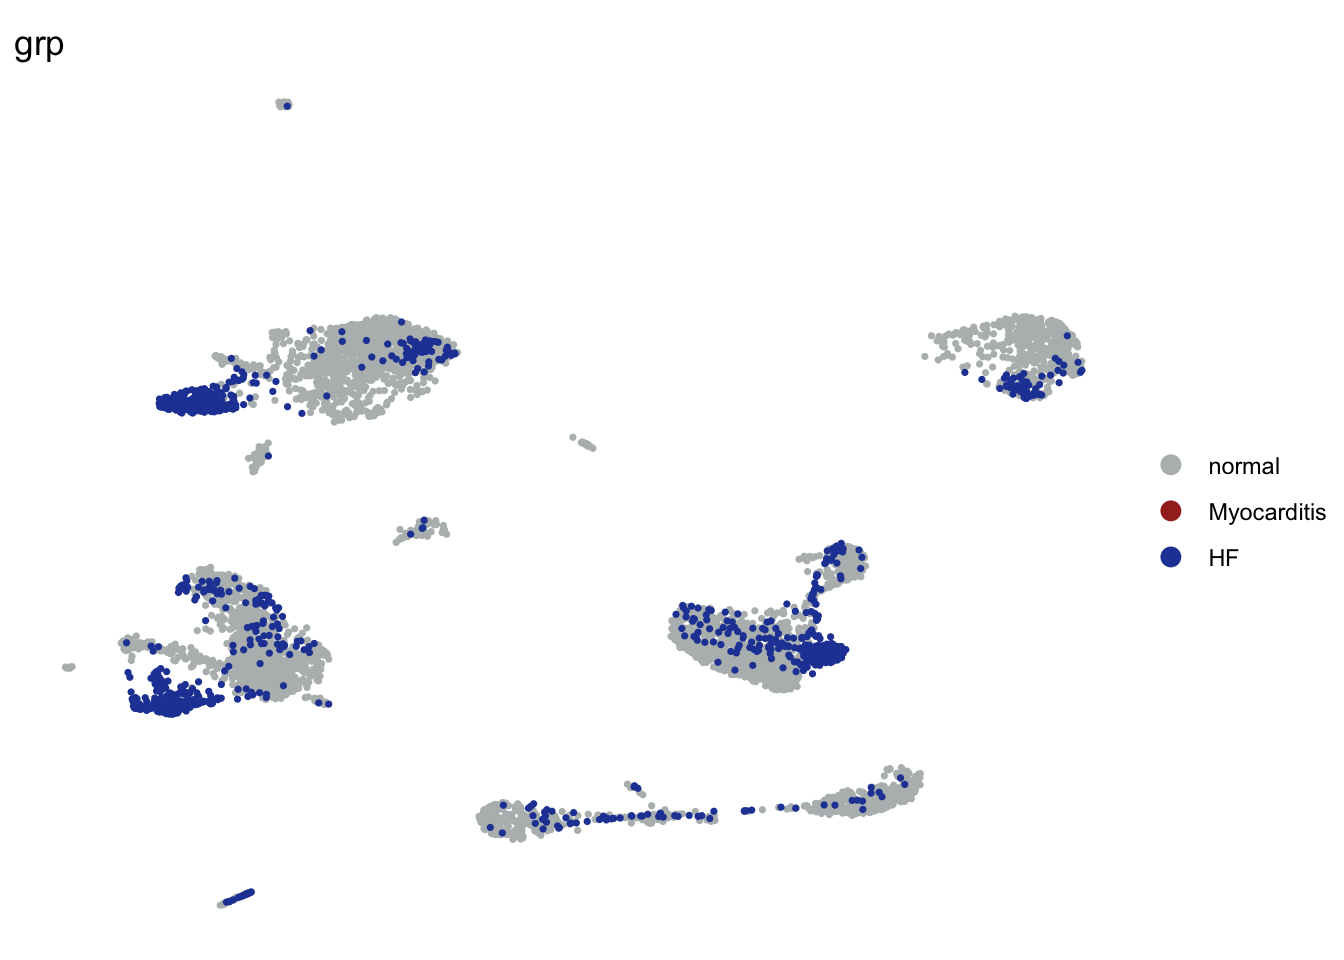
DE genes grp
Idents(seurat) <- seurat$grp
DEgenes <- FindAllMarkers(object = seurat, assay ="RNA",
                                     only.pos = TRUE, min.pct = 0.25,
                                     logfc.threshold = 0.25,
                                     test.use = "wilcox")
top 20 marker genes per grp
cluster <- levels(seurat)
selGenesAll <- DEgenes %>% group_by(cluster) %>%
  top_n(-20, p_val_adj) %>%
  top_n(20, avg_log2FC)
selGenesAll <- selGenesAll %>% mutate(geneIDval=gsub("^.*\\.", "", gene)) %>% filter(nchar(geneIDval)>1)

Idents(seurat) <- seurat$grp
pOut <- avgHeatmap(seurat = seurat, selGenes = selGenesAll,
                  colVecIdent = colGrp,
                  ordVec=levels(seurat),
                  gapVecR=NULL, gapVecC=NULL,cc=FALSE,
                  cr=T, condCol=F)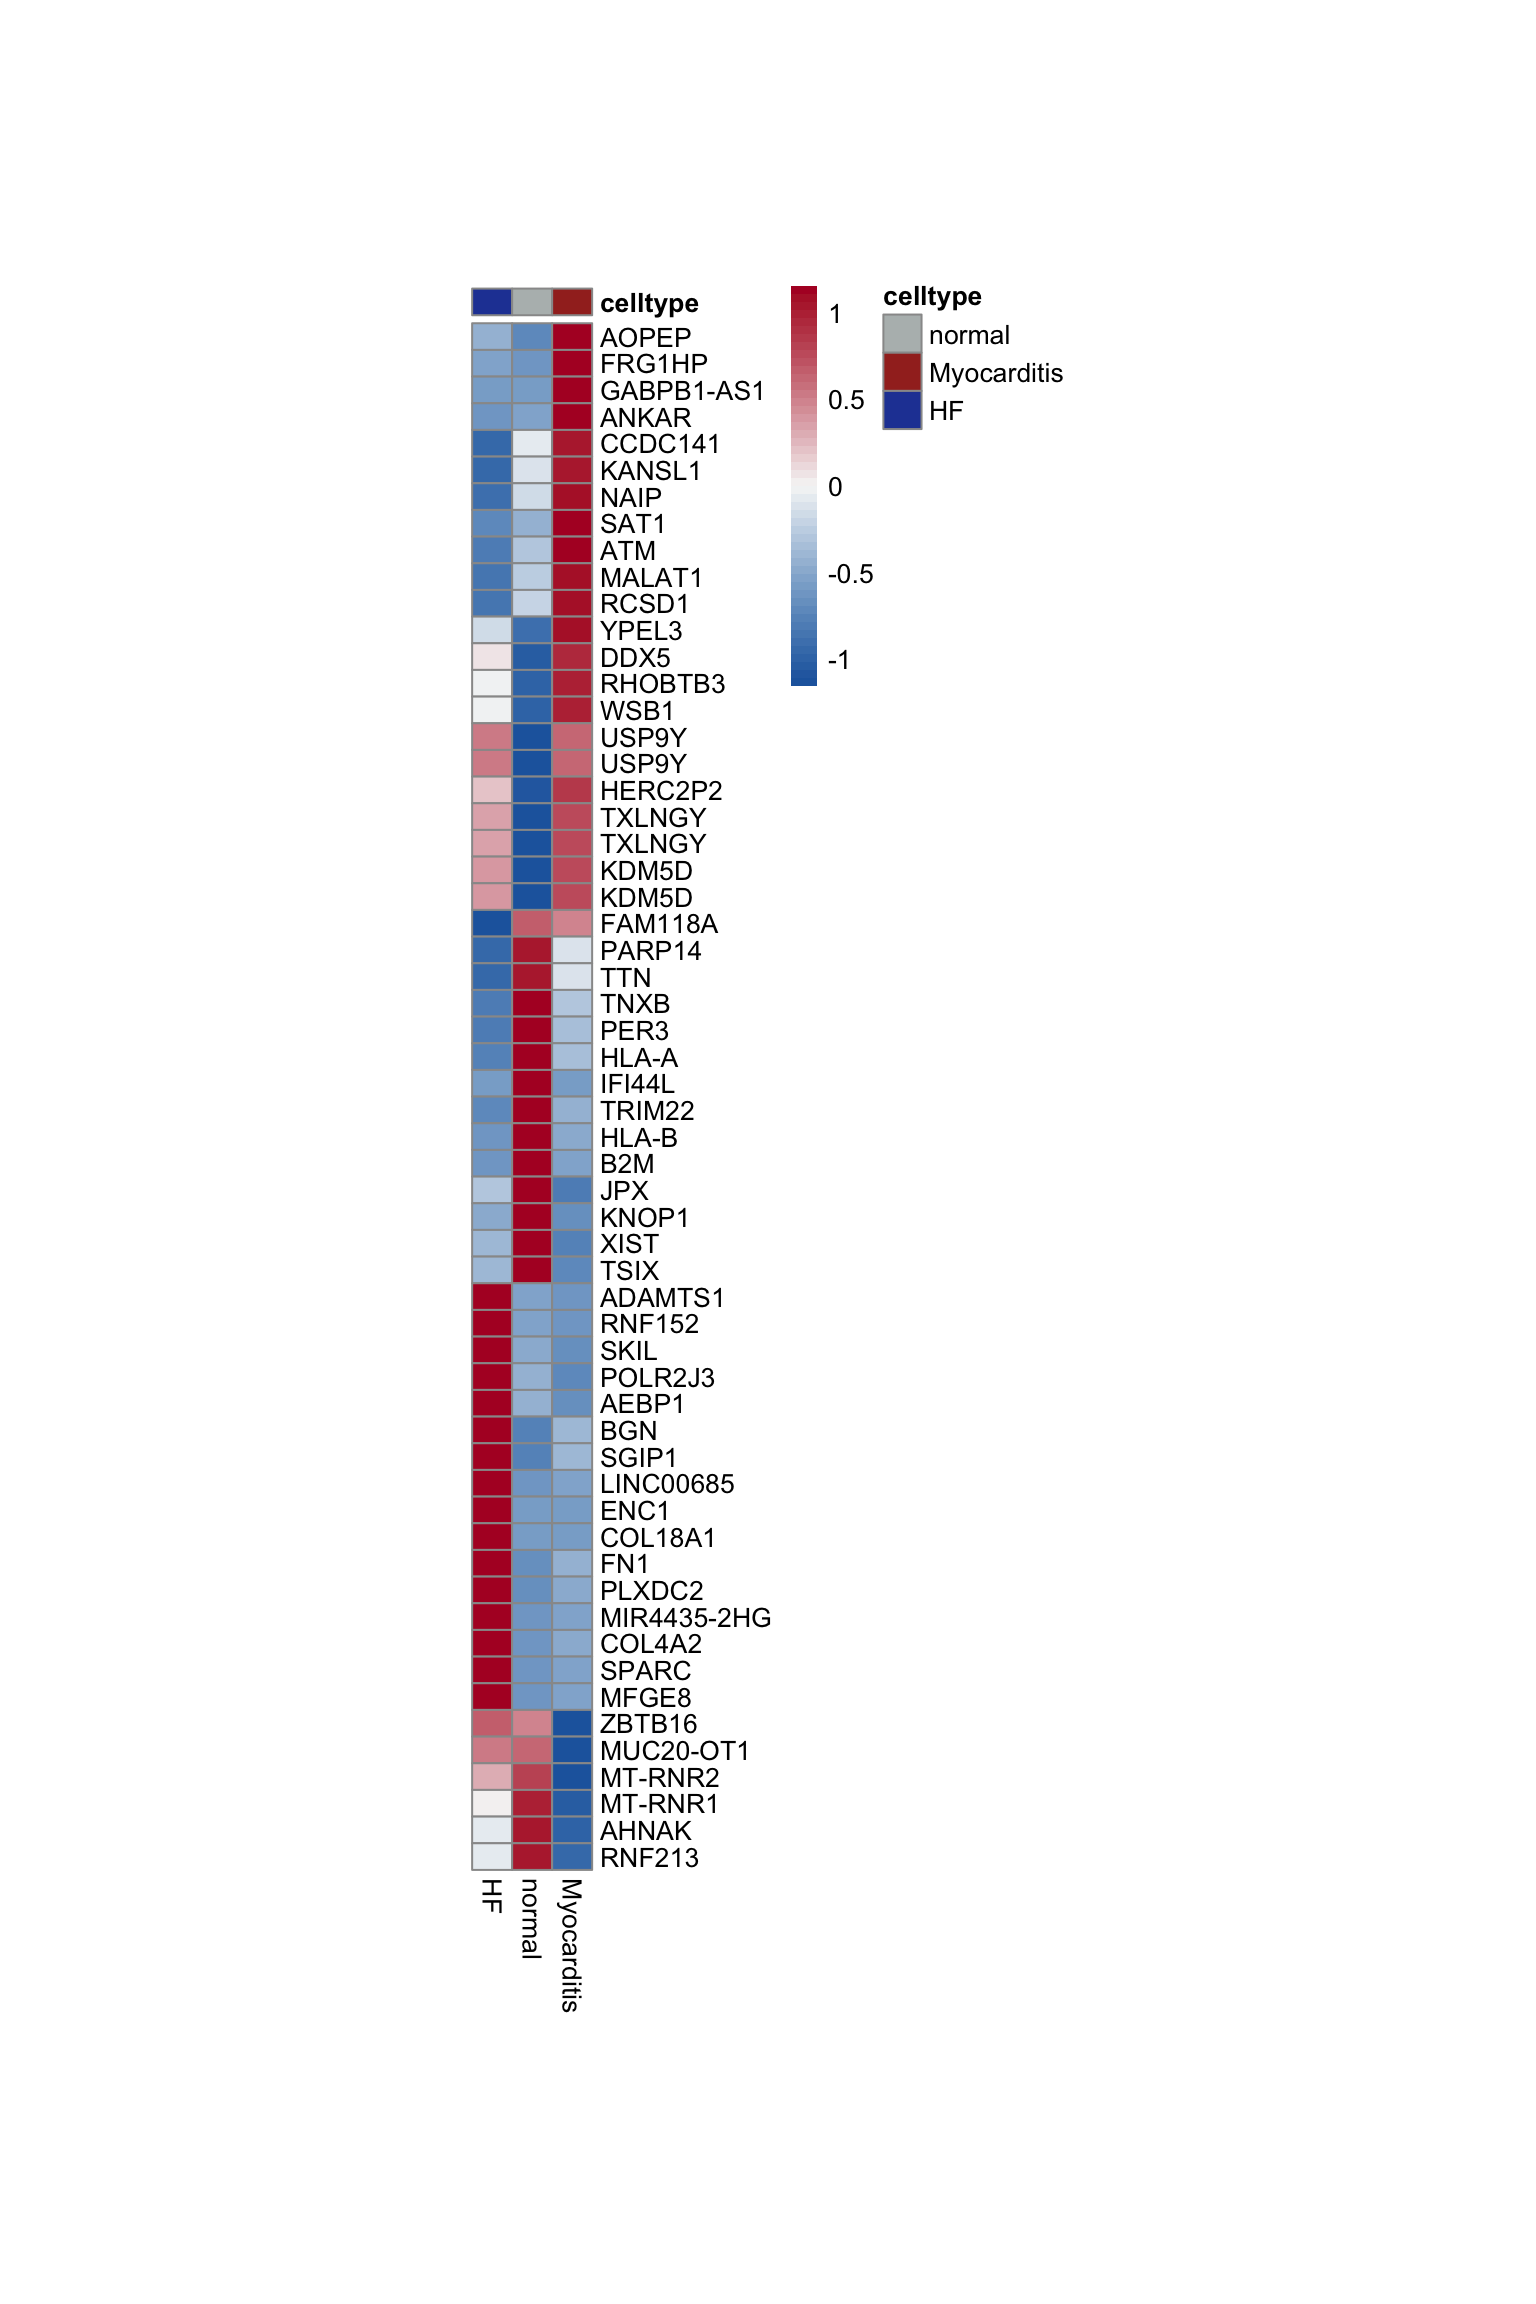
Idents(seurat) <- seurat$ID
pOut <- avgHeatmap(seurat = seurat, selGenes = selGenesAll,
                  colVecIdent = colBatch,
                  ordVec=levels(seurat),
                  gapVecR=NULL, gapVecC=NULL,cc=FALSE,
                  cr=T, condCol=F)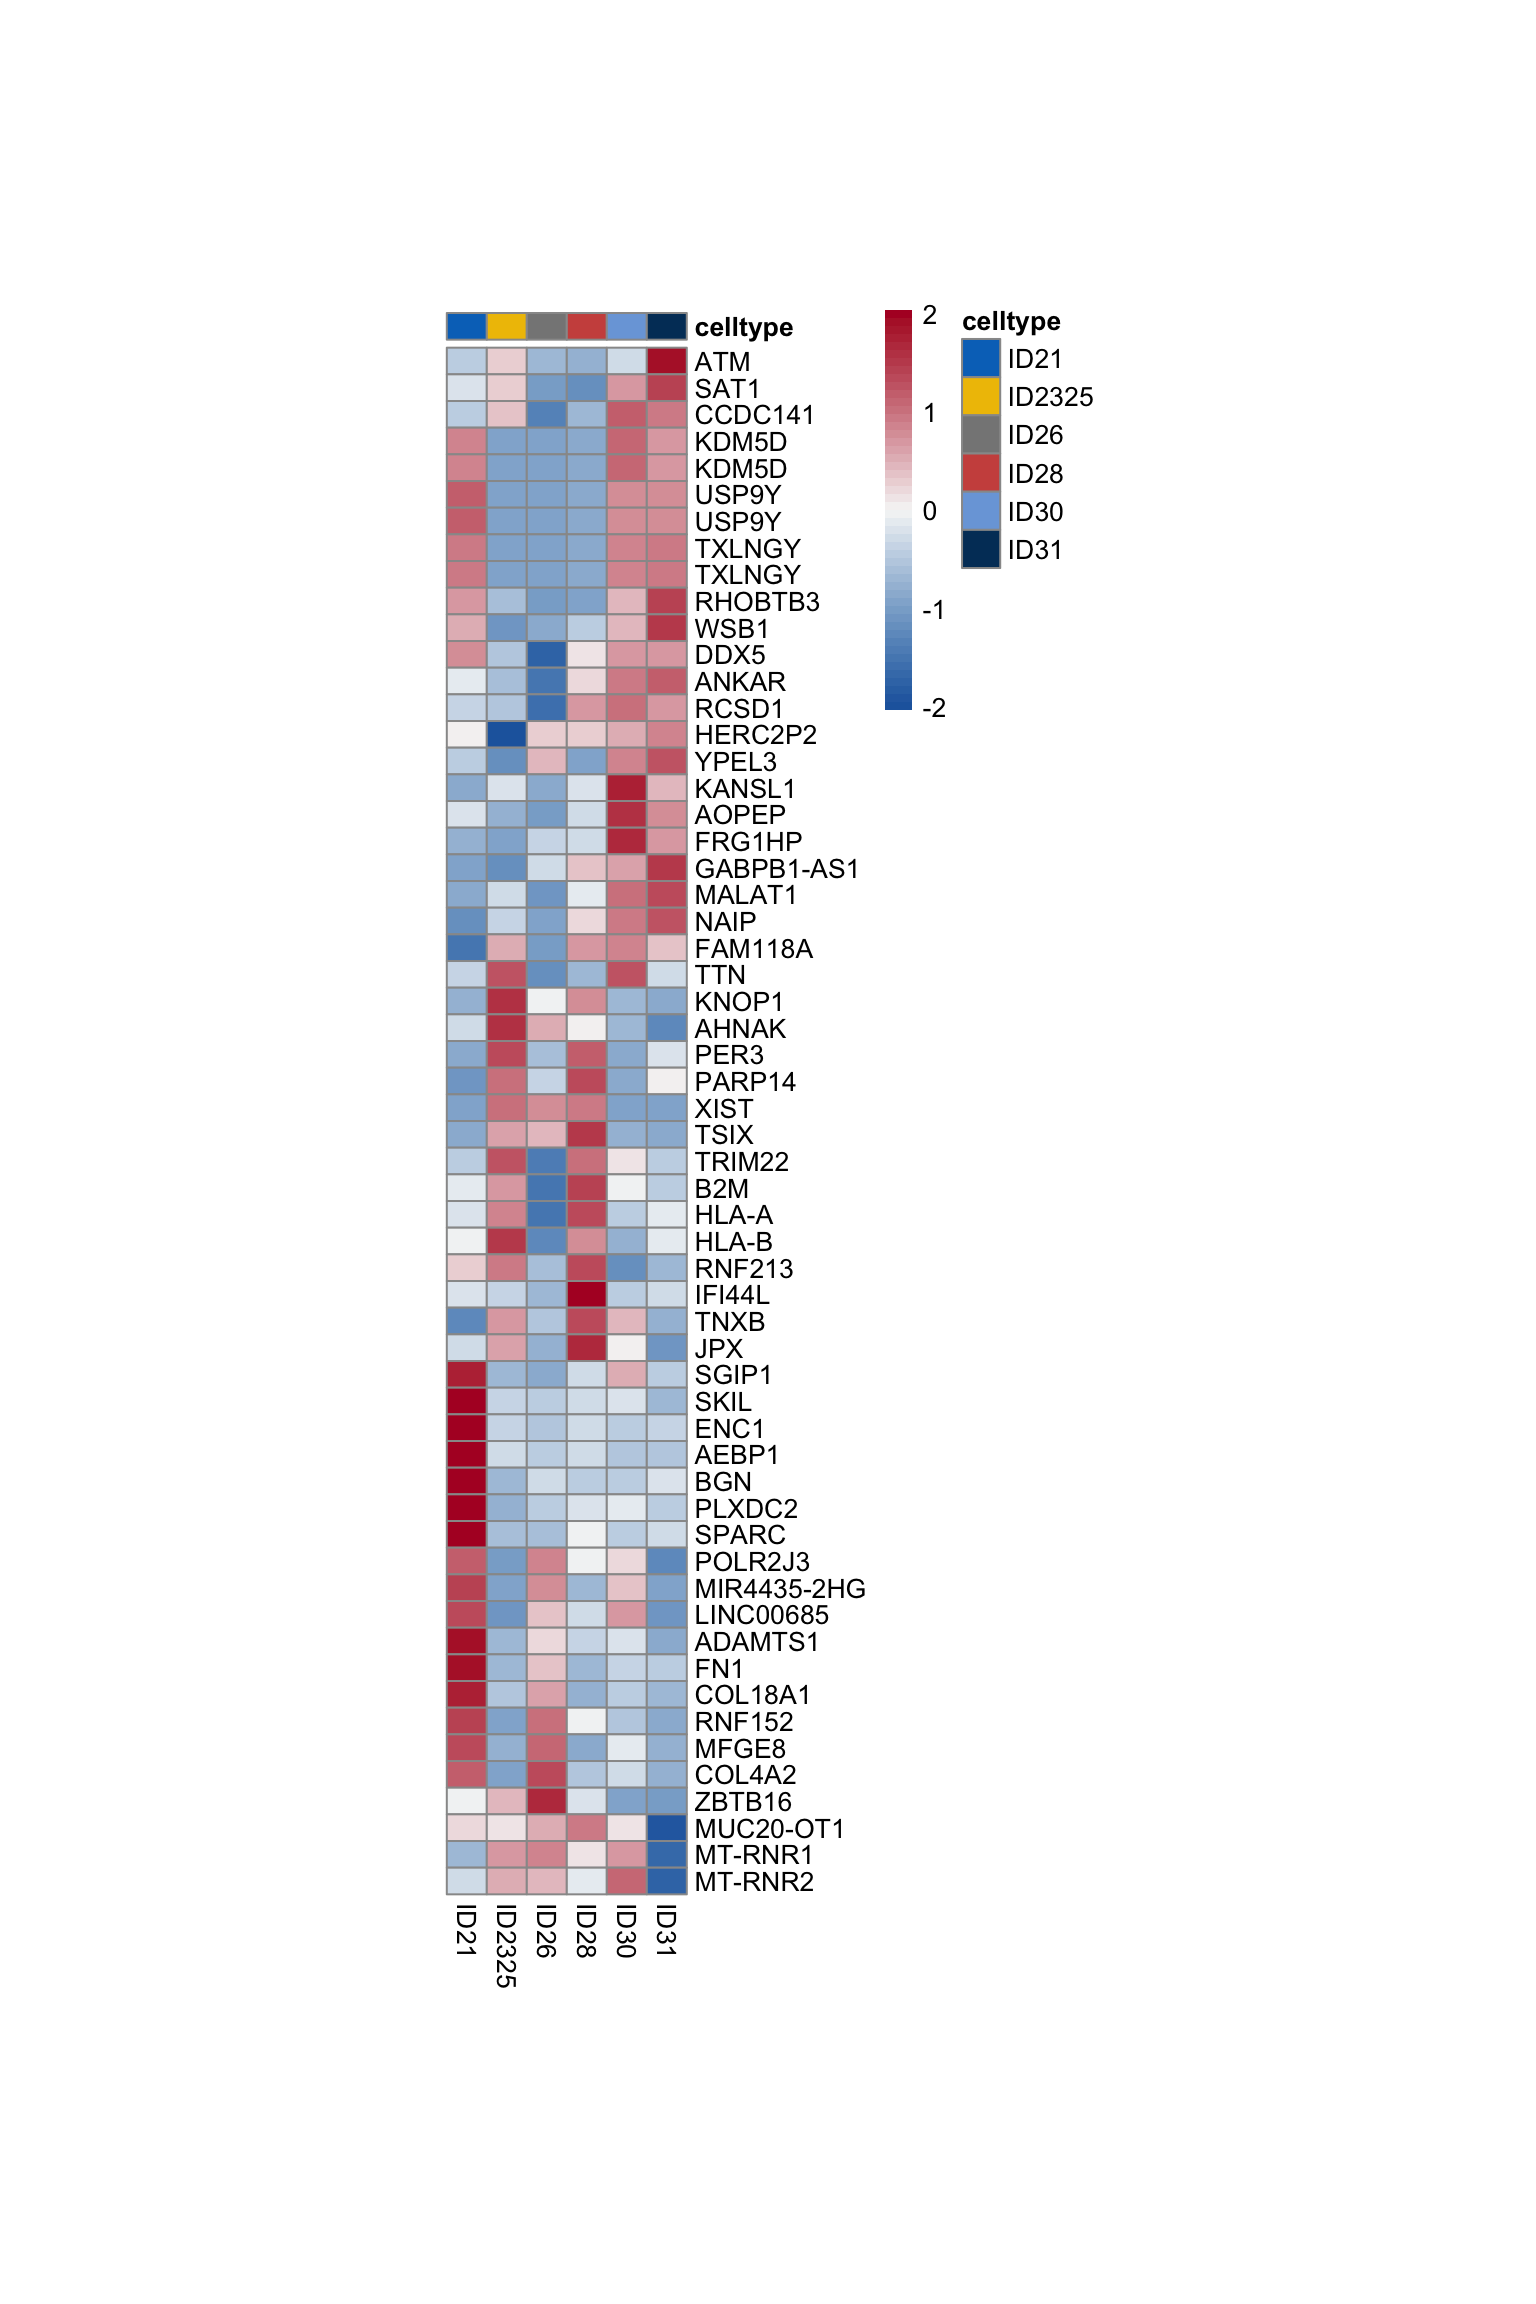
cnt Tab
table(seurat$grp)
         HF Myocarditis      normal
       1064        1428        4385
table(seurat$ID)
  ID21 ID2325   ID26   ID28   ID30   ID31
   826   3131    238   1254    236   1192
table(seurat$ID, seurat$grp)
           HF Myocarditis normal
  ID21    826           0      0
  ID2325    0           0   3131
  ID26    238           0      0
  ID28      0           0   1254
  ID30      0         236      0
  ID31      0        1192      0
signature cut 1.5
split by grp
signDat <- read_delim(file = paste0(basedir,
                    "/data/SelSignaturesTreat.txt"),
                    delim = "\t")
genes <- data.frame(geneID=rownames(seurat)) %>%
  mutate(gene=gsub("^.*\\.", "", geneID))
signDat <- signDat %>% left_join(.,genes, by="gene")
allSign <- unique(signDat$signature)

sce <- as.SingleCellExperiment(seurat)
treatGrps <- unique(sce$grp)

cutOff <- 1.5
pal = viridis(100)
sc <- scale_colour_gradientn(colours = pal, limits=c(0, cutOff))

lapply(unique(signDat$signature), function(sign){
  signGenes <- signDat %>% dplyr::filter(signature == sign)
  sceSub <- sce[which(rownames(sce) %in% signGenes$geneID),]
  cntMat <- rowSums(t(as.matrix(sceSub@assays@data$logcounts)))/nrow(signGenes)
  sceSub$sign <- cntMat
  sceSub$sign[which(sceSub$sign > cutOff)] <- cutOff
  sceSub$sign[which(sceSub$sign < 0)] <- 0
  lapply(treatGrps, function(treat){
    sceSubT <- sceSub[, which(sceSub$grp == treat)]
    p <- visGroup_adapt(sceSubT, 'sign', dim_red = 'UMAP') +
    sc +
    guides(colour = guide_colourbar(title = '')) +
    ggtitle(paste0(sign, ' signature - ', treat)) +
    theme_classic() +
    theme(axis.text = element_blank(),
          axis.ticks = element_blank()) +
    labs(x='Dimension 1', y='Dimension 2')
    p
  })
})
[[1]]
[[1]][[1]]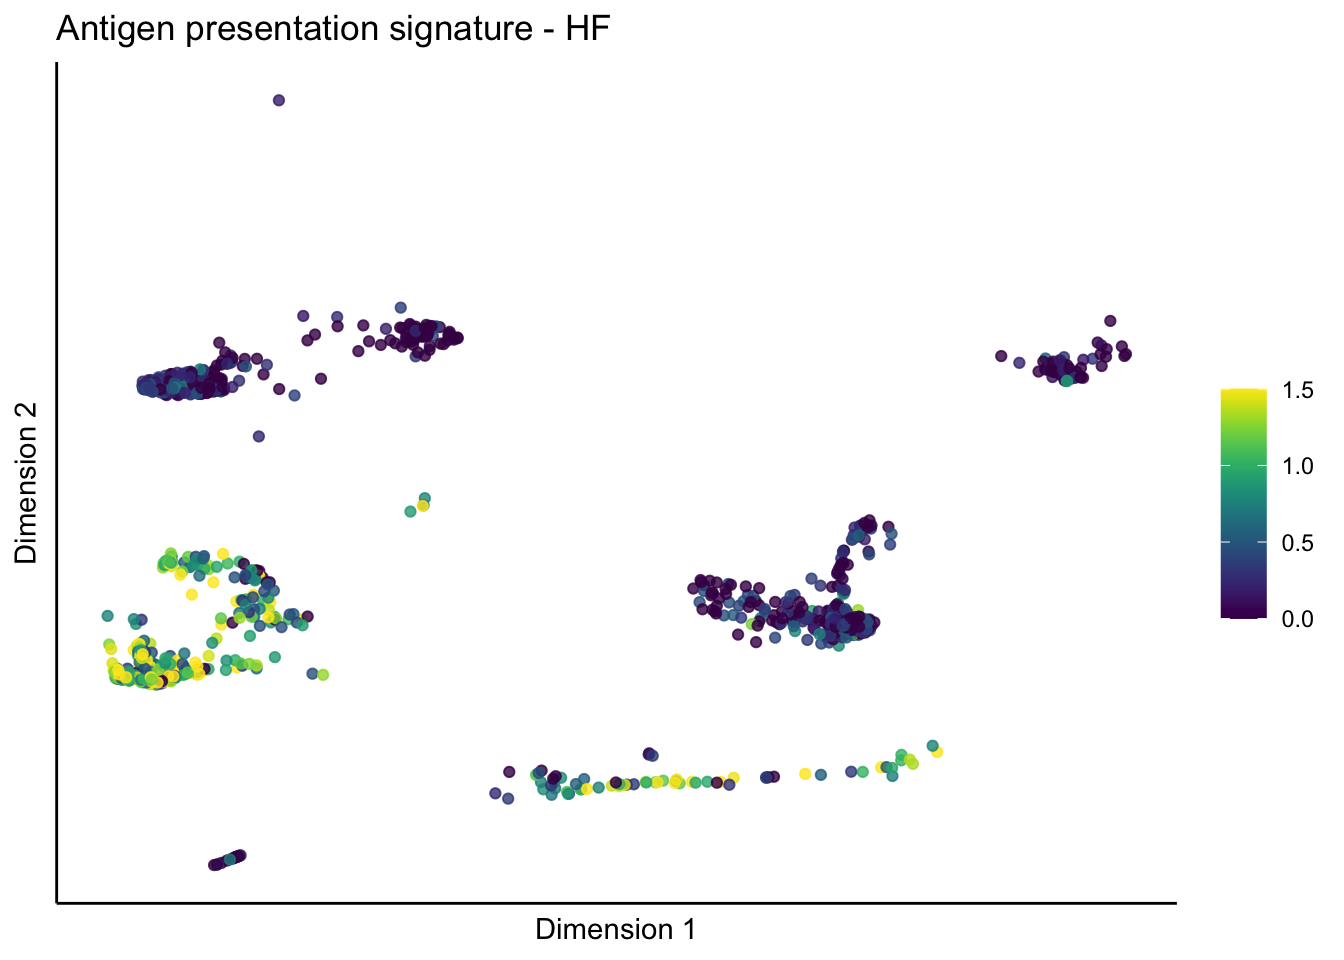
[[1]][[2]]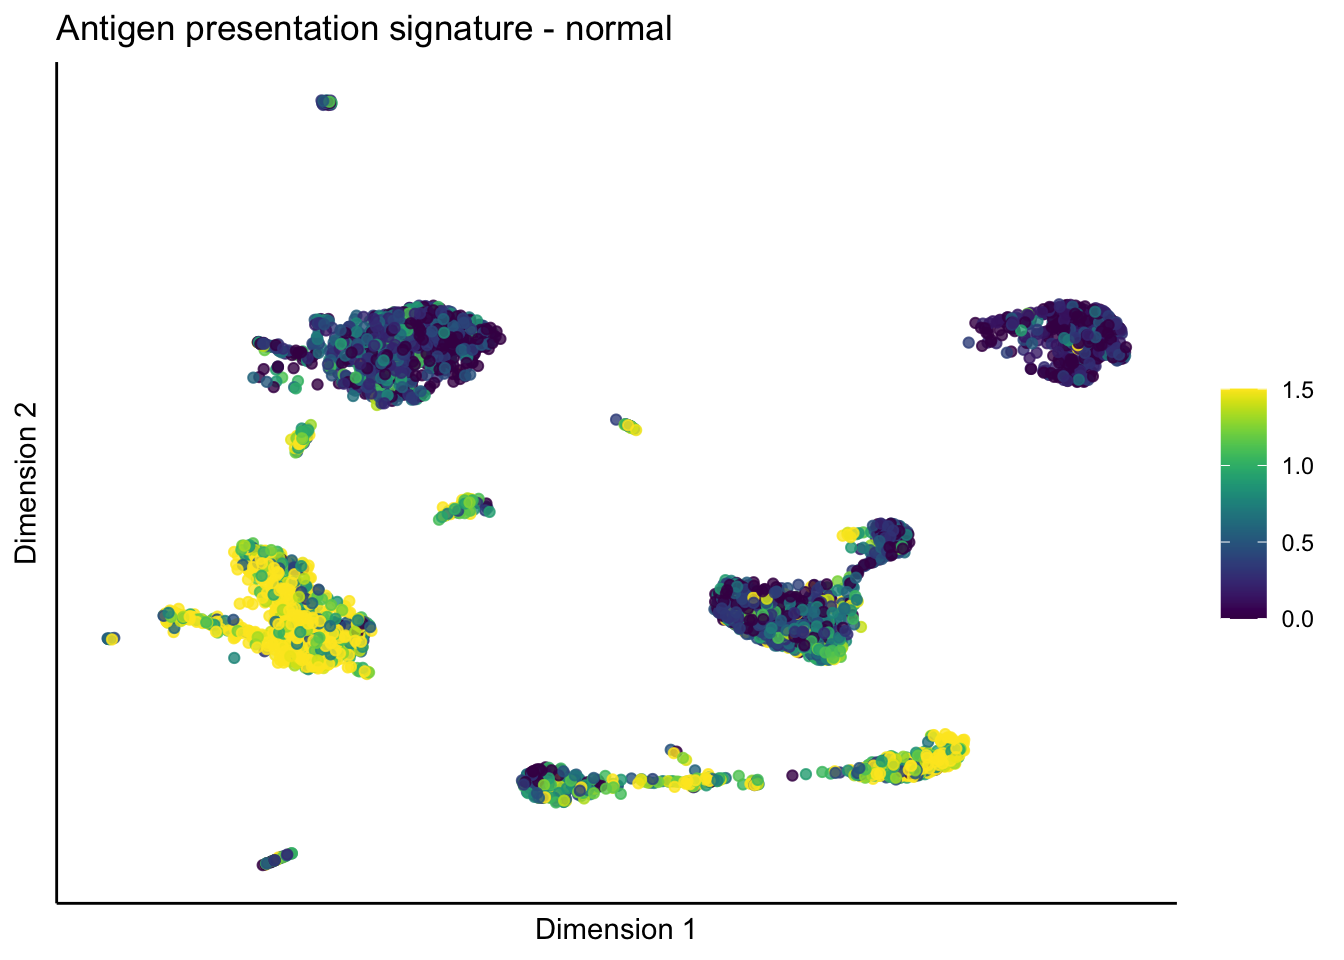
[[1]][[3]]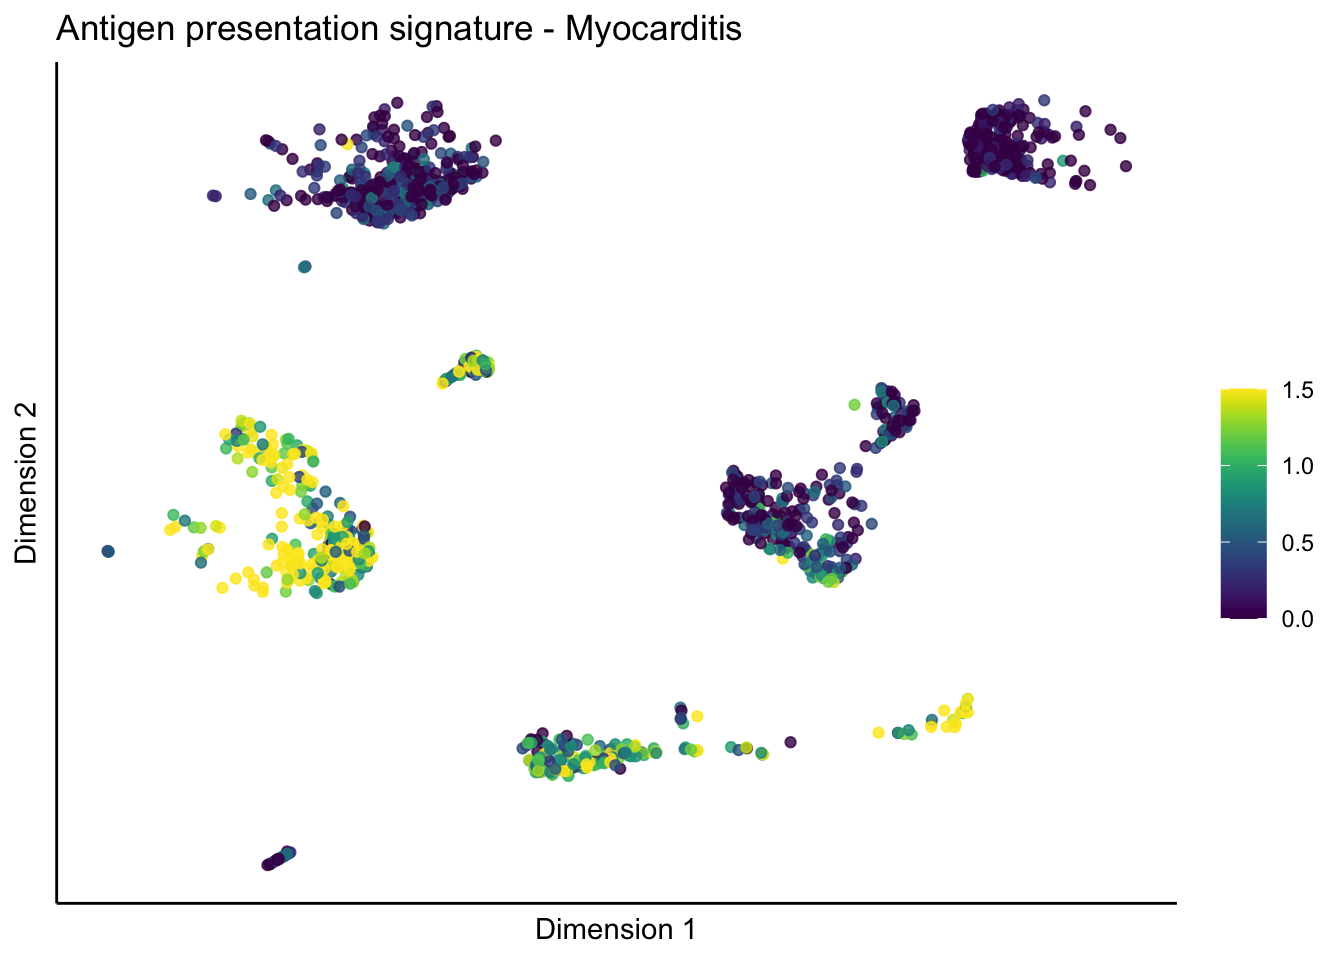
[[2]]
[[2]][[1]]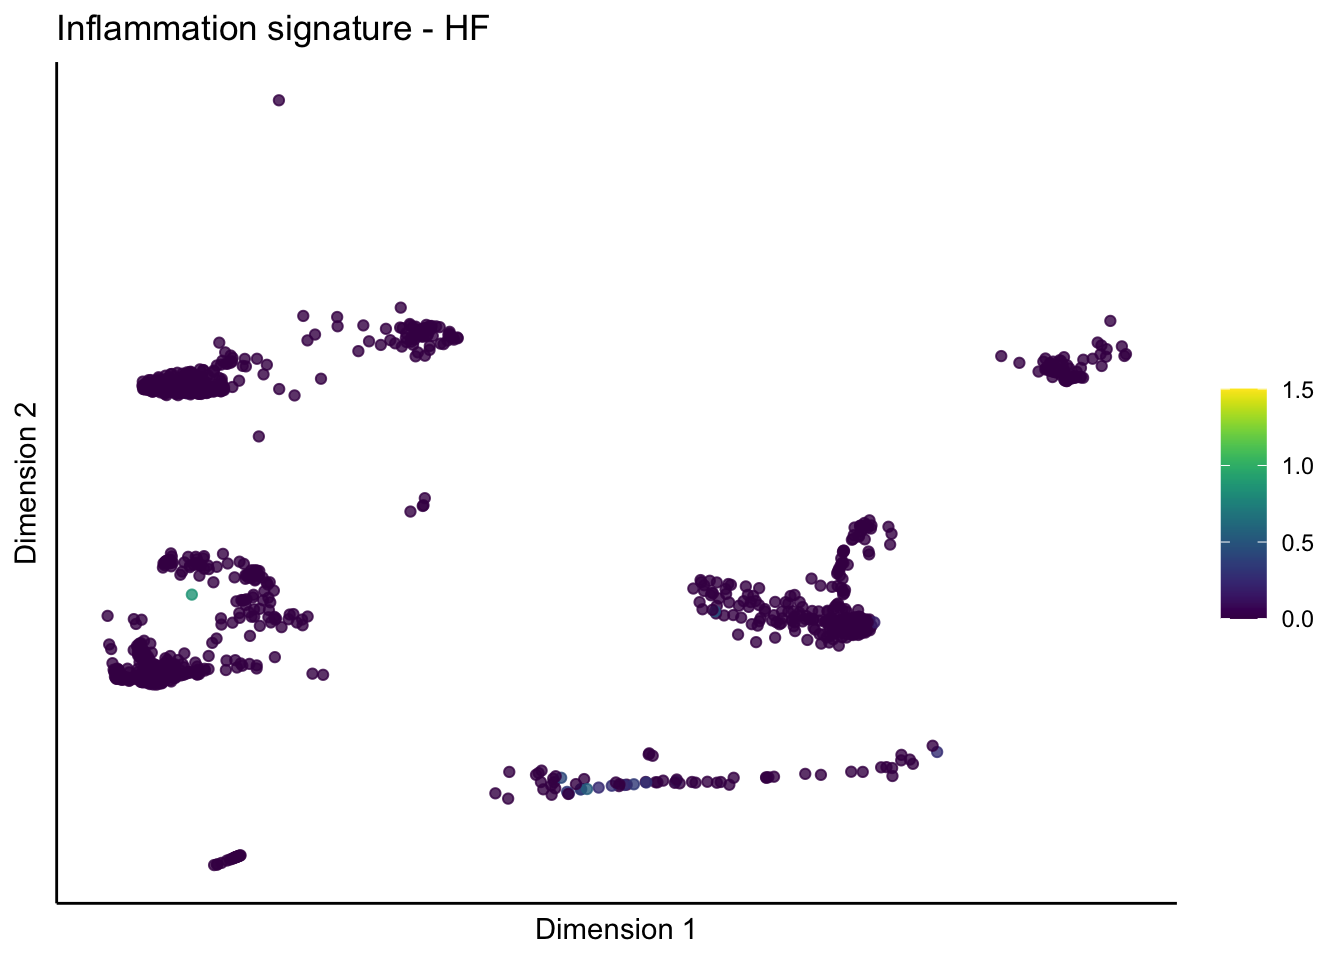
[[2]][[2]]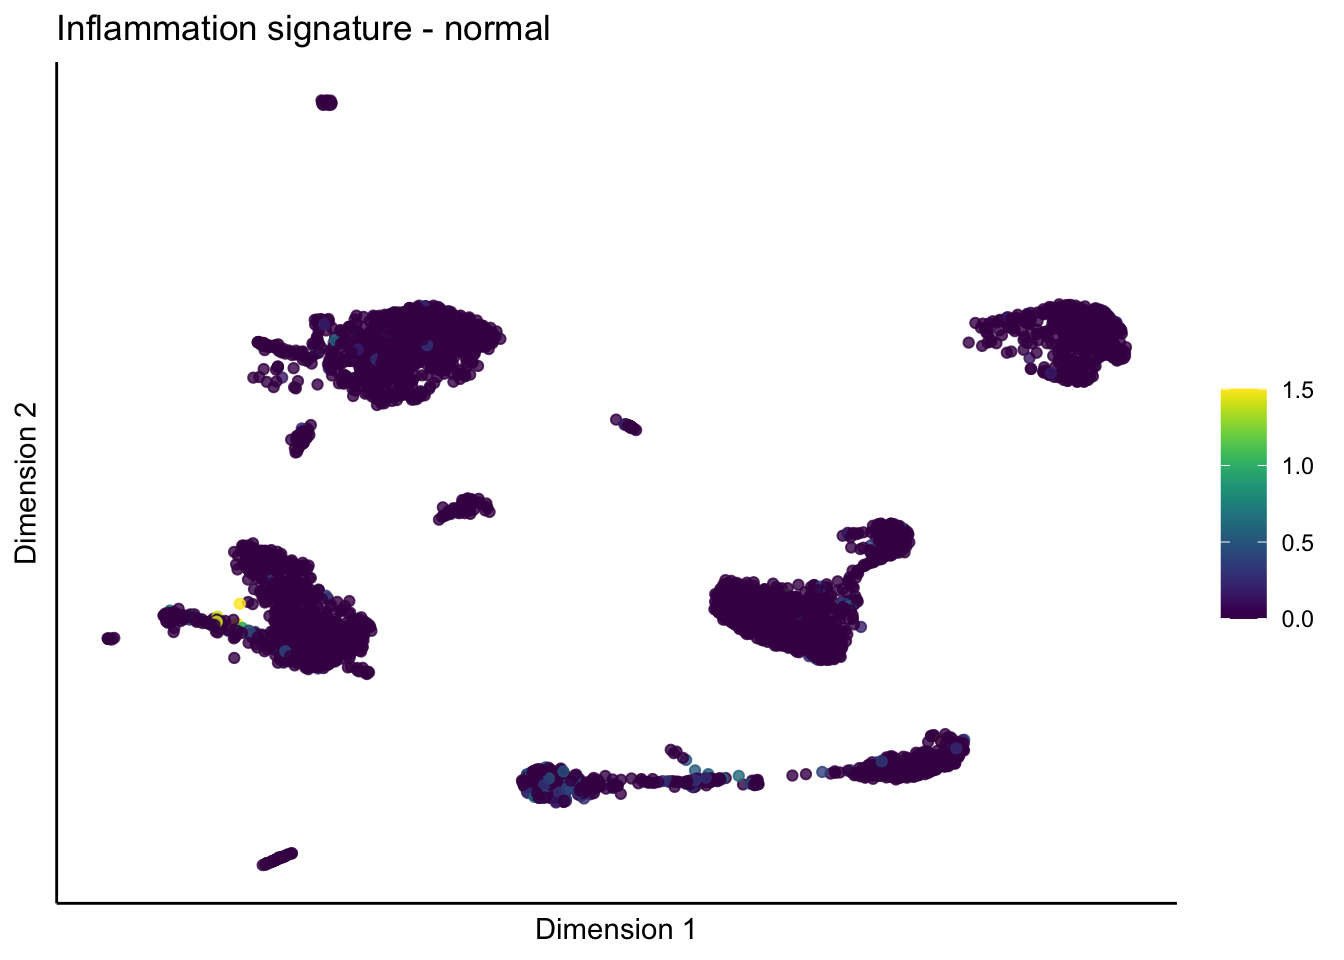
[[2]][[3]]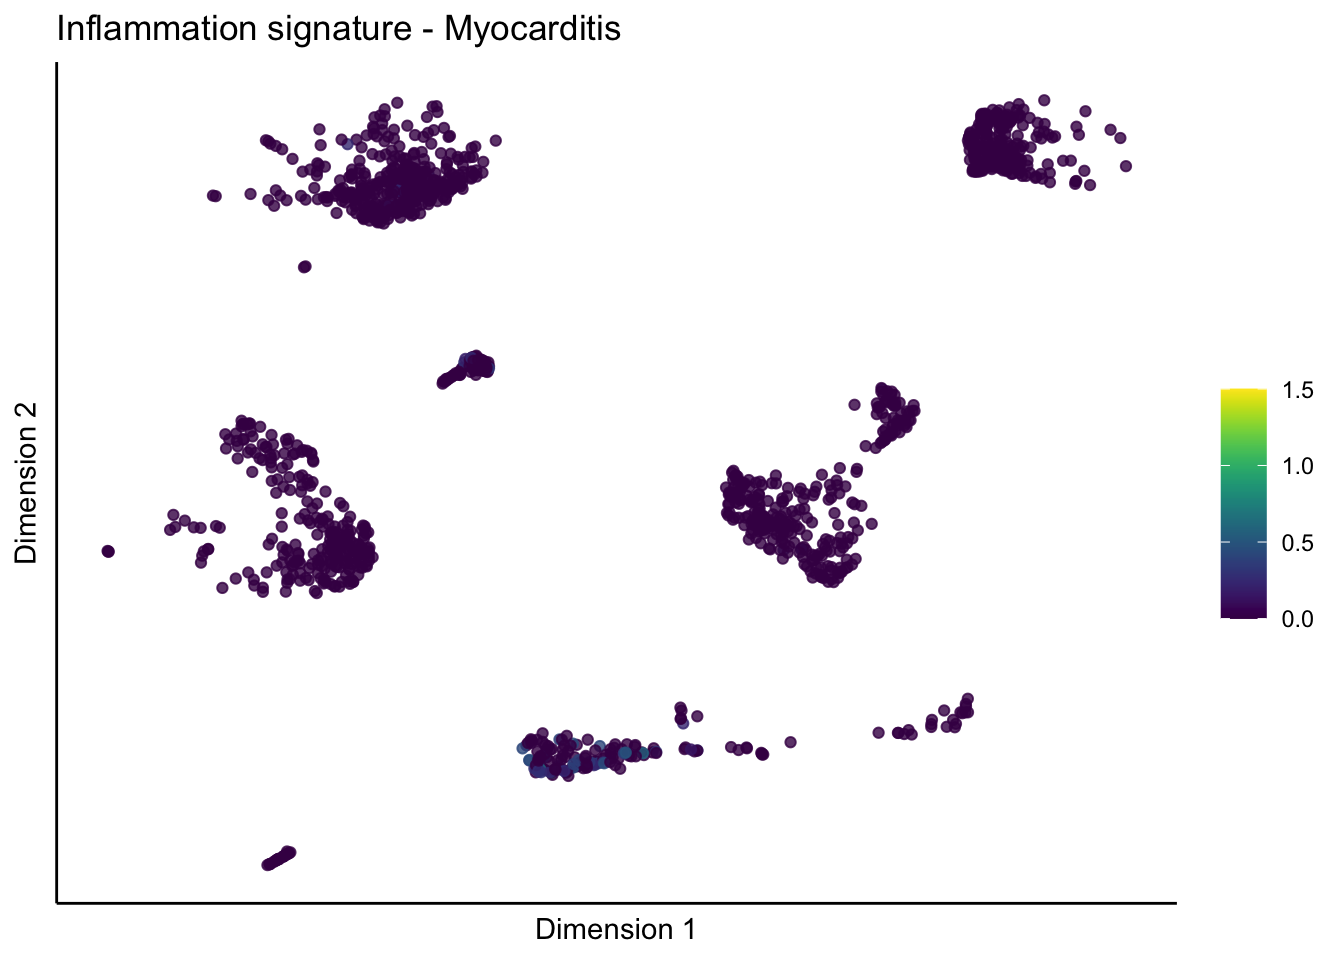
[[3]]
[[3]][[1]]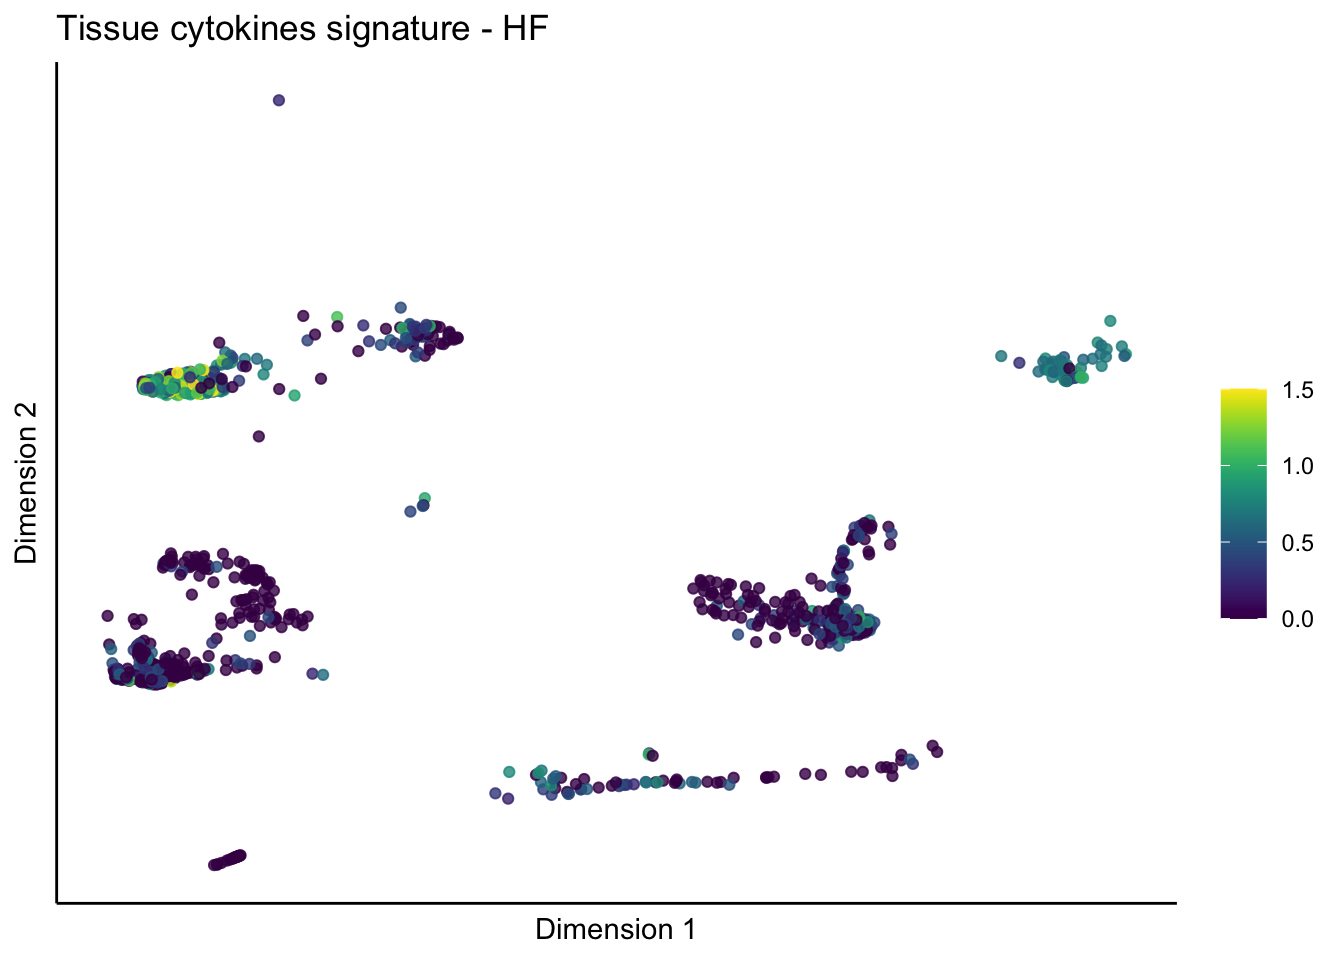
[[3]][[2]]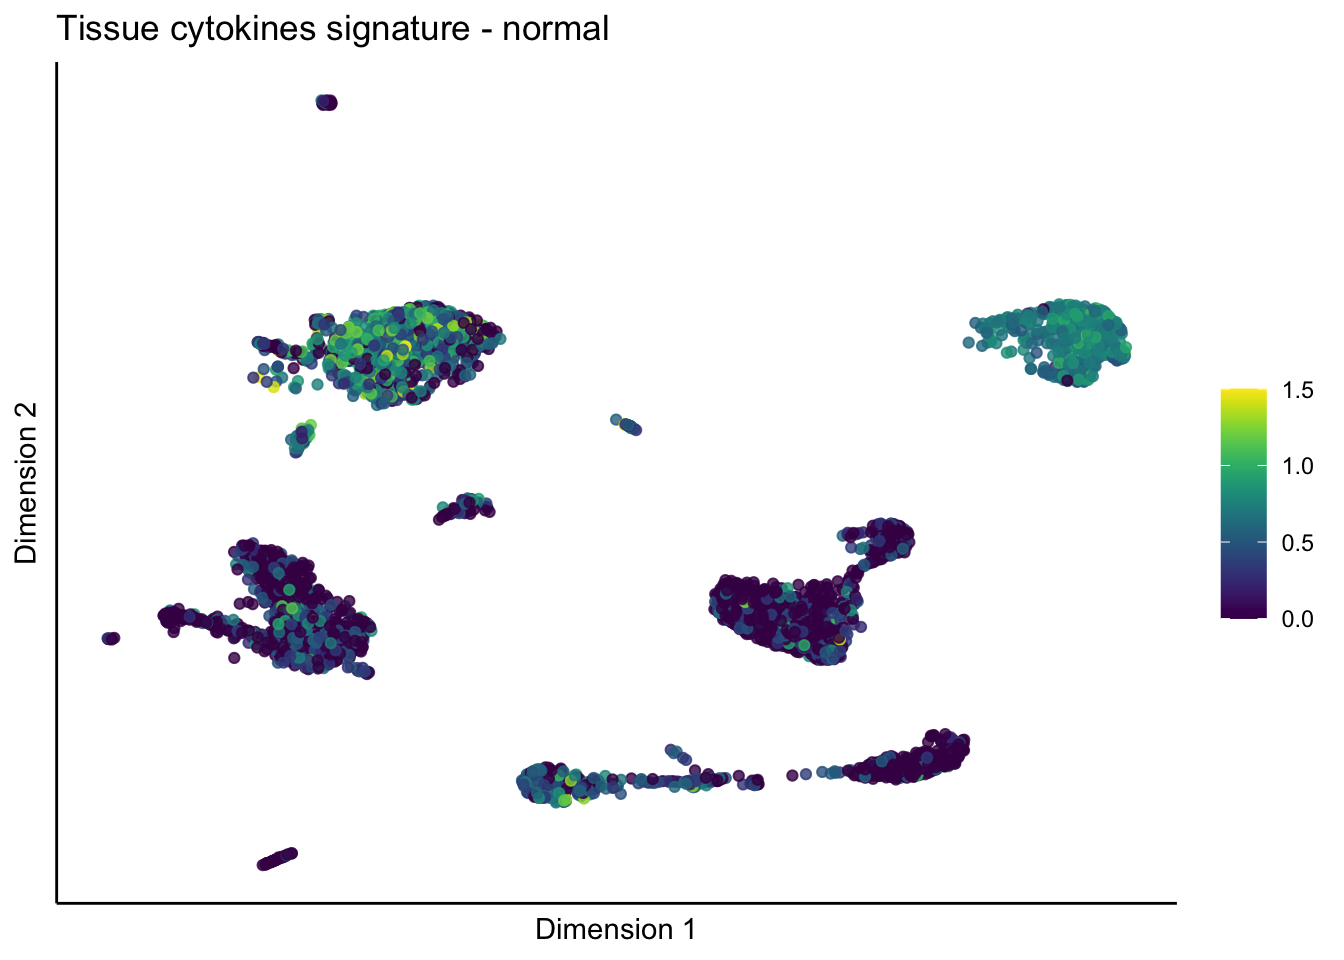
[[3]][[3]]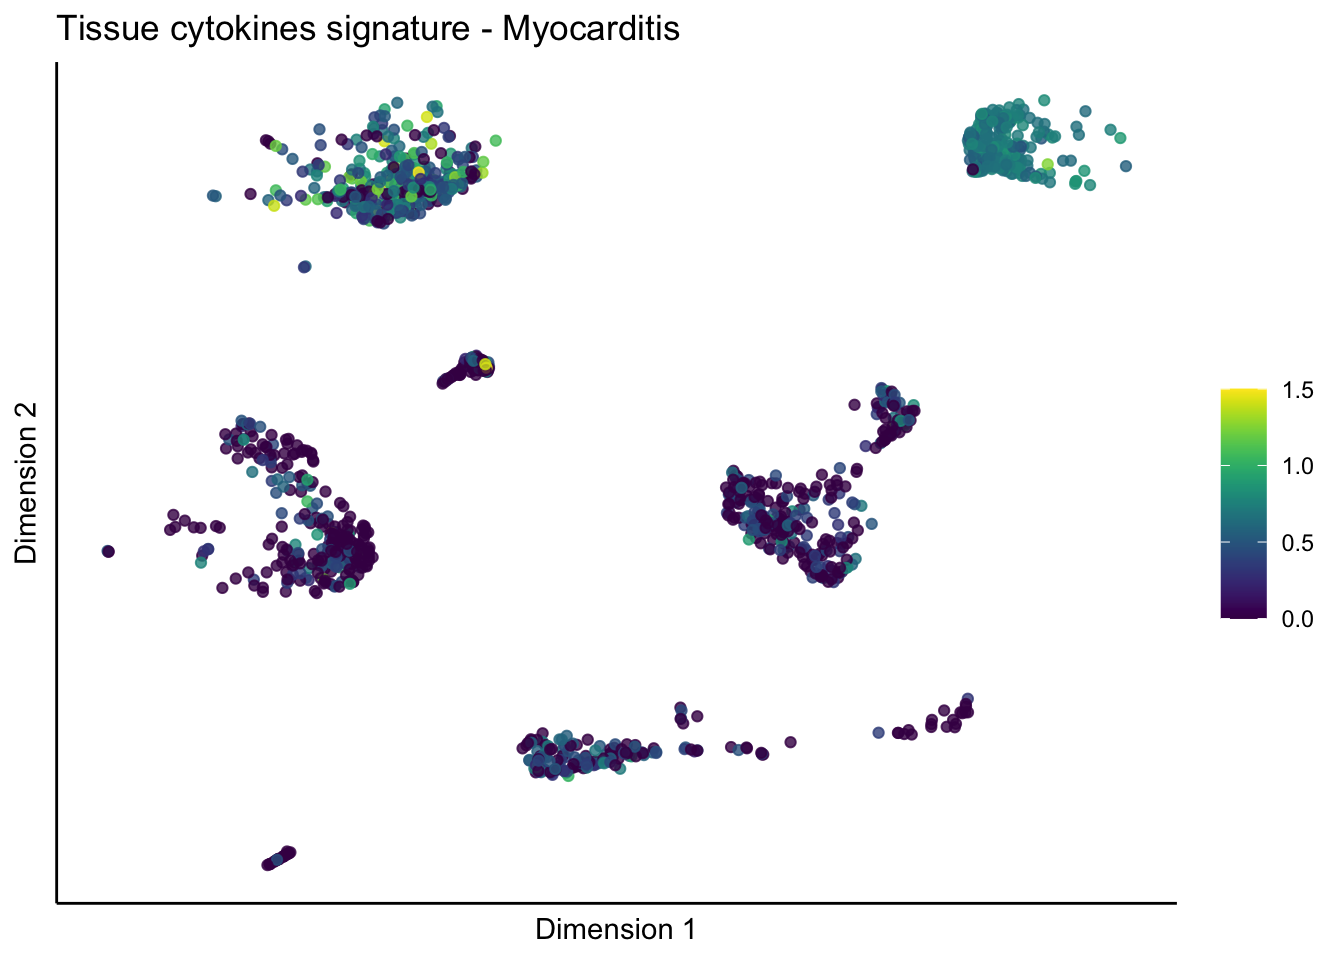
[[4]]
[[4]][[1]]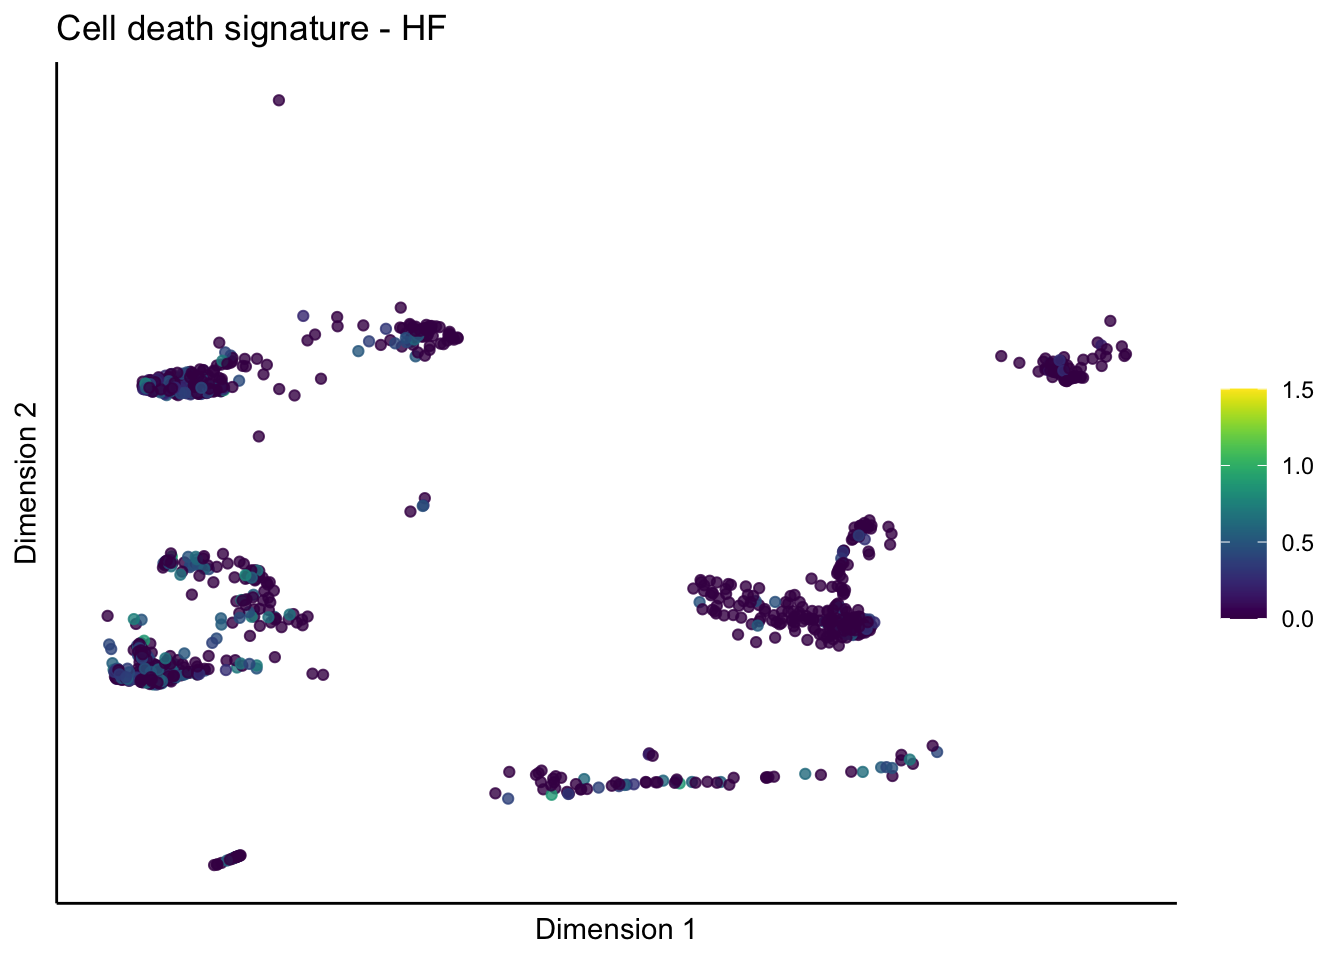
[[4]][[2]]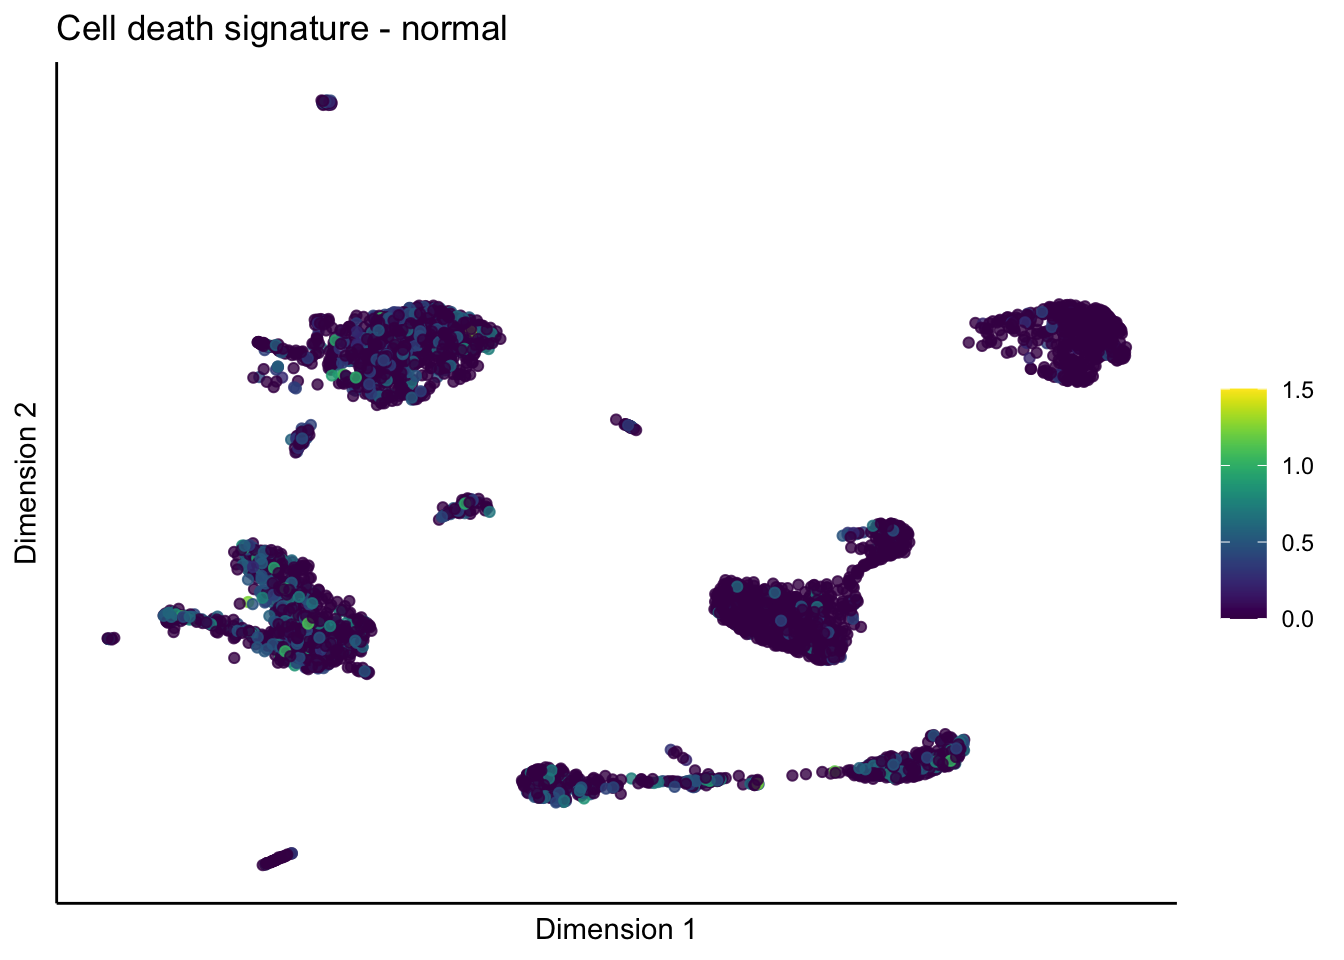
[[4]][[3]]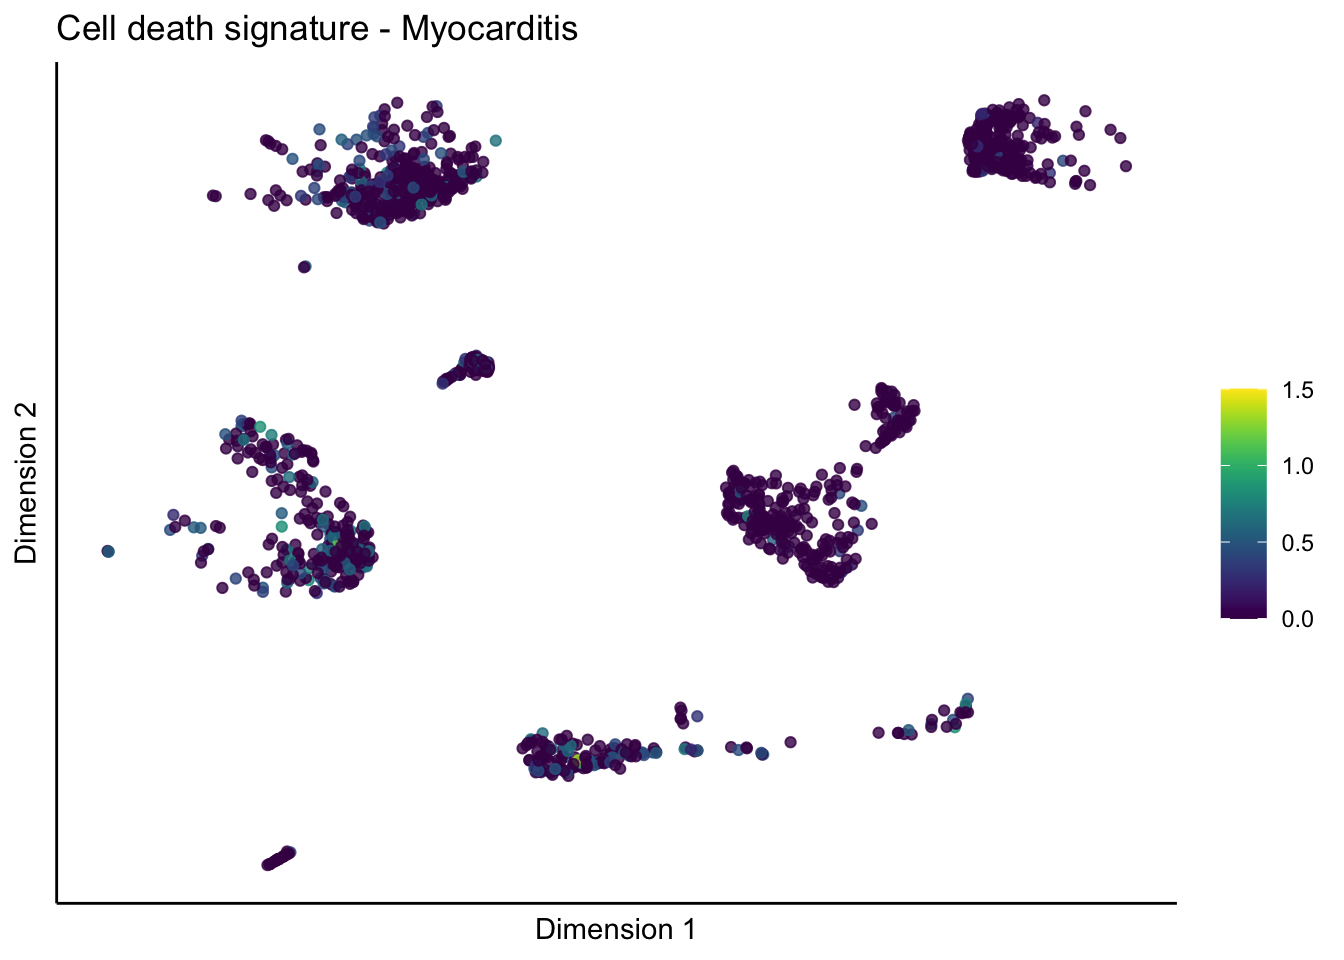
[[5]]
[[5]][[1]]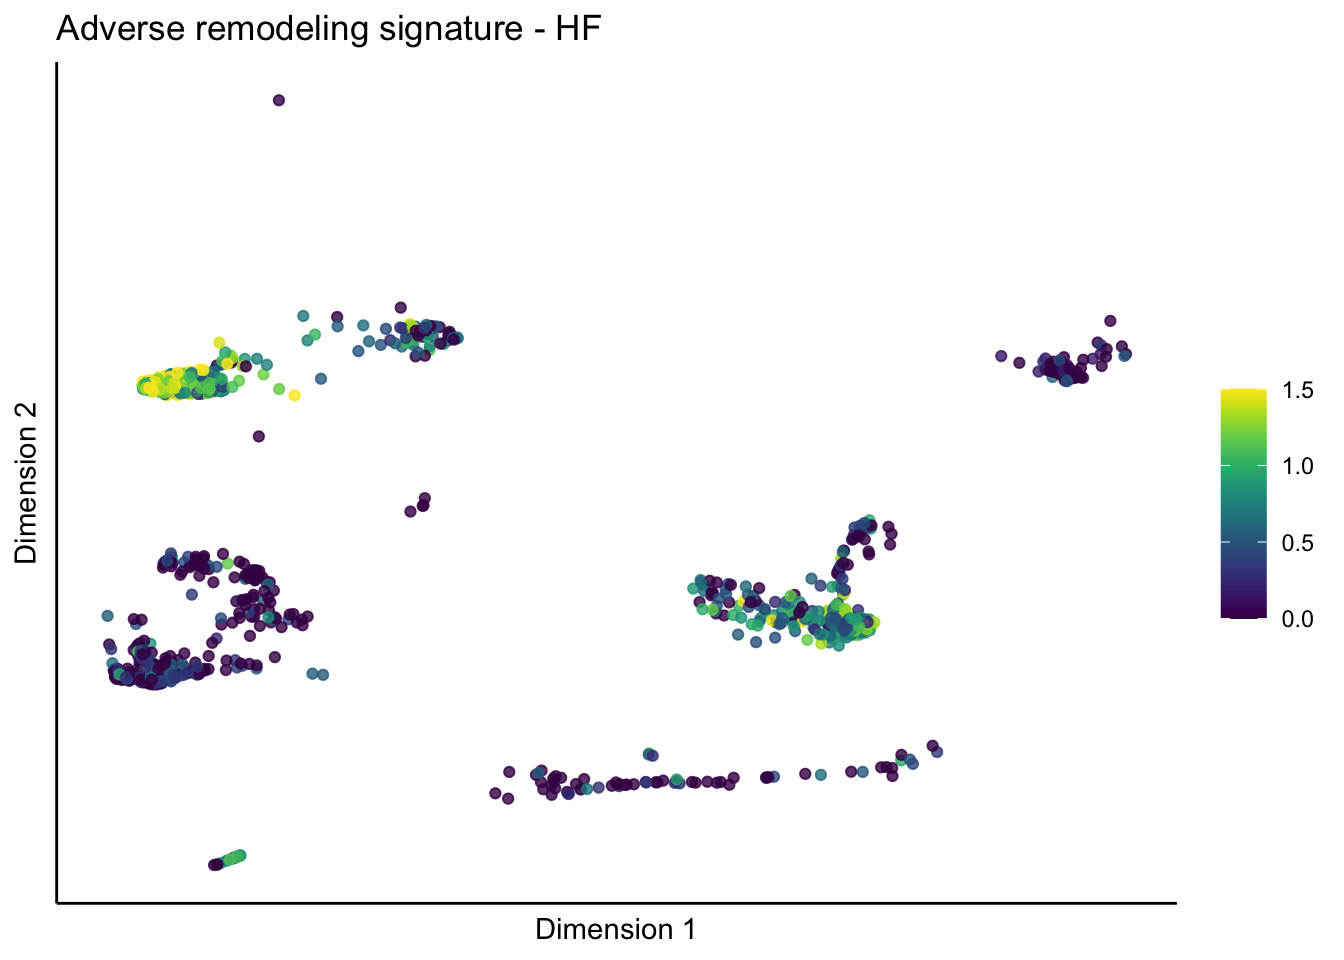
[[5]][[2]]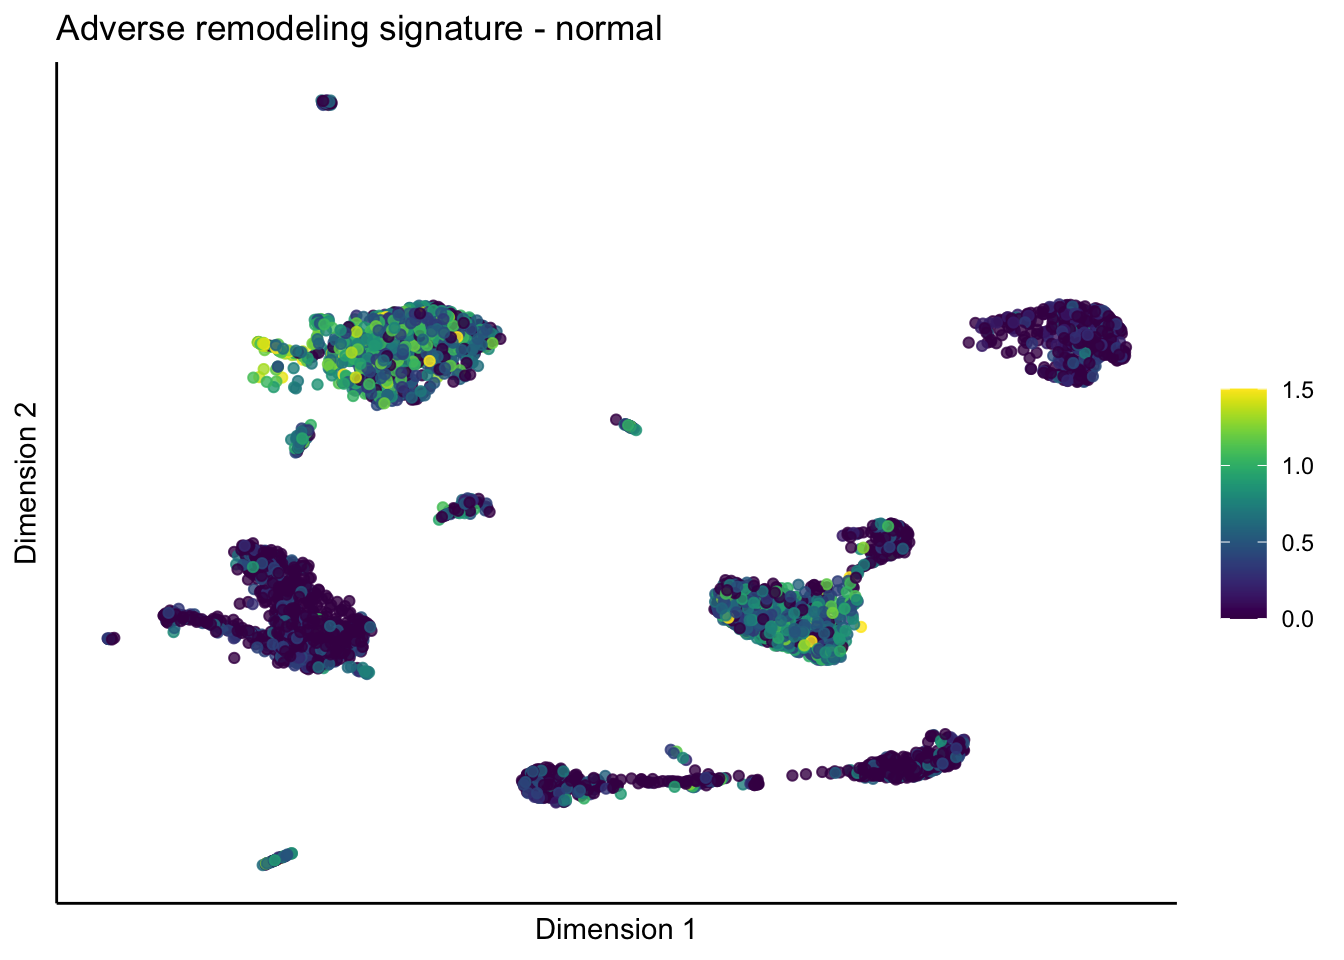
[[5]][[3]]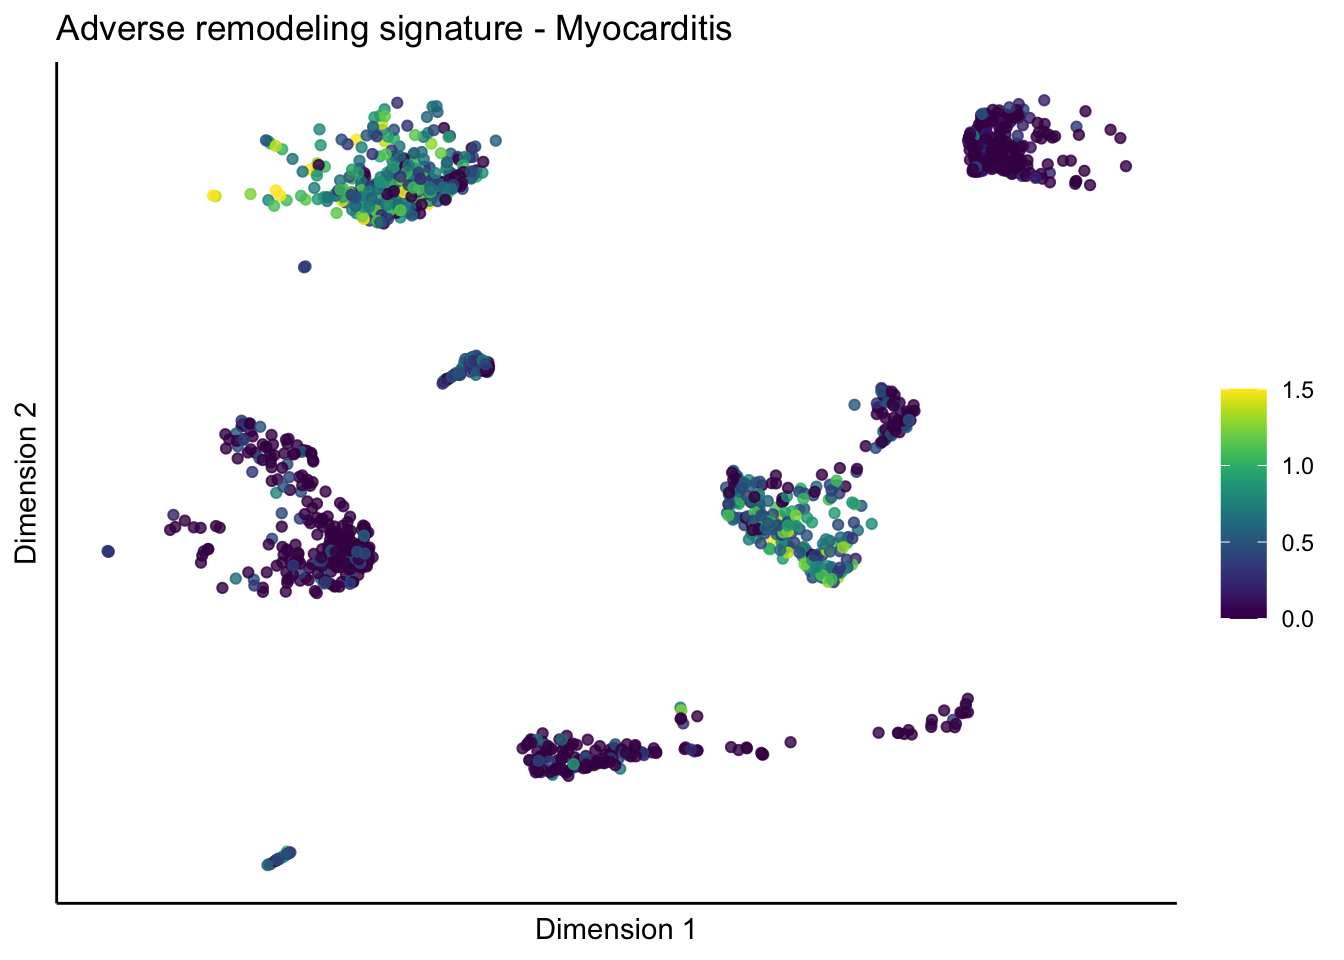
across all
sce <- as.SingleCellExperiment(seurat)

cutOff <- 1.5
pal = viridis(100)
sc <- scale_colour_gradientn(colours = pal, limits=c(0, cutOff))

lapply(unique(signDat$signature), function(sign){
  signGenes <- signDat %>% dplyr::filter(signature == sign)
  sceSub <- sce[which(rownames(sce) %in% signGenes$geneID),]
  cntMat <- rowSums(t(as.matrix(sceSub@assays@data$logcounts)))/nrow(signGenes)
  sceSub$sign <- cntMat
  sceSub$sign[which(sceSub$sign > cutOff)] <- cutOff
  sceSub$sign[which(sceSub$sign < 0)] <- 0
    p <- visGroup_adapt(sceSub, 'sign', dim_red = 'UMAP') +
    sc +
    guides(colour = guide_colourbar(title = '')) +
    ggtitle(paste0(sign, ' signature - across all')) +
    theme_classic() +
    theme(axis.text = element_blank(),
          axis.ticks = element_blank()) +
    labs(x='Dimension 1', y='Dimension 2')
    p

})
[[1]]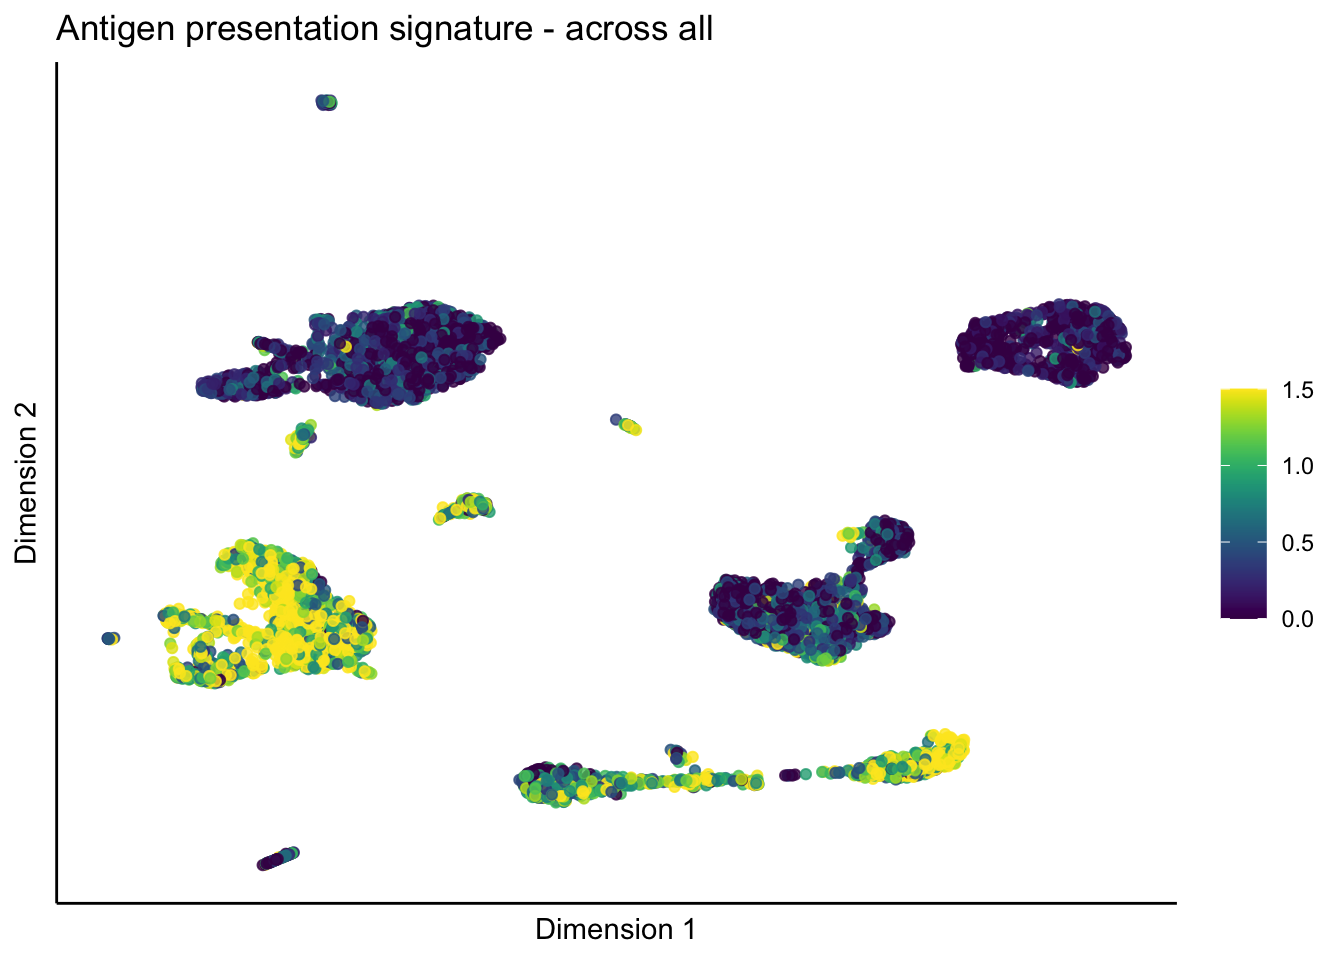
[[2]]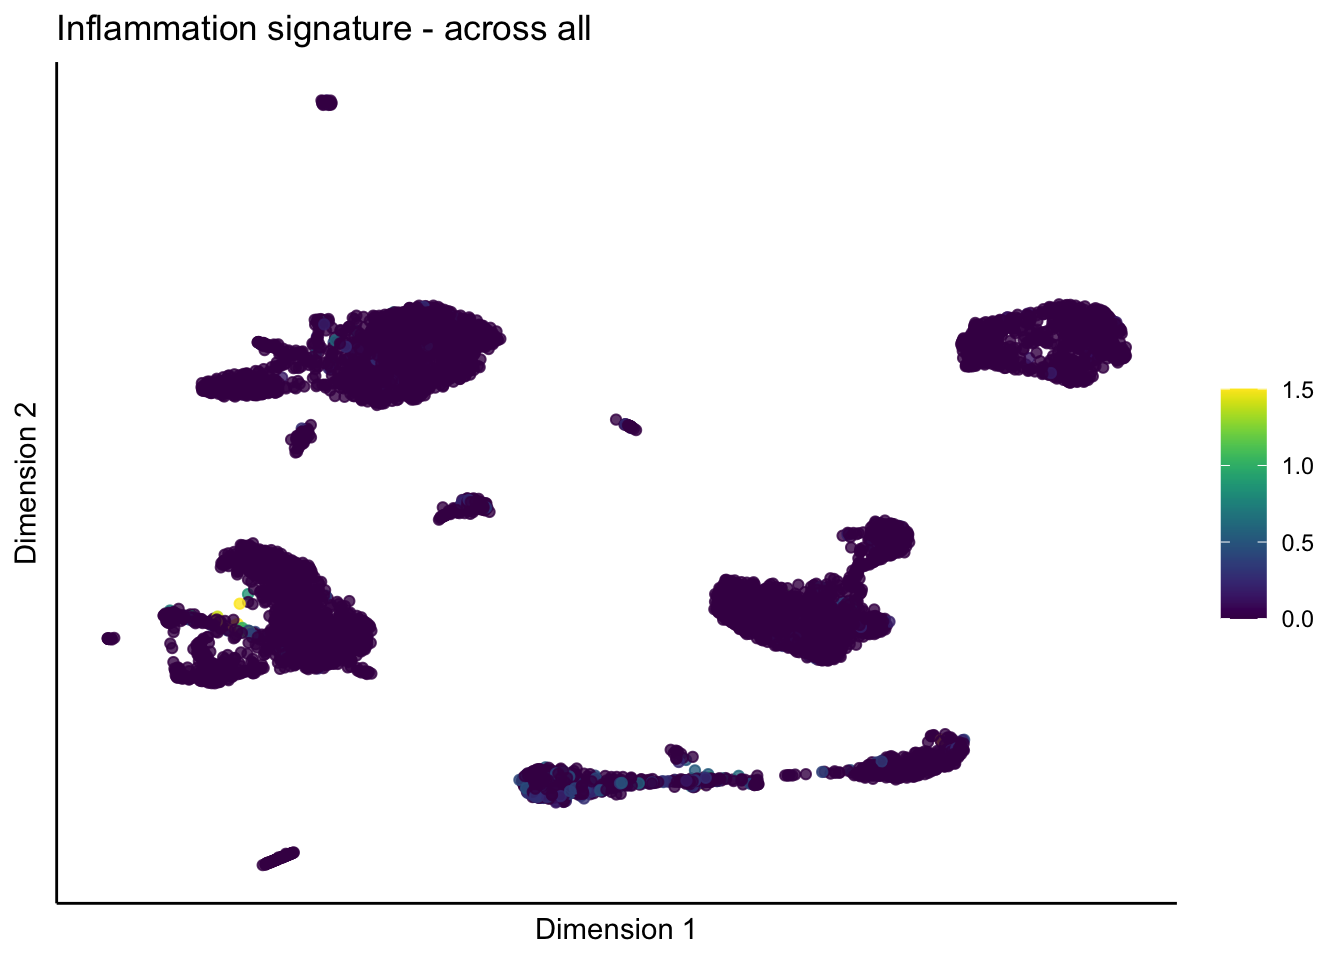
[[3]]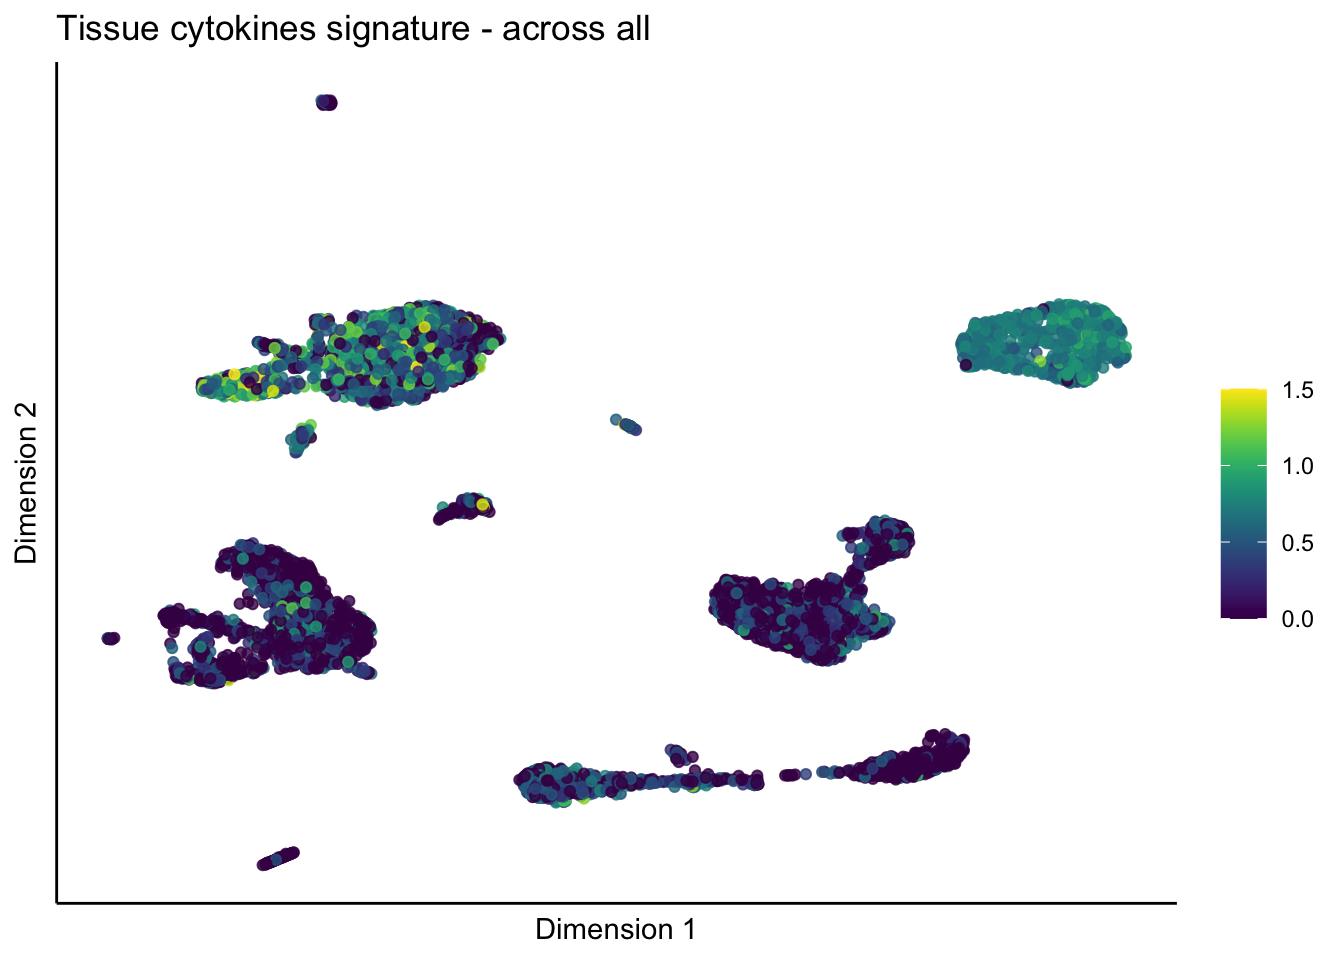
[[4]]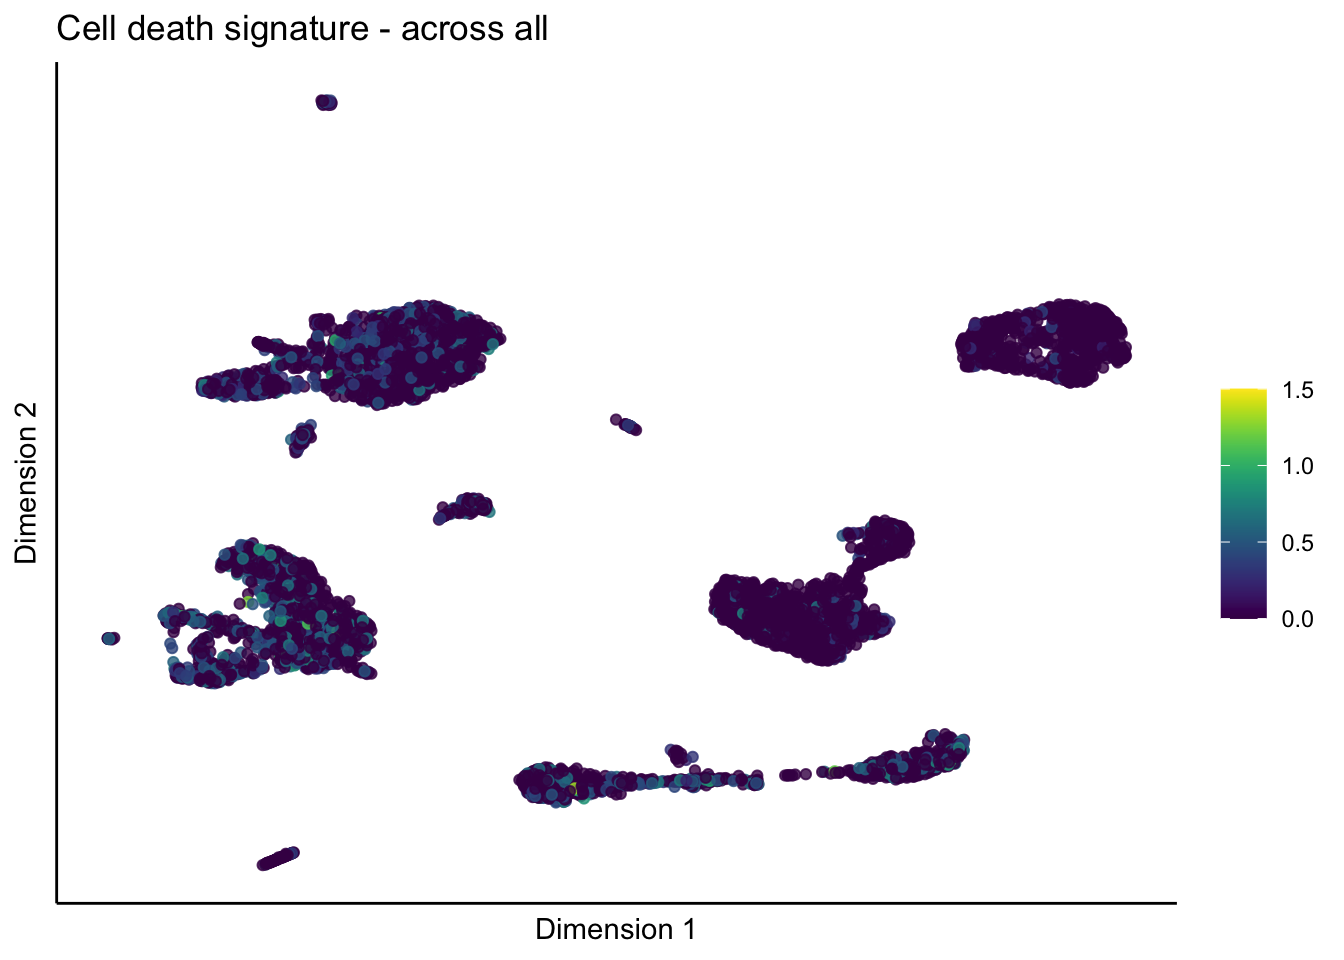
[[5]]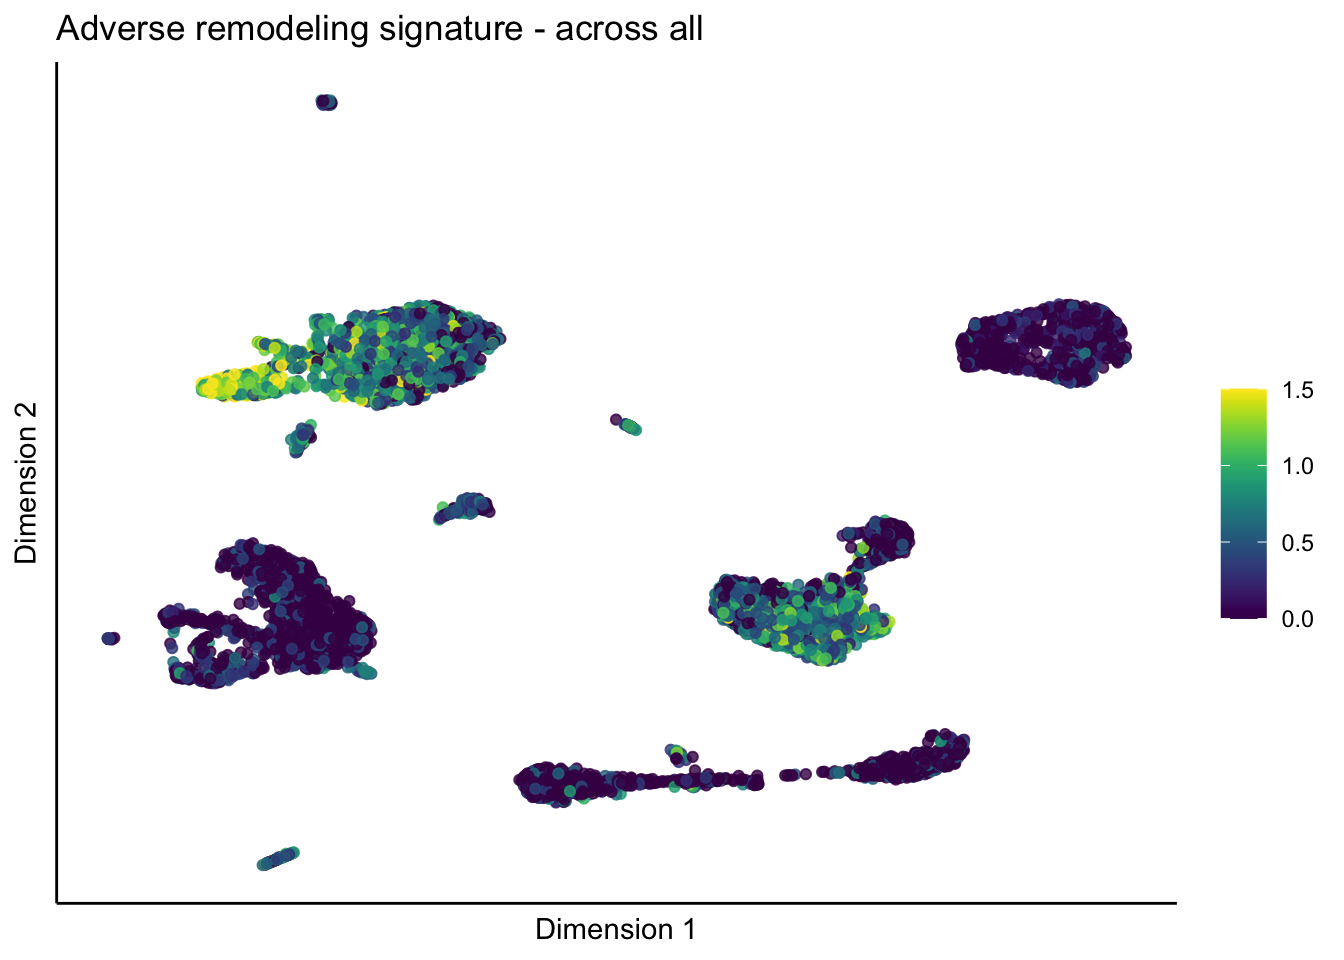
save objects
Idents(seurat) <- Idents(seurat) <- seurat$RNA_snn_res.0.25
saveRDS(seurat, file = paste0(basedir,
                              "/data/humanHearts_merged_Normal_HF_Myocarditis_woECMO4_seurat.rds"))

saveRDS(seuratSub, file = paste0(basedir,
                              "/data/humanHearts_merged_Normal_Myocarditis_woECMO4_seurat.rds"))

saveRDS(seuratSub2, file = paste0(basedir,
                              "/data/humanHearts_merged_Normal_HF_woECMO4_seurat.rds"))

write.table(DEgenes,
            file=paste0(basedir,
                        "/data/humanHearts_NORMALvsHFvsMYO__woECMO4_overallDEGenes.txt"),
            row.names = FALSE, col.names = TRUE, quote = FALSE, sep = "\t")
session info
sessionInfo()R version 4.1.0 (2021-05-18)
Platform: x86_64-apple-darwin17.0 (64-bit)
Running under: macOS Catalina 10.15.7
Matrix products: default
BLAS: /Library/Frameworks/R.framework/Versions/4.1/Resources/lib/libRblas.dylib
LAPACK: /Library/Frameworks/R.framework/Versions/4.1/Resources/lib/libRlapack.dylib
locale:
[1] en_US.UTF-8/en_US.UTF-8/en_US.UTF-8/C/en_US.UTF-8/en_US.UTF-8
attached base packages:
[1] parallel stats4 stats graphics grDevices utils datasets
[8] methods base
other attached packages:
[1] viridis_0.6.2 viridisLite_0.4.0
[3] pheatmap_1.0.12 ggpubr_0.4.0
[5] ggsci_2.9 runSeurat3_0.1.0
[7] here_1.0.1 magrittr_2.0.3
[9] SeuratObject_4.0.4 Seurat_4.1.0
[11] forcats_0.5.1 stringr_1.4.0
[13] dplyr_1.0.8 purrr_0.3.4
[15] readr_2.1.2 tidyr_1.2.0
[17] tibble_3.1.6 ggplot2_3.3.5
[19] tidyverse_1.3.1 SingleCellExperiment_1.14.1
[21] SummarizedExperiment_1.22.0 Biobase_2.52.0
[23] GenomicRanges_1.44.0 GenomeInfoDb_1.28.4
[25] IRanges_2.26.0 S4Vectors_0.30.2
[27] BiocGenerics_0.38.0 MatrixGenerics_1.4.3
[29] matrixStats_0.61.0
loaded via a namespace (and not attached):
[1] utf8_1.2.2 reticulate_1.24 tidyselect_1.1.2
[4] htmlwidgets_1.5.4 grid_4.1.0 Rtsne_0.15
[7] munsell_0.5.0 codetools_0.2-18 ica_1.0-2
[10] future_1.24.0 miniUI_0.1.1.1 withr_2.5.0
[13] spatstat.random_2.2-0 colorspace_2.0-3 highr_0.9
[16] knitr_1.38 rstudioapi_0.13 ROCR_1.0-11
[19] ggsignif_0.6.3 tensor_1.5 listenv_0.8.0
[22] labeling_0.4.2 git2r_0.30.1 GenomeInfoDbData_1.2.6
[25] polyclip_1.10-0 bit64_4.0.5 farver_2.1.0
[28] rprojroot_2.0.3 parallelly_1.31.0 vctrs_0.4.1
[31] generics_0.1.2 xfun_0.30 R6_2.5.1
[34] bitops_1.0-7 spatstat.utils_2.3-0 DelayedArray_0.18.0
[37] assertthat_0.2.1 vroom_1.5.7 promises_1.2.0.1
[40] scales_1.2.0 gtable_0.3.0 globals_0.14.0
[43] goftest_1.2-3 workflowr_1.7.0 rlang_1.0.2
[46] splines_4.1.0 rstatix_0.7.0 lazyeval_0.2.2
[49] spatstat.geom_2.4-0 broom_0.8.0 yaml_2.3.5
[52] reshape2_1.4.4 abind_1.4-5 modelr_0.1.8
[55] backports_1.4.1 httpuv_1.6.5 tools_4.1.0
[58] ellipsis_0.3.2 spatstat.core_2.4-2 jquerylib_0.1.4
[61] RColorBrewer_1.1-3 ggridges_0.5.3 Rcpp_1.0.8.3
[64] plyr_1.8.7 zlibbioc_1.38.0 RCurl_1.98-1.6
[67] rpart_4.1.16 deldir_1.0-6 pbapply_1.5-0
[70] cowplot_1.1.1 zoo_1.8-9 haven_2.4.3
[73] ggrepel_0.9.1 cluster_2.1.3 fs_1.5.2
[76] data.table_1.14.2 RSpectra_0.16-0 scattermore_0.8
[79] lmtest_0.9-40 reprex_2.0.1 RANN_2.6.1
[82] fitdistrplus_1.1-8 hms_1.1.1 patchwork_1.1.1
[85] mime_0.12 evaluate_0.15 xtable_1.8-4
[88] readxl_1.4.0 gridExtra_2.3 compiler_4.1.0
[91] KernSmooth_2.23-20 crayon_1.5.1 htmltools_0.5.2
[94] mgcv_1.8-40 later_1.3.0 tzdb_0.3.0
[97] lubridate_1.8.0 DBI_1.1.2 dbplyr_2.1.1
[100] MASS_7.3-56 Matrix_1.4-1 car_3.0-12
[103] cli_3.2.0 igraph_1.3.0 pkgconfig_2.0.3
[106] plotly_4.10.0 spatstat.sparse_2.1-0 xml2_1.3.3
[109] bslib_0.3.1 XVector_0.32.0 rvest_1.0.2
[112] digest_0.6.29 sctransform_0.3.3 RcppAnnoy_0.0.19
[115] spatstat.data_2.1-4 rmarkdown_2.13 cellranger_1.1.0
[118] leiden_0.3.9 uwot_0.1.11 shiny_1.7.1
[121] lifecycle_1.0.1 nlme_3.1-157 jsonlite_1.8.0
[124] carData_3.0-5 limma_3.48.3 fansi_1.0.3
[127] pillar_1.7.0 lattice_0.20-45 fastmap_1.1.0
[130] httr_1.4.2 survival_3.3-1 glue_1.6.2
[133] png_0.1-7 bit_4.0.4 stringi_1.7.6
[136] sass_0.4.1 irlba_2.3.5 future.apply_1.8.1 date()[1] "Mon May 2 17:25:32 2022"
sessionInfo()R version 4.1.0 (2021-05-18)
Platform: x86_64-apple-darwin17.0 (64-bit)
Running under: macOS Catalina 10.15.7
Matrix products: default
BLAS: /Library/Frameworks/R.framework/Versions/4.1/Resources/lib/libRblas.dylib
LAPACK: /Library/Frameworks/R.framework/Versions/4.1/Resources/lib/libRlapack.dylib
locale:
[1] en_US.UTF-8/en_US.UTF-8/en_US.UTF-8/C/en_US.UTF-8/en_US.UTF-8
attached base packages:
[1] parallel stats4 stats graphics grDevices utils datasets
[8] methods base
other attached packages:
[1] viridis_0.6.2 viridisLite_0.4.0
[3] pheatmap_1.0.12 ggpubr_0.4.0
[5] ggsci_2.9 runSeurat3_0.1.0
[7] here_1.0.1 magrittr_2.0.3
[9] SeuratObject_4.0.4 Seurat_4.1.0
[11] forcats_0.5.1 stringr_1.4.0
[13] dplyr_1.0.8 purrr_0.3.4
[15] readr_2.1.2 tidyr_1.2.0
[17] tibble_3.1.6 ggplot2_3.3.5
[19] tidyverse_1.3.1 SingleCellExperiment_1.14.1
[21] SummarizedExperiment_1.22.0 Biobase_2.52.0
[23] GenomicRanges_1.44.0 GenomeInfoDb_1.28.4
[25] IRanges_2.26.0 S4Vectors_0.30.2
[27] BiocGenerics_0.38.0 MatrixGenerics_1.4.3
[29] matrixStats_0.61.0
loaded via a namespace (and not attached):
[1] utf8_1.2.2 reticulate_1.24 tidyselect_1.1.2
[4] htmlwidgets_1.5.4 grid_4.1.0 Rtsne_0.15
[7] munsell_0.5.0 codetools_0.2-18 ica_1.0-2
[10] future_1.24.0 miniUI_0.1.1.1 withr_2.5.0
[13] spatstat.random_2.2-0 colorspace_2.0-3 highr_0.9
[16] knitr_1.38 rstudioapi_0.13 ROCR_1.0-11
[19] ggsignif_0.6.3 tensor_1.5 listenv_0.8.0
[22] labeling_0.4.2 git2r_0.30.1 GenomeInfoDbData_1.2.6
[25] polyclip_1.10-0 bit64_4.0.5 farver_2.1.0
[28] rprojroot_2.0.3 parallelly_1.31.0 vctrs_0.4.1
[31] generics_0.1.2 xfun_0.30 R6_2.5.1
[34] bitops_1.0-7 spatstat.utils_2.3-0 DelayedArray_0.18.0
[37] assertthat_0.2.1 vroom_1.5.7 promises_1.2.0.1
[40] scales_1.2.0 gtable_0.3.0 globals_0.14.0
[43] goftest_1.2-3 workflowr_1.7.0 rlang_1.0.2
[46] splines_4.1.0 rstatix_0.7.0 lazyeval_0.2.2
[49] spatstat.geom_2.4-0 broom_0.8.0 yaml_2.3.5
[52] reshape2_1.4.4 abind_1.4-5 modelr_0.1.8
[55] backports_1.4.1 httpuv_1.6.5 tools_4.1.0
[58] ellipsis_0.3.2 spatstat.core_2.4-2 jquerylib_0.1.4
[61] RColorBrewer_1.1-3 ggridges_0.5.3 Rcpp_1.0.8.3
[64] plyr_1.8.7 zlibbioc_1.38.0 RCurl_1.98-1.6
[67] rpart_4.1.16 deldir_1.0-6 pbapply_1.5-0
[70] cowplot_1.1.1 zoo_1.8-9 haven_2.4.3
[73] ggrepel_0.9.1 cluster_2.1.3 fs_1.5.2
[76] data.table_1.14.2 RSpectra_0.16-0 scattermore_0.8
[79] lmtest_0.9-40 reprex_2.0.1 RANN_2.6.1
[82] fitdistrplus_1.1-8 hms_1.1.1 patchwork_1.1.1
[85] mime_0.12 evaluate_0.15 xtable_1.8-4
[88] readxl_1.4.0 gridExtra_2.3 compiler_4.1.0
[91] KernSmooth_2.23-20 crayon_1.5.1 htmltools_0.5.2
[94] mgcv_1.8-40 later_1.3.0 tzdb_0.3.0
[97] lubridate_1.8.0 DBI_1.1.2 dbplyr_2.1.1
[100] MASS_7.3-56 Matrix_1.4-1 car_3.0-12
[103] cli_3.2.0 igraph_1.3.0 pkgconfig_2.0.3
[106] plotly_4.10.0 spatstat.sparse_2.1-0 xml2_1.3.3
[109] bslib_0.3.1 XVector_0.32.0 rvest_1.0.2
[112] digest_0.6.29 sctransform_0.3.3 RcppAnnoy_0.0.19
[115] spatstat.data_2.1-4 rmarkdown_2.13 cellranger_1.1.0
[118] leiden_0.3.9 uwot_0.1.11 shiny_1.7.1
[121] lifecycle_1.0.1 nlme_3.1-157 jsonlite_1.8.0
[124] carData_3.0-5 limma_3.48.3 fansi_1.0.3
[127] pillar_1.7.0 lattice_0.20-45 fastmap_1.1.0
[130] httr_1.4.2 survival_3.3-1 glue_1.6.2
[133] png_0.1-7 bit_4.0.4 stringi_1.7.6
[136] sass_0.4.1 irlba_2.3.5 future.apply_1.8.1