Last updated: 2020-03-22
Checks: 7 0
Knit directory: 2019-feature-selection/
This reproducible R Markdown analysis was created with workflowr (version 1.6.1). The Checks tab describes the reproducibility checks that were applied when the results were created. The Past versions tab lists the development history.
Great! Since the R Markdown file has been committed to the Git repository, you know the exact version of the code that produced these results.
Great job! The global environment was empty. Objects defined in the global environment can affect the analysis in your R Markdown file in unknown ways. For reproduciblity it’s best to always run the code in an empty environment.
The command set.seed(20190522) was run prior to running the code in the R Markdown file. Setting a seed ensures that any results that rely on randomness, e.g. subsampling or permutations, are reproducible.
Great job! Recording the operating system, R version, and package versions is critical for reproducibility.
Nice! There were no cached chunks for this analysis, so you can be confident that you successfully produced the results during this run.
Great job! Using relative paths to the files within your workflowr project makes it easier to run your code on other machines.
Great! You are using Git for version control. Tracking code development and connecting the code version to the results is critical for reproducibility.
The results in this page were generated with repository version f61b799. See the Past versions tab to see a history of the changes made to the R Markdown and HTML files.
Note that you need to be careful to ensure that all relevant files for the analysis have been committed to Git prior to generating the results (you can use wflow_publish or wflow_git_commit). workflowr only checks the R Markdown file, but you know if there are other scripts or data files that it depends on. Below is the status of the Git repository when the results were generated:
Ignored files:
    Ignored:    .Rhistory
    Ignored:    .Rproj.user/
    Ignored:    .Ruserdata/
    Ignored:    .drake/
    Ignored:    .vscode/
    Ignored:    analysis/rosm.cache/
    Ignored:    data/
    Ignored:    inst/Benchmark for Filter Methods for Feature Selection in High-Dimensional  Classification Data.pdf
    Ignored:    inst/study-area-map/._study-area.qgs
    Ignored:    inst/study-area-map/study-area.qgs~
    Ignored:    log/
    Ignored:    renv/library/
    Ignored:    renv/staging/
    Ignored:    reviews/
    Ignored:    rosm.cache/

Untracked files:
    Untracked:  code/06-modeling/project/

Unstaged changes:
    Modified:   .Rprofile
    Modified:   _drake.R
    Modified:   analysis/_site.yml
    Modified:   analysis/about.Rmd
    Modified:   analysis/eda.Rmd
    Modified:   analysis/eval-performance.Rmd
    Modified:   analysis/inspect-glmnet-models.Rmd
    Modified:   analysis/report-defoliation.Rmd
    Modified:   code/02-hyperspectral-processing.R
    Modified:   code/03-sentinel-processing.R
    Modified:   code/041-data-preprocessing-buffer2.R
    Modified:   code/051-tasks-buffer2.R
    Modified:   code/06-modeling/paper/02-param-sets.R
    Modified:   code/06-modeling/paper/03-learner.R
    Modified:   code/06-modeling/paper/04-filter-wrapper.R
    Modified:   code/06-modeling/paper/07-tune-wrapper.R
    Modified:   code/06-modeling/paper/08-train.R
    Modified:   code/06-modeling/paper/09-feature-importance.R
    Modified:   code/071-benchmark-matrix-buffer2.R
    Modified:   code/09-reports.R
Note that any generated files, e.g. HTML, png, CSS, etc., are not included in this status report because it is ok for generated content to have uncommitted changes.
These are the previous versions of the repository in which changes were made to the R Markdown (analysis/feature-importance.Rmd) and HTML (docs/feature-importance.html) files. If you’ve configured a remote Git repository (see ?wflow_git_remote), click on the hyperlinks in the table below to view the files as they were in that past version.
| File | Version | Author | Date | Message |
|---|---|---|---|---|
| Rmd | f61b799 | pat-s | 2020-03-22 | wflow_publish(knitr_in(“analysis/feature-importance.Rmd”), view = FALSE, |
| html | 72b9228 | pat-s | 2020-03-17 | Build site. |
| html | c3e1961 | pat-s | 2020-03-17 | Build site. |
| Rmd | 997567b | pat-s | 2020-03-17 | workflowr::wflow_publish(“analysis/feature-importance.Rmd”) |
| html | e252447 | pat-s | 2020-03-17 | Build site. |
| Rmd | 42abfde | pat-s | 2020-03-17 | workflowr::wflow_publish(“analysis/feature-importance.Rmd”) |
| html | 16366b0 | pat-s | 2020-03-05 | Build site. |
| Rmd | b37ee3b | pat-s | 2020-03-05 | wflow_publish(knitr_in(“analysis/feature-importance.Rmd”), view = |
| html | c57d17d | pat-s | 2020-03-05 | Build site. |
| Rmd | 8fcc9eb | pat-s | 2020-03-05 | wflow_publish(knitr_in(“analysis/feature-importance.Rmd”), view = |
| html | 0c15797 | pat-s | 2020-03-04 | Build site. |
| Rmd | 23b31c5 | pat-s | 2020-03-04 | wflow_publish(knitr_in(“analysis/feature-importance.Rmd”), view = |
| html | ac809cf | pat-s | 2020-03-03 | Build site. |
| Rmd | 07d8cb9 | pat-s | 2020-03-03 | wflow_publish(knitr_in(“analysis/feature-importance.Rmd”), view = |
| Rmd | 53a6b62 | pat-s | 2020-02-28 | save feature-importance state |
| Rmd | 518d0cb | pat-s | 2019-09-01 | style files using tidyverse style |
| Rmd | d7df860 | pat-s | 2019-07-10 | add feat imp plan |
| Rmd | 3999cd9 | pat-s | 2019-06-30 | add feature importance report |
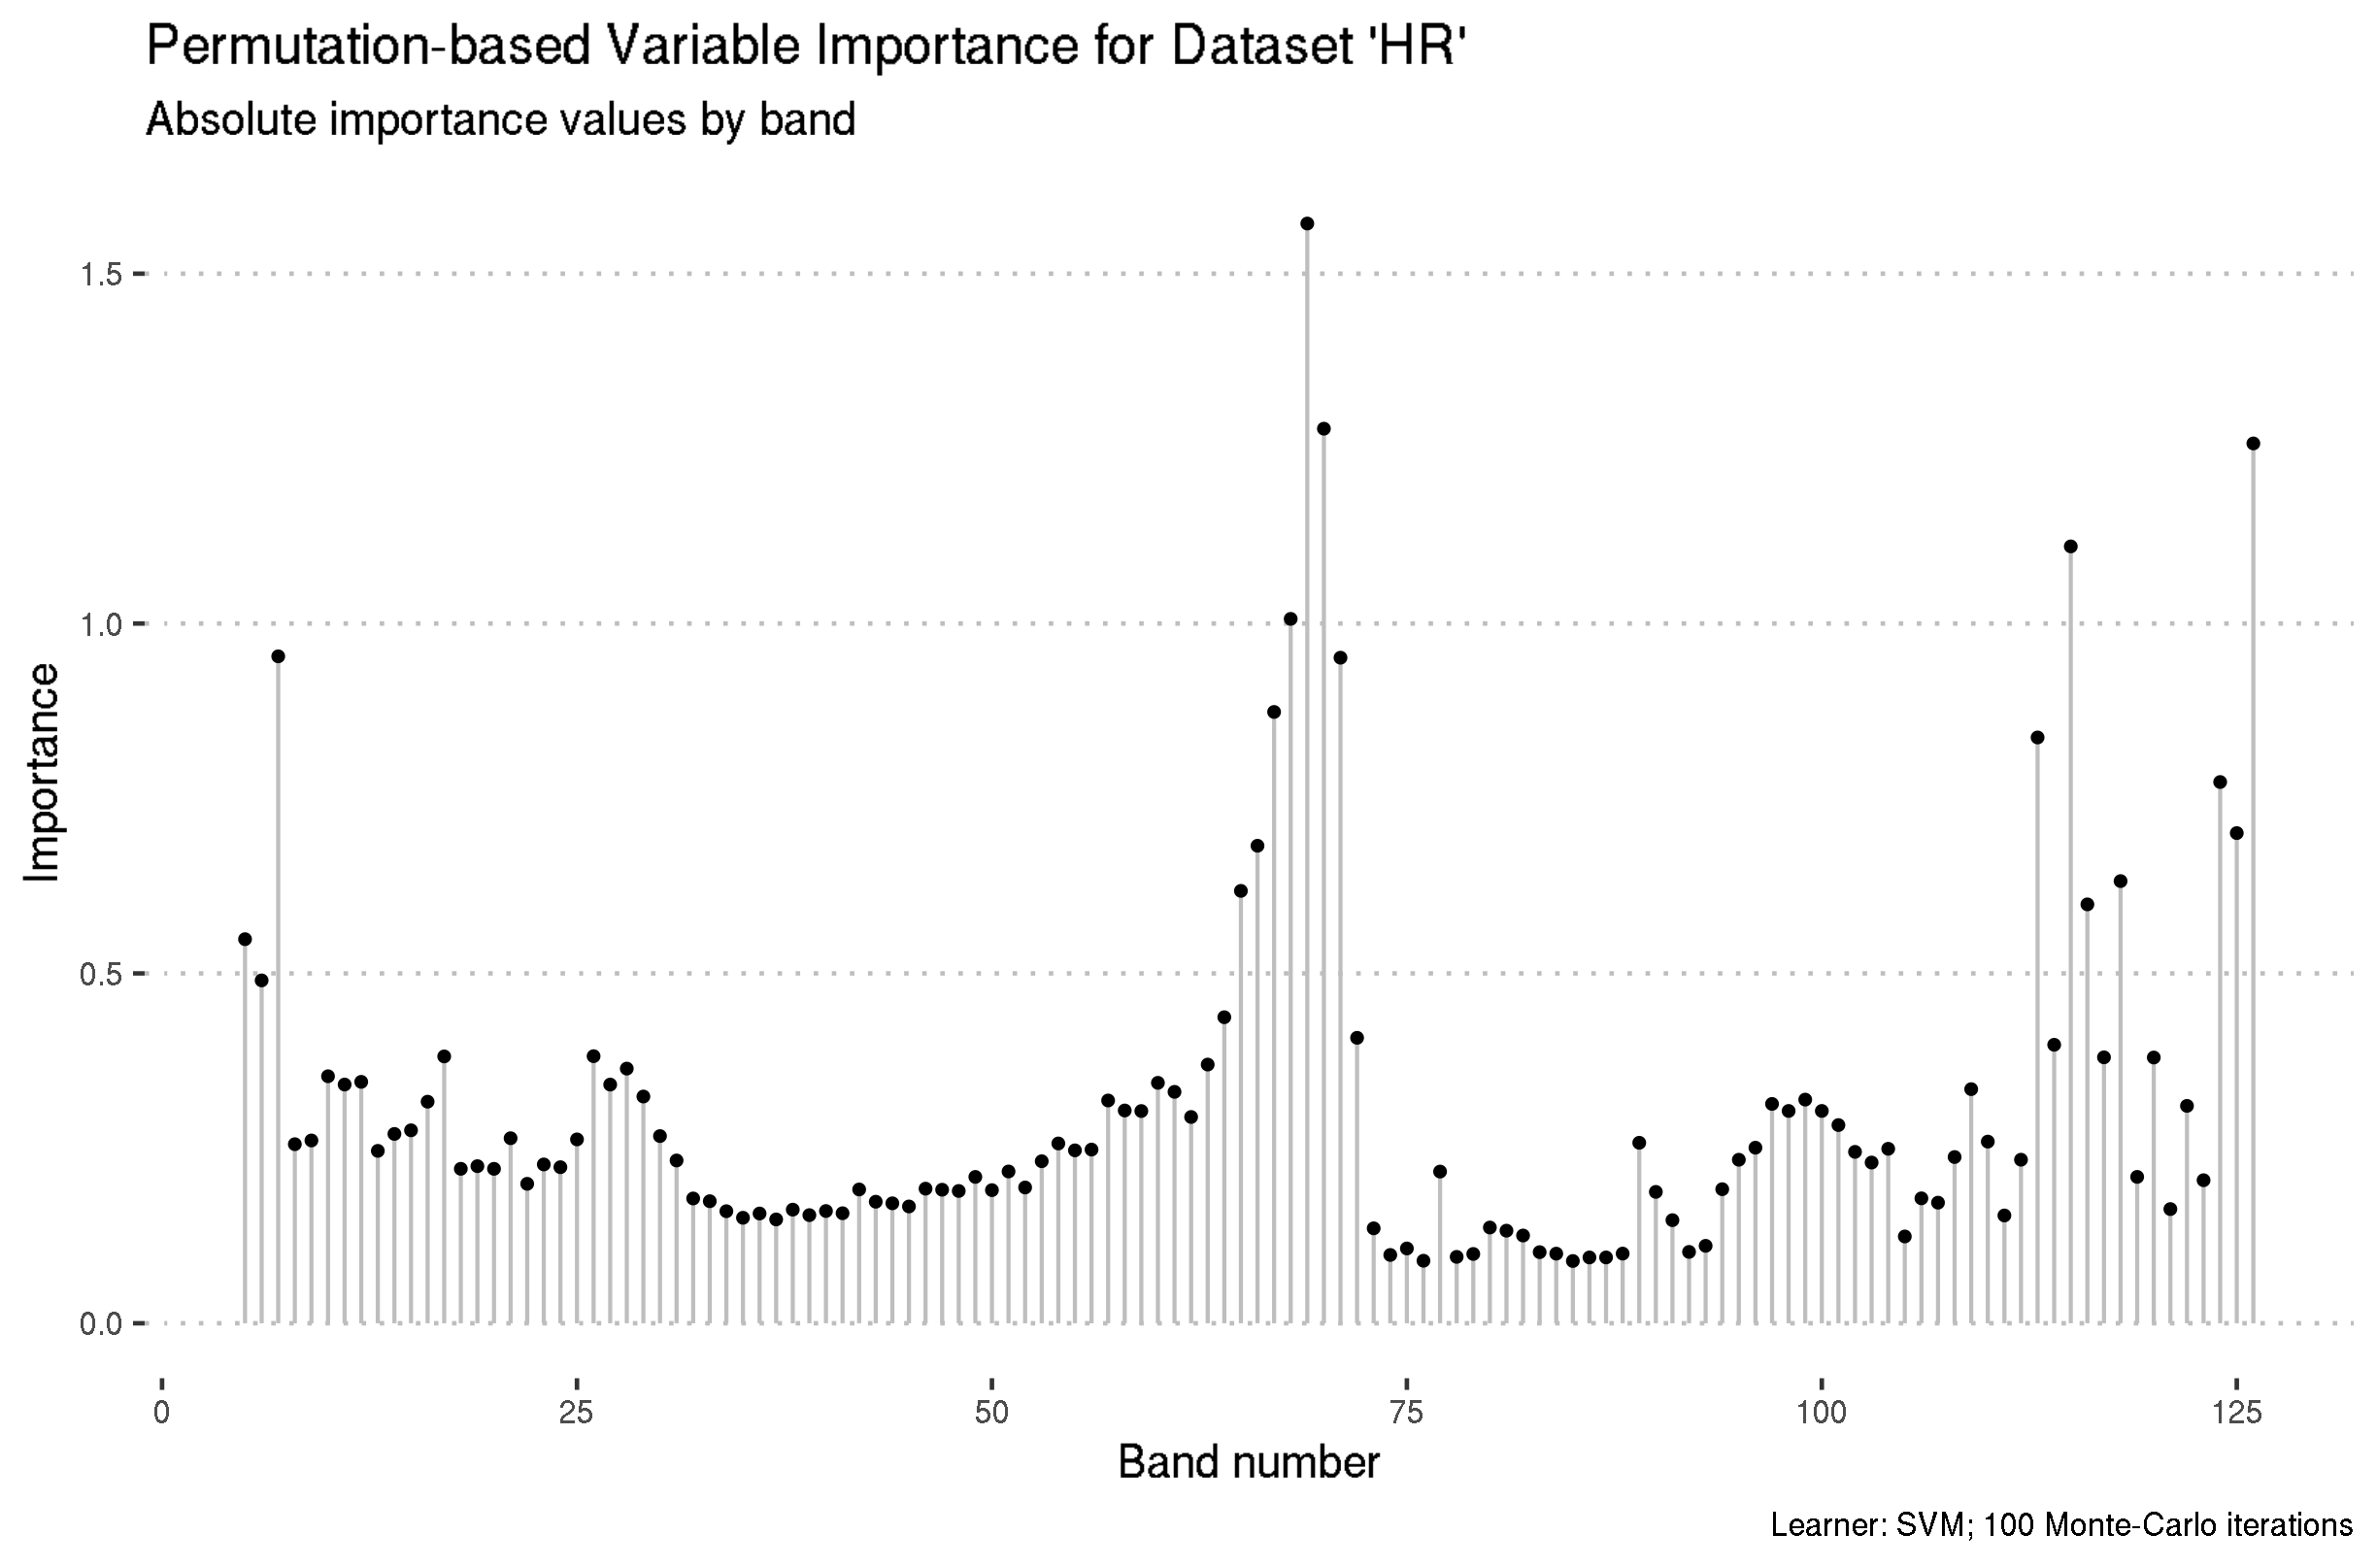
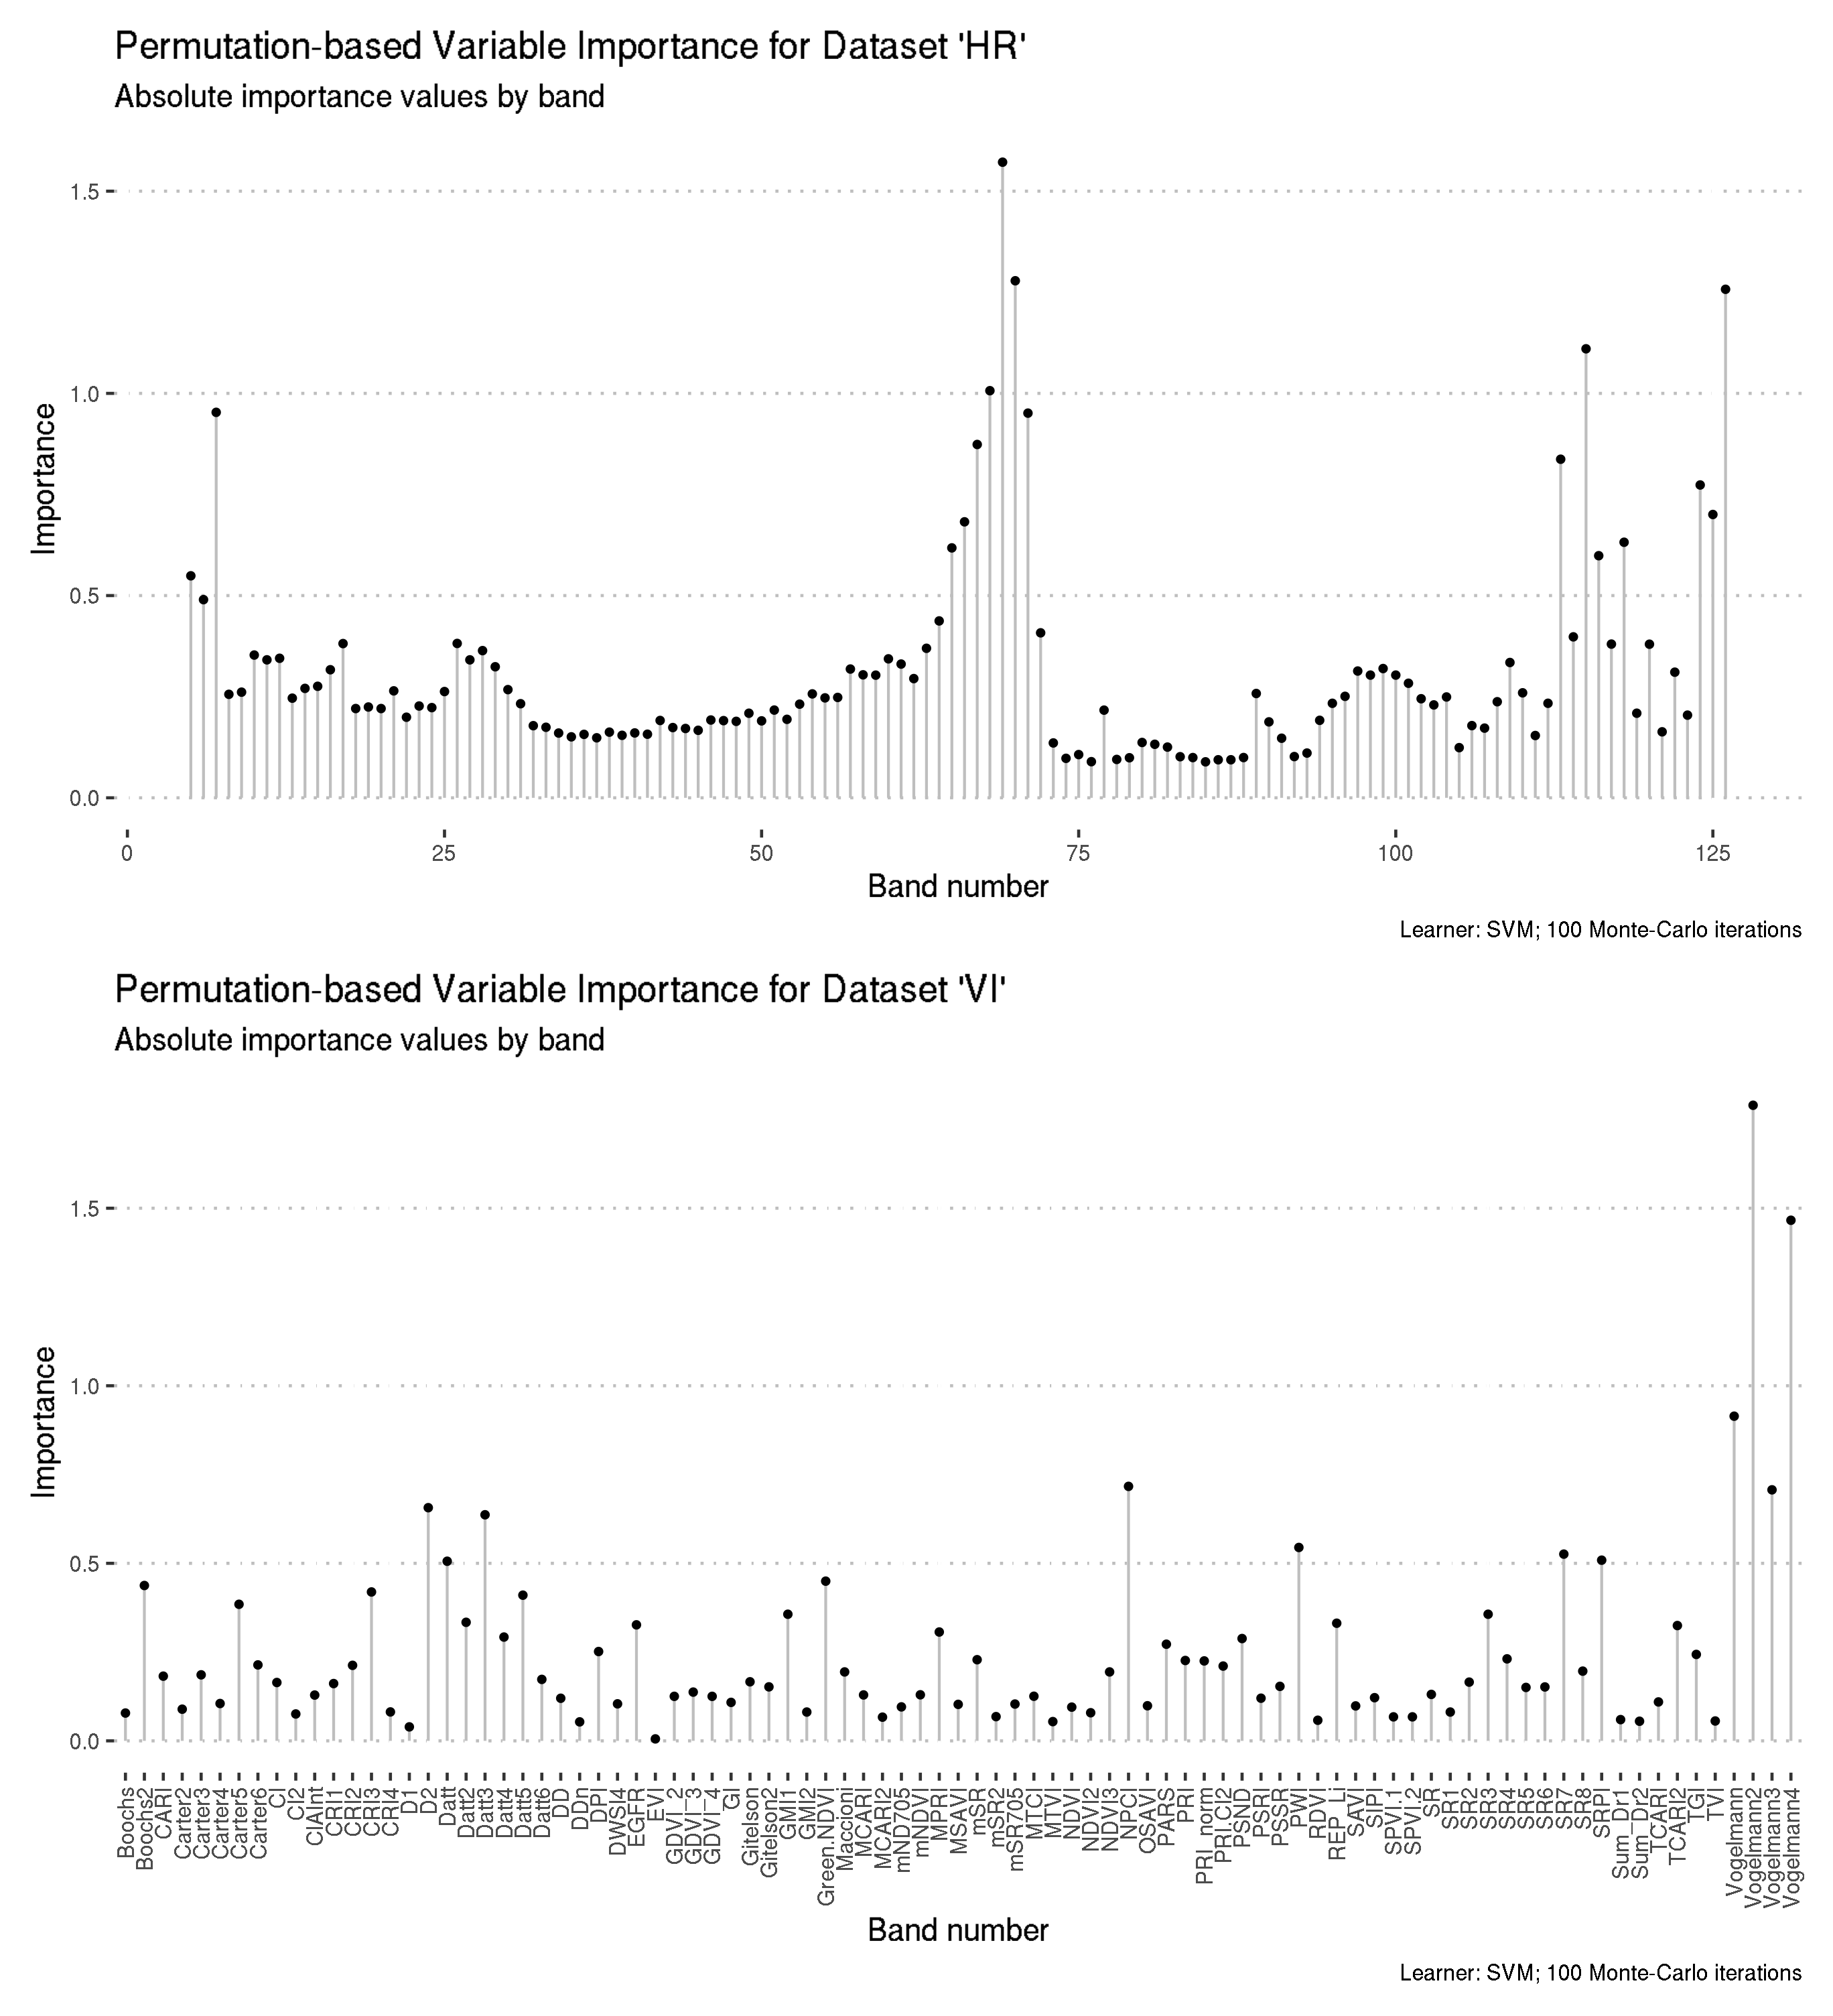
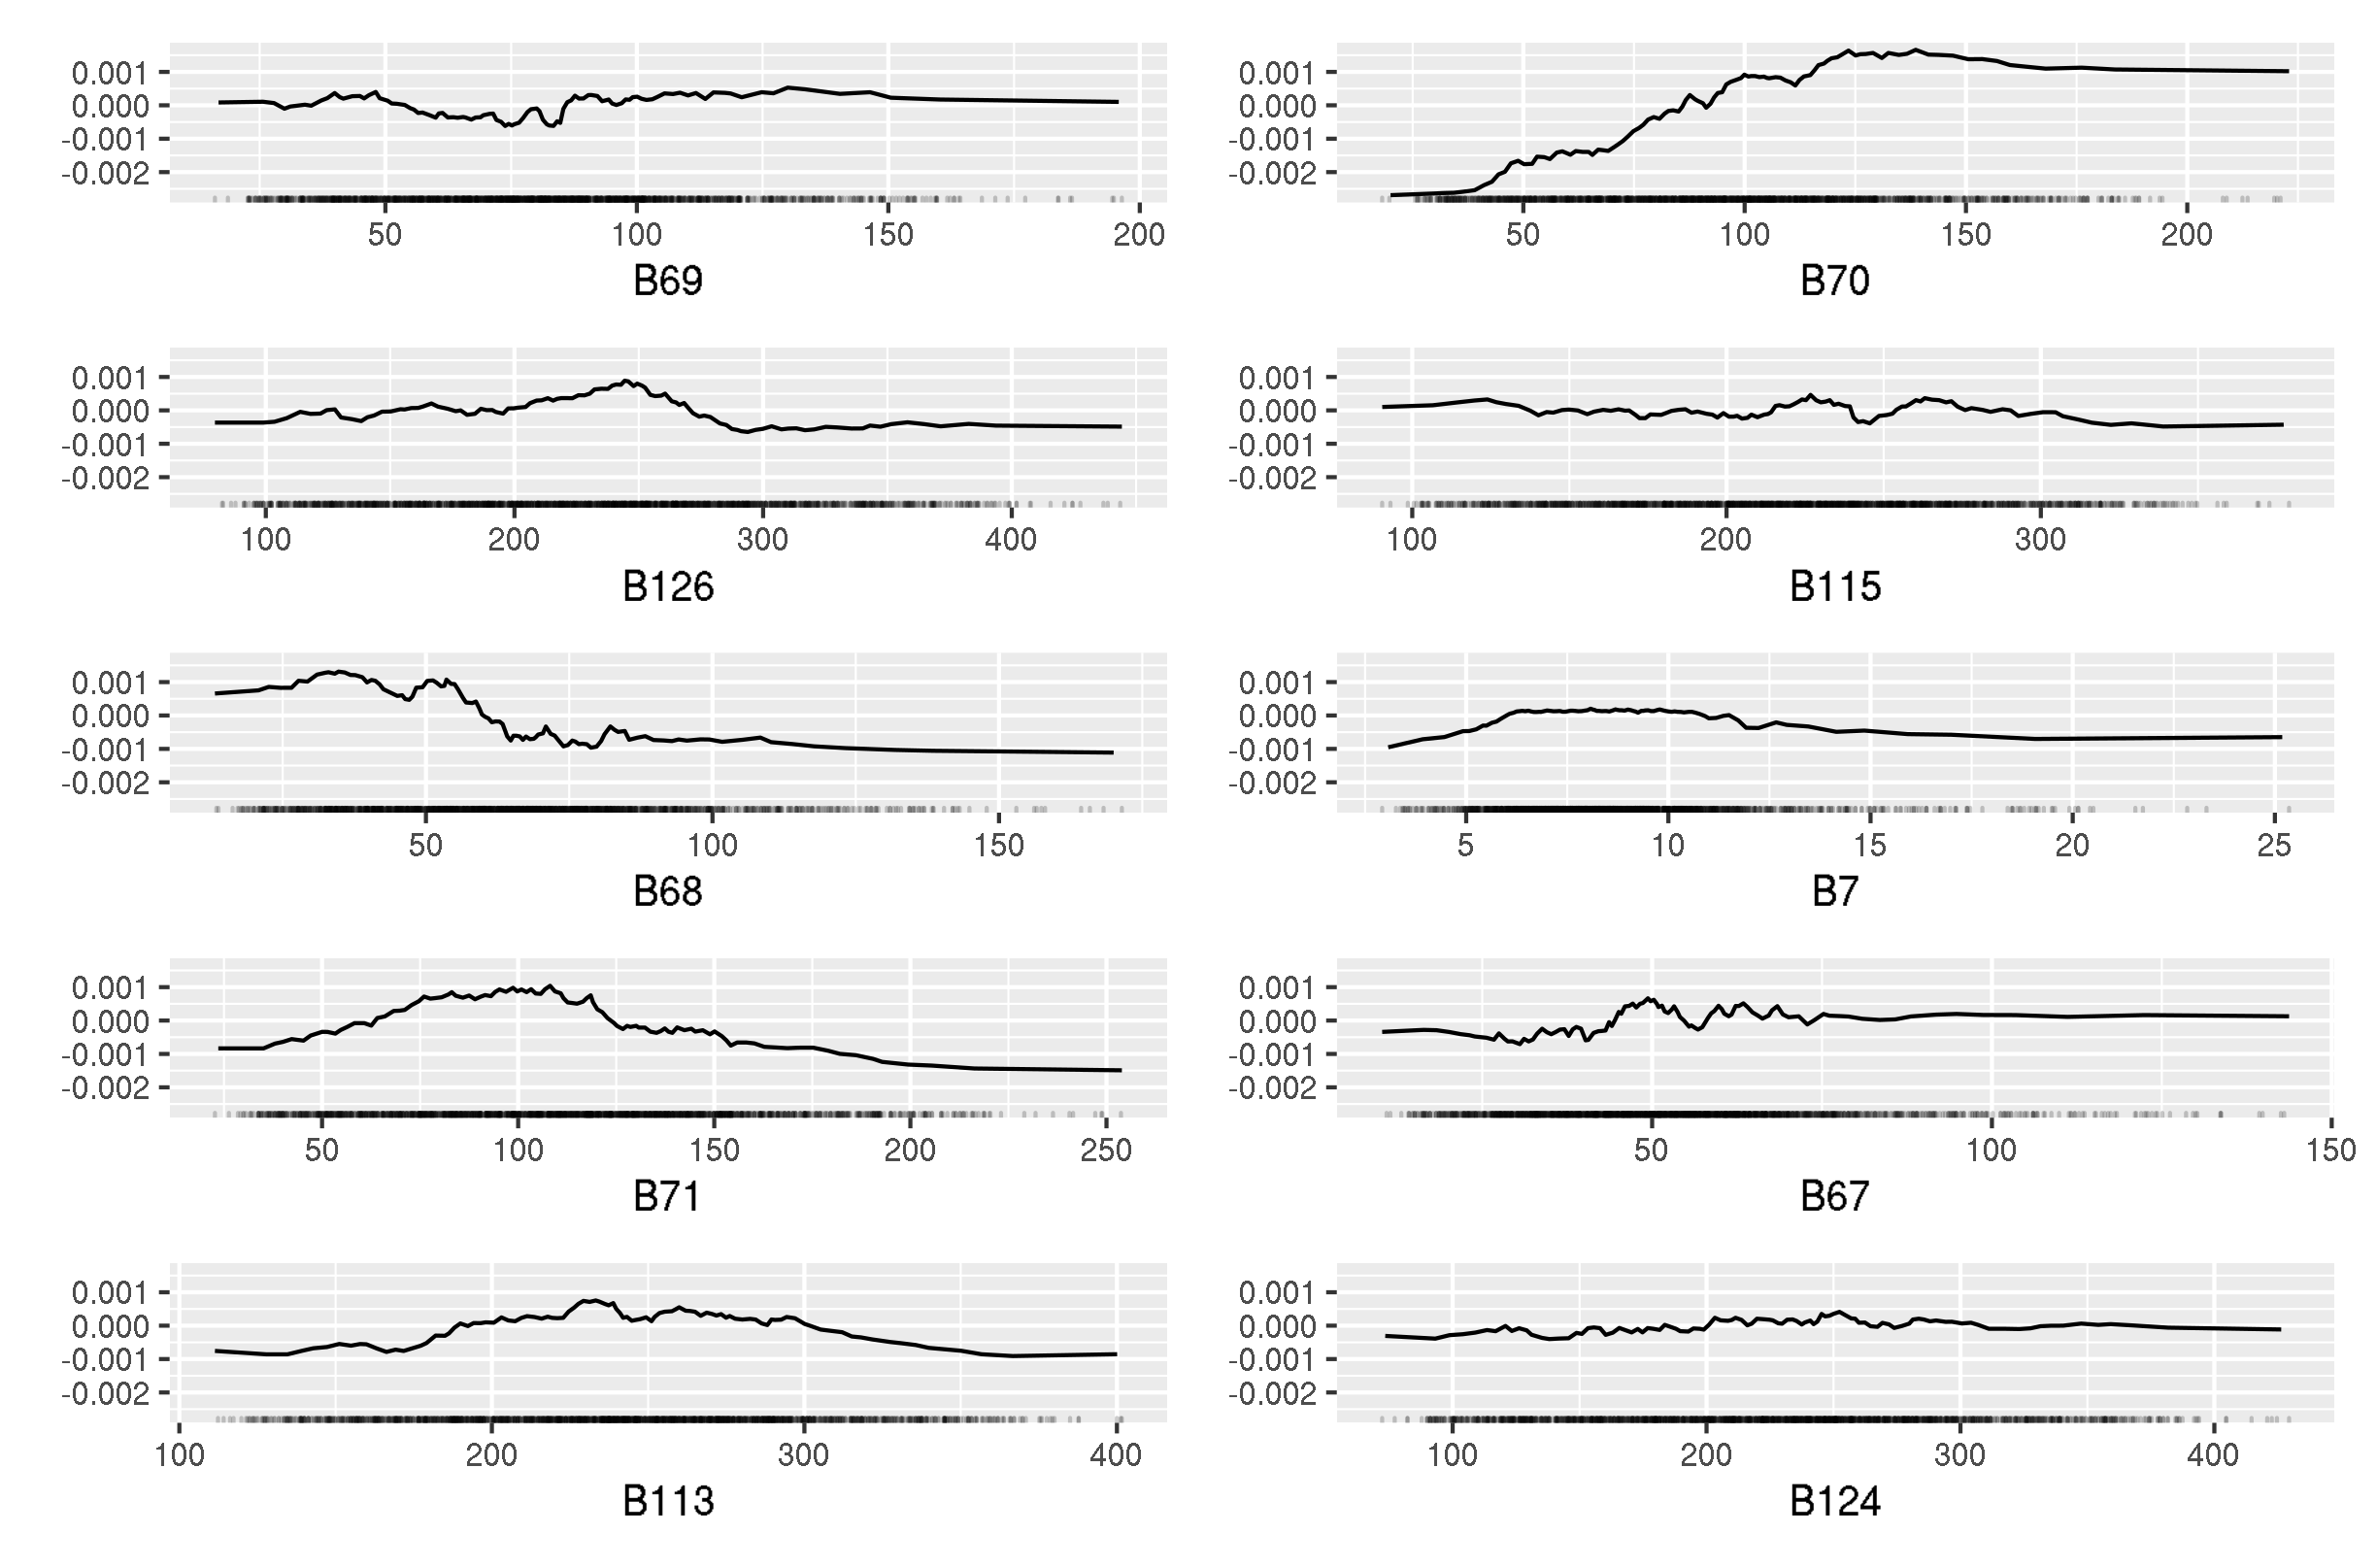
Preview the ordered feature importance results for datasets “HR” and “VI”.
# A tibble: 122 x 5
feature importance wavelength numeric_id rank
<chr> <dbl> <dbl> <dbl> <int>
1 B69 1.57 724 69 1
2 B70 1.28 729. 70 2
3 B126 1.26 995. 126 3
4 B115 1.11 942. 115 4
5 B68 1.01 719. 68 5
6 B7 0.953 430. 7 6
7 B71 0.951 734. 71 7
8 B67 0.874 714. 67 8
9 B113 0.837 933 113 9
10 B124 0.773 985. 124 10
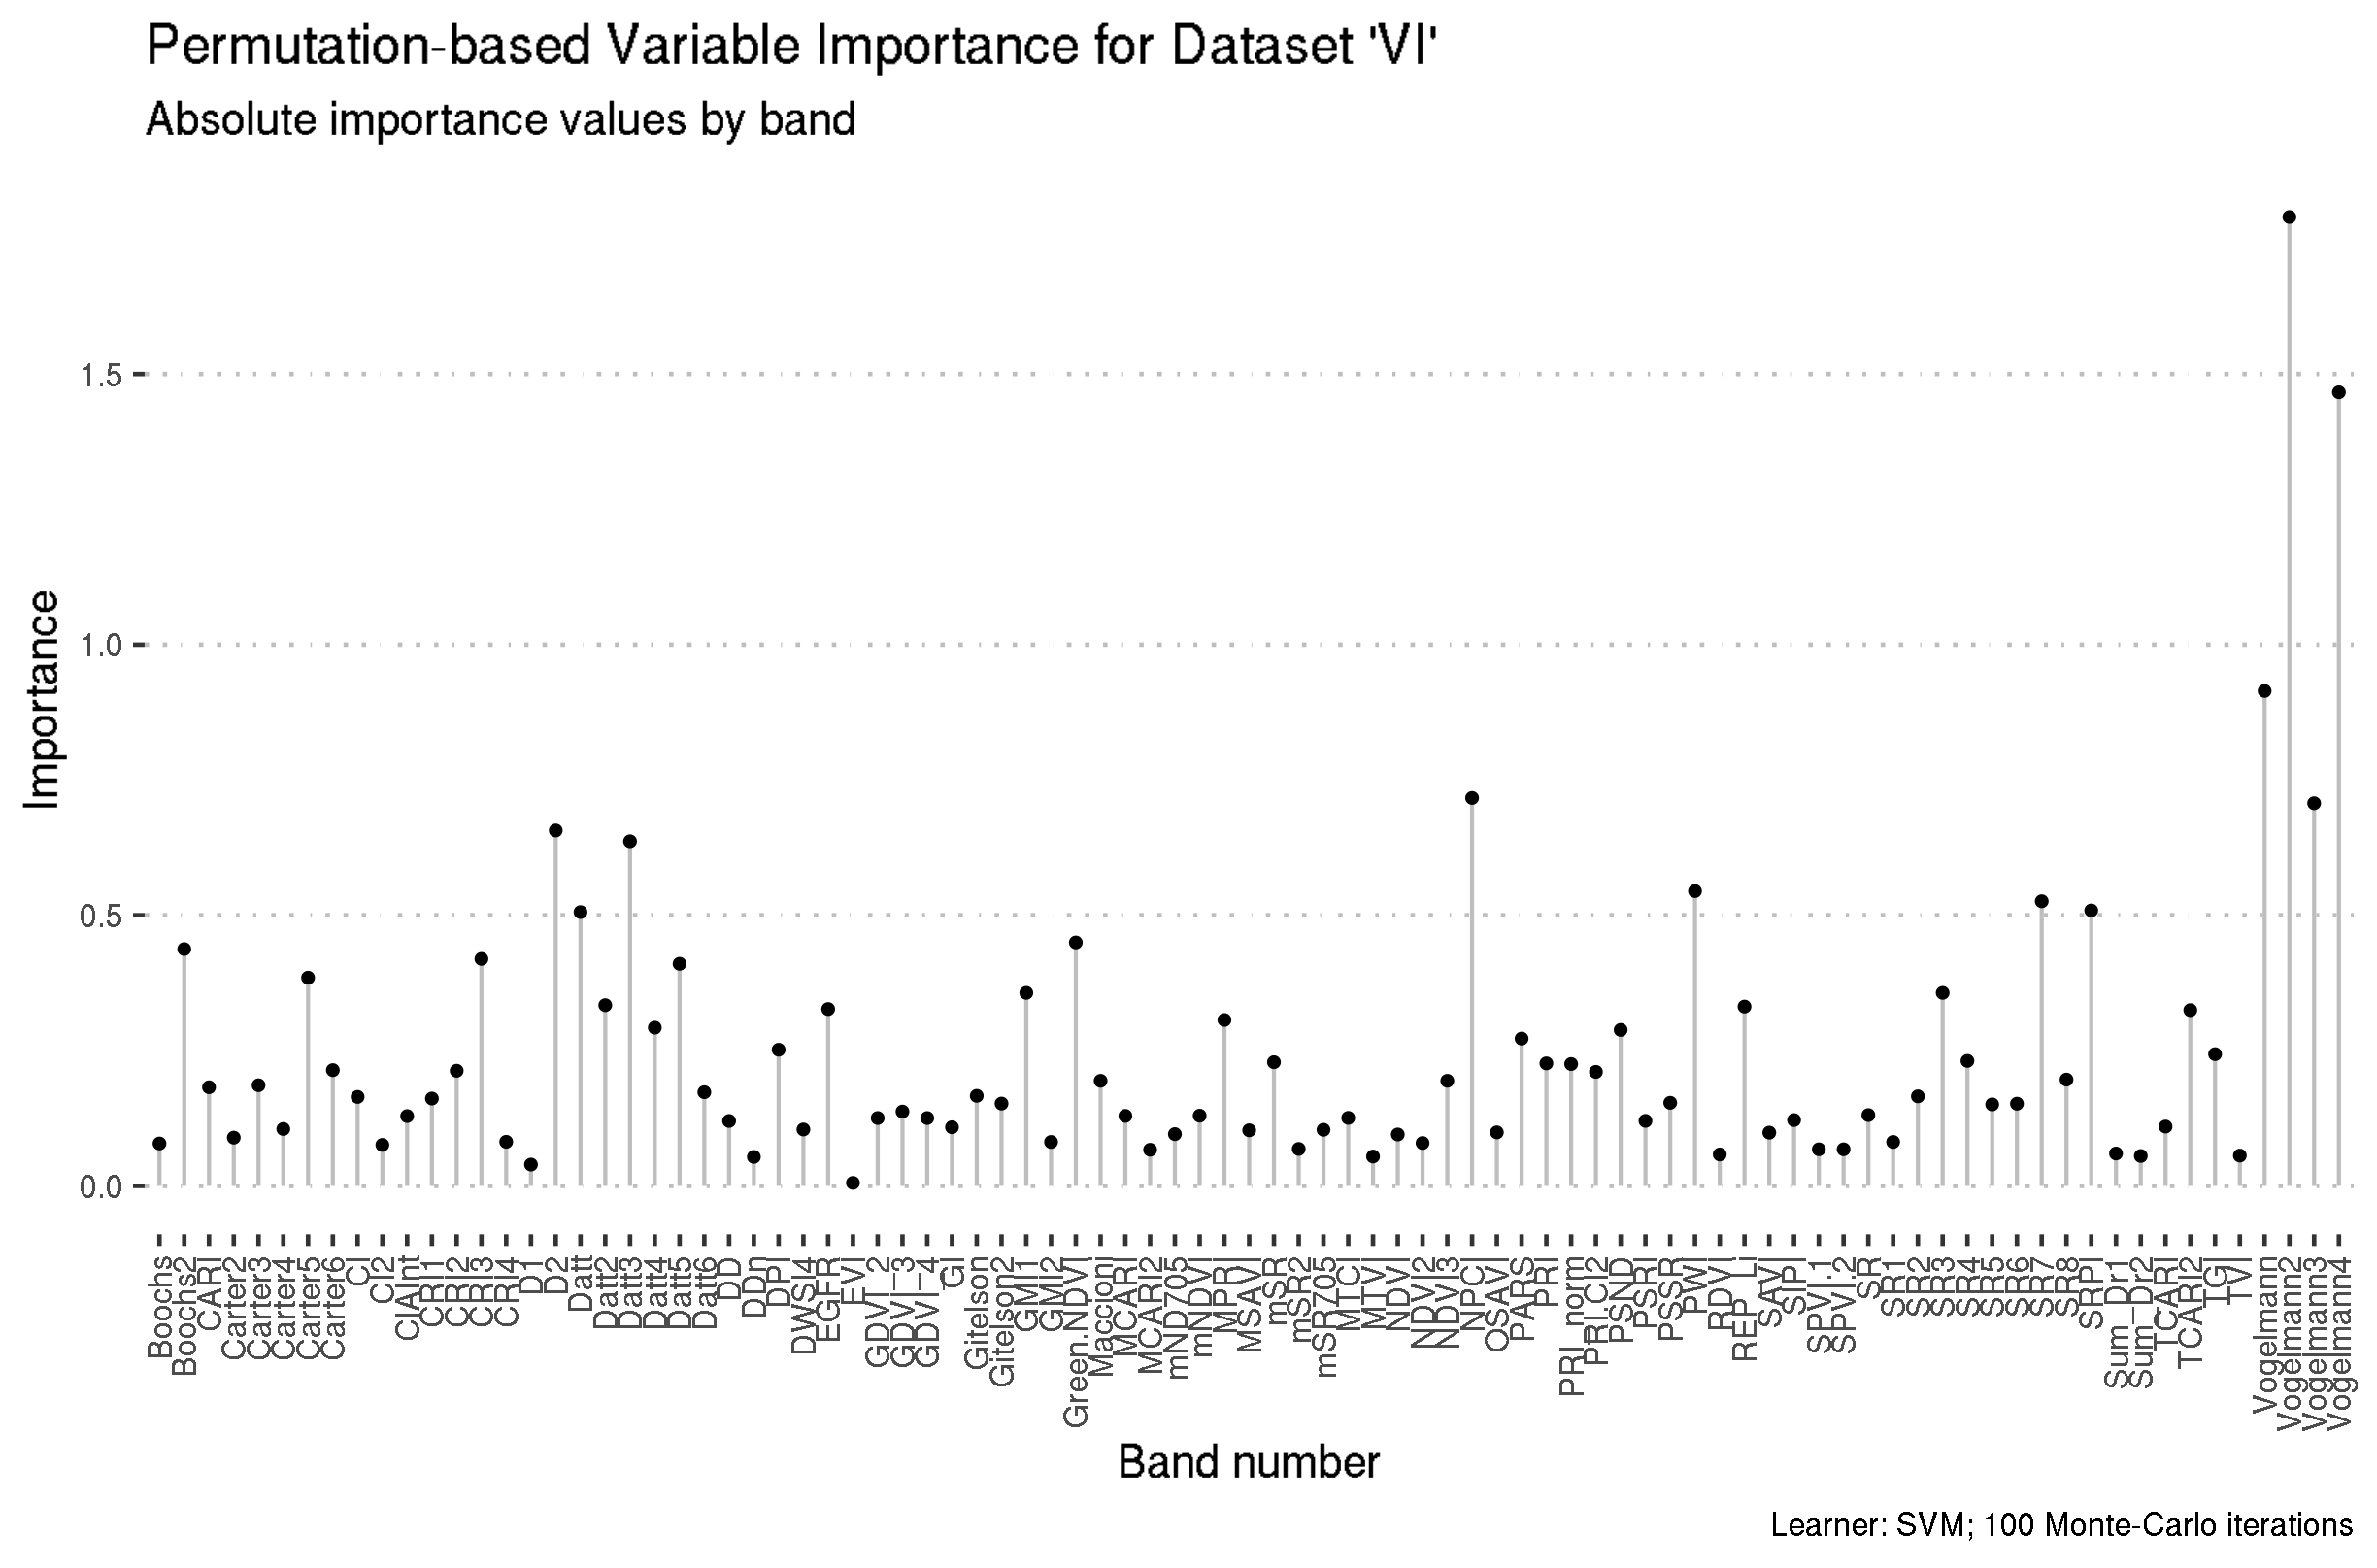
# … with 112 more rows# A tibble: 89 x 3
feature importance rank
<chr> <dbl> <int>
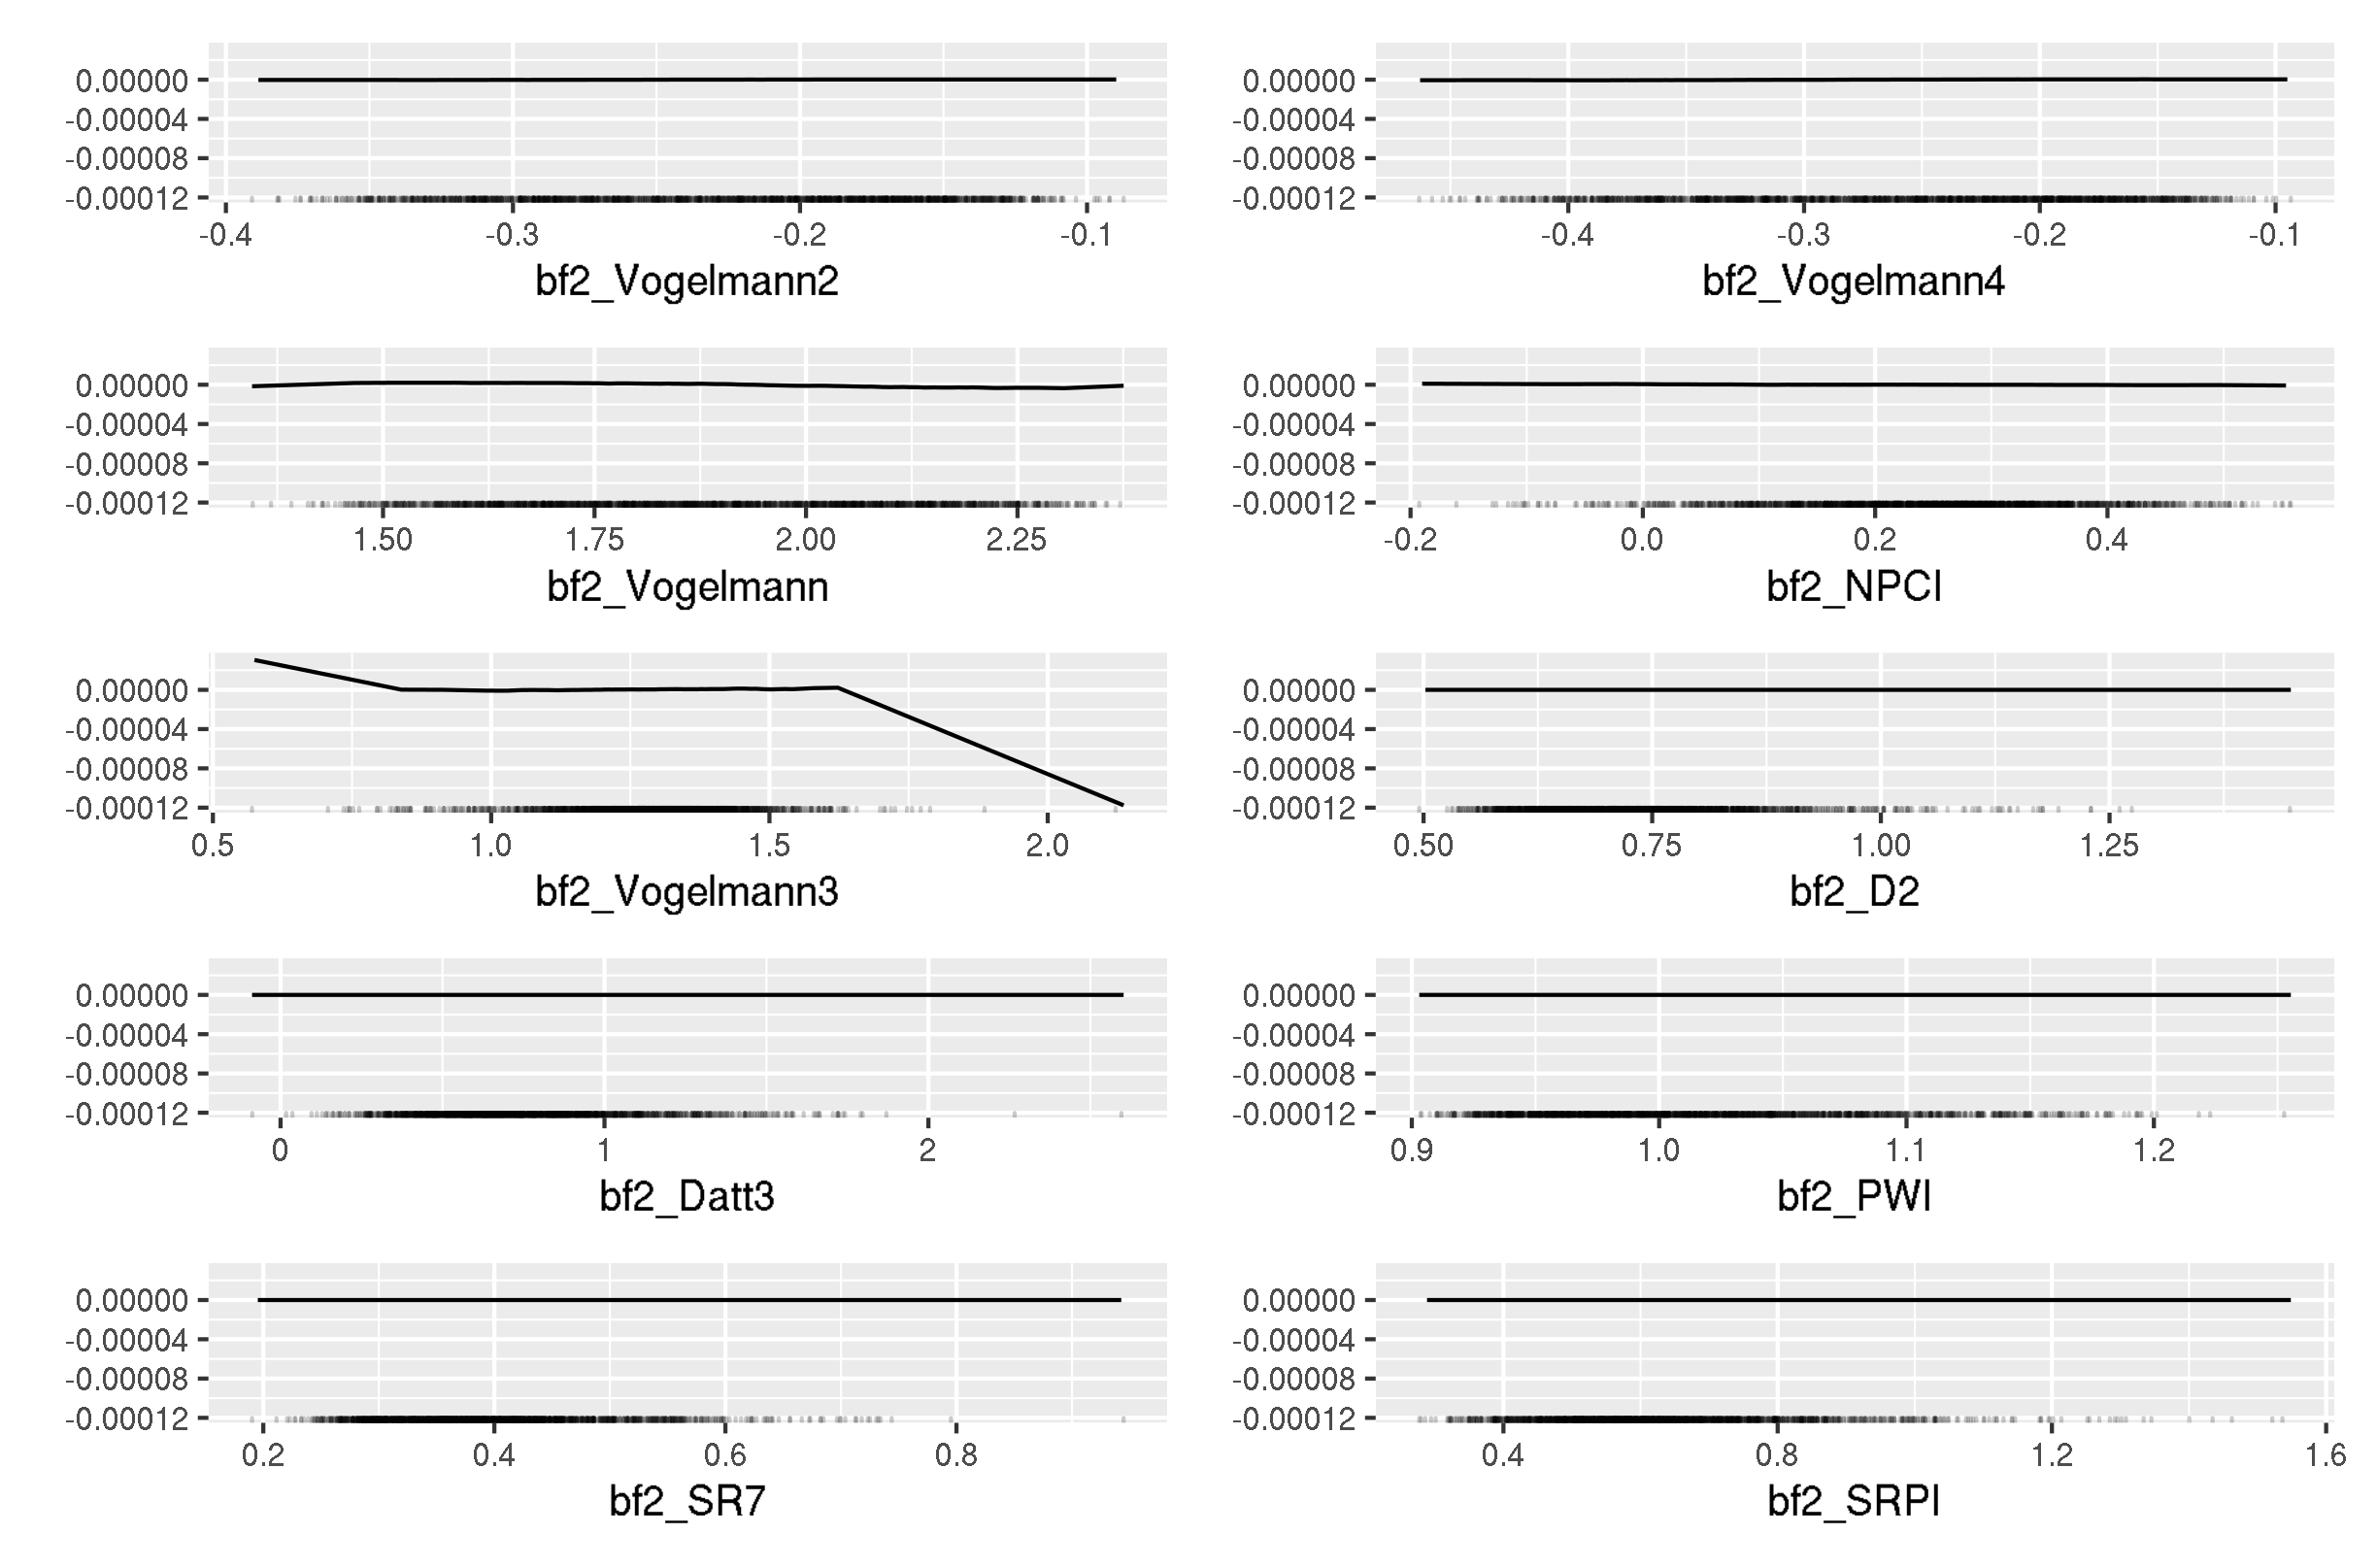
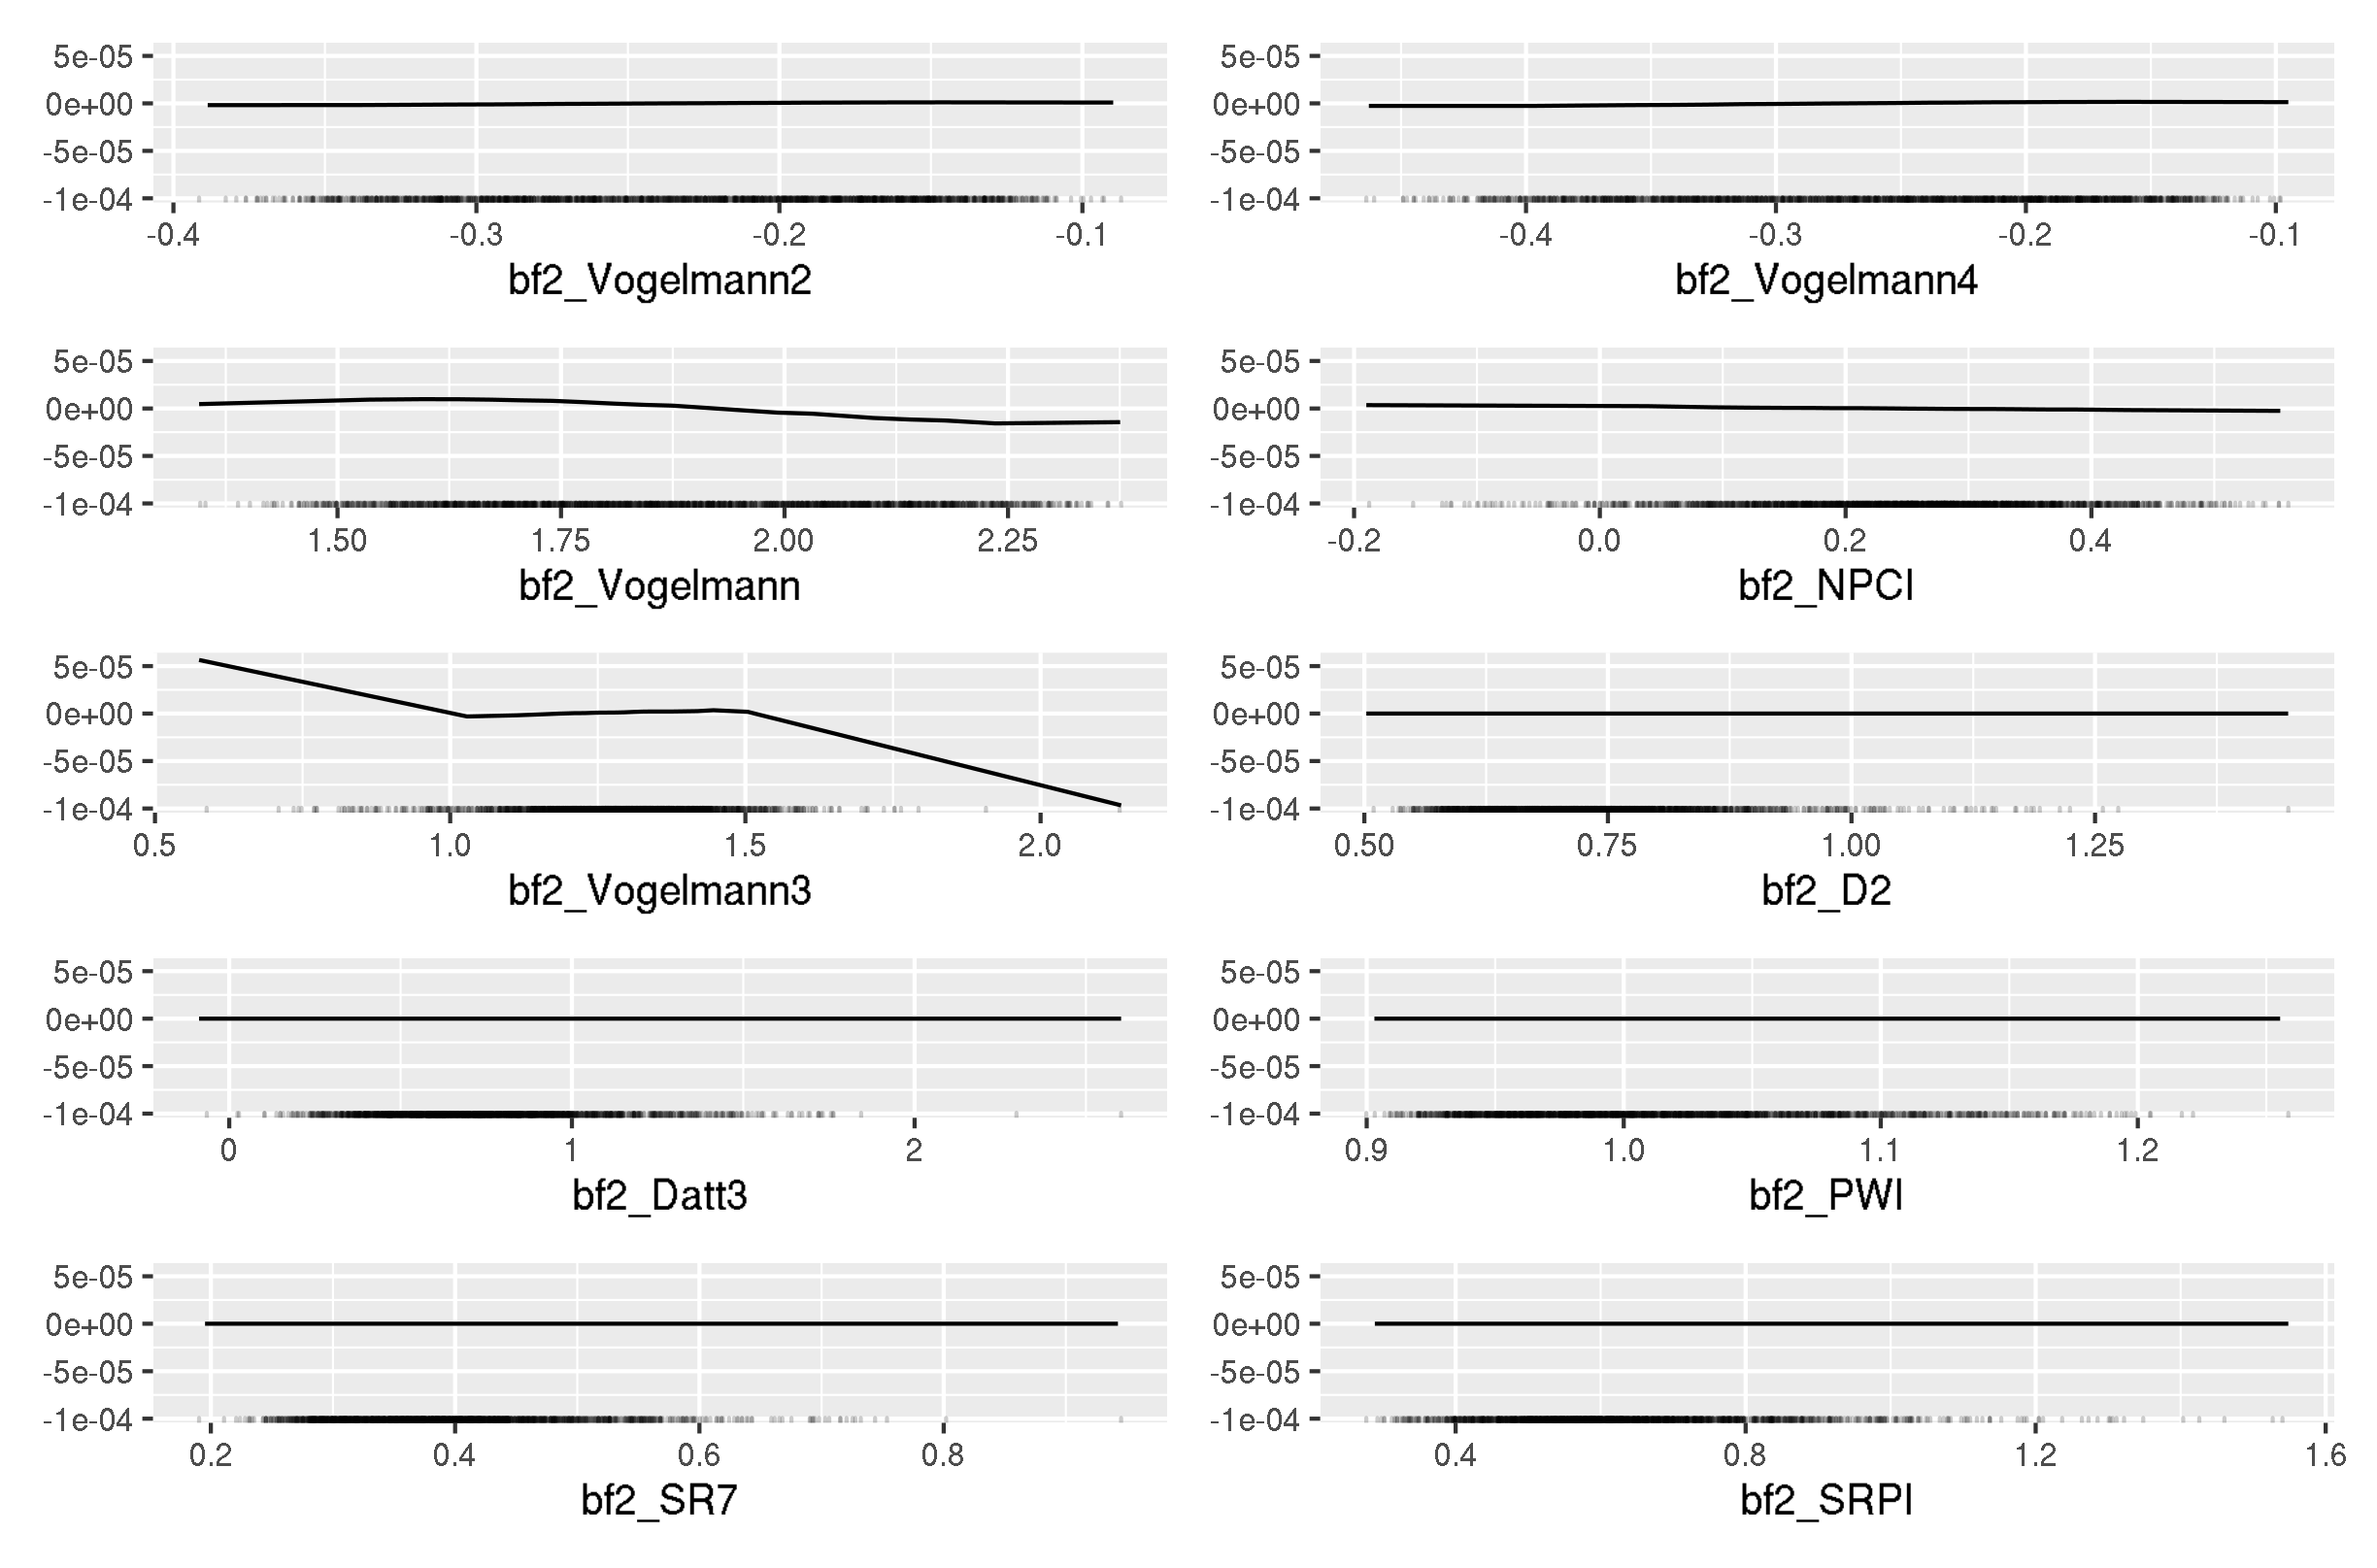
1 Vogelmann2 1.79 1
2 Vogelmann4 1.47 2
3 Vogelmann 0.914 3
4 NPCI 0.717 4
5 Vogelmann3 0.707 5
6 D2 0.657 6
7 Datt3 0.637 7
8 PWI 0.545 8
9 SR7 0.526 9
10 SRPI 0.509 10
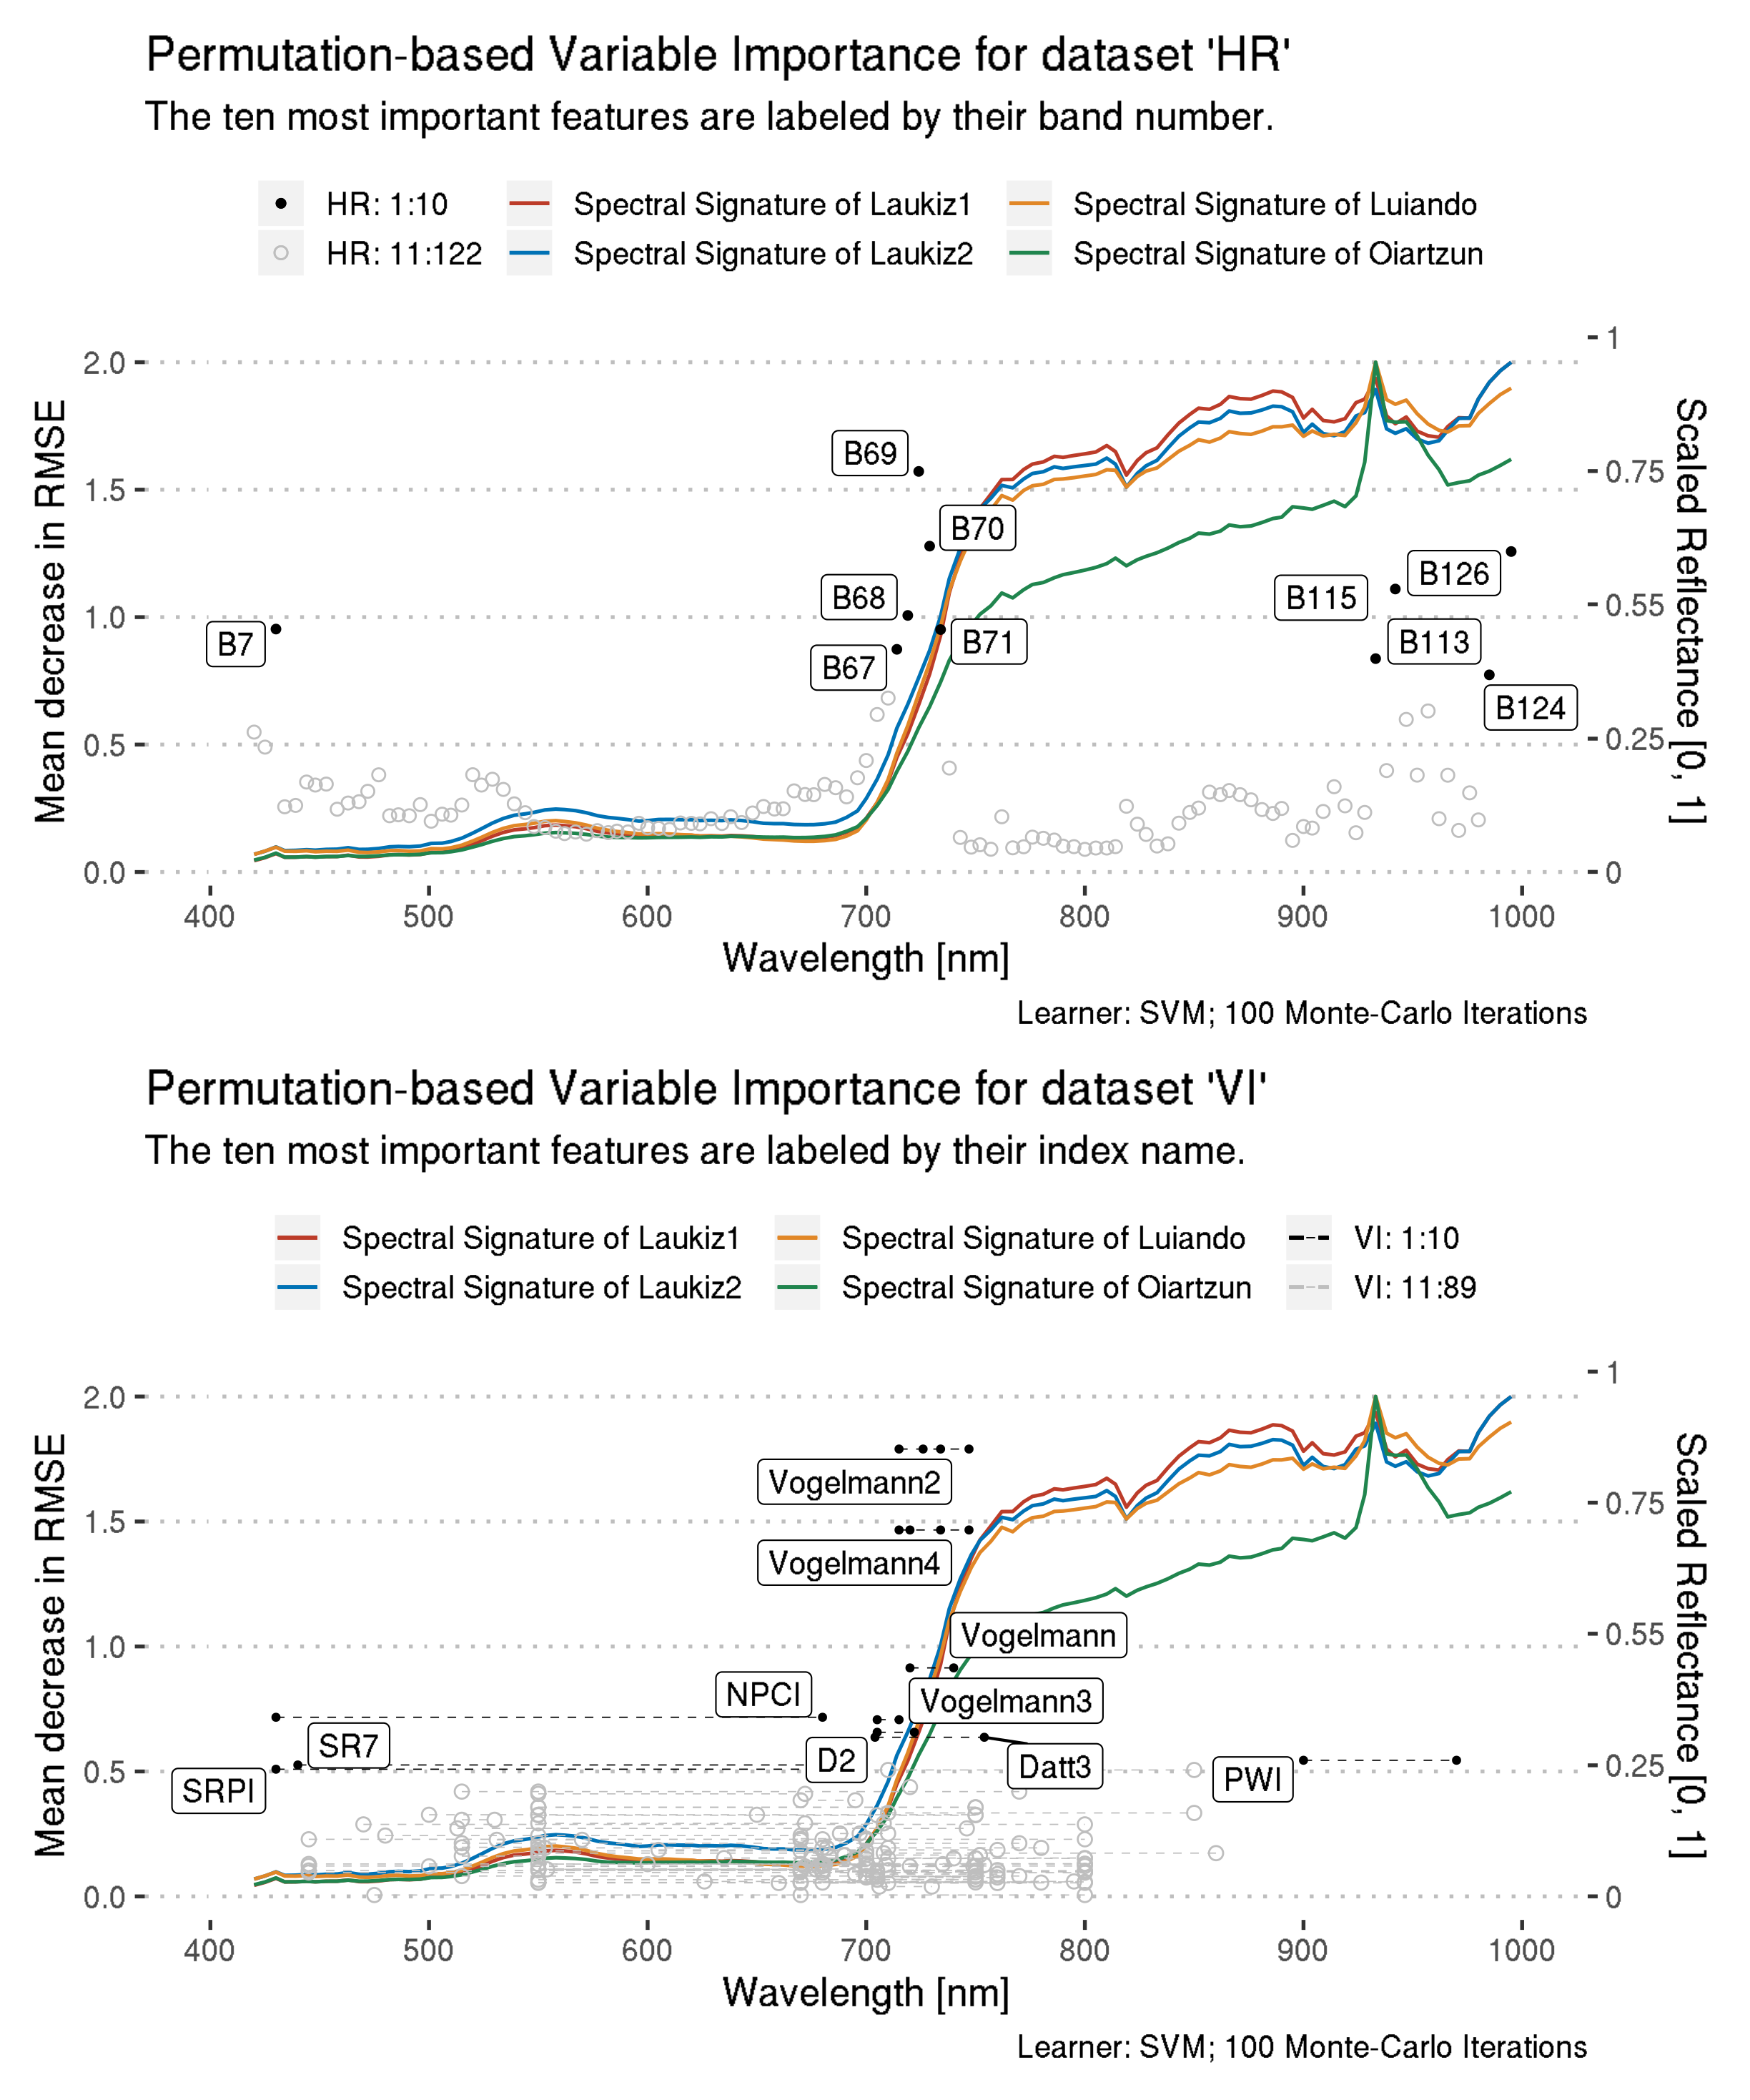
# … with 79 more rowsPROSAIL is a algorithm simulating spectral signatures of vegetation, see ?hsdar::PROSAIL. Reflectance is scaled to 0-10 to be able to plot it in the same plot as the feature importance rankings -> the axis limits for the y and z axis needs to match.
PROSAIL returns a spectral signature from 400 nm to 2500 nm -> we take the values only and subset to 400 nm - 1000 nm. Because we order from 1 - 10 with 1 being the best rank, we have to reverse the scaling of the reflectance values.
Next we bind the simulated data with the feature importance rankings. To join both data.frames we need to round the reflectance centers of the bands to integers to match with the reflectance values created by PROSAIL.
To label only a subset of the data, a custom data.frame is created.
| Version | Author | Date |
|---|---|---|
| ac809cf | pat-s | 2020-03-03 |
Vogelmann2 \((R_{734}-R_{747})/(R_{715}+R_{726})\) Vogelmann et al. (1993)
Vogelmann4 \((R_{734}-R_{747})/(R_{715}+R_{720})\) Vogelmann et al. (1993)
Vogelmann3 \(D_{715}/D_{705}\) Vogelmann et al. (1993)
Vogelmann \(R_{740}/R_{720}\) Vogelmann et al. (1993)
NPCI \((R_{680}-R_{430})/(R_{680}+R_{430})\)
D2 \(D_{705}/D_{722}\)
Datt3 \(D_{754}/D_{704}\)
PWI \(R_{900}/R_{970}\)
SR7 \(R_{440}/R_{690}\)
SRPI \(R_{430}/R_{680}\)
Dxxx: First derivation of reflectance values at wavelength ‘xxx’. Rxxx: Reflectance at wavelength ‘xxx’.
Reference: ?hsdar::vegindex()
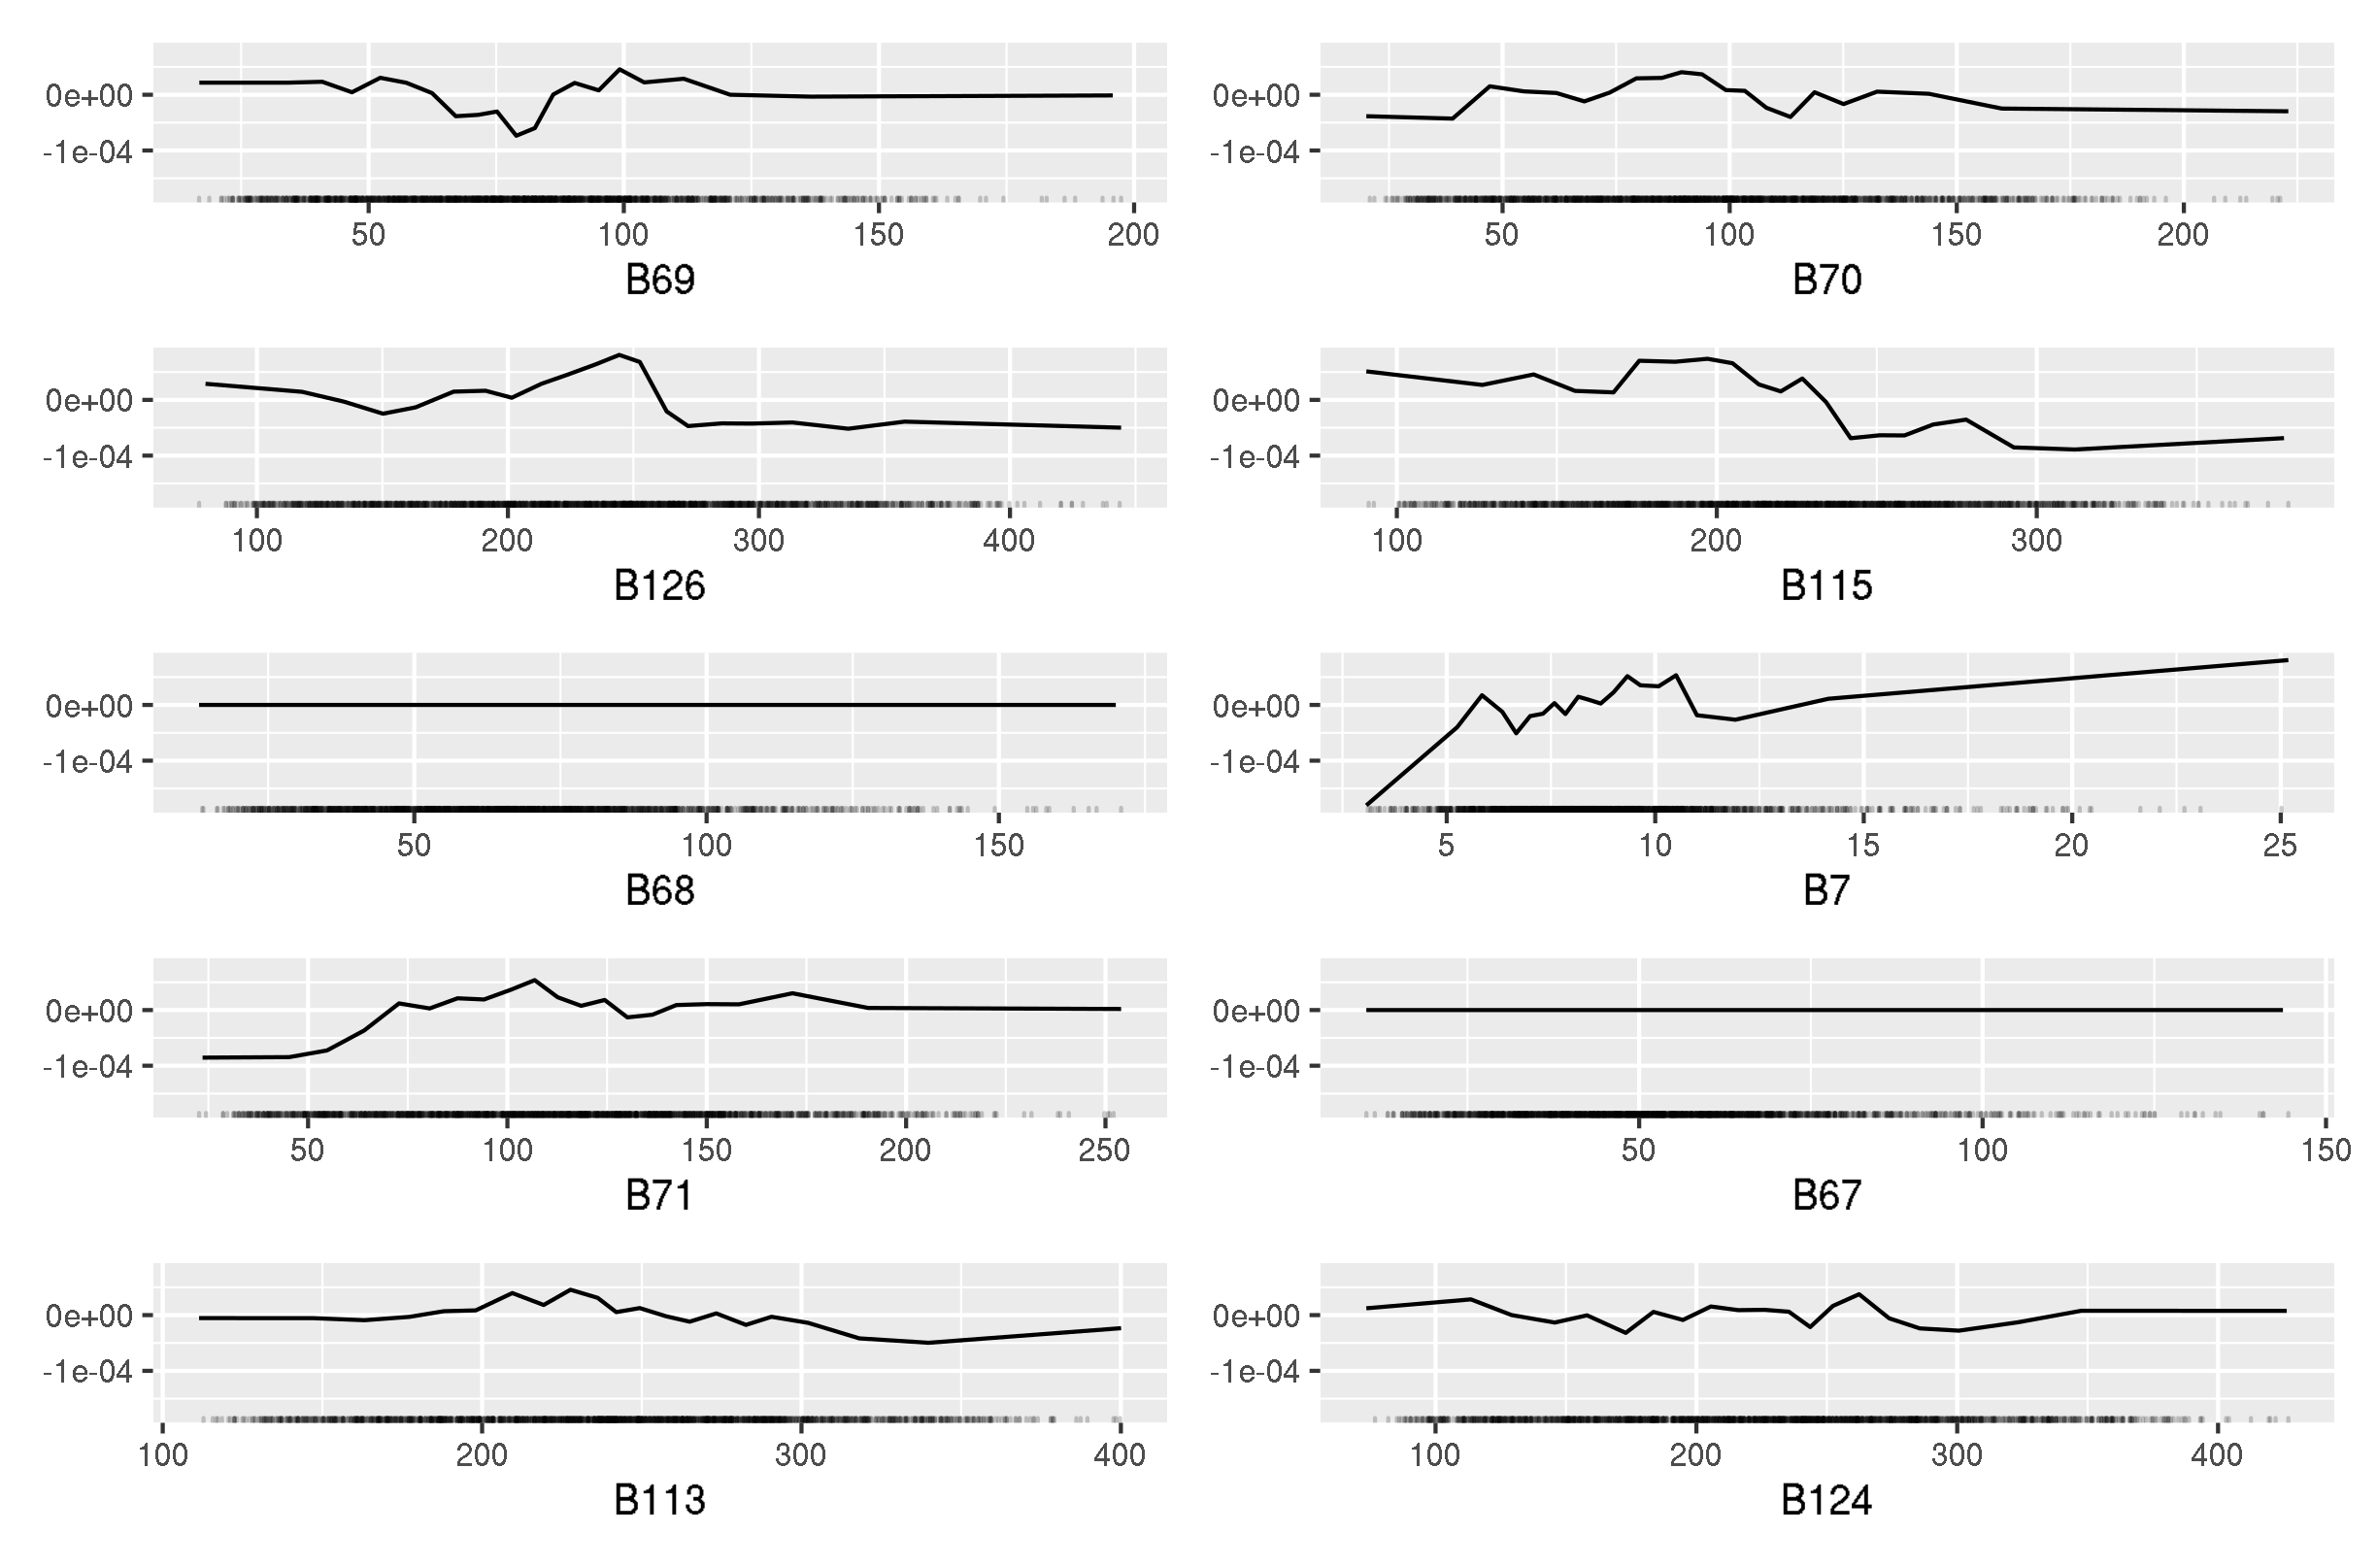
ALE plots via package {iml}
Top ten HR features from permutation Vimp
Top ten VI features from permutation Vimp
Top ten HR features from permutation Vimp
R version 3.6.1 (2019-07-05)
Platform: x86_64-pc-linux-gnu (64-bit)
Running under: CentOS Linux 7 (Core)

Matrix products: default
BLAS:   /opt/spack/opt/spack/linux-centos7-x86_64/gcc-9.2.0/r-3.6.1-j25wr6zcofibs2zfjwg37357rjj26lqb/rlib/R/lib/libRblas.so
LAPACK: /opt/spack/opt/spack/linux-centos7-x86_64/gcc-9.2.0/r-3.6.1-j25wr6zcofibs2zfjwg37357rjj26lqb/rlib/R/lib/libRlapack.so

locale:
 [1] LC_CTYPE=en_US.UTF-8       LC_NUMERIC=C
 [3] LC_TIME=en_US.UTF-8        LC_COLLATE=en_US.UTF-8
 [5] LC_MONETARY=en_US.UTF-8    LC_MESSAGES=en_US.UTF-8
 [7] LC_PAPER=en_US.UTF-8       LC_NAME=C
 [9] LC_ADDRESS=C               LC_TELEPHONE=C
[11] LC_MEASUREMENT=en_US.UTF-8 LC_IDENTIFICATION=C

attached base packages:
[1] stats     graphics  grDevices utils     datasets  methods   base

other attached packages:
 [1] tidyselect_0.2.5 iml_0.10.0       patchwork_1.0.0  ggpmisc_0.3.3
 [5] ggpubr_0.1.6     magrittr_1.5     dplyr_0.8.3      hsdar_0.5.2
 [9] caret_6.0-81     ggplot2_3.2.1    lattice_0.20-38  signal_0.7-6
[13] rootSolve_1.7    rgdal_1.4-8      raster_3.0-12    sp_1.3-1
[17] drake_7.10.0

loaded via a namespace (and not attached):
  [1] colorspace_1.4-0   smoof_1.5.1        class_7.3-15
  [4] rprojroot_1.3-2    fs_1.3.1           listenv_0.8.0
  [7] ParamHelpers_1.12  ggrepel_0.8.0      prodlim_2018.04.18
 [10] fansi_0.4.1        lubridate_1.7.4    codetools_0.2-16
 [13] splines_3.6.1      knitr_1.23         mco_1.0-15.1
 [16] zeallot_0.1.0      jsonlite_1.6       workflowr_1.6.1
 [19] Metrics_0.1.4      kernlab_0.9-27     mlrMBO_1.1.2
 [22] compiler_3.6.1     httr_1.4.0         backports_1.1.5
 [25] assertthat_0.2.1   Matrix_1.2-15      lazyeval_0.2.1
 [28] cli_2.0.1          later_1.0.0        htmltools_0.3.6
 [31] tools_3.6.1        igraph_1.2.4.1     misc3d_0.8-4
 [34] gtable_0.3.0       glue_1.3.1         reshape2_1.4.3
 [37] fastmatch_1.1-0    Rcpp_1.0.3         parallelMap_1.4
 [40] vctrs_0.2.1        RJSONIO_1.3-1.1    nlme_3.1-142
 [43] iterators_1.0.10   timeDate_3043.102  gower_0.1.2
 [46] xfun_0.5           mlr_2.17.0.9001    stringr_1.4.0
 [49] globals_0.12.5     lifecycle_0.1.0    future_1.16.0
 [52] MASS_7.3-51.4      scales_1.0.0       ipred_0.9-8
 [55] promises_1.0.1     parallel_3.6.1     plot3D_1.1.1
 [58] RColorBrewer_1.1-2 BBmisc_1.11        yaml_2.2.0
 [61] gridExtra_2.3      DiceKriging_1.5.6  rpart_4.1-13
 [64] stringi_1.3.1      foreach_1.4.4      checkmate_2.0.0
 [67] lhs_1.0.1          filelock_1.0.2     lava_1.6.5
 [70] storr_1.2.1        rlang_0.4.4        pkgconfig_2.0.3
 [73] evaluate_0.13      purrr_0.3.3        prediction_0.3.14
 [76] recipes_0.1.4      htmlwidgets_1.3    labeling_0.3
 [79] plyr_1.8.4         R6_2.4.1           generics_0.0.2
 [82] base64url_1.4      txtq_0.1.4         pillar_1.4.3
 [85] whisker_0.3-2      withr_2.1.2        survival_2.43-3
 [88] nnet_7.3-12        future.apply_1.4.0 tibble_2.1.3
 [91] crayon_1.3.4       utf8_1.1.4         plotly_4.8.0
 [94] rmarkdown_1.13     grid_3.6.1         data.table_1.12.8
 [97] git2r_0.26.1       ModelMetrics_1.2.2 digest_0.6.23
[100] tidyr_1.0.0        httpuv_1.4.5.1     stats4_3.6.1
[103] munsell_0.5.0      viridisLite_0.3.0