LDL analysis after postprocessing
XSun
2025-01-05
Last updated: 2025-01-13
Checks: 6 1
Knit directory: multigroup_ctwas_analysis/
This reproducible R Markdown analysis was created with workflowr (version 1.7.0). The Checks tab describes the reproducibility checks that were applied when the results were created. The Past versions tab lists the development history.
The R Markdown file has unstaged changes. To know which version of
the R Markdown file created these results, you’ll want to first commit
it to the Git repo. If you’re still working on the analysis, you can
ignore this warning. When you’re finished, you can run
wflow_publish to commit the R Markdown file and build the
HTML.
Great job! The global environment was empty. Objects defined in the global environment can affect the analysis in your R Markdown file in unknown ways. For reproduciblity it’s best to always run the code in an empty environment.
The command set.seed(20231112) was run prior to running
the code in the R Markdown file. Setting a seed ensures that any results
that rely on randomness, e.g. subsampling or permutations, are
reproducible.
Great job! Recording the operating system, R version, and package versions is critical for reproducibility.
Nice! There were no cached chunks for this analysis, so you can be confident that you successfully produced the results during this run.
Great job! Using relative paths to the files within your workflowr project makes it easier to run your code on other machines.
Great! You are using Git for version control. Tracking code development and connecting the code version to the results is critical for reproducibility.
The results in this page were generated with repository version c432d5f. See the Past versions tab to see a history of the changes made to the R Markdown and HTML files.
Note that you need to be careful to ensure that all relevant files for
the analysis have been committed to Git prior to generating the results
(you can use wflow_publish or
wflow_git_commit). workflowr only checks the R Markdown
file, but you know if there are other scripts or data files that it
depends on. Below is the status of the Git repository when the results
were generated:
Ignored files:
    Ignored:    .Rhistory

Unstaged changes:
    Modified:   analysis/LDL_silver_standard.Rmd
Note that any generated files, e.g. HTML, png, CSS, etc., are not included in this status report because it is ok for generated content to have uncommitted changes.
These are the previous versions of the repository in which changes were
made to the R Markdown (analysis/LDL_silver_standard.Rmd)
and HTML (docs/LDL_silver_standard.html) files. If you’ve
configured a remote Git repository (see ?wflow_git_remote),
click on the hyperlinks in the table below to view the files as they
were in that past version.
| File | Version | Author | Date | Message |
|---|---|---|---|---|
| Rmd | 80e204a | XSun | 2025-01-10 | update |
| html | 80e204a | XSun | 2025-01-10 | update |
Introduction
We used the LDL genes reported by multi-group analysis after postprocess to do some downstream analysiss.
library(ctwas)
library(dplyr)
library(EnsDb.Hsapiens.v86)
library(pheatmap)
ens_db <- EnsDb.Hsapiens.v86

mapping_predictdb <- readRDS("/project2/xinhe/shared_data/multigroup_ctwas/weights/mapping_files/PredictDB_mapping.RDS")
mapping_munro <- readRDS("/project2/xinhe/shared_data/multigroup_ctwas/weights/mapping_files/Munro_mapping.RDS")
mapping_two <- rbind(mapping_predictdb,mapping_munro)


plot_heatmap_byomics <- function(heatmap_data, main) {

  rownames(heatmap_data) <- heatmap_data$gene_name
  heatmap_data <- heatmap_data %>% dplyr::select(-gene_name, -combined_pip)

  if(nrow(heatmap_data) ==1){

    heatmap_data <- rbind(heatmap_data,rep(0,ncol(heatmap_data)))
    rownames(heatmap_data)[2] <- "fake_gene_for_plotting"

  }

  heatmap_matrix <- as.matrix(heatmap_data)

  p <- pheatmap(heatmap_matrix,
                cluster_rows = F,   # Cluster the rows (genes)
                cluster_cols = F,   # Cluster the columns (QTL types)
                color = colorRampPalette(c("white", "red"))(50), # Color gradient
                display_numbers = TRUE, # Display numbers in cells
                main = main,labels_row = rownames(heatmap_data), silent = T)

  return(p)
}

plot_heatmap_bytissue <- function(heatmap_data, main, tissues) {

  rownames(heatmap_data) <- heatmap_data$gene_name
  heatmap_data <- heatmap_data %>% dplyr::select(-gene_name, -combined_pip)

  pip_types <- c("|eQTL_pip", "|sQTL_pip", "|stQTL_pip")

  combinations <- expand.grid(pip_types, tissues)
  order <- paste0(combinations$Var2, combinations$Var1)

  heatmap_data <- heatmap_data[,order]

  if(nrow(heatmap_data) ==1){

    heatmap_data <- rbind(heatmap_data,rep(0,ncol(heatmap_data)))
    rownames(heatmap_data)[2] <- "fake_gene_for_plotting"

  }

  heatmap_matrix <- as.matrix(heatmap_data)

  p <- pheatmap(heatmap_matrix,
                cluster_rows = F,   # Cluster the rows (genes)
                cluster_cols = F,   # Cluster the columns (QTL types)
                color = colorRampPalette(c("white", "red"))(50), # Color gradient
                display_numbers = TRUE, # Display numbers in cells
                main = main,labels_row = rownames(heatmap_data), silent = T)

  return(p)
}


get_ctwas_file <- function(trait, tissue = NULL, folder_results) {
  # Build file paths
  if (is.null(tissue)) {
    file_ctwas_res_origin <- paste0(folder_results, "/", trait, "/", trait, ".finemap_regions_res.RDS")
    file_ctwas_res_regionmerge <- paste0(folder_results, "/", trait, "/", trait, ".regionmerge_finemap_regions_res.RDS")
    file_ctwas_res_ldmismatch <- paste0(folder_results, "/", trait, "/", trait, ".ldmismatch_finemap_regions_res.RDS")
  } else {
    file_ctwas_res_origin <- paste0(folder_results, "/", trait, "/", trait, "_", tissue, ".finemap_regions_res.RDS")
    file_ctwas_res_regionmerge <- paste0(folder_results, "/", trait, "/", trait, "_", tissue, ".regionmerge_finemap_regions_res.RDS")
    file_ctwas_res_ldmismatch <- paste0(folder_results, "/", trait, "/", trait, "_", tissue, ".ldmismatch_finemap_regions_res.RDS")
  }

  # Determine which file exists
  file_ctwas_result <- if (file.exists(file_ctwas_res_ldmismatch)) {
    file_ctwas_res_ldmismatch
  } else if (file.exists(file_ctwas_res_regionmerge)) {
    file_ctwas_res_regionmerge
  } else {
    file_ctwas_res_origin
  }

  return(file_ctwas_result)
}
Results
Single eQTL analysis results
trait <- "LDL-ukb-d-30780_irnt"
tissue <- "Liver"

folder_single_results <- "/project/xinhe/shengqian/single_tissue_screen/processed_weights/expression_weights/"

file_ctwas_result <- get_ctwas_file(trait, tissue, folder_single_results)

ctwas_res_single_post <- readRDS(file_ctwas_result)

z_gene_single <-readRDS(paste0(folder_single_results,"/",trait,"/",trait,"_",tissue,".z_gene.RDS"))

susie_alpha_res_single_post <- ctwas_res_single_post$susie_alpha_res
susie_alpha_res_single_post <- anno_susie_alpha_res(susie_alpha_res_single_post,
                                        mapping_table = mapping_two,
                                        map_by = "molecular_id",
                                        drop_unmapped = TRUE)
2025-01-13 17:45:58 INFO::Annotating susie alpha result ...
2025-01-13 17:45:58 INFO::Map molecular traits to genescombined_pip_by_group_single <- combine_gene_pips(susie_alpha_res_single_post,
group_by = "gene_name",
by = "group",
method = "combine_cs",
filter_cs = TRUE,
include_cs_id = F)
combined_pip_sig_single <- subset(combined_pip_by_group_single, combined_pip > 0.8)
DT::datatable(combined_pip_sig_single,caption = htmltools::tags$caption( style = 'caption-side: left; text-align: left; color:black; font-size:150% ;','Genes with PIP > 0.8 in single eQTL analysis, cs filtered'),options = list(pageLength = 10) )z_gene_single <- z_gene_single %>%
mutate(molecular_id = sub("\\|.*", "", id)) %>% # Extract ENSG ID from id
left_join(mapping_two %>% dplyr::select(molecular_id, gene_name), by = "molecular_id")Multi-group analysis results
tissues <- c("Liver","Spleen","Esophagus_Gastroesophageal_Junction","Esophagus_Muscularis","Esophagus_Mucosa")
folder_multi_results <- "/project/xinhe/shengqian/ctwas_GWAS_analysis/results/"
folder_multi_post <- paste0("/project/xinhe/xsun/multi_group_ctwas/13.post_processing_0103/results_region_merge/",trait,"/")
file_ctwas_result <- get_ctwas_file(trait, tissue = NULL, folder_multi_results)
ctwas_res_multi_post <- readRDS(file_ctwas_result)
susie_alpha_res_multi_post <- ctwas_res_multi_post$susie_alpha_res
susie_alpha_res_multi_post <- anno_susie_alpha_res(susie_alpha_res_multi_post,
mapping_table = mapping_two,
map_by = "molecular_id",
drop_unmapped = TRUE)2025-01-13 17:46:07 INFO::Annotating susie alpha result ...
2025-01-13 17:46:09 INFO::Map molecular traits to genes
2025-01-13 17:46:10 INFO::Split PIPs for molecular traits mapped to multiple genescombined_pip_by_group_multi <- combine_gene_pips(susie_alpha_res_multi_post,
group_by = "gene_name",
by = "group",
method = "combine_cs",
filter_cs = TRUE,
include_cs_id = F)
combined_pip_sig_multi <- subset(combined_pip_by_group_multi, combined_pip > 0.8)
DT::datatable(combined_pip_sig_multi,caption = htmltools::tags$caption( style = 'caption-side: left; text-align: left; color:black; font-size:150% ;','Genes with PIP > 0.8 in multi-group analysis, cs filtered'),options = list(pageLength = 10) )z_gene_multi <- readRDS(paste0(folder_multi_results,"/",trait,"/",trait,".z_gene.RDS"))
z_gene_multi <- z_gene_multi %>%
mutate(molecular_id = sub("\\|.*", "", id)) %>% # Extract ENSG ID from id
left_join(mapping_two %>% dplyr::select(molecular_id, gene_name), by = "molecular_id")Comparing with silver standard genes
We followed the analysis in ctwas paper. The silver standard genes for LDL are:
LDL_silver <- readxl::read_excel("/project/xinhe/xsun/multi_group_ctwas/data/LDL_silver.xlsx")
LDL_silver_known <- LDL_silver[LDL_silver$annotation == "known",]
LDL_silver_bystand <- LDL_silver[LDL_silver$annotation != "known",]
DT::datatable(LDL_silver,caption = htmltools::tags$caption( style = 'caption-side: left; text-align: left; color:black; font-size:150% ;','The silver standard genes for LDL (from ctwas paper, table S2)'),options = list(pageLength = 10) )stats <- data.frame(analysis = c("ctwas paper","ctwasV2 - single eQTL","ctwasV2 - multigroup"),
num_gene_pip08 = c(35, nrow(combined_pip_sig_single),nrow(combined_pip_sig_multi)),
num_gene_known_imputable = c("46 of 69 known",sum(LDL_silver_known$genename %in% z_gene_single$gene_name),sum(LDL_silver_known$genename %in% z_gene_multi$gene_name)),
num_gene_known_pip08 = c(6,sum(LDL_silver_known$genename %in% combined_pip_sig_single$gene_name),sum(LDL_silver_known$genename %in% combined_pip_sig_multi$gene_name)),
num_gene_bystander_imputable = c("539 of 539 bystander",sum(LDL_silver_bystand$genename %in% z_gene_single$gene_name),sum(LDL_silver_bystand$genename %in% z_gene_multi$gene_name)),
num_gene_bystander_pip08 = c(2,sum(LDL_silver_bystand$genename %in% combined_pip_sig_single$gene_name),sum(LDL_silver_bystand$genename %in% combined_pip_sig_multi$gene_name)))
DT::datatable(stats,caption = htmltools::tags$caption( style = 'caption-side: left; text-align: left; color:black; font-size:150% ;',''),options = list(pageLength = 10) )Checking why some silver standard genes are missed
LDL_silver_known_sig <- LDL_silver_known[as.numeric(LDL_silver_known$PIP) > 0.8 & LDL_silver_known$PIP !="NA",]
LDL_silver_known_sig <- LDL_silver_known_sig[,c("genename","cs_index","PIP","z","num_eqtl","region_tag")]
# check z_scores
z_gene_single <- readRDS(paste0(folder_single_results,"/",trait,"/",trait,"_",tissue,".z_gene.RDS"))
z_gene_single <- z_gene_single %>%
  mutate(molecular_id = sub("\\|.*", "", id)) %>%  # Extract ENSG ID from id
  left_join(mapping_two %>% dplyr::select(molecular_id, gene_name), by = "molecular_id")
z_gene_single <- z_gene_single[,c("gene_name","z")]
z_gene_selected <- z_gene_single[z_gene_single$gene_name %in% LDL_silver_known_sig$genename,]
LDL_silver_known_sig <- merge(LDL_silver_known_sig,z_gene_selected, by.x ="genename", by.y = "gene_name",all.x=T)
# check pre-estimated L
screened_region_L <- readRDS(paste0(folder_single_results,"/",trait,"/",trait,"_",tissue,".screened_region_L.RDS"))
region_info <- readRDS("/project2/xinhe/shared_data/multigroup_ctwas/LD_region_info/region_info.RDS")
LDL_silver_known_sig$tag1 <- unlist(strsplit(LDL_silver_known_sig$region_tag,split = "_"))[seq(1,2*nrow(LDL_silver_known_sig), by =2)]
LDL_silver_known_sig$tag2 <- unlist(strsplit(LDL_silver_known_sig$region_tag,split = "_"))[seq(2,2*nrow(LDL_silver_known_sig), by =2)]
LDL_silver_known_sig$regionid <- ctwas:::convert_region_tags_to_region_id(region_info, LDL_silver_known_sig$tag1, LDL_silver_known_sig$tag2)
LDL_silver_known_sig$screened_region_L_newversion <- screened_region_L[LDL_silver_known_sig$regionid]
combined_pip_by_group_single_nocs <- combine_gene_pips(susie_alpha_res_single_post,
group_by = "gene_name",
by = "group",
method = "combine_cs",
filter_cs = F,
include_cs_id = T)
LDL_silver_known_sig <- merge(LDL_silver_known_sig, combined_pip_by_group_single_nocs, by.x = "genename", by.y = "gene_name", all.x = T)
LDL_silver_known_sig <- LDL_silver_known_sig[,c("genename","cs_index","PIP","z.x","z.y","screened_region_L_newversion","combined_cs_id","combined_pip")]
colnames(LDL_silver_known_sig) <- c("genename","cs_index_old","PIP_old","z_old","z_new","screened_region_L_new","cs_id_new","PIP_new")
DT::datatable(LDL_silver_known_sig,caption = htmltools::tags$caption( style = 'caption-side: left; text-align: left; color:black; font-size:150% ;','Comparing the old results and new results for the silver standard genes'),options = list(pageLength = 10) )print("ABCG8 weights")[1] "ABCG8 weights"weights_single <- readRDS(paste0(folder_single_results,"/",trait,"/",trait,"_",tissue,".preprocessed.weights.E.RDS"))
weights_gene <- weights_single[["ENSG00000143921.6"]]
print(weights_gene)NULLsnp_map <- readRDS("/project2/xinhe/shared_data/multigroup_ctwas/LD_region_info/snp_map.RDS")
finemap_res_single <- ctwas_res_single_post$finemap_res
finemap_res_single <- anno_finemap_res(finemap_res_single,
snp_map = snp_map,
mapping_table = mapping_two,
add_gene_annot = TRUE,
map_by = "molecular_id",
drop_unmapped = TRUE,
add_position = TRUE,
use_gene_pos = "mid")2025-01-13 17:46:50 INFO::Annotating fine-mapping result ...
2025-01-13 17:46:50 INFO::Map molecular traits to genes
2025-01-13 17:46:58 INFO::Add gene positions
2025-01-13 17:46:58 INFO::Add SNP positionsprint("PLTP")[1] "PLTP"region_id <- "20_44051536_46210417"
make_locusplot(finemap_res_single,
region_id = region_id,
ens_db = ens_db,
weights = weights_single,
highlight_pip = 0.8,
filter_protein_coding_genes = TRUE,
filter_cs = TRUE,
color_pval_by = "cs",
color_pip_by = "cs",panel.heights = c(4,4,1,1))2025-01-13 17:47:15 INFO::Limit to protein coding genes
2025-01-13 17:47:15 INFO::focal id: ENSG00000100979.14|Liver_eQTL
2025-01-13 17:47:15 INFO::focal molecular trait: PLTP Liver eQTL
2025-01-13 17:47:15 INFO::Range of locus: chr20:44052014-46210287
2025-01-13 17:47:15 INFO::focal molecular trait QTL positions: 45906012
2025-01-13 17:47:15 INFO::Limit PIPs to credible sets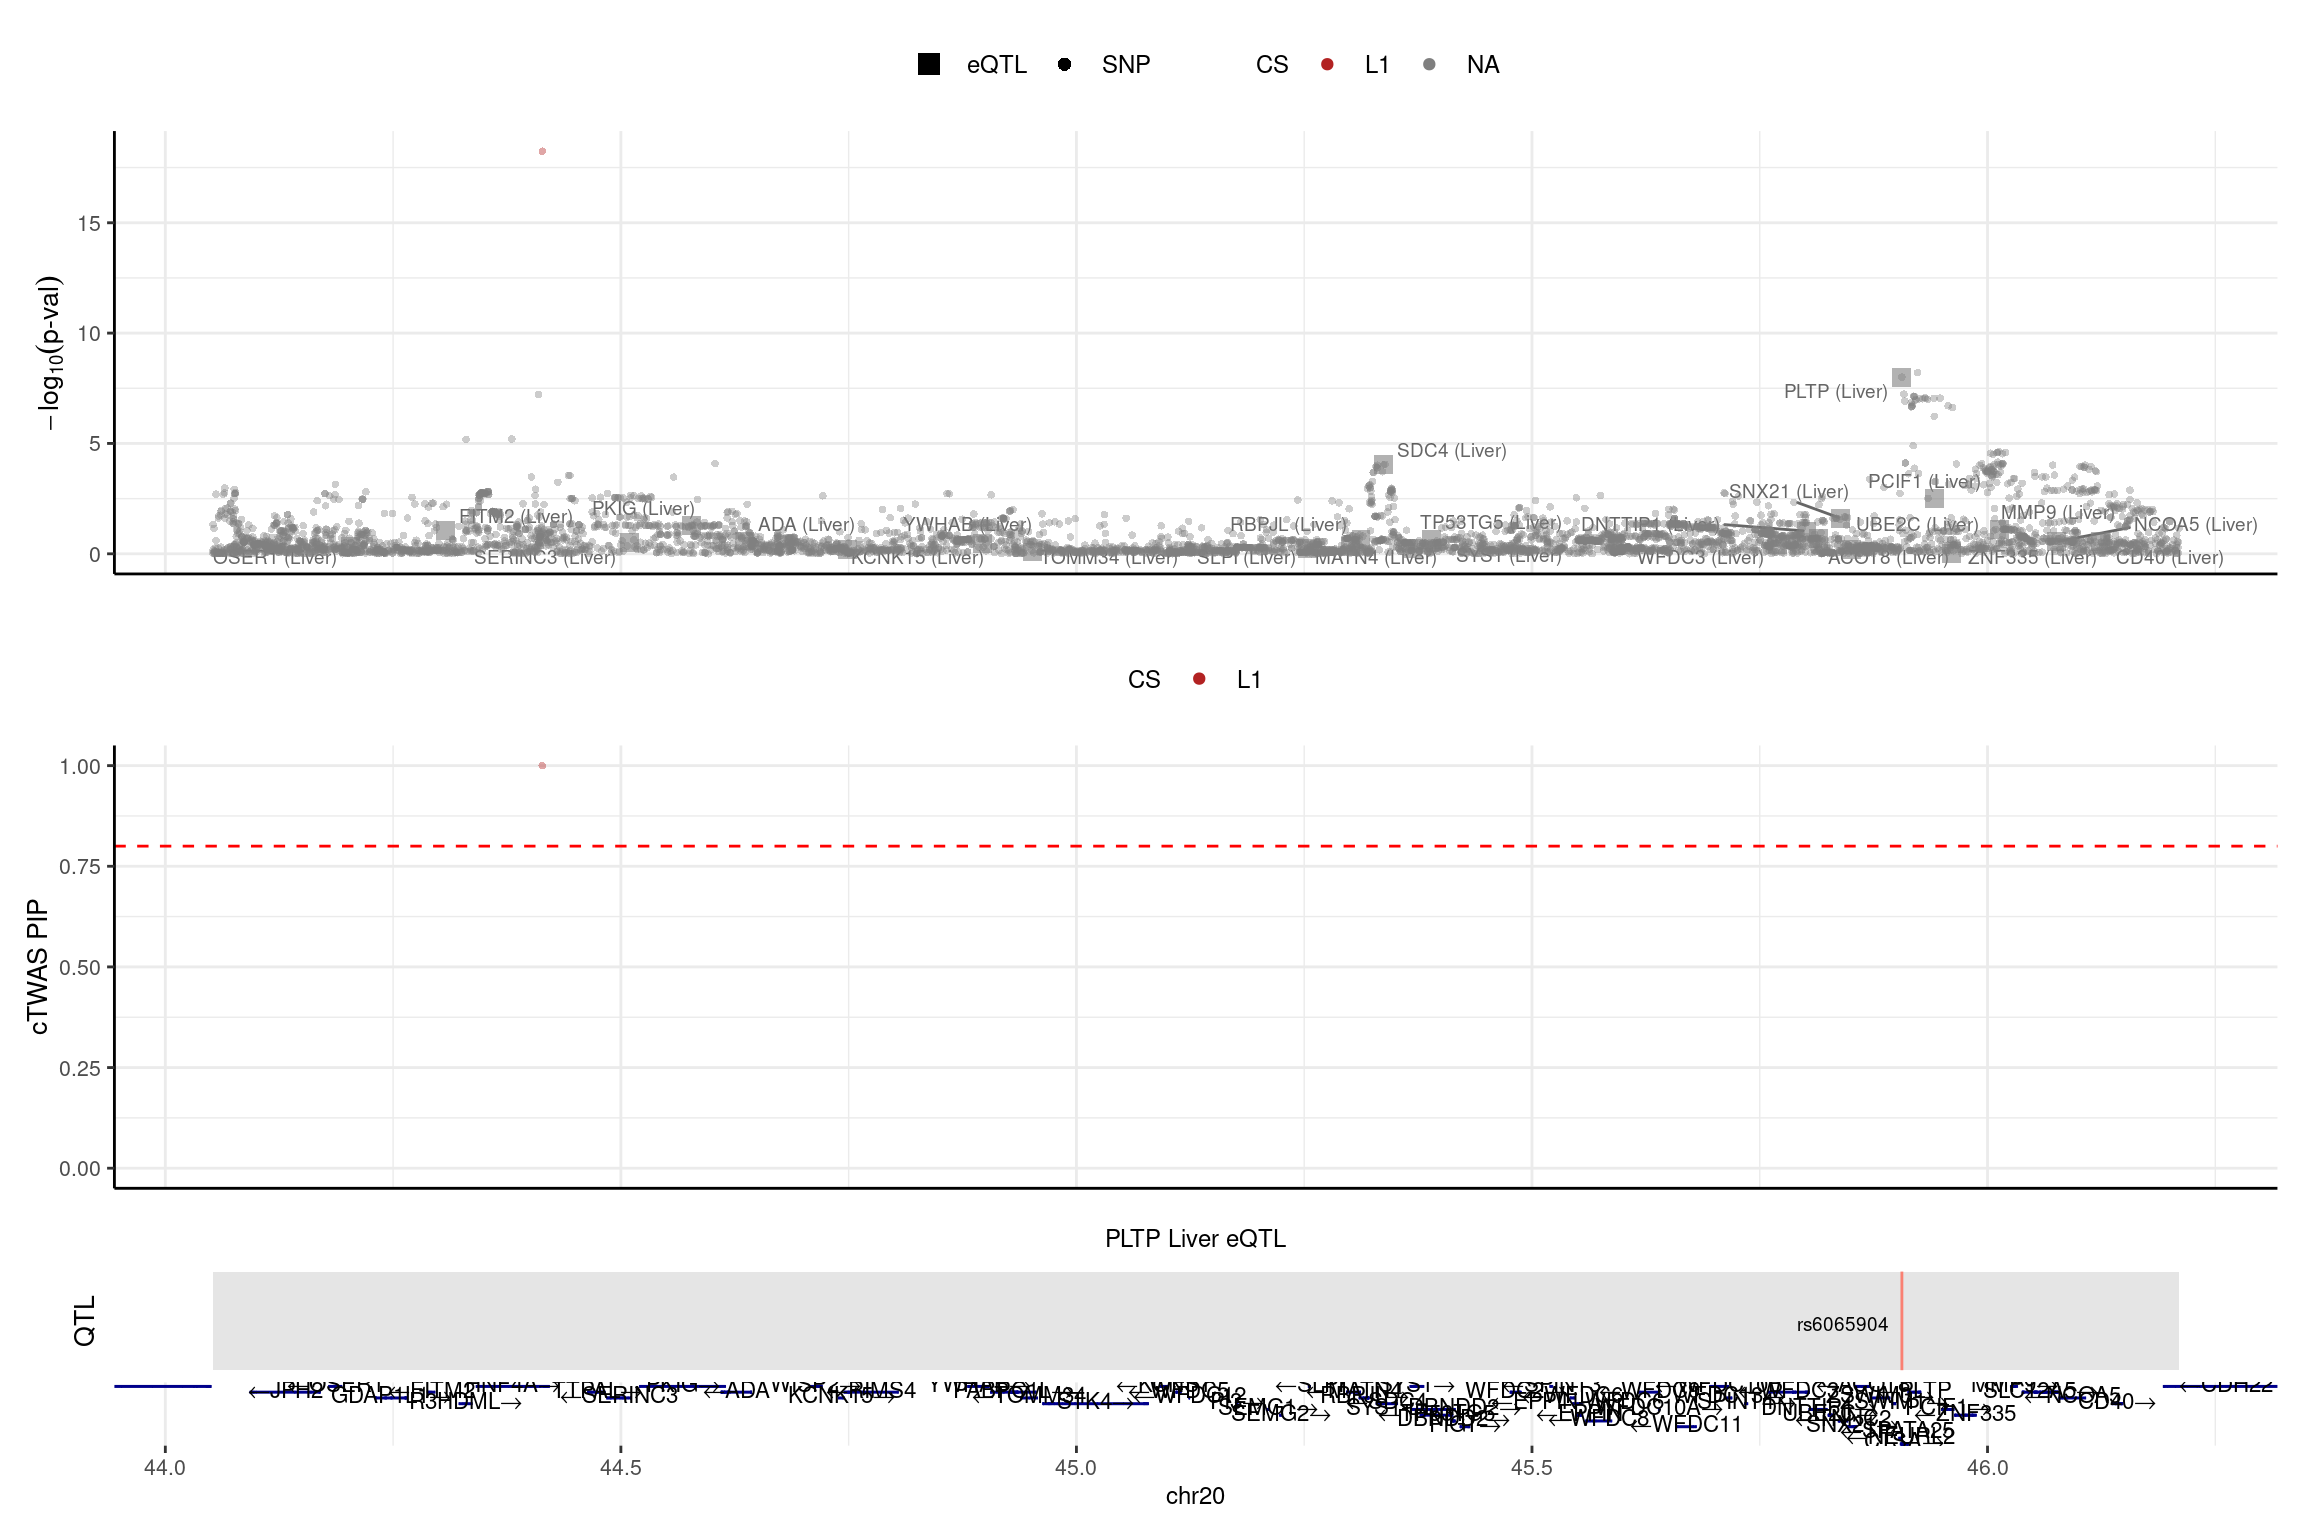
| Version | Author | Date |
|---|---|---|
| 80e204a | XSun | 2025-01-10 |
print("ABCA1")[1] "ABCA1"region_id <- "9_104819468_106536473"
make_locusplot(finemap_res_single,
region_id = region_id,
ens_db = ens_db,
weights = weights_single,
highlight_pip = 0.8,
filter_protein_coding_genes = TRUE,
filter_cs = TRUE,
color_pval_by = "cs",
color_pip_by = "cs",panel.heights = c(4,4,1,1))2025-01-13 17:47:20 INFO::Limit to protein coding genes
2025-01-13 17:47:20 INFO::focal id: ENSG00000165029.15|Liver_eQTL
2025-01-13 17:47:20 INFO::focal molecular trait: ABCA1 Liver eQTL
2025-01-13 17:47:20 INFO::Range of locus: chr9:104819368-106535859
2025-01-13 17:47:20 INFO::focal molecular trait QTL positions: 104906792
2025-01-13 17:47:20 INFO::Limit PIPs to credible sets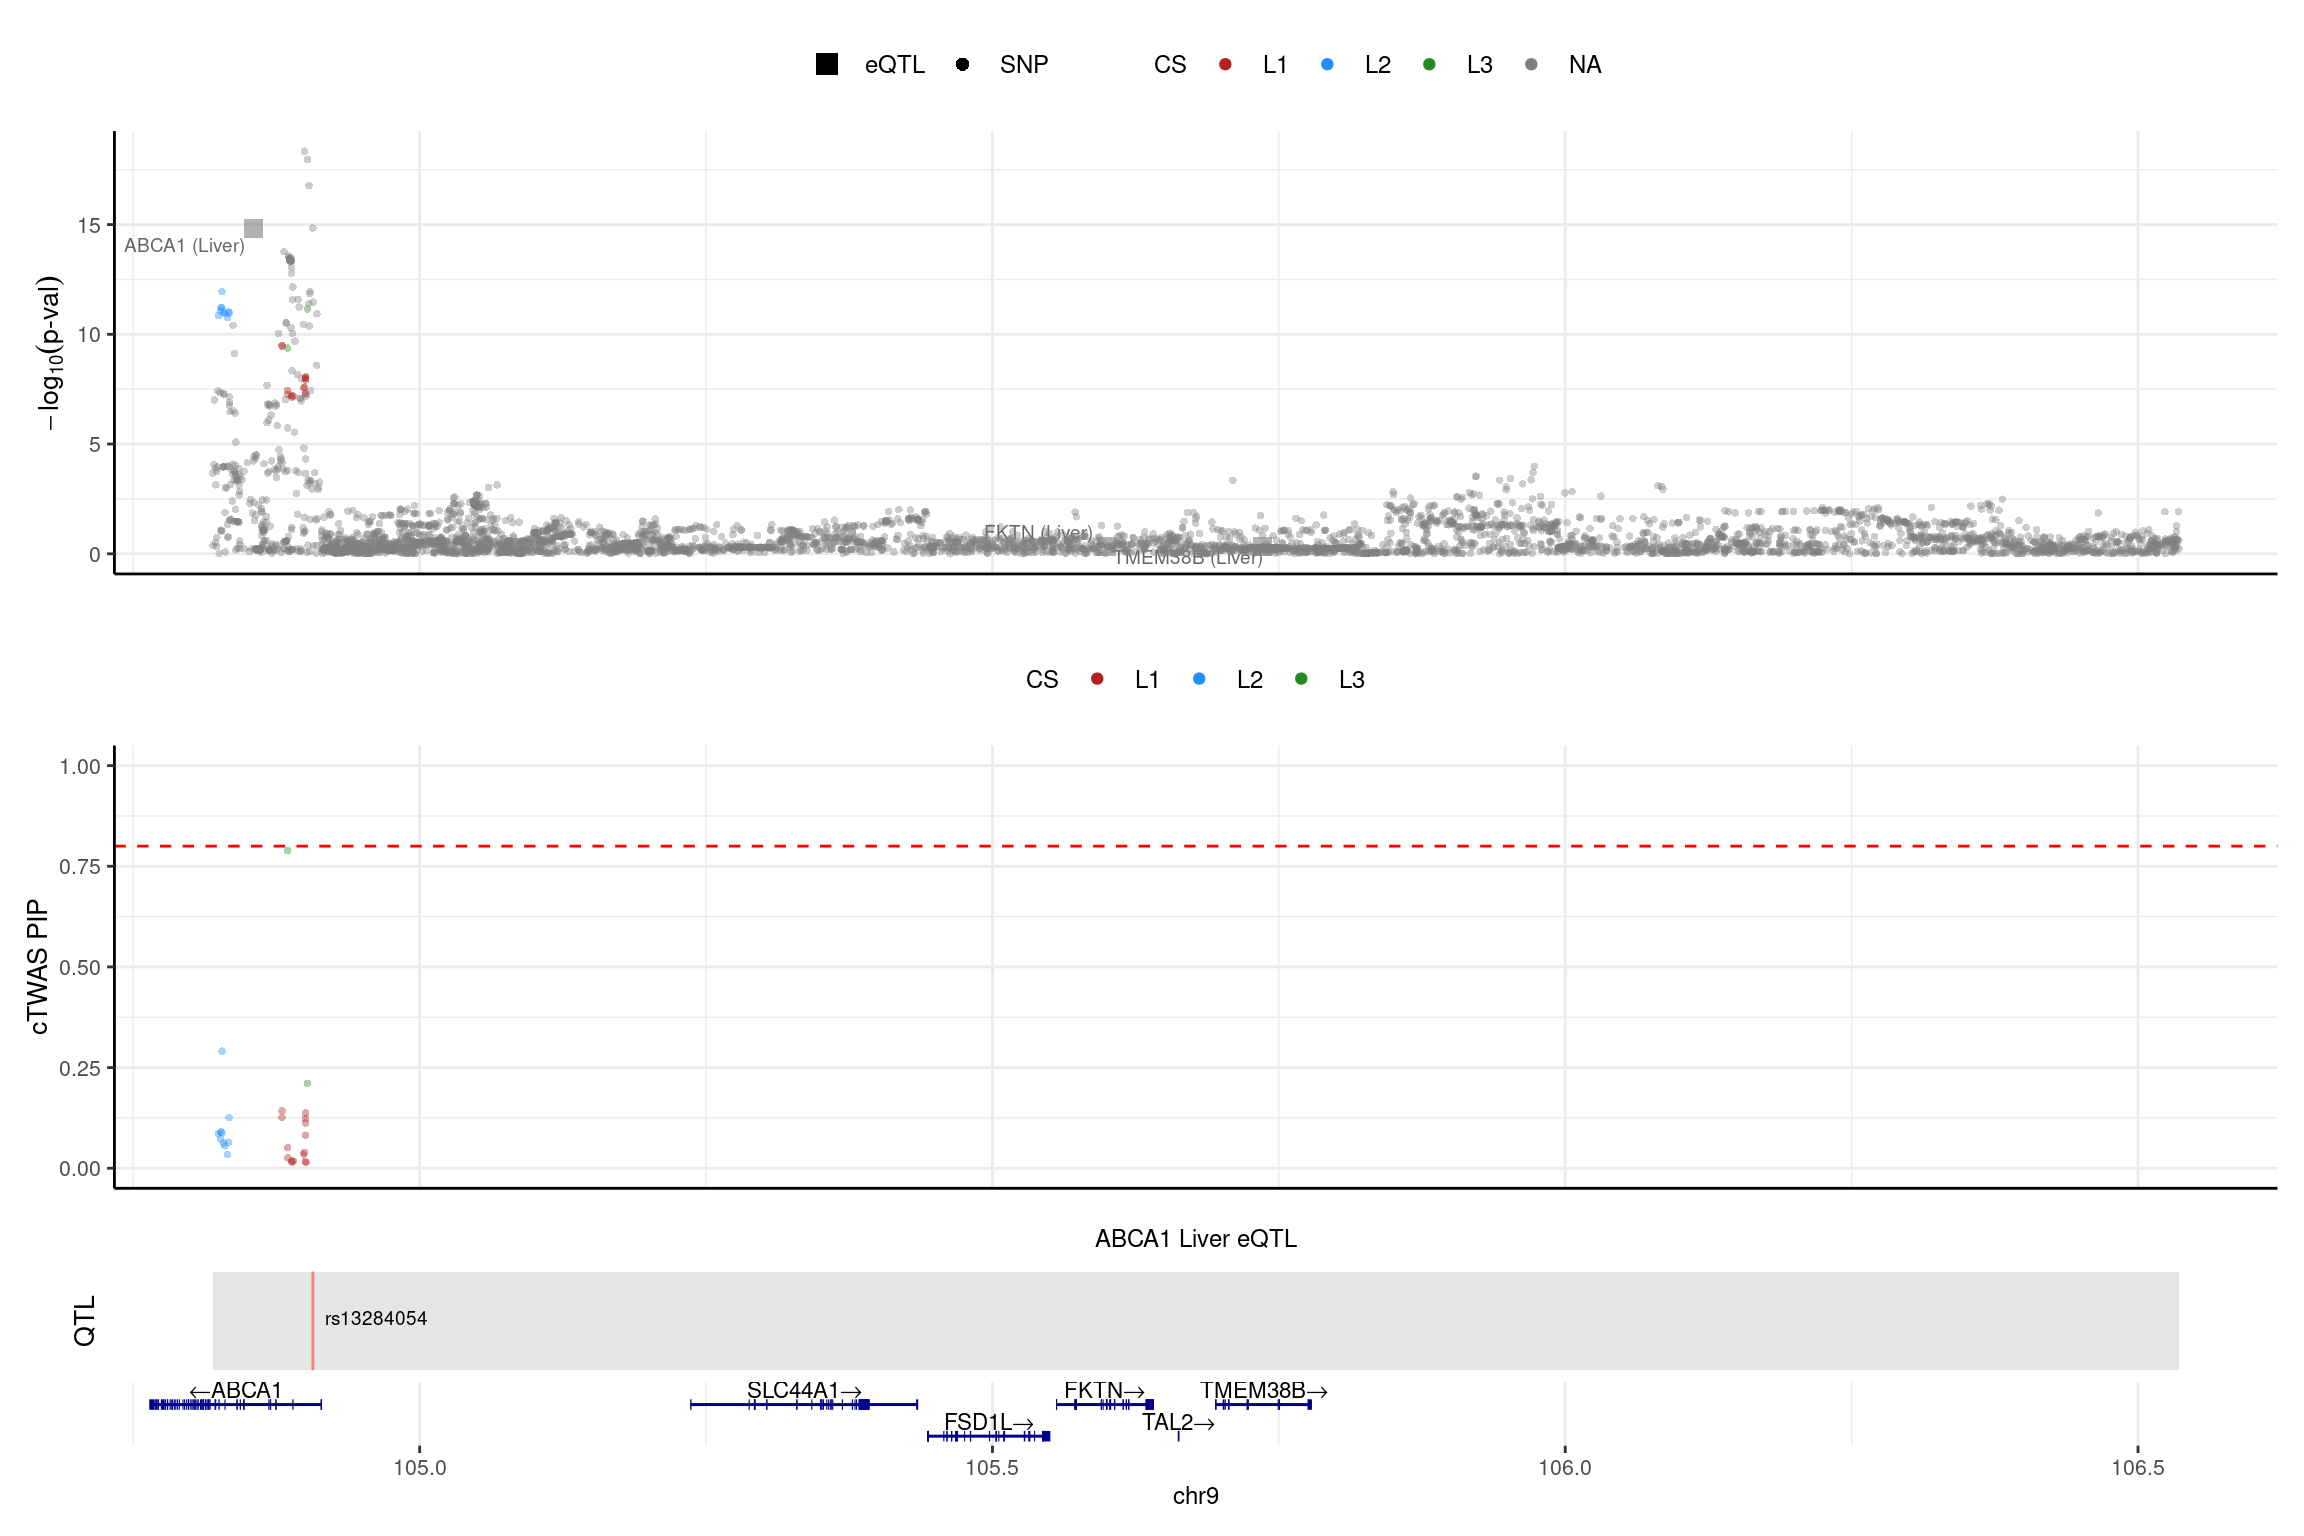
print("NPC1L1")[1] "NPC1L1"region_id <- "7_43119475_44724229"
make_locusplot(finemap_res_single,
region_id = region_id,
ens_db = ens_db,
weights = weights_single,
highlight_pip = 0.8,
filter_protein_coding_genes = TRUE,
filter_cs = TRUE,
color_pval_by = "cs",
color_pip_by = "cs",panel.heights = c(4,4,1,1))2025-01-13 17:47:22 INFO::Limit to protein coding genes
2025-01-13 17:47:22 INFO::focal id: ENSG00000136271.10|Liver_eQTL
2025-01-13 17:47:22 INFO::focal molecular trait: DDX56 Liver eQTL
2025-01-13 17:47:22 INFO::Range of locus: chr7:43119604-44723797
2025-01-13 17:47:22 INFO::focal molecular trait QTL positions: 44575121,44575587
2025-01-13 17:47:22 INFO::Limit PIPs to credible sets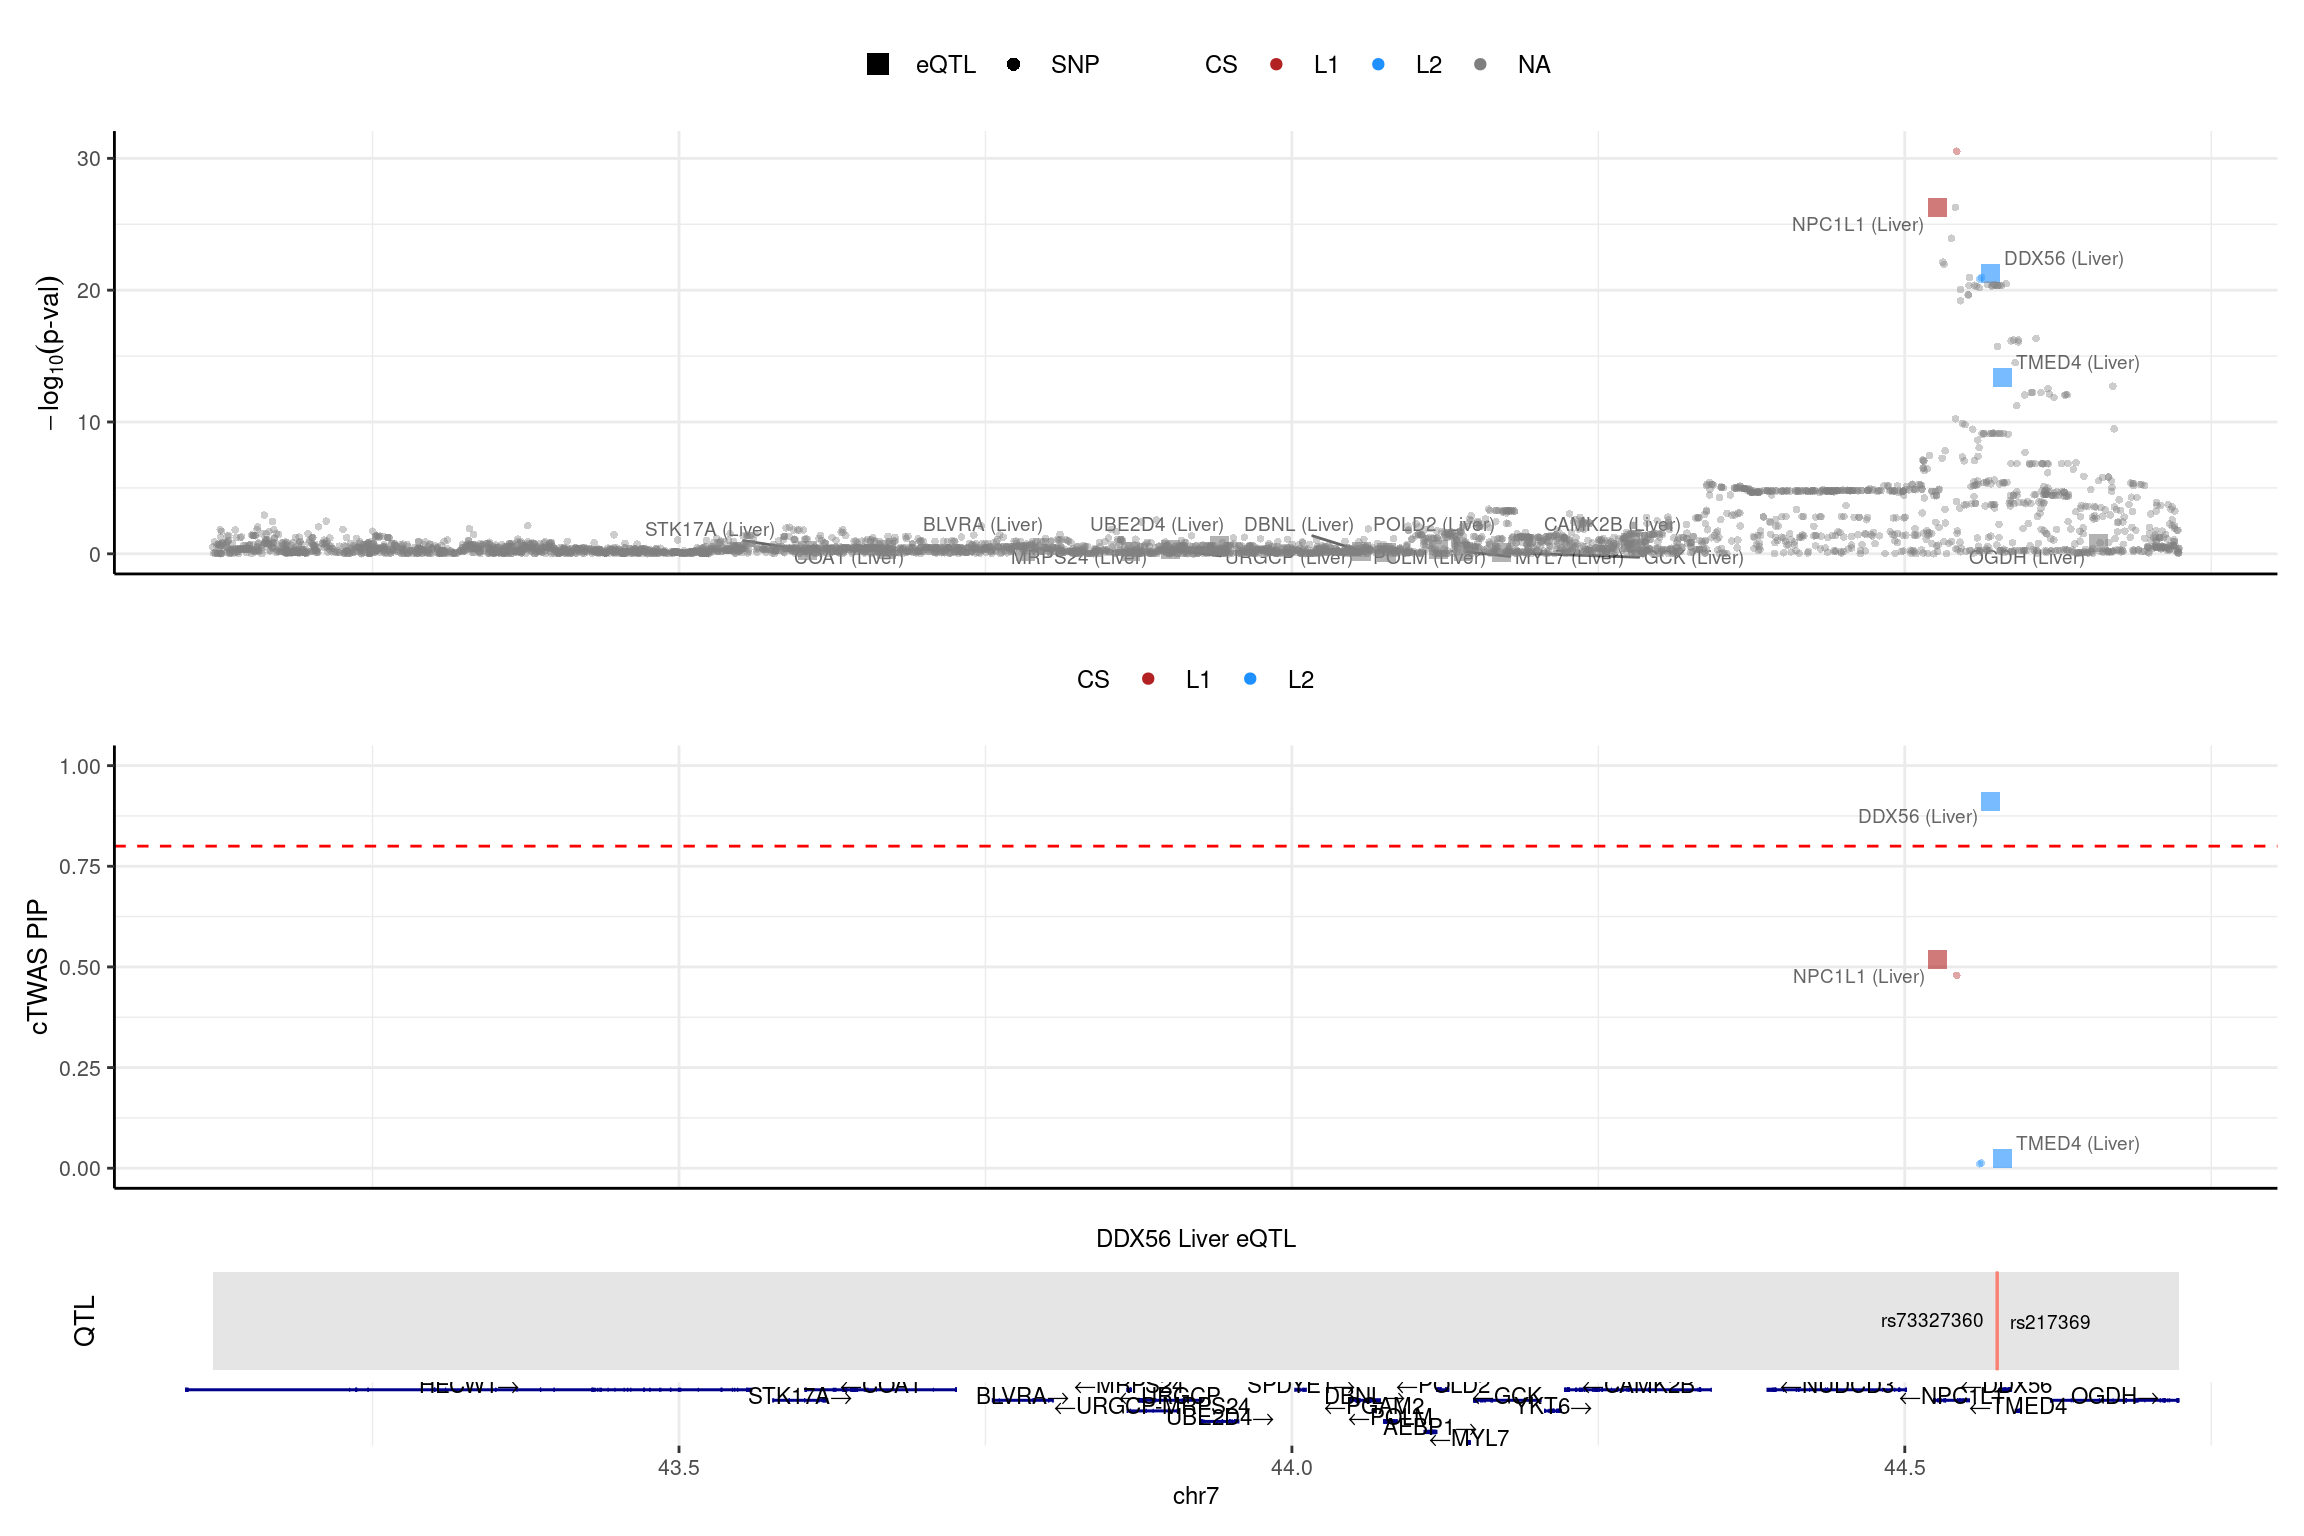
PIP partition for the top genes
plot_heatmap_bytissue(heatmap_data = combined_pip_sig_multi, main = "PIP partition for genes with PIP > 0.8 from multi-group analysis",tissues = tissues)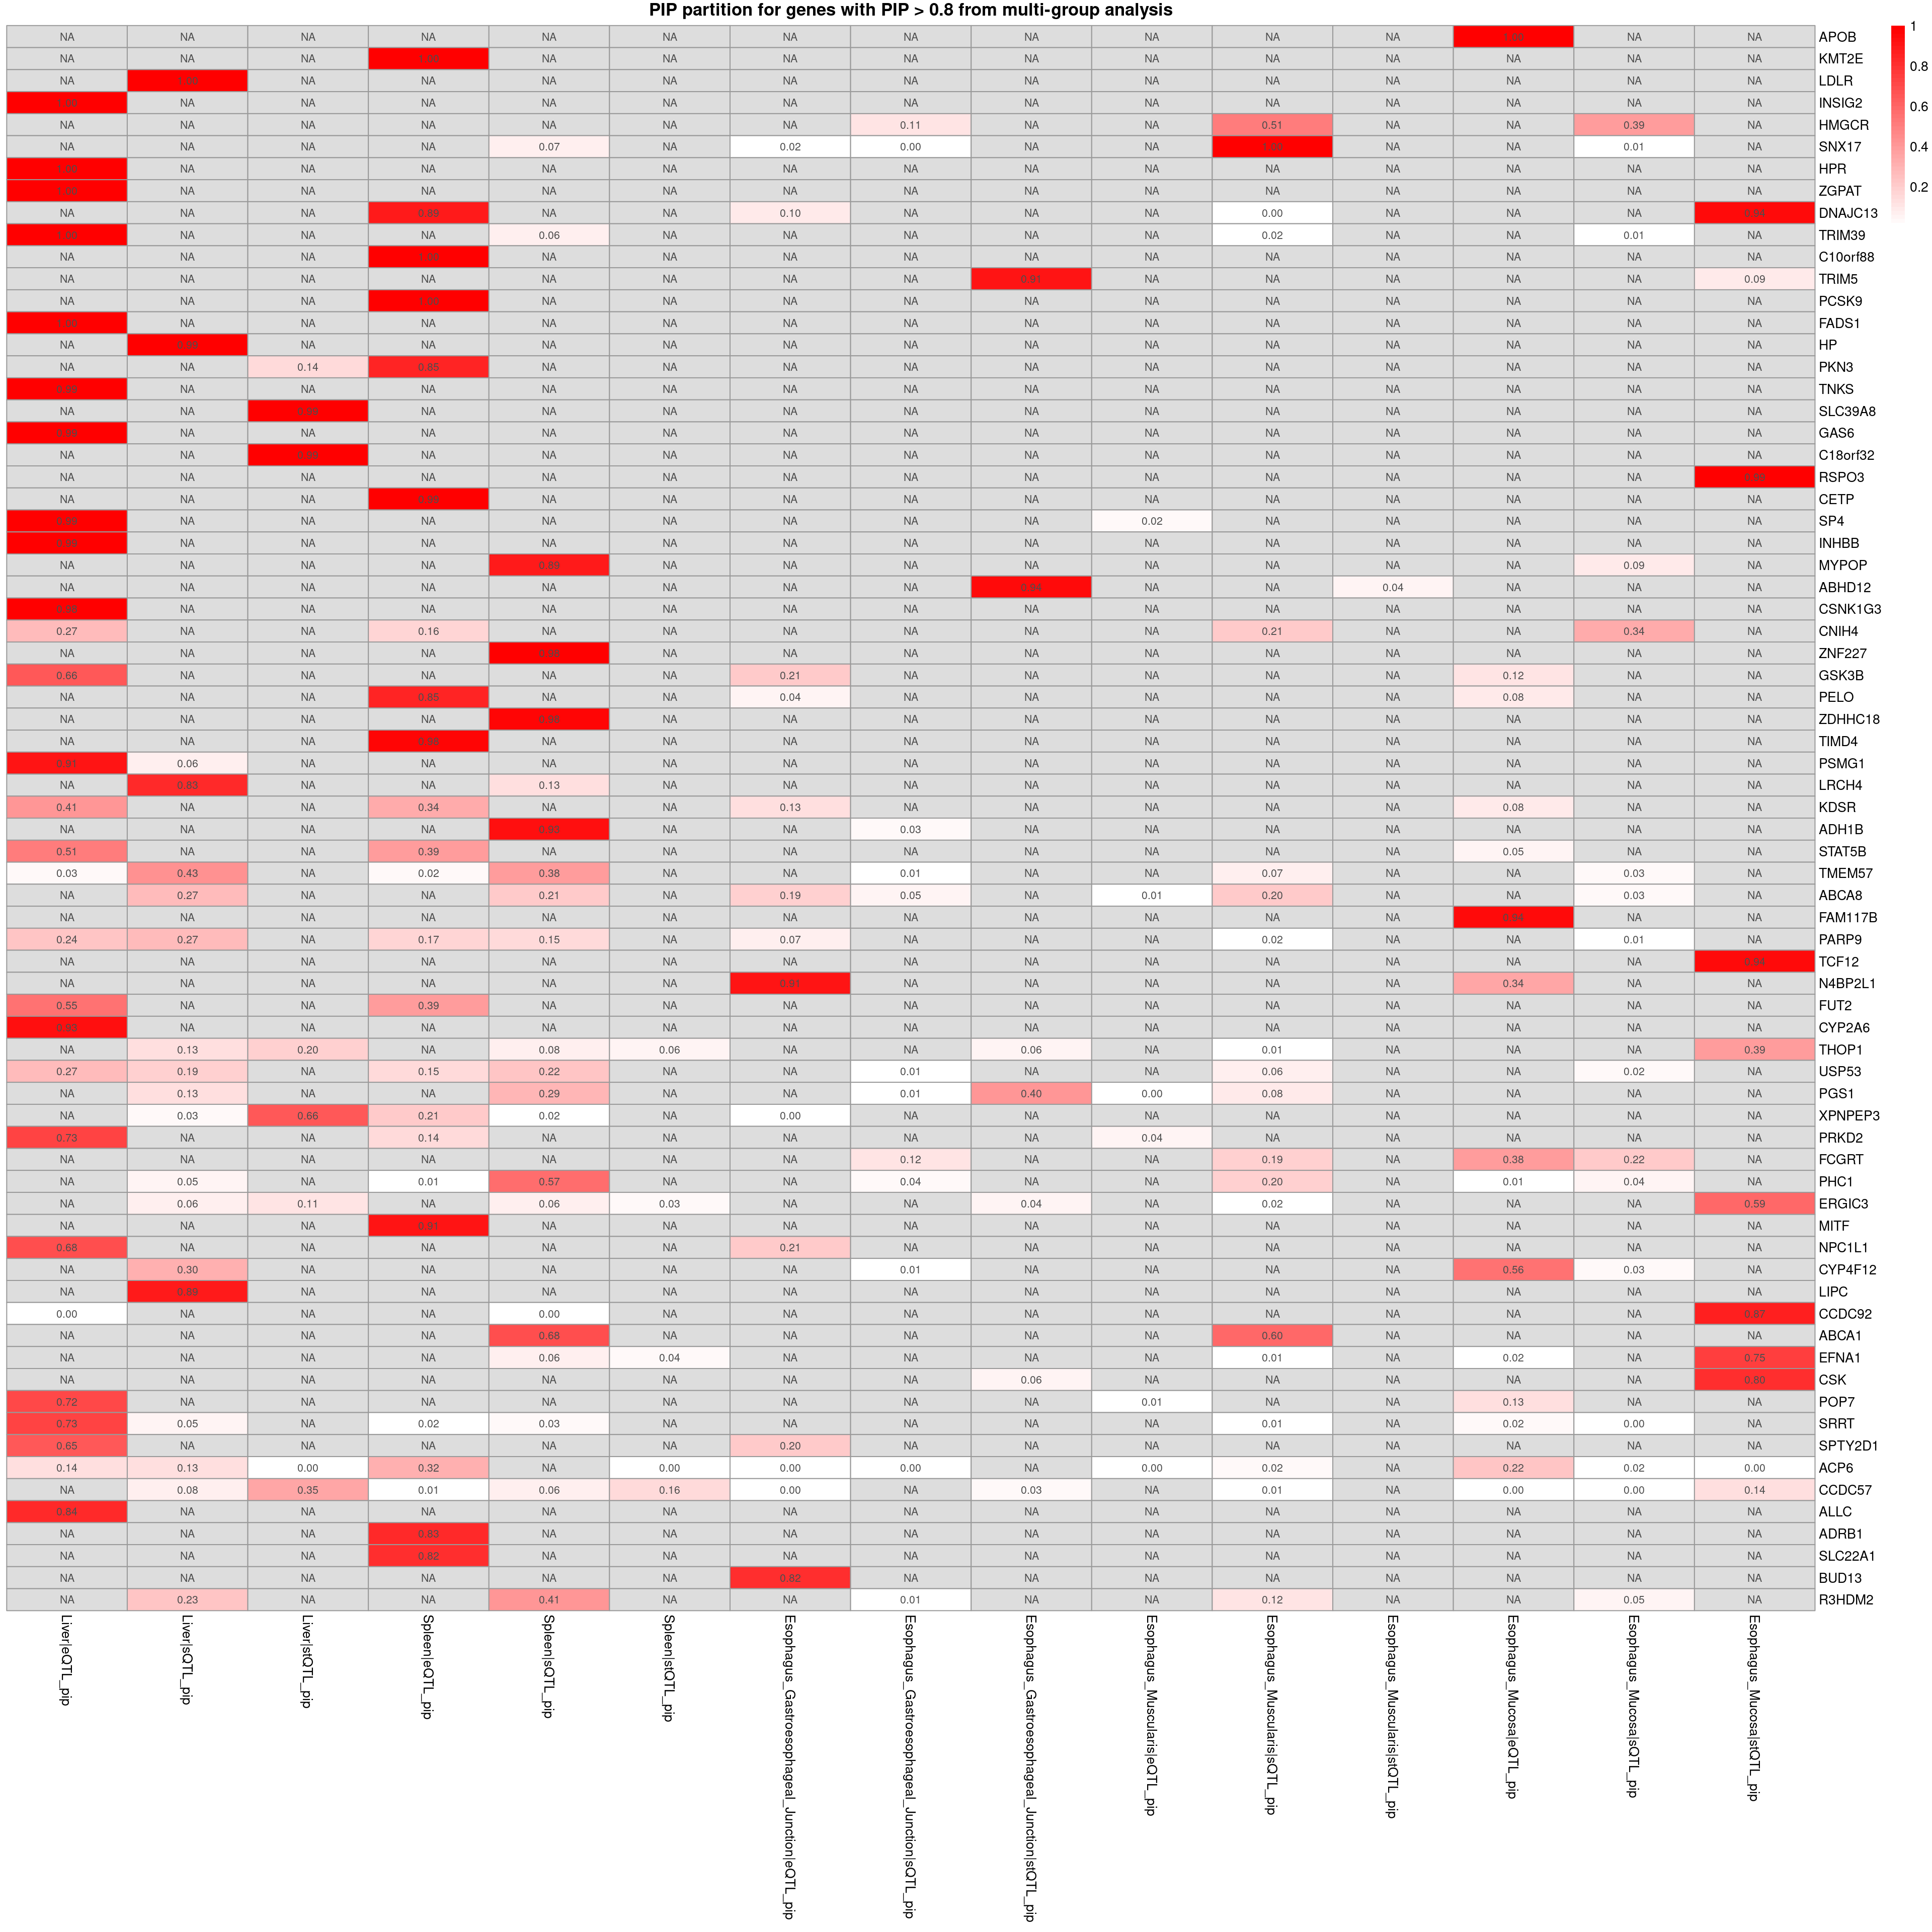
plot_heatmap_byomics(heatmap_data = combined_pip_sig_multi, main = "PIP partition for genes with PIP > 0.8 from multi-group analysis")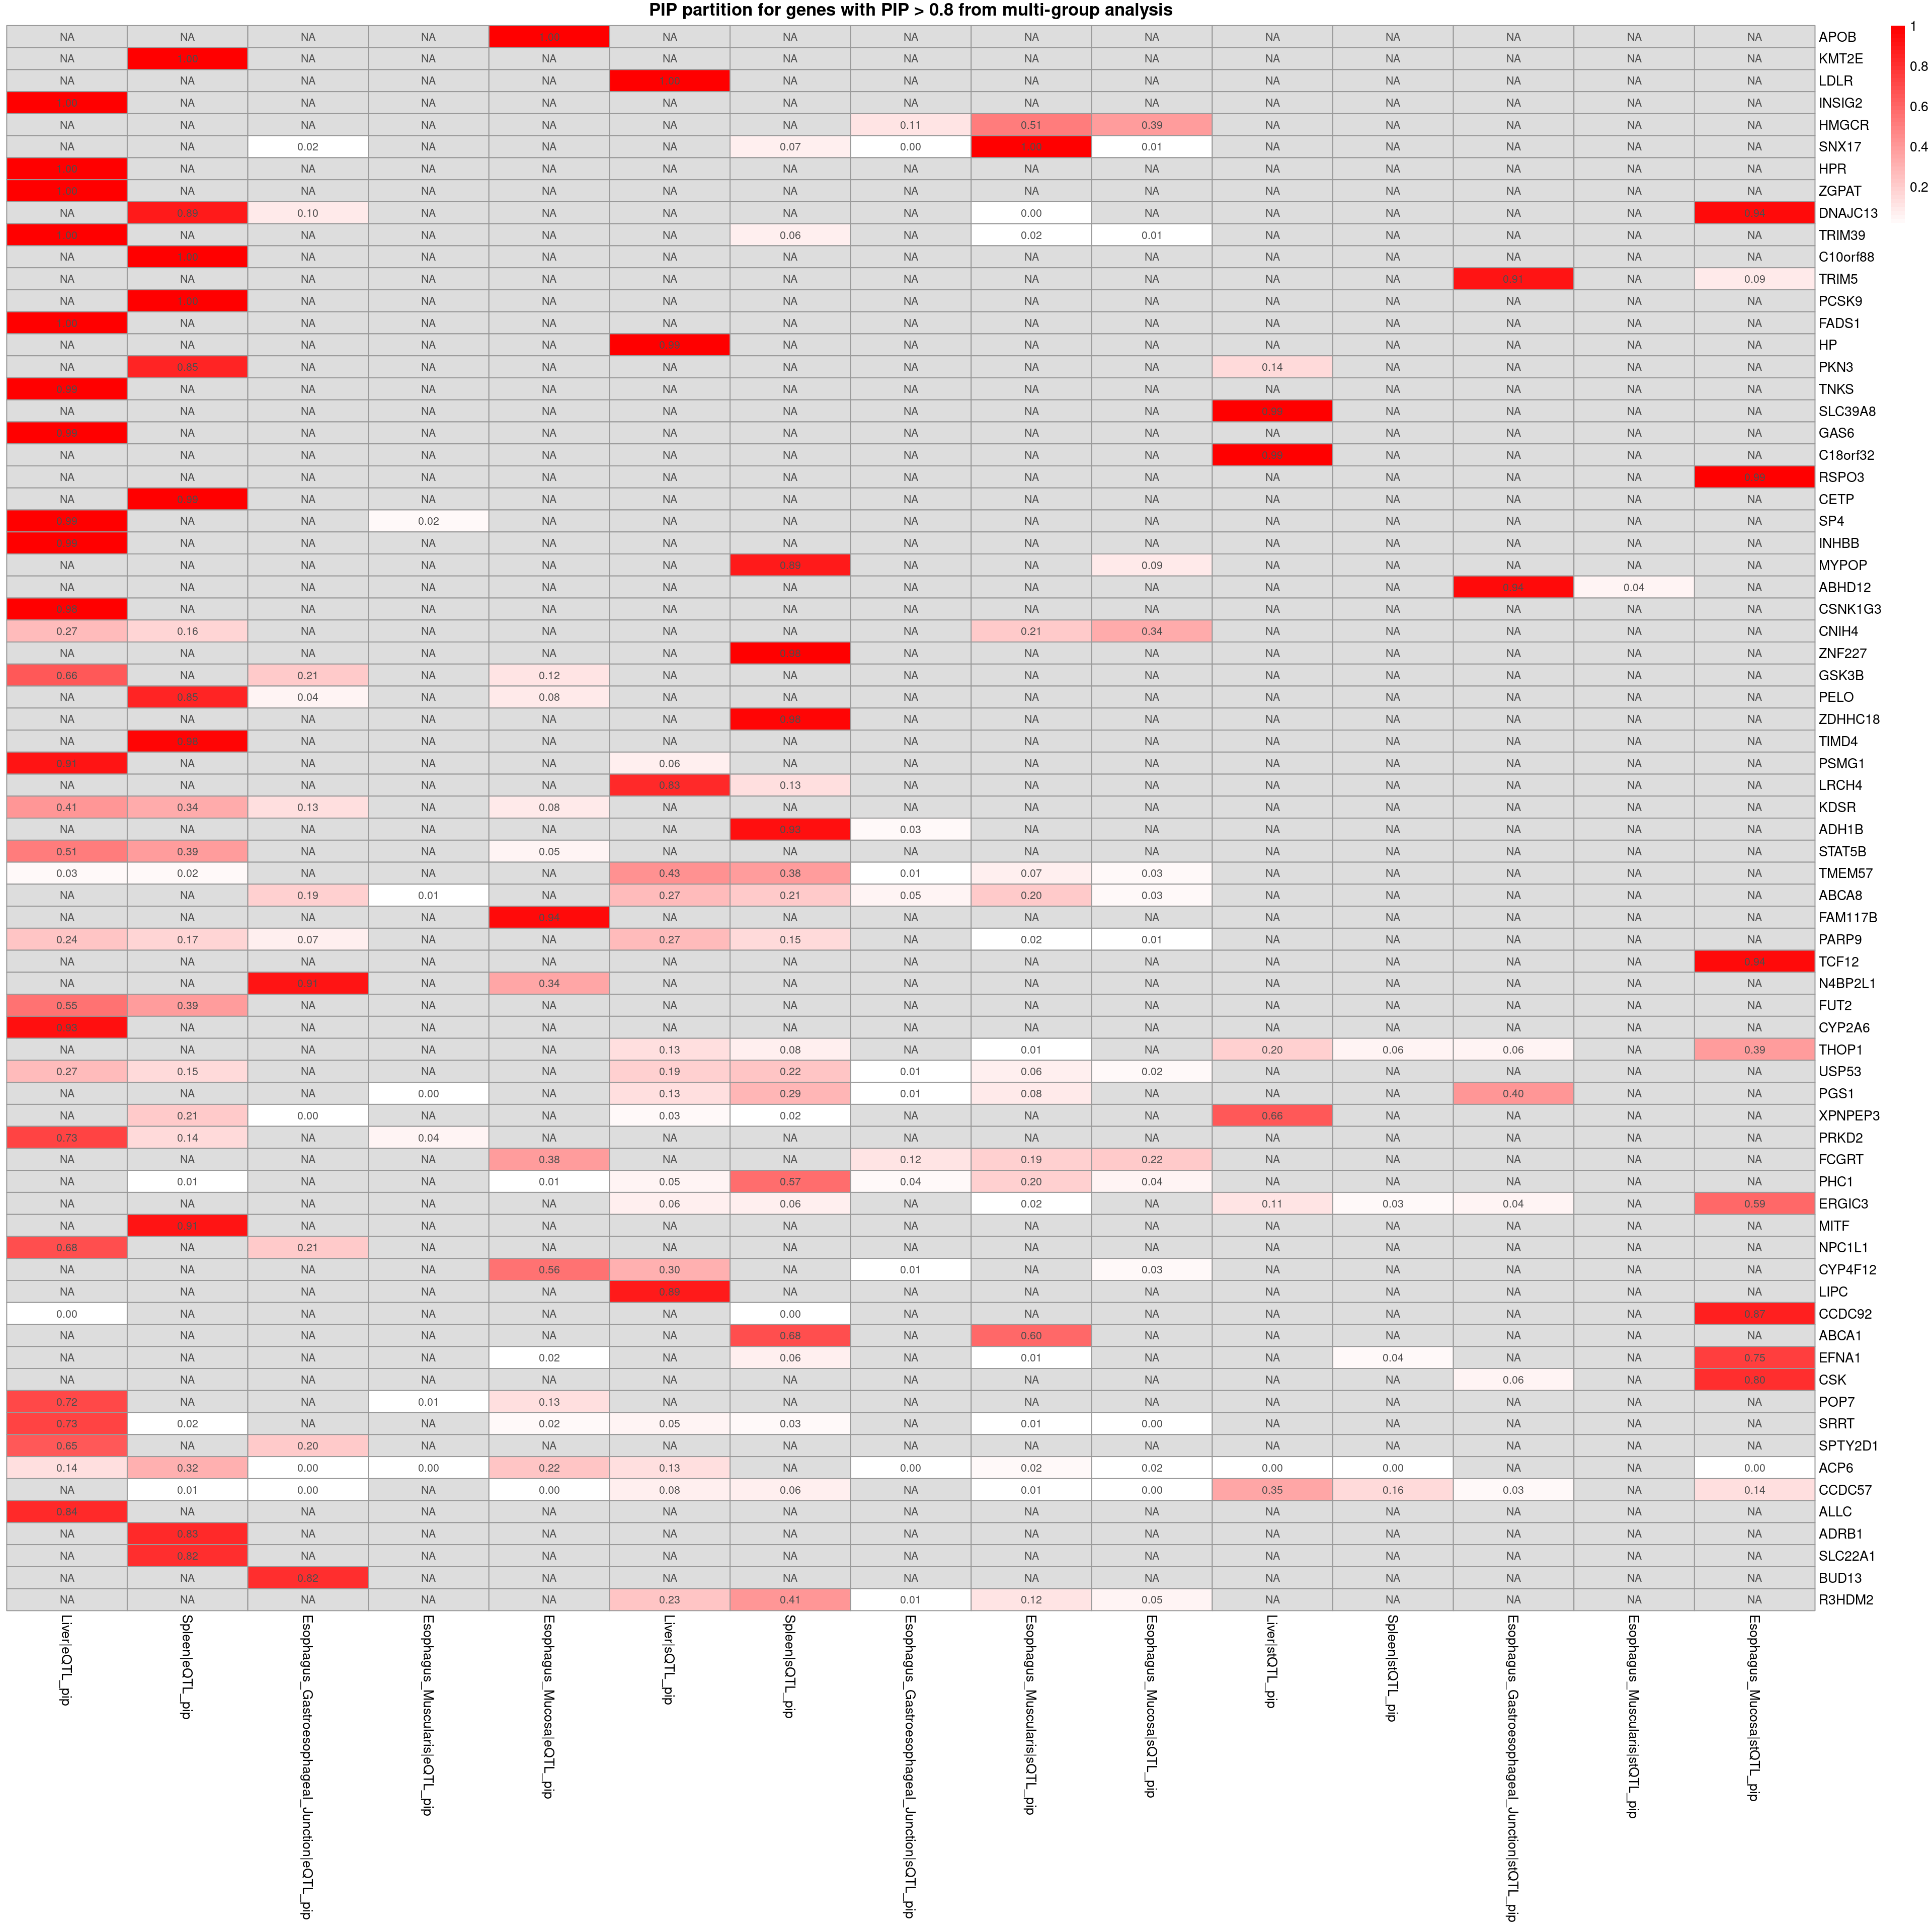
sessionInfo()R version 4.2.0 (2022-04-22)
Platform: x86_64-pc-linux-gnu (64-bit)
Running under: CentOS Linux 7 (Core)
Matrix products: default
BLAS/LAPACK: /software/openblas-0.3.13-el7-x86_64/lib/libopenblas_haswellp-r0.3.13.so
locale:
[1] LC_CTYPE=en_US.UTF-8 LC_NUMERIC=C
[3] LC_TIME=en_US.UTF-8 LC_COLLATE=en_US.UTF-8
[5] LC_MONETARY=en_US.UTF-8 LC_MESSAGES=en_US.UTF-8
[7] LC_PAPER=en_US.UTF-8 LC_NAME=C
[9] LC_ADDRESS=C LC_TELEPHONE=C
[11] LC_MEASUREMENT=en_US.UTF-8 LC_IDENTIFICATION=C
attached base packages:
[1] stats4 stats graphics grDevices utils datasets methods
[8] base
other attached packages:
[1] pheatmap_1.0.12 EnsDb.Hsapiens.v86_2.99.0
[3] ensembldb_2.20.2 AnnotationFilter_1.20.0
[5] GenomicFeatures_1.48.3 AnnotationDbi_1.58.0
[7] Biobase_2.56.0 GenomicRanges_1.48.0
[9] GenomeInfoDb_1.39.9 IRanges_2.30.0
[11] S4Vectors_0.34.0 BiocGenerics_0.42.0
[13] dplyr_1.1.4 ctwas_0.4.20.9001
loaded via a namespace (and not attached):
[1] colorspace_2.0-3 rjson_0.2.21
[3] ellipsis_0.3.2 rprojroot_2.0.3
[5] XVector_0.36.0 locuszoomr_0.2.1
[7] fs_1.5.2 rstudioapi_0.13
[9] farver_2.1.0 DT_0.22
[11] ggrepel_0.9.1 bit64_4.0.5
[13] fansi_1.0.3 xml2_1.3.3
[15] codetools_0.2-18 logging_0.10-108
[17] cachem_1.0.6 knitr_1.39
[19] jsonlite_1.8.0 workflowr_1.7.0
[21] Rsamtools_2.12.0 dbplyr_2.1.1
[23] png_0.1-7 readr_2.1.2
[25] compiler_4.2.0 httr_1.4.3
[27] assertthat_0.2.1 Matrix_1.5-3
[29] fastmap_1.1.0 lazyeval_0.2.2
[31] cli_3.6.1 later_1.3.0
[33] htmltools_0.5.2 prettyunits_1.1.1
[35] tools_4.2.0 gtable_0.3.0
[37] glue_1.6.2 GenomeInfoDbData_1.2.8
[39] rappdirs_0.3.3 Rcpp_1.0.12
[41] cellranger_1.1.0 jquerylib_0.1.4
[43] vctrs_0.6.5 Biostrings_2.64.0
[45] rtracklayer_1.56.0 crosstalk_1.2.0
[47] xfun_0.41 stringr_1.5.1
[49] lifecycle_1.0.4 irlba_2.3.5
[51] restfulr_0.0.14 XML_3.99-0.14
[53] zlibbioc_1.42.0 zoo_1.8-10
[55] scales_1.3.0 gggrid_0.2-0
[57] hms_1.1.1 promises_1.2.0.1
[59] MatrixGenerics_1.8.0 ProtGenerics_1.28.0
[61] parallel_4.2.0 SummarizedExperiment_1.26.1
[63] RColorBrewer_1.1-3 LDlinkR_1.2.3
[65] yaml_2.3.5 curl_4.3.2
[67] memoise_2.0.1 ggplot2_3.5.1
[69] sass_0.4.1 biomaRt_2.54.1
[71] stringi_1.7.6 RSQLite_2.3.1
[73] highr_0.9 BiocIO_1.6.0
[75] filelock_1.0.2 BiocParallel_1.30.3
[77] rlang_1.1.2 pkgconfig_2.0.3
[79] matrixStats_0.62.0 bitops_1.0-7
[81] evaluate_0.15 lattice_0.20-45
[83] purrr_1.0.2 labeling_0.4.2
[85] GenomicAlignments_1.32.0 htmlwidgets_1.5.4
[87] cowplot_1.1.1 bit_4.0.4
[89] tidyselect_1.2.0 magrittr_2.0.3
[91] R6_2.5.1 generics_0.1.2
[93] DelayedArray_0.22.0 DBI_1.2.2
[95] withr_2.5.0 pgenlibr_0.3.3
[97] pillar_1.9.0 whisker_0.4
[99] KEGGREST_1.36.3 RCurl_1.98-1.7
[101] mixsqp_0.3-43 tibble_3.2.1
[103] crayon_1.5.1 utf8_1.2.2
[105] BiocFileCache_2.4.0 plotly_4.10.0
[107] tzdb_0.4.0 rmarkdown_2.25
[109] progress_1.2.2 readxl_1.4.0
[111] grid_4.2.0 data.table_1.14.2
[113] blob_1.2.3 git2r_0.30.1
[115] digest_0.6.29 tidyr_1.3.0
[117] httpuv_1.6.5 munsell_0.5.0
[119] viridisLite_0.4.0 bslib_0.3.1