Main simulation study
Scenario 1
The simulated data in this example are generated to demonstrate how to use the KODAMA and UMAP techniques for cluster and spatial domain analysis. We create two distinct regions representing areas rich in T cells and B cells within the lymph node. We generate x and y coordinates for the two regions, assigning labels to simulate different cell types (T cells and B cells).
library("KODAMA")Loading required package: minervaLoading required package: RtsneLoading required package: umap
Attaching package: 'KODAMA'The following object is masked from 'package:umap':
umap.defaultslibrary("KODAMAextra")Loading required package: parallelLoading required package: doParallelLoading required package: foreachLoading required package: iteratorsLoading required package: e1071x1=runif(100,min=-1,max=0)
x2=runif(100,min=0,max=1)
y1=runif(100)
y2=runif(100)
x=c(x1,x2)
y=c(y1,y2)
xy=cbind(x,y)
labels=rep(c(TRUE,FALSE),each=100)
ss=sample(100,5)
labels[ss]=!labels[ss]
labels=labels
region=rep(1:0,each=100)
data=cbind(rnorm(200,mean=labels,sd=0.1),
rnorm(200,mean=labels,sd=0.1))
color.code=c("#1d79d0aa","#53ca3eaa")
kk <- KODAMA.matrix.parallel(data,spatial=xy,spatial.resolution=0.1,M=100,
FUN="PLS",
landmarks = 100000,
splitting = 100,
f.par.pls = 2,
n.cores=4)socket cluster with 4 nodes on host 'localhost'
================================================================================[1] "Finished parallel computation"
[1] "Calculation of dissimilarity matrix..."
================================================================================vis=RunKODAMAvisualization(kk,method="UMAP")
u=umap(data)$layout
par(mfrow=c(1,3))
plot(x,y,bg=color.code[region+1],pch=21+2*!labels,cex=1+1.5*region,axes=FALSE,main="Position")
axis(1)
axis(2,las=2)
box()
plot(vis,type="n",axes=FALSE,main="KODAMA")
axis(1)
axis(2,las=2)
box()
points(vis[!labels,],bg=color.code[region+1][!labels],pch=21+2,cex=1+1.5*region[!labels])
points(vis[labels,],bg=color.code[region+1][labels],pch=21+2*0,cex=1+1.5*region[labels])
plot(u,type="n",axes=FALSE,xlab="Dimension 1",ylab="Dimension 2",main="UMAP")
axis(1)
axis(2,las=2)
box()
points(u[!labels,],bg=color.code[region+1][!labels],pch=21+2,cex=1+1.5*region[!labels])
points(u[labels,],bg=color.code[region+1][labels],pch=21+2*0,cex=1+1.5*region[labels])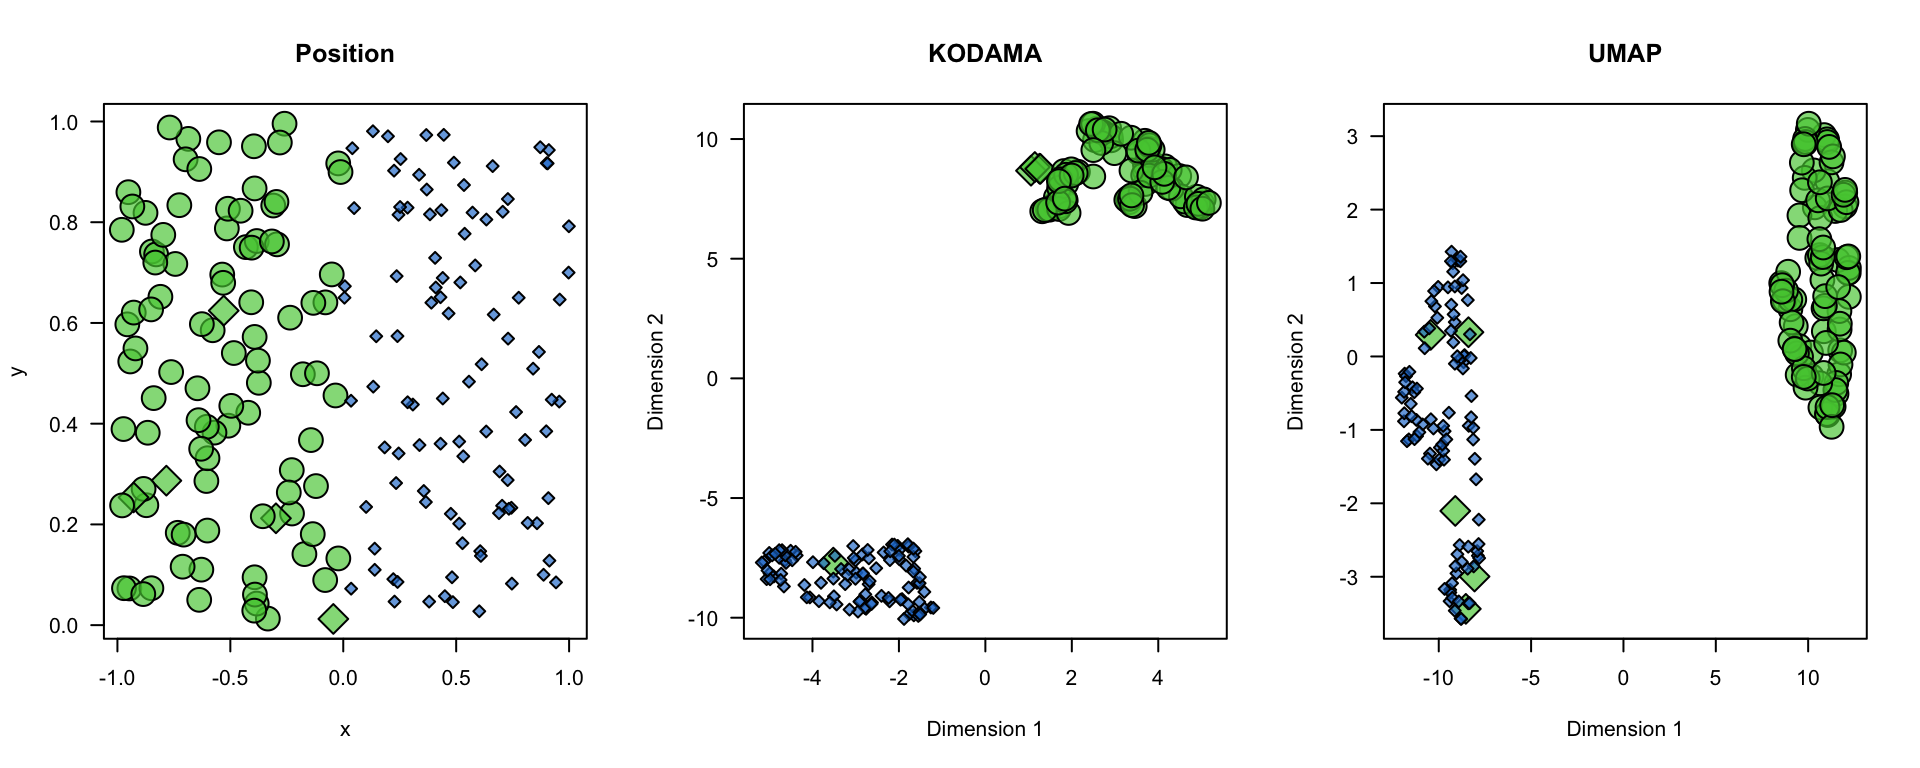
Scenario 2
Bla bla.
x1=runif(100,min=-1,max=0)
x2=runif(100,min=0,max=1)
y1=runif(100)
y2=runif(100)
x=c(x1,x2)
y=c(y1,y2)
xy=cbind(x,y)


labels=rep(c(TRUE,FALSE),each=100)

region=rep(1:0,each=100)

data=cbind(rnorm(200,mean=1+labels,sd=0.1),
           rnorm(200,mean=1+labels,sd=0.1),
           rnorm(200,mean=1+labels,sd=0.1),
           rnorm(200,mean=1+labels,sd=0.1))

ll=length(data)
ss=sample(ll,ll*0.5)
data[ss]=0
color.code=c("#1d79d0aa","#53ca3eaa")

sel=apply(data,1,function(x) sum(x>0))>2
data=data[sel,]
region=region[sel]
labels=labels[sel]
xy=xy[sel,]


labels=data>0
labels=labels[,1]+
  labels[,2]*2+
  labels[,3]*4+
  labels[,4]*8
labels=as.numeric(as.factor(labels))+1

pca=prcomp(scale(data))$x

kk <- KODAMA.matrix.parallel(pca,spatial=xy,spatial.resolution=0.1,M=100,
                             FUN="PLS",
                             landmarks = 100000,
                             splitting = 100,
                             f.par.pls =  10,
                             n.cores=4)
The number of components selected for PLS-DA is too high and it will be automatically reduced to 4socket cluster with 4 nodes on host 'localhost'
================================================================================[1] "Finished parallel computation"
[1] "Calculation of dissimilarity matrix..."
================================================================================config=umap.defaults
config$n_neighbors=15
vis=RunKODAMAvisualization(kk,method="UMAP",config=config)
u=umap(pca)$layout
old.par = par(mfrow=c(1,3))
plot(xy,bg=labels,pch=21+2*(region),cex=2+1*region,axes=FALSE,main="Position")
axis(1)
axis(2,las=2)
box()
plot(vis,bg=labels,pch=21+2*(region),cex=1+1.5*region,axes=FALSE,main="KODAMA")
axis(1)
axis(2,las=2)
box()
plot(u,bg=labels,pch=21+2*(region),cex=1+1.5*region,axes=FALSE,main="UMAP")
axis(1)
axis(2,las=2)
box()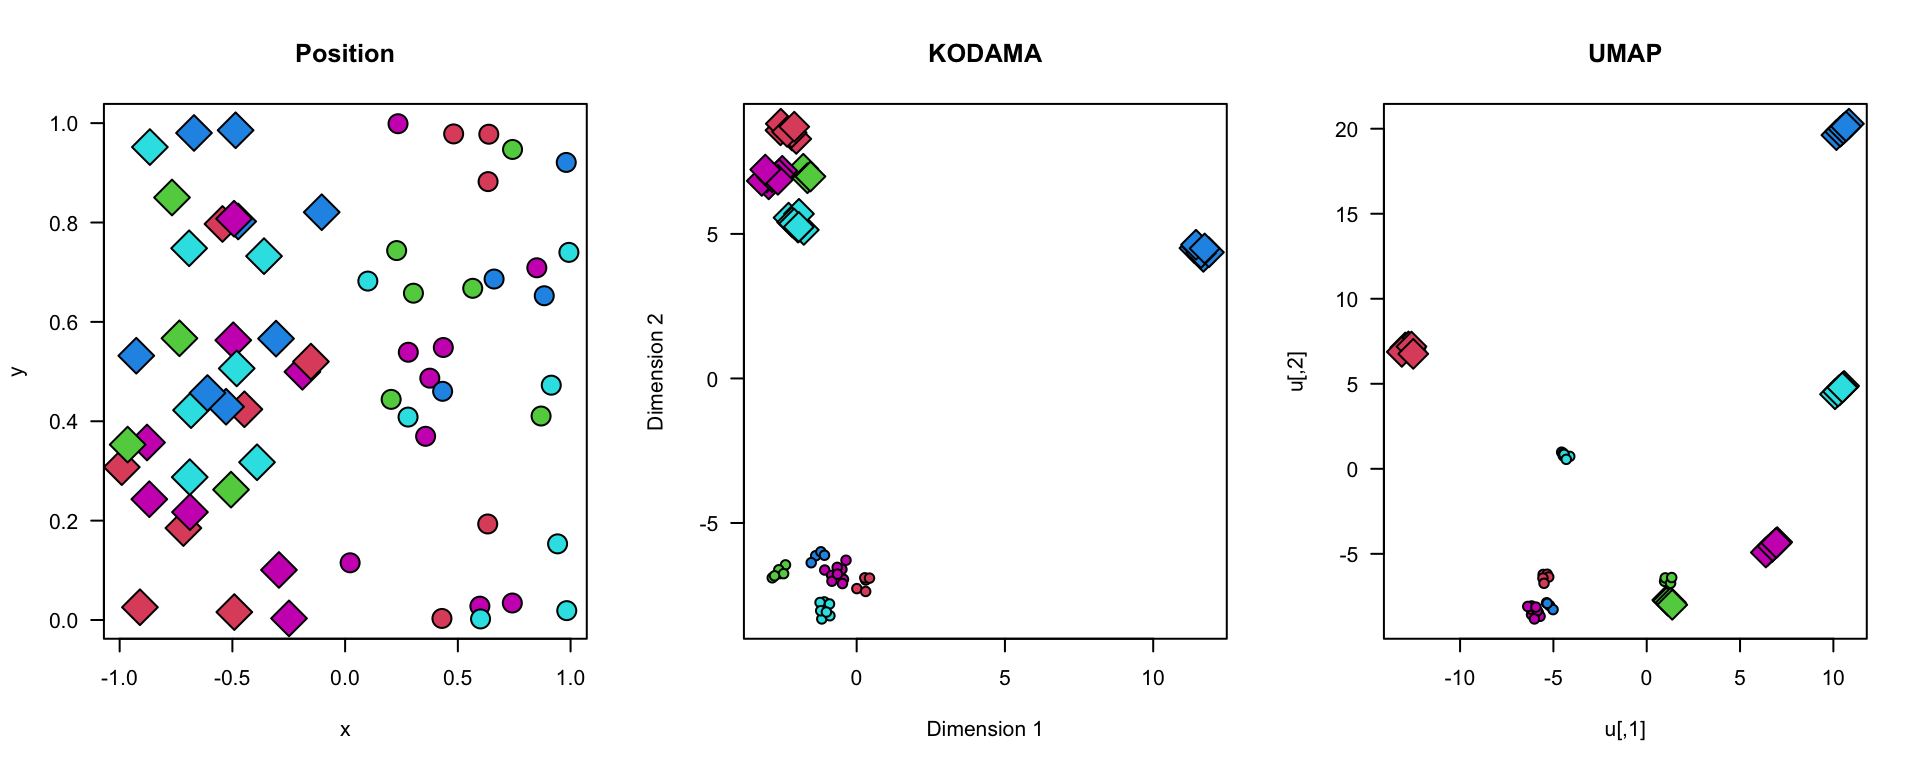
par(old.par)
sessionInfo()R version 4.3.3 (2024-02-29 ucrt)
Platform: x86_64-w64-mingw32/x64 (64-bit)
Running under: Windows 10 x64 (build 19045)
Matrix products: default
locale:
[1] LC_COLLATE=English_United States.utf8
[2] LC_CTYPE=English_United States.utf8
[3] LC_MONETARY=English_United States.utf8
[4] LC_NUMERIC=C
[5] LC_TIME=English_United States.utf8
time zone: Africa/Johannesburg
tzcode source: internal
attached base packages:
[1] parallel stats graphics grDevices utils datasets methods
[8] base
other attached packages:
[1] KODAMAextra_1.0 e1071_1.7-14 doParallel_1.0.17 iterators_1.0.14
[5] foreach_1.5.2 KODAMA_3.1 umap_0.2.10.0 Rtsne_0.17
[9] minerva_1.5.10 workflowr_1.7.1
loaded via a namespace (and not attached):
[1] sass_0.4.9 utf8_1.2.4 class_7.3-22 stringi_1.8.4
[5] lattice_0.22-6 digest_0.6.36 magrittr_2.0.3 evaluate_0.24.0
[9] grid_4.3.3 fastmap_1.2.0 rprojroot_2.0.4 jsonlite_1.8.8
[13] Matrix_1.6-5 processx_3.8.4 whisker_0.4.1 RSpectra_0.16-1
[17] doSNOW_1.0.20 ps_1.7.6 promises_1.3.0 httr_1.4.7
[21] fansi_1.0.6 codetools_0.2-20 jquerylib_0.1.4 cli_3.6.2
[25] rlang_1.1.4 cachem_1.1.0 yaml_2.3.8 tools_4.3.3
[29] httpuv_1.6.15 reticulate_1.38.0 vctrs_0.6.5 R6_2.5.1
[33] png_0.1-8 proxy_0.4-27 lifecycle_1.0.4 git2r_0.33.0
[37] stringr_1.5.1 fs_1.6.4 pkgconfig_2.0.3 callr_3.7.6
[41] pillar_1.9.0 bslib_0.7.0 later_1.3.2 glue_1.7.0
[45] Rcpp_1.0.12 highr_0.11 xfun_0.45 tibble_3.2.1
[49] rstudioapi_0.16.0 knitr_1.47 snow_0.4-4 htmltools_0.5.8.1
[53] rmarkdown_2.27 compiler_4.3.3 getPass_0.2-4 askpass_1.2.0
[57] openssl_2.2.0