Differential-transcript-expression
unawaz1996
2023-03-26
Last updated: 2023-05-11
Checks: 6 1
Knit directory: NMD-analysis/
This reproducible R Markdown analysis was created with workflowr (version 1.7.0). The Checks tab describes the reproducibility checks that were applied when the results were created. The Past versions tab lists the development history.
Great! Since the R Markdown file has been committed to the Git repository, you know the exact version of the code that produced these results.
Great job! The global environment was empty. Objects defined in the global environment can affect the analysis in your R Markdown file in unknown ways. For reproduciblity it’s best to always run the code in an empty environment.
The command set.seed(20230314) was run prior to running
the code in the R Markdown file. Setting a seed ensures that any results
that rely on randomness, e.g. subsampling or permutations, are
reproducible.
Great job! Recording the operating system, R version, and package versions is critical for reproducibility.
Nice! There were no cached chunks for this analysis, so you can be confident that you successfully produced the results during this run.
Using absolute paths to the files within your workflowr project makes it difficult for you and others to run your code on a different machine. Change the absolute path(s) below to the suggested relative path(s) to make your code more reproducible.
| absolute | relative |
|---|---|
| /home/neuro/Documents/NMD_analysis/Analysis/NMD-analysis/output/Transcript/Thesis_figures/total_exp_up.svg | output/Transcript/Thesis_figures/total_exp_up.svg |
| /home/neuro/Documents/NMD_analysis/Analysis/NMD-analysis/output/Transcript/Thesis_figures/total_exp_down.svg | output/Transcript/Thesis_figures/total_exp_down.svg |
Great! You are using Git for version control. Tracking code development and connecting the code version to the results is critical for reproducibility.
The results in this page were generated with repository version 6025d0f. See the Past versions tab to see a history of the changes made to the R Markdown and HTML files.
Note that you need to be careful to ensure that all relevant files for
the analysis have been committed to Git prior to generating the results
(you can use wflow_publish or
wflow_git_commit). workflowr only checks the R Markdown
file, but you know if there are other scripts or data files that it
depends on. Below is the status of the Git repository when the results
were generated:
Ignored files:
    Ignored:    .Rhistory
    Ignored:    .Rproj.user/
    Ignored:    analysis/Differential-transcript-usage.nb.html
    Ignored:    analysis/Enichment-analysis-fgsea.nb.html
    Ignored:    analysis/Enichment-analysis-goseq.nb.html

Untracked files:
    Untracked:  PCA.png
    Untracked:  PCA_plot.pdf
    Untracked:  PCA_transcript.png
    Untracked:  analysis/Differential-transcript-usage.Rmd
    Untracked:  analysis/UPF3B_KD.Rmd
    Untracked:  analysis/transcript-preprocessing.Rmd
    Untracked:  code/eisaR.R
    Untracked:  code/external_code/
    Untracked:  data/LTK_Sample Metafile_V3.txt
    Untracked:  data/Mus_musculus.GRCm39.105__nifs.tsv
    Untracked:  data/data.txt
    Untracked:  data/data2.txt
    Untracked:  data/fastqc/
    Untracked:  data/nif_output/
    Untracked:  data/samples.txt
    Untracked:  output/DEG-limma-results.Rda
    Untracked:  output/DEG-list.Rda
    Untracked:  output/DEG/
    Untracked:  output/EISA/
    Untracked:  output/ISAR/
    Untracked:  output/QC/
    Untracked:  output/Transcript/
    Untracked:  output/isoformSwitchAnalyzeR_isoform_AA_complete.fasta
    Untracked:  output/isoformSwitchAnalyzeR_isoform_AA_subset_1_of_3.fasta
    Untracked:  output/isoformSwitchAnalyzeR_isoform_AA_subset_2_of_3.fasta
    Untracked:  output/isoformSwitchAnalyzeR_isoform_AA_subset_3_of_3.fasta
    Untracked:  output/isoformSwitchAnalyzeR_isoform_nt.fasta
    Untracked:  output/limma-matrices.Rda
    Untracked:  tmp/

Unstaged changes:
    Modified:   analysis/RNA-stability.Rmd
    Modified:   analysis/_site.yml
    Modified:   code/functions.R
    Modified:   code/libraries.R
Note that any generated files, e.g. HTML, png, CSS, etc., are not included in this status report because it is ok for generated content to have uncommitted changes.
These are the previous versions of the repository in which changes were
made to the R Markdown
(analysis/Differential-transcript-expression.Rmd) and HTML
(docs/Differential-transcript-expression.html) files. If
you’ve configured a remote Git repository (see
?wflow_git_remote), click on the hyperlinks in the table
below to view the files as they were in that past version.
| File | Version | Author | Date | Message |
|---|---|---|---|---|
| Rmd | 6025d0f | unawaz1996 | 2023-05-11 | wflow_publish(c("analysis/index.Rmd", "analysis/Differential-transcript-expression.Rmd", |
| html | 421e1d5 | unawaz1996 | 2023-05-10 | Build site. |
| Rmd | b963fdb | unawaz1996 | 2023-05-10 | Add transcript expression |
Introduction
Set-up
Transcript-level counts were retrieved using the
catchSalmon() function from the edgeR package. Once
retrieved, the counts underwent rigourous QC.
Removal of outlier sample
According to the quality control analysis, it was revealed that one of the samples was not clustering with its condition group. Investigation into GC content, transcript length and library size revealed no contribution of these factors. To ensure we are getting results that are not skewed we will remove the sample from the transcript level analysis.
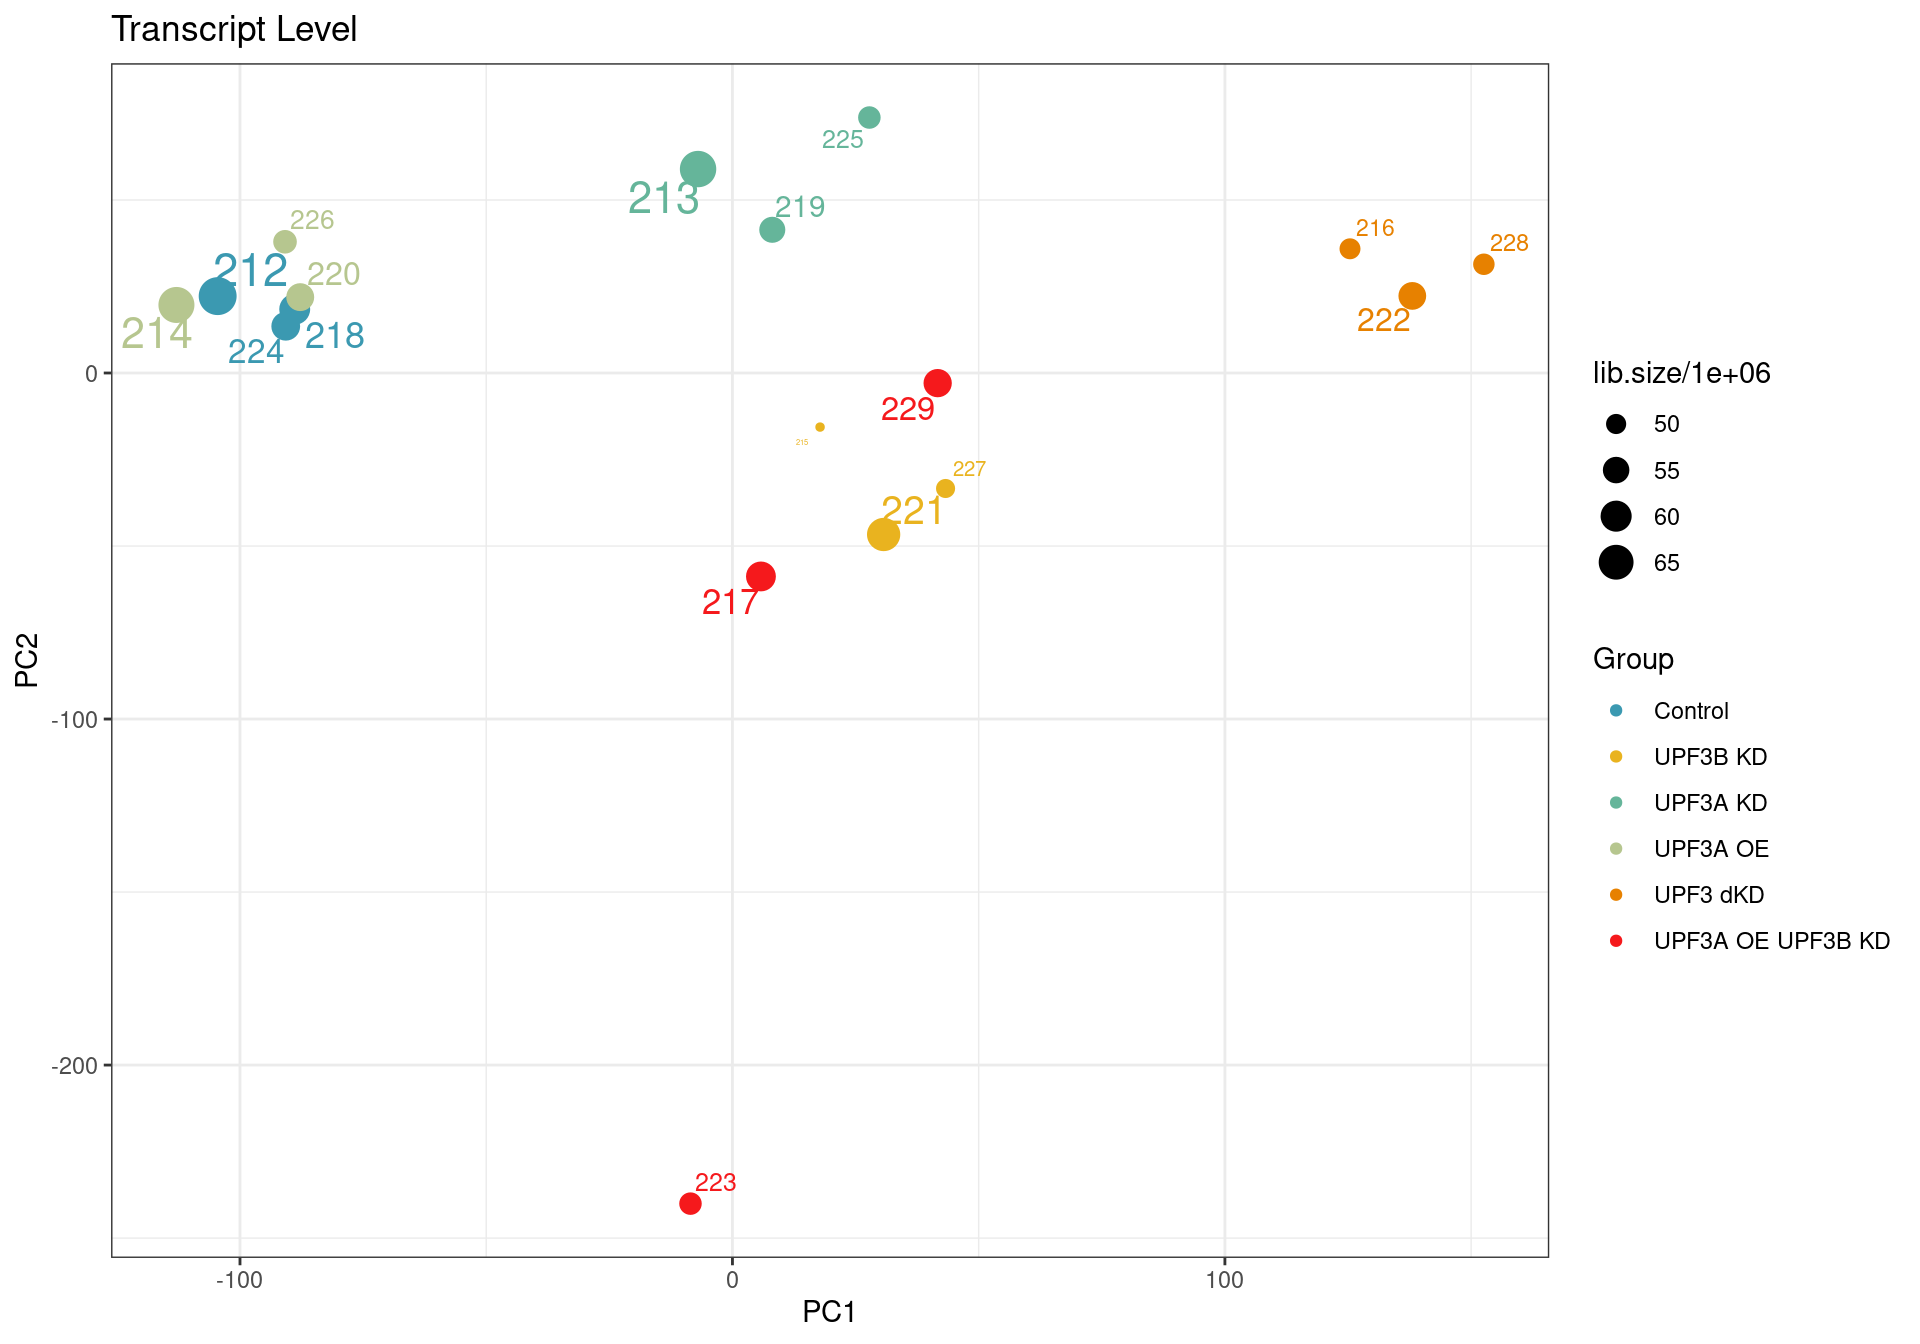
Principal component analysis of transcript level data. PCA was performed on log2 transformed CPM after filtering lowly expressed genes. The PCA shows that samples are clustering close to their conditions based on PC1, however one of the samples of the UPF3A OE in UPF3B KD cell line (sample 223), seems to deviate from its condition group and the rest of the data, so needs to be further investigated
| Version | Author | Date |
|---|---|---|
| 421e1d5 | unawaz1996 | 2023-05-10 |
| Version | Author | Date |
|---|---|---|
| 421e1d5 | unawaz1996 | 2023-05-10 |
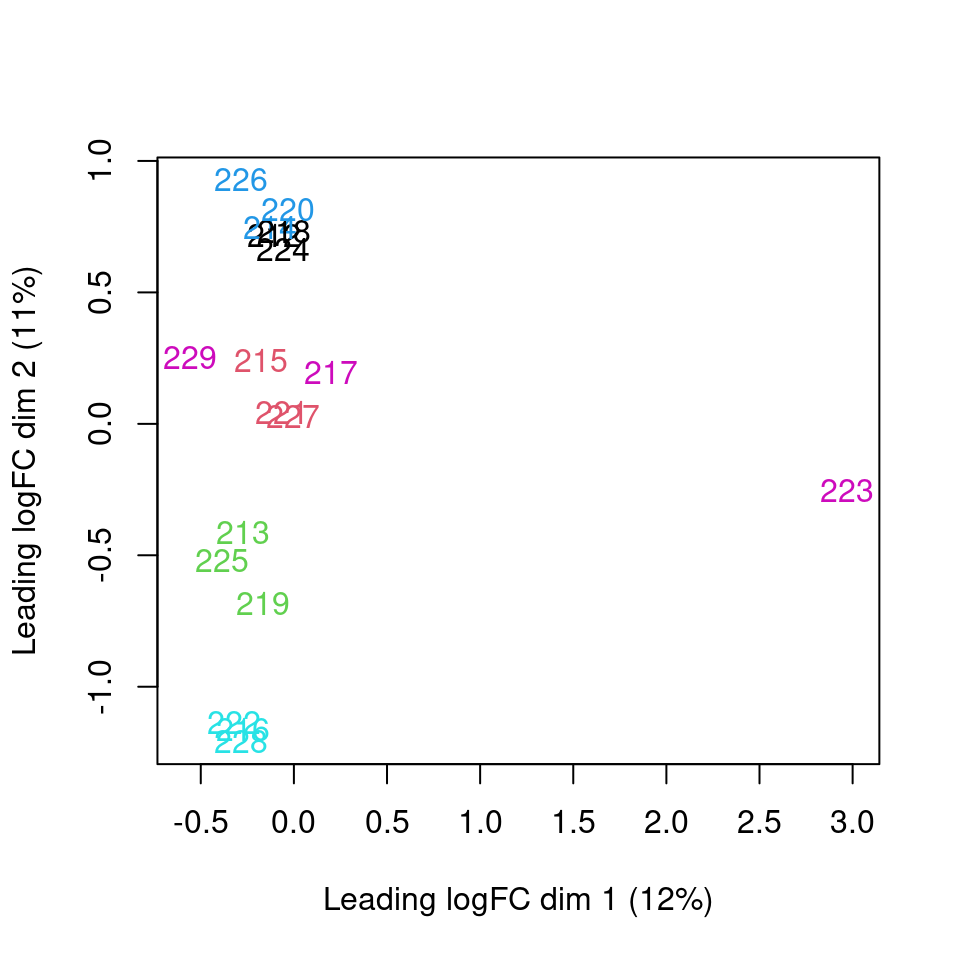
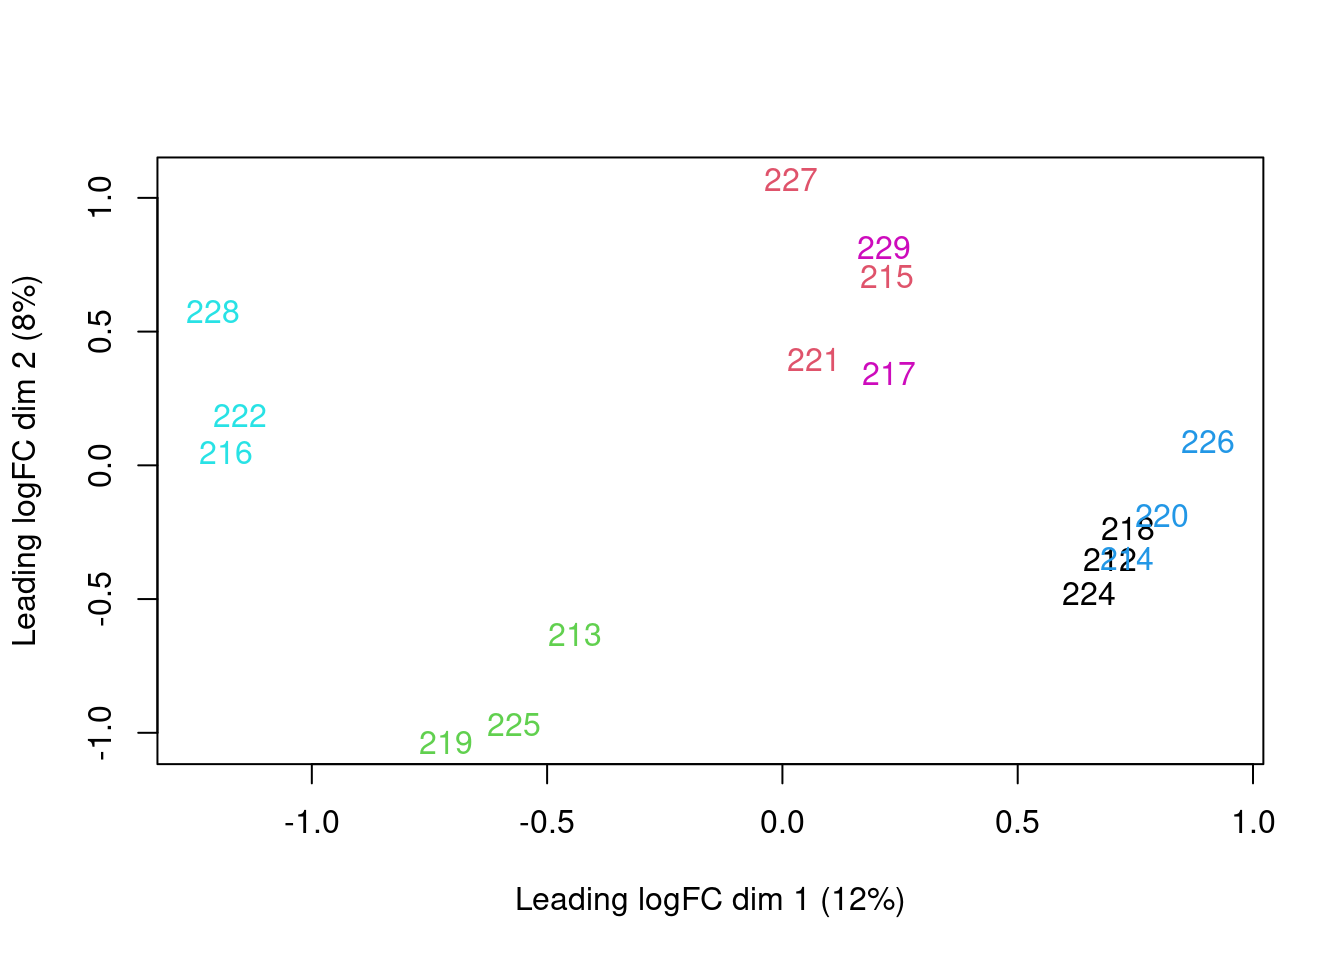
Analysis
| Version | Author | Date |
|---|---|---|
| 421e1d5 | unawaz1996 | 2023-05-10 |
[1] 0.01177187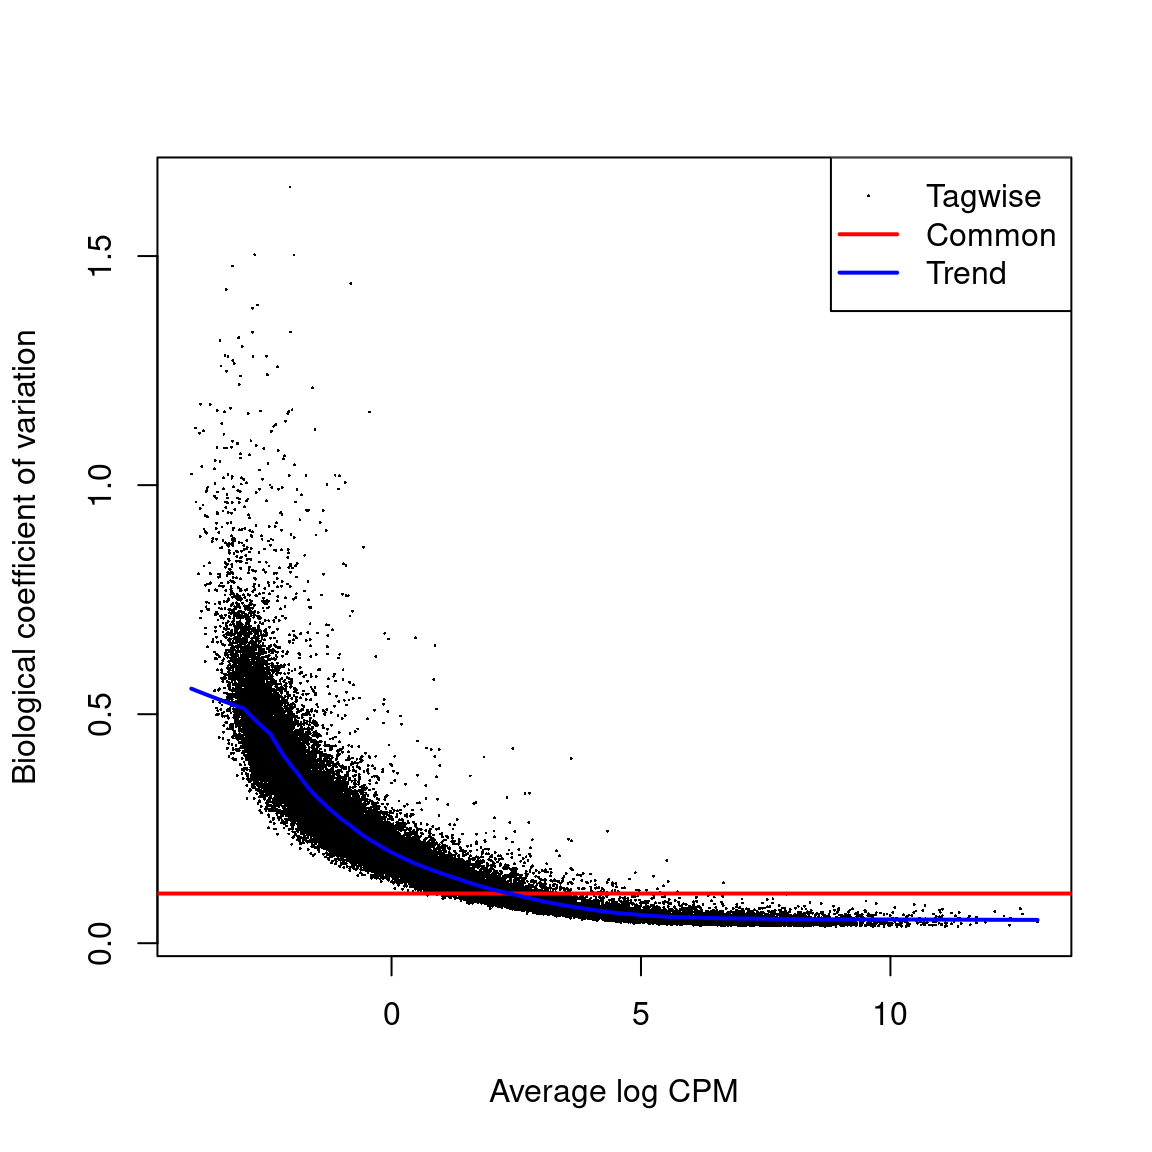
Biological coeficcient of variation plot against the average abundance of each transcript. The plot shows the square-root estimates of the common, trended and tagwise NB dispersions.
| Version | Author | Date |
|---|---|---|
| 421e1d5 | unawaz1996 | 2023-05-10 |
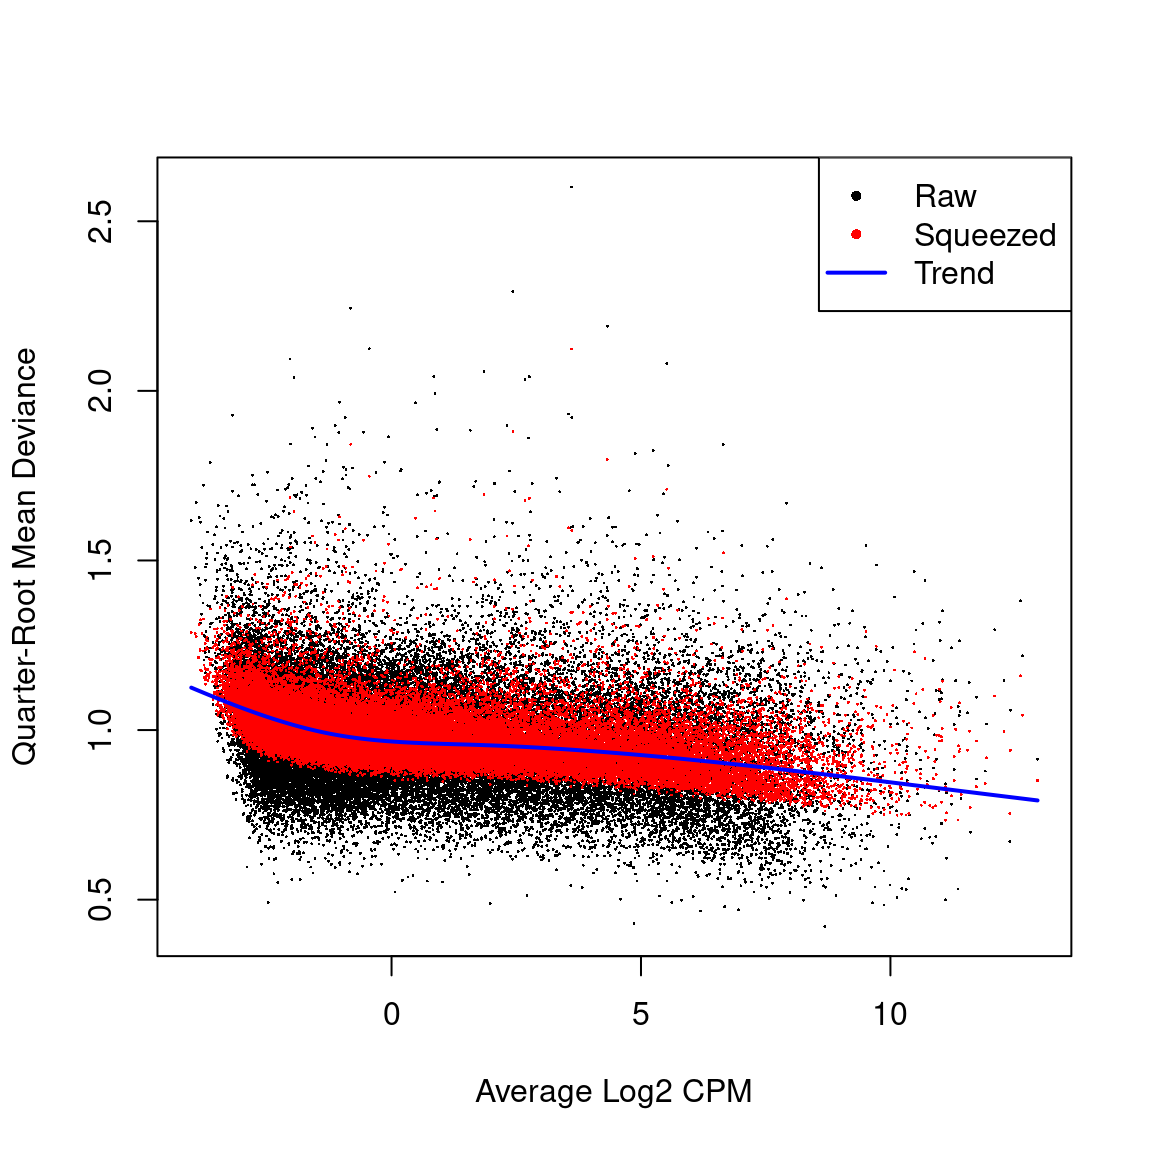
Quasi-likelihood dispersion aganist gene abundance. Estimates are shown for raw, tended and squeezed dispersions
| Version | Author | Date |
|---|---|---|
| 421e1d5 | unawaz1996 | 2023-05-10 |
   Min. 1st Qu.  Median    Mean 3rd Qu.    Max.
14.32 14.32 14.32 14.32 14.32 14.32 
Distribution of results
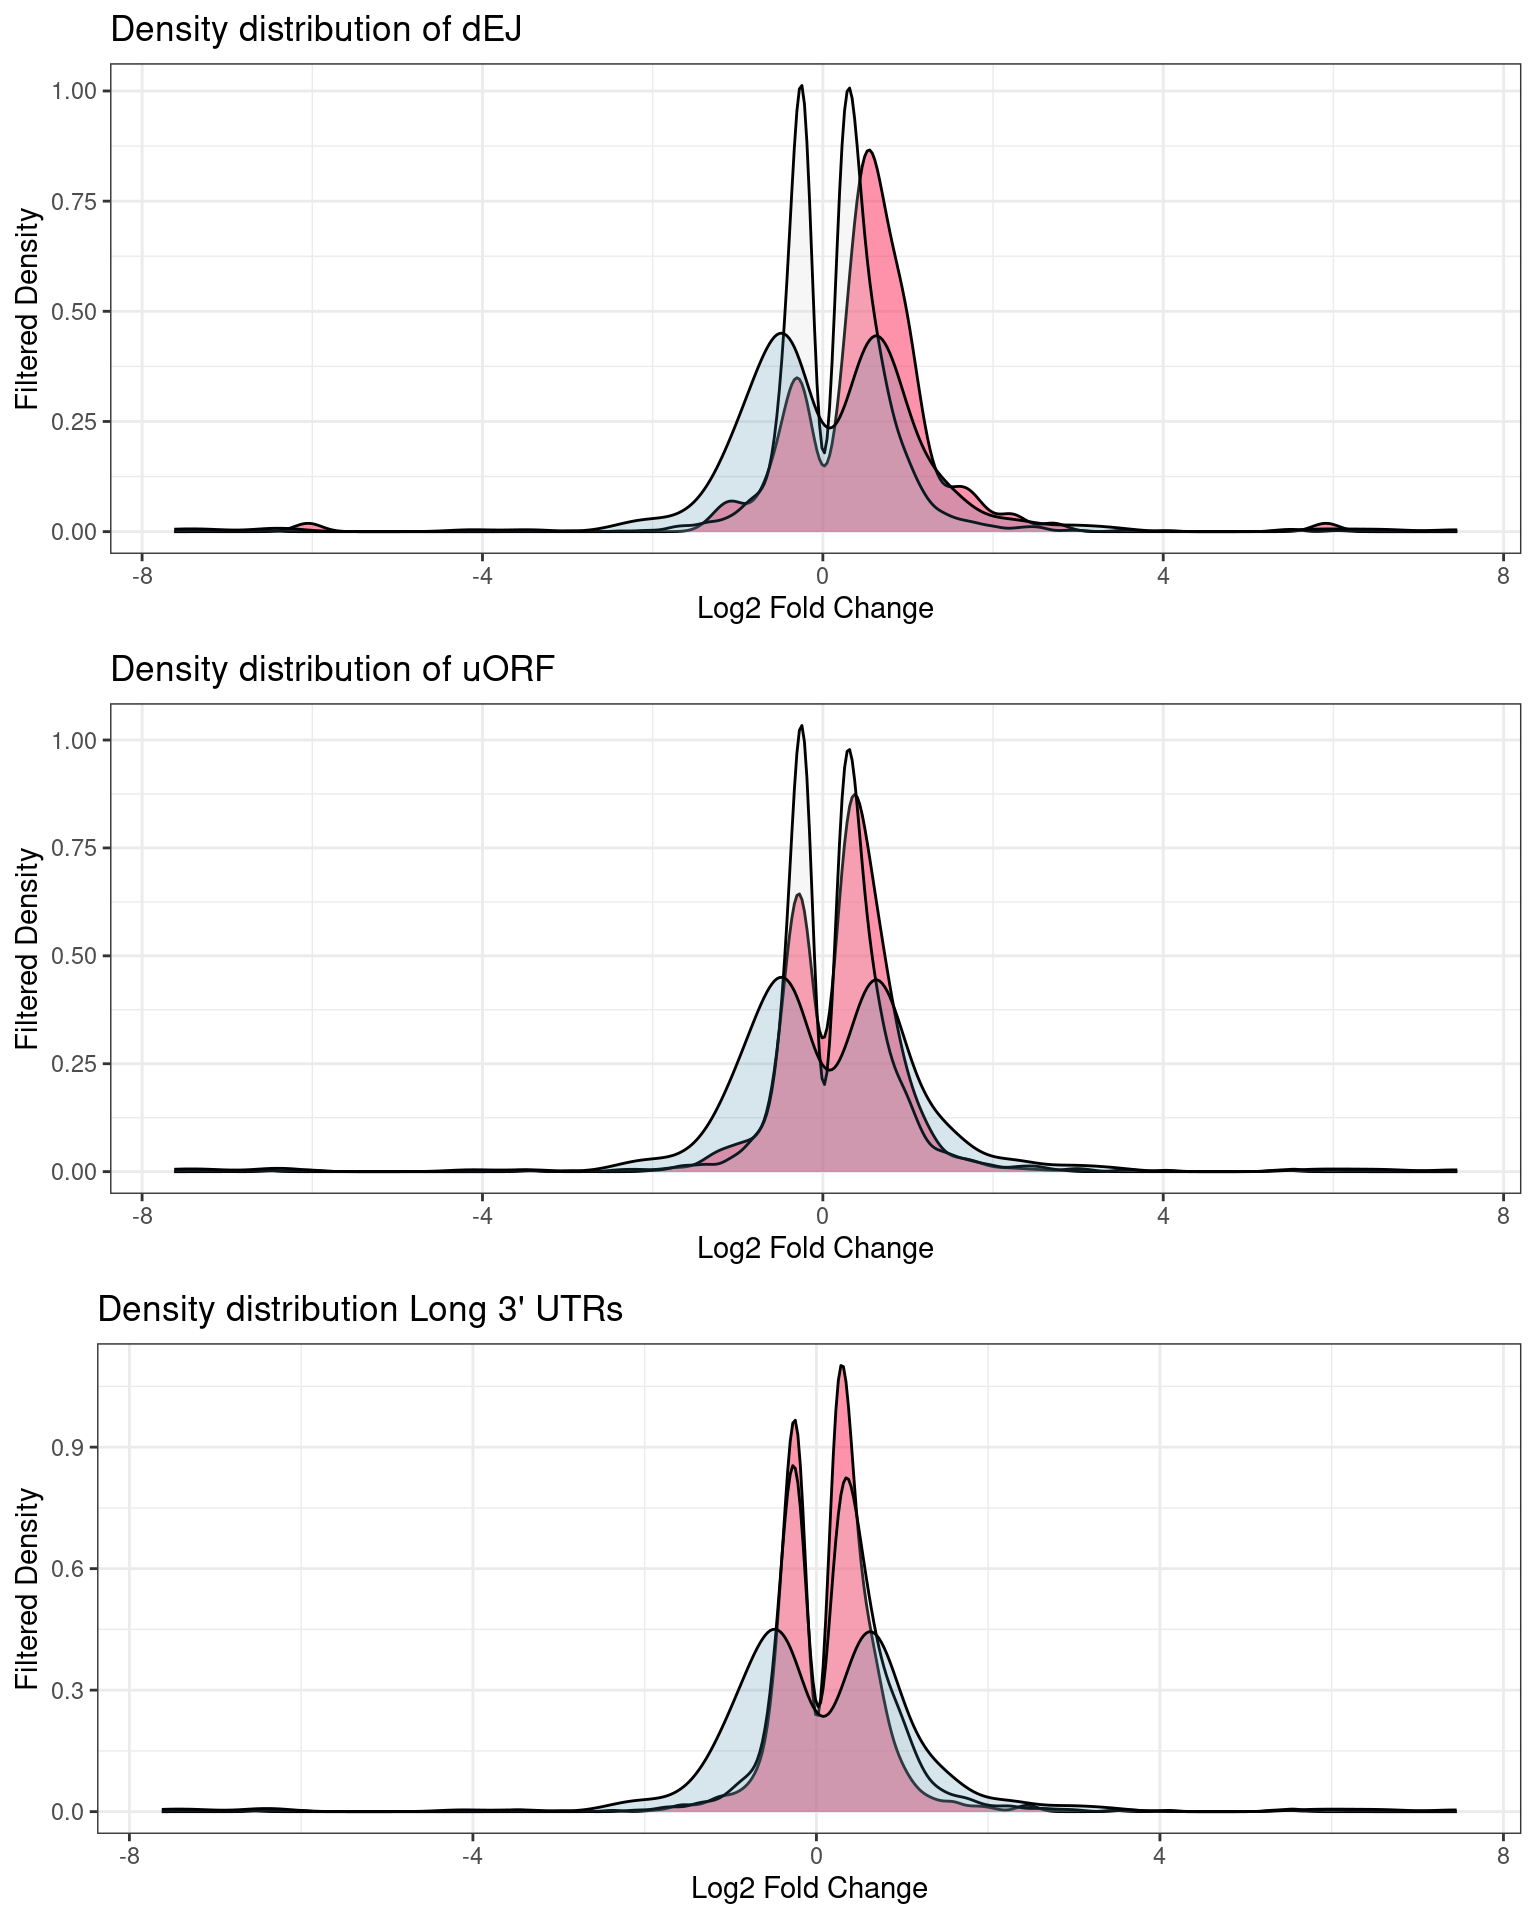
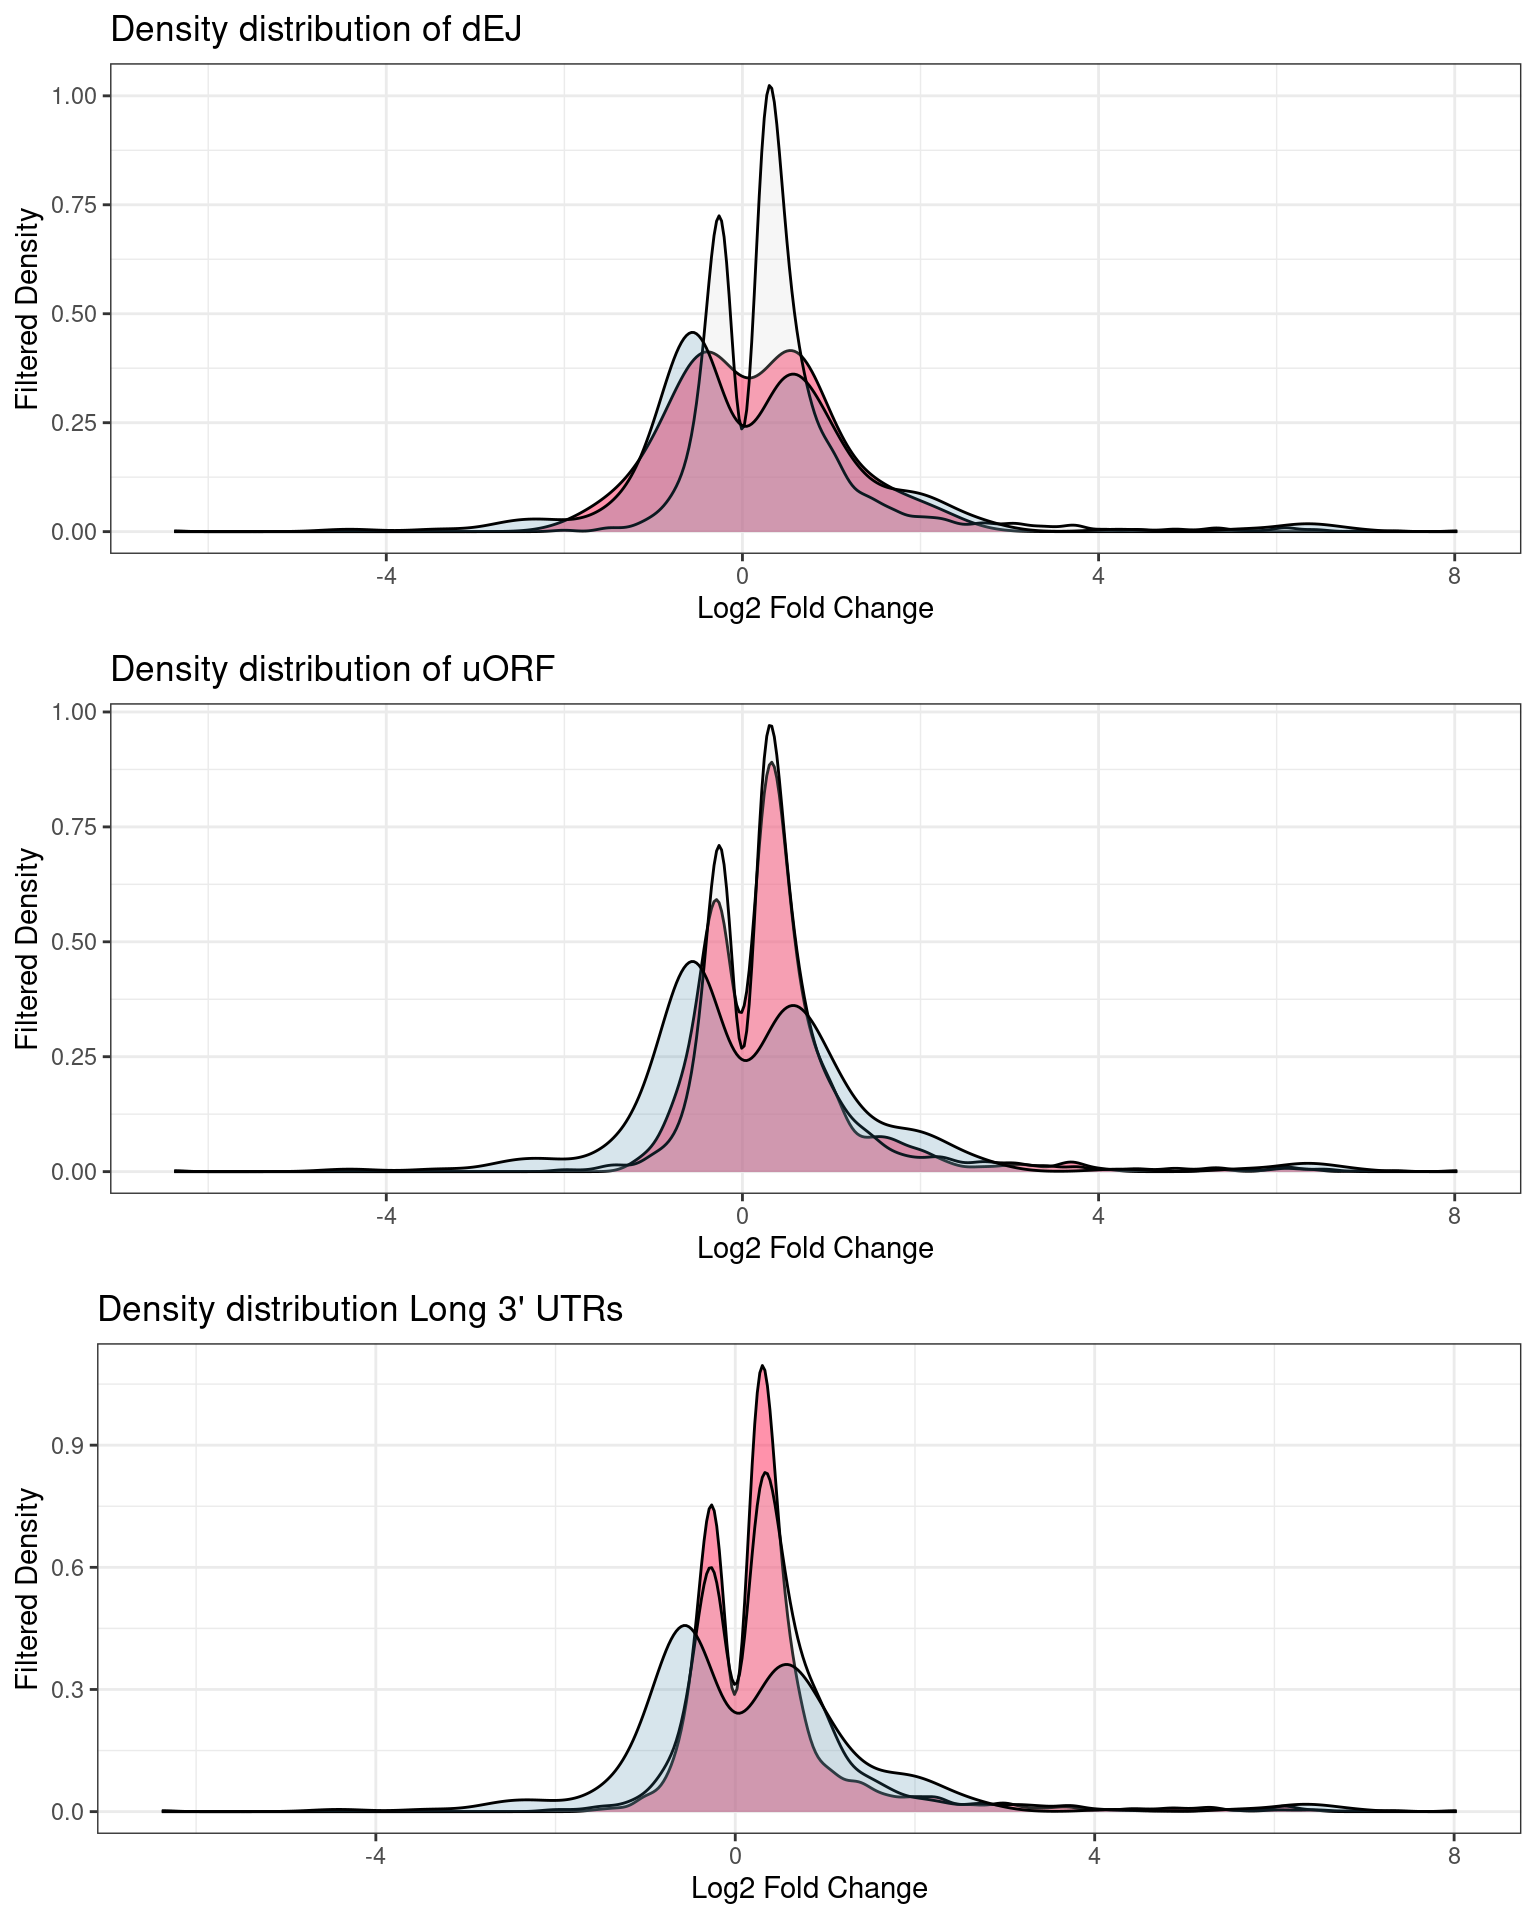
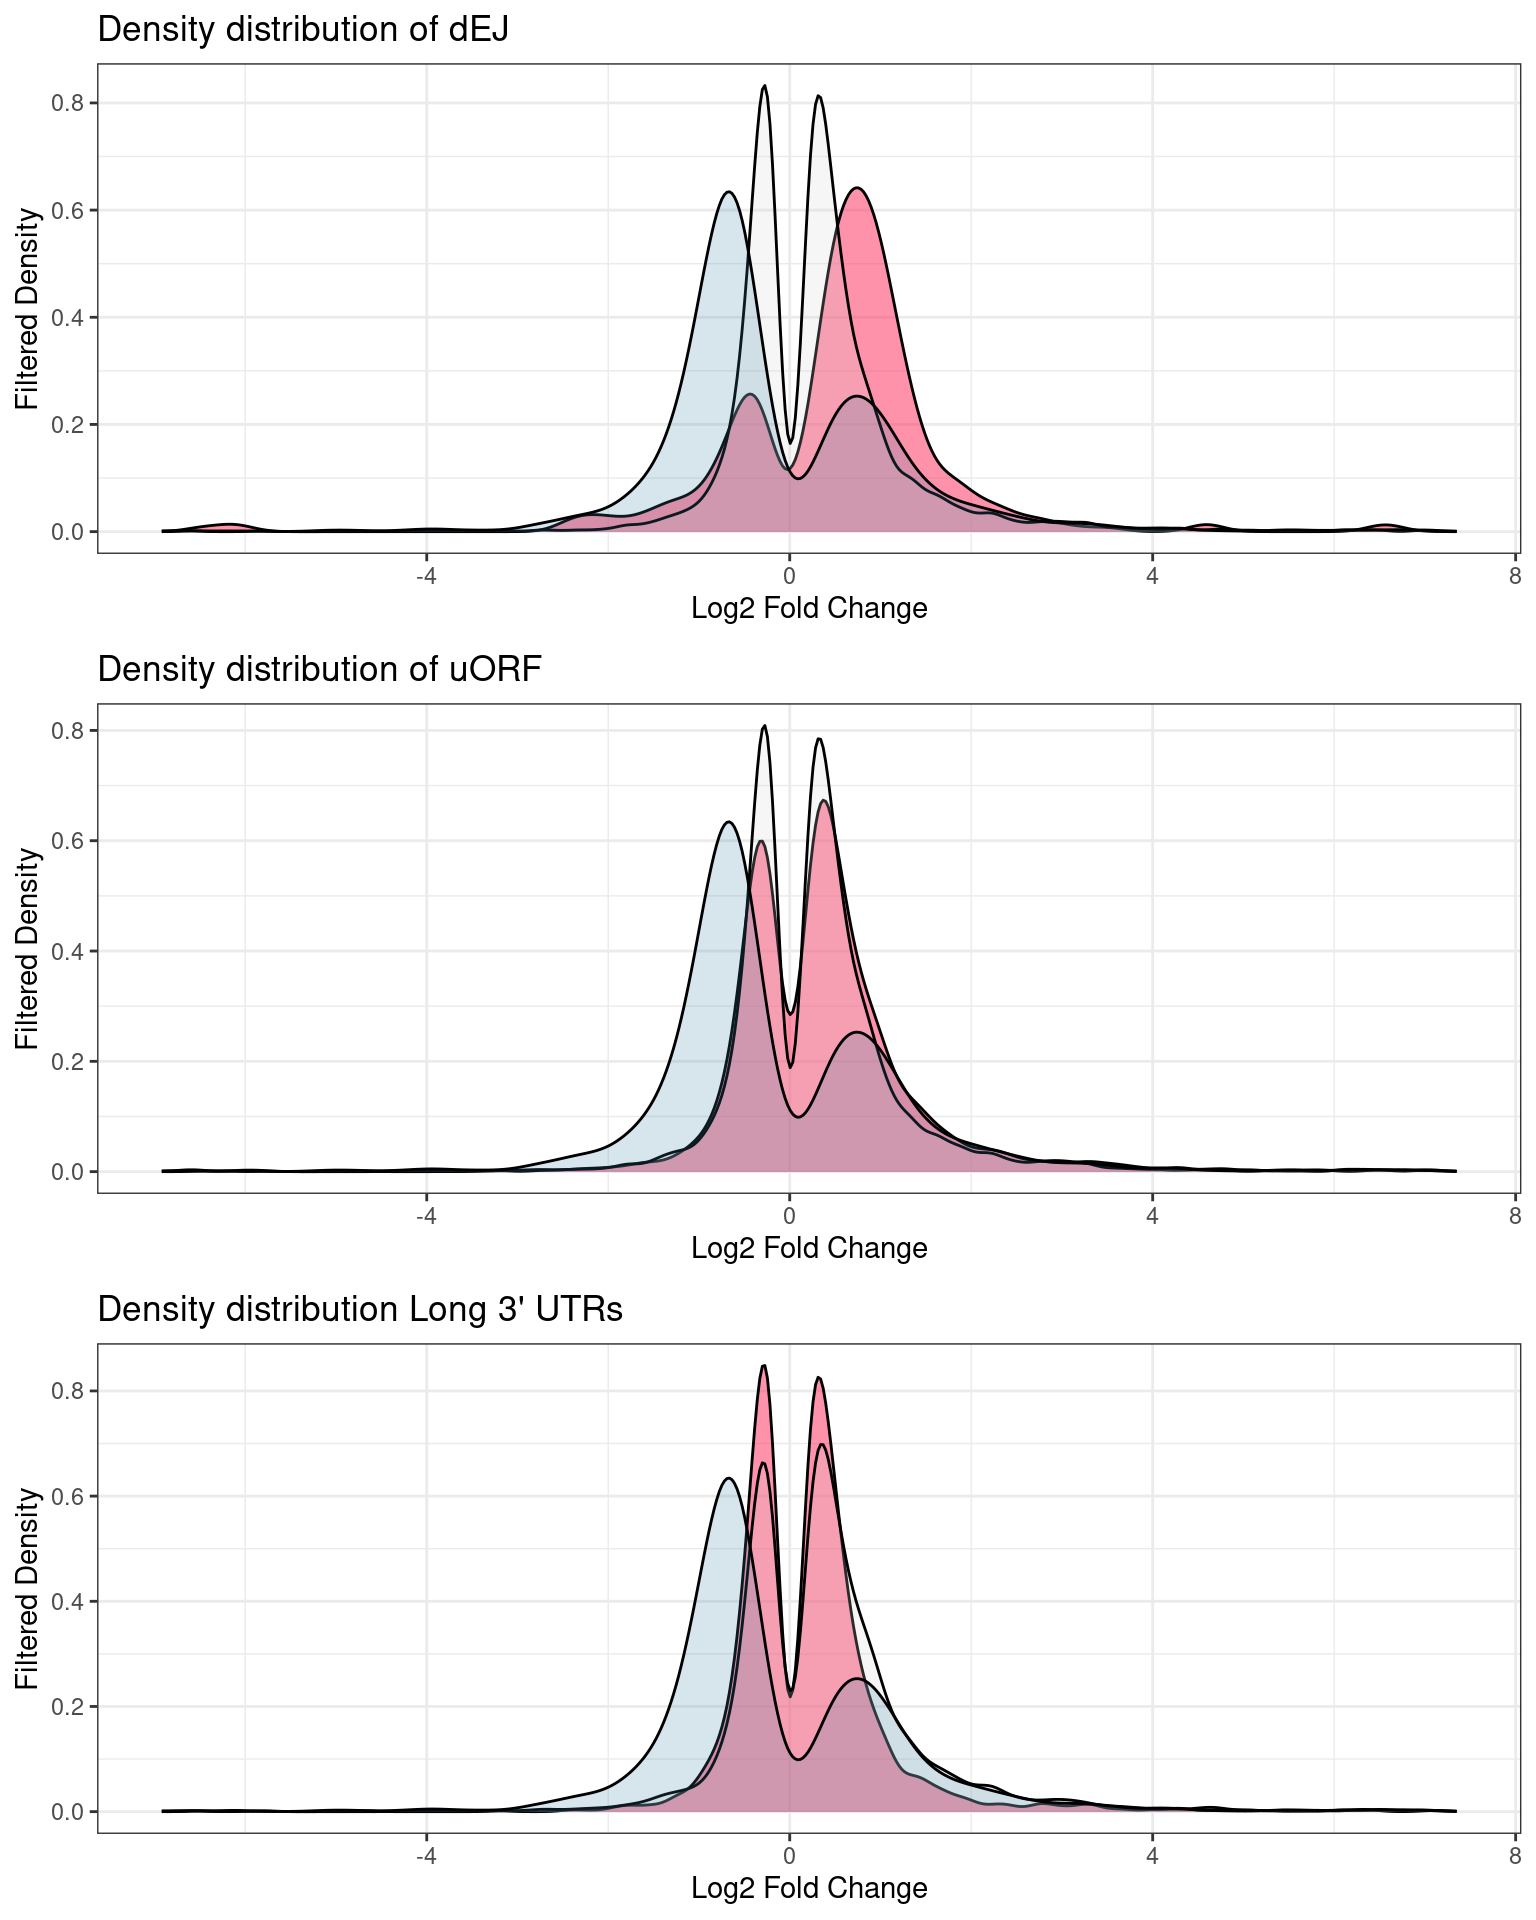
Fold change distributions
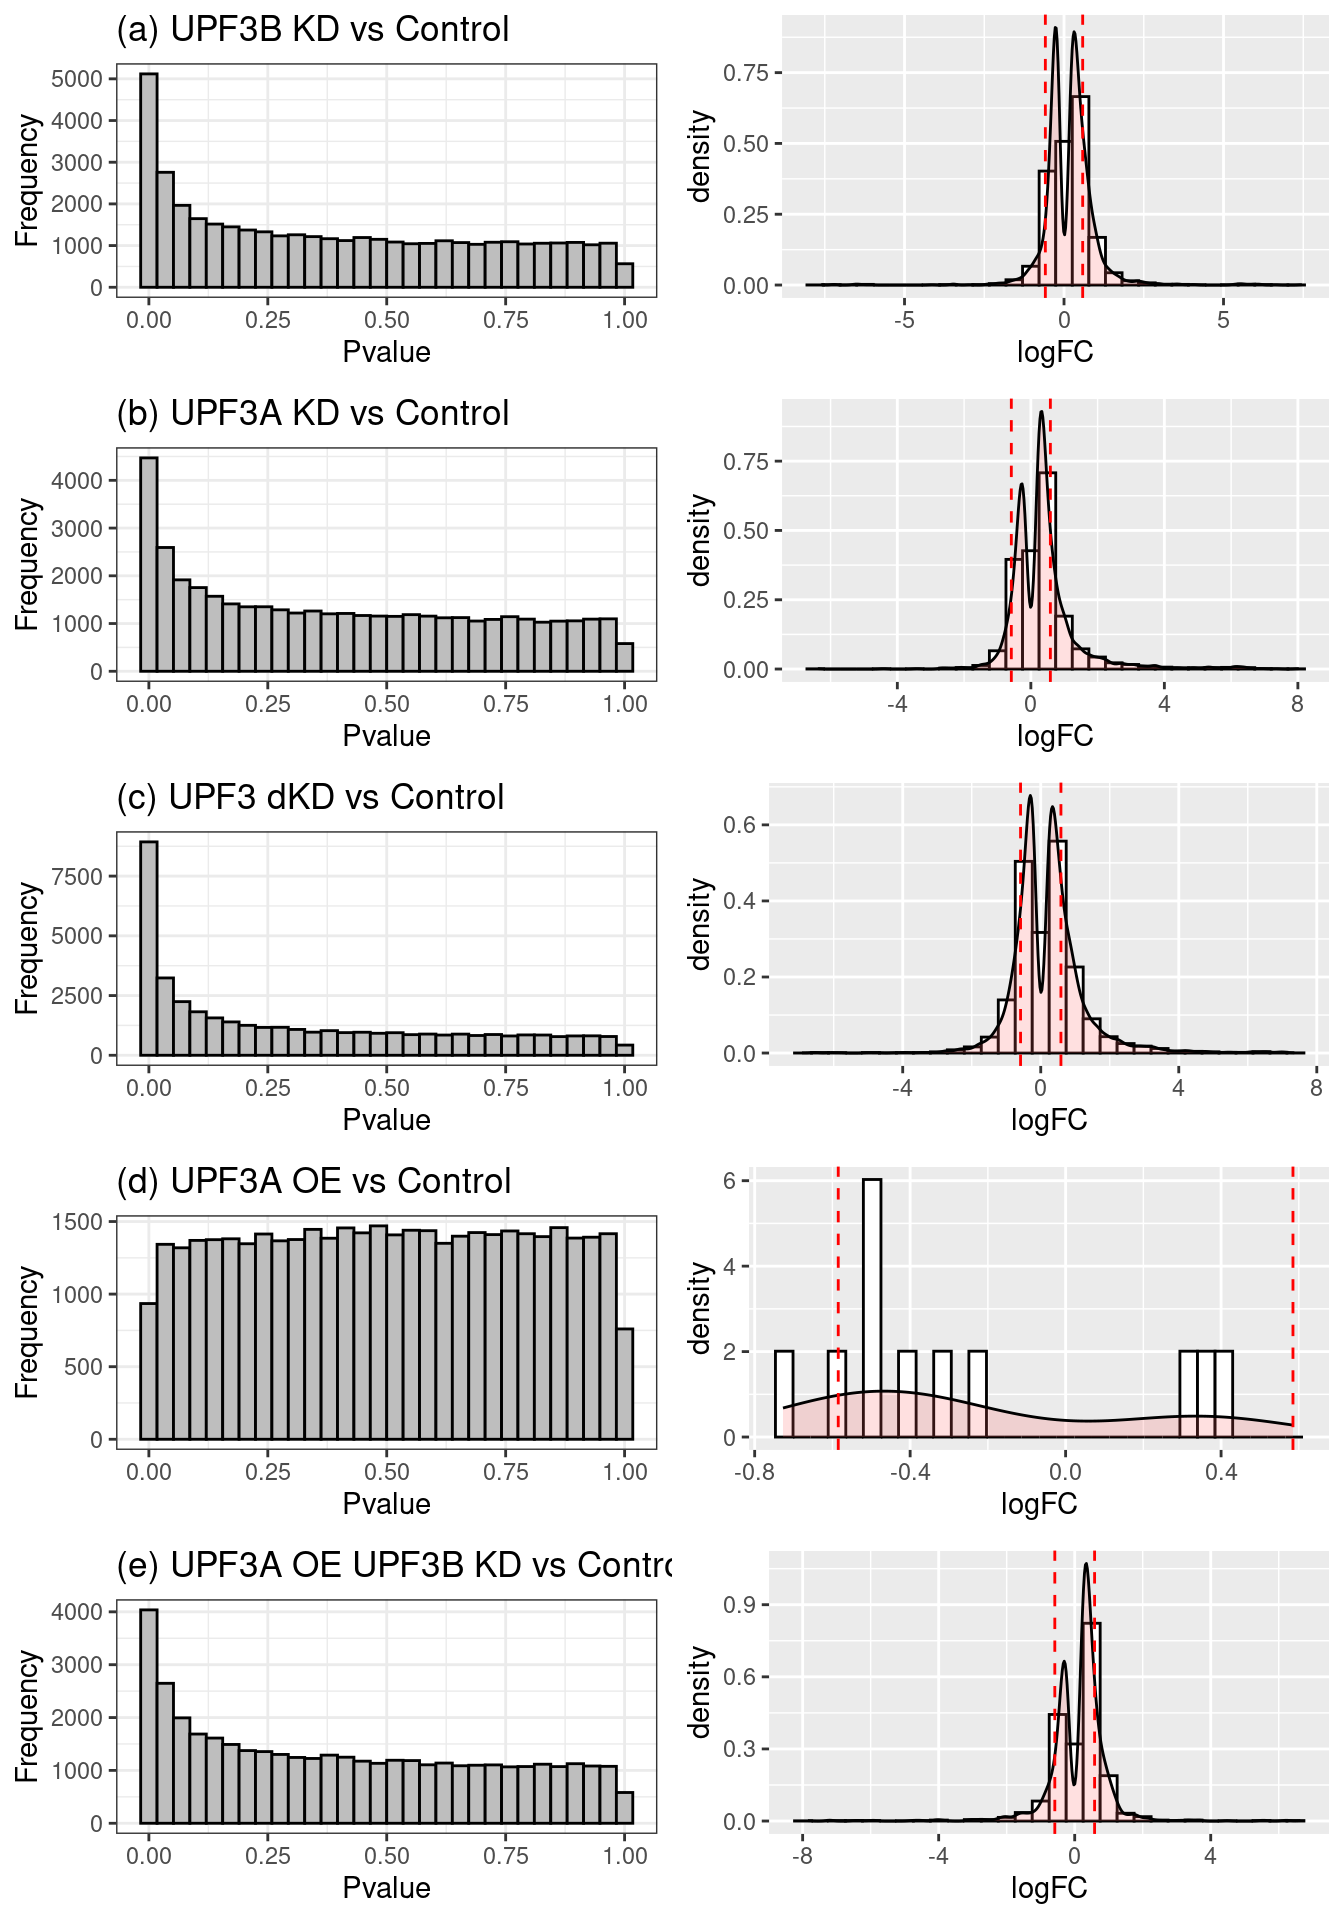
Distribution of p-values and log2Fold changes across conditions after running edgeR
| Version | Author | Date |
|---|---|---|
| 421e1d5 | unawaz1996 | 2023-05-10 |
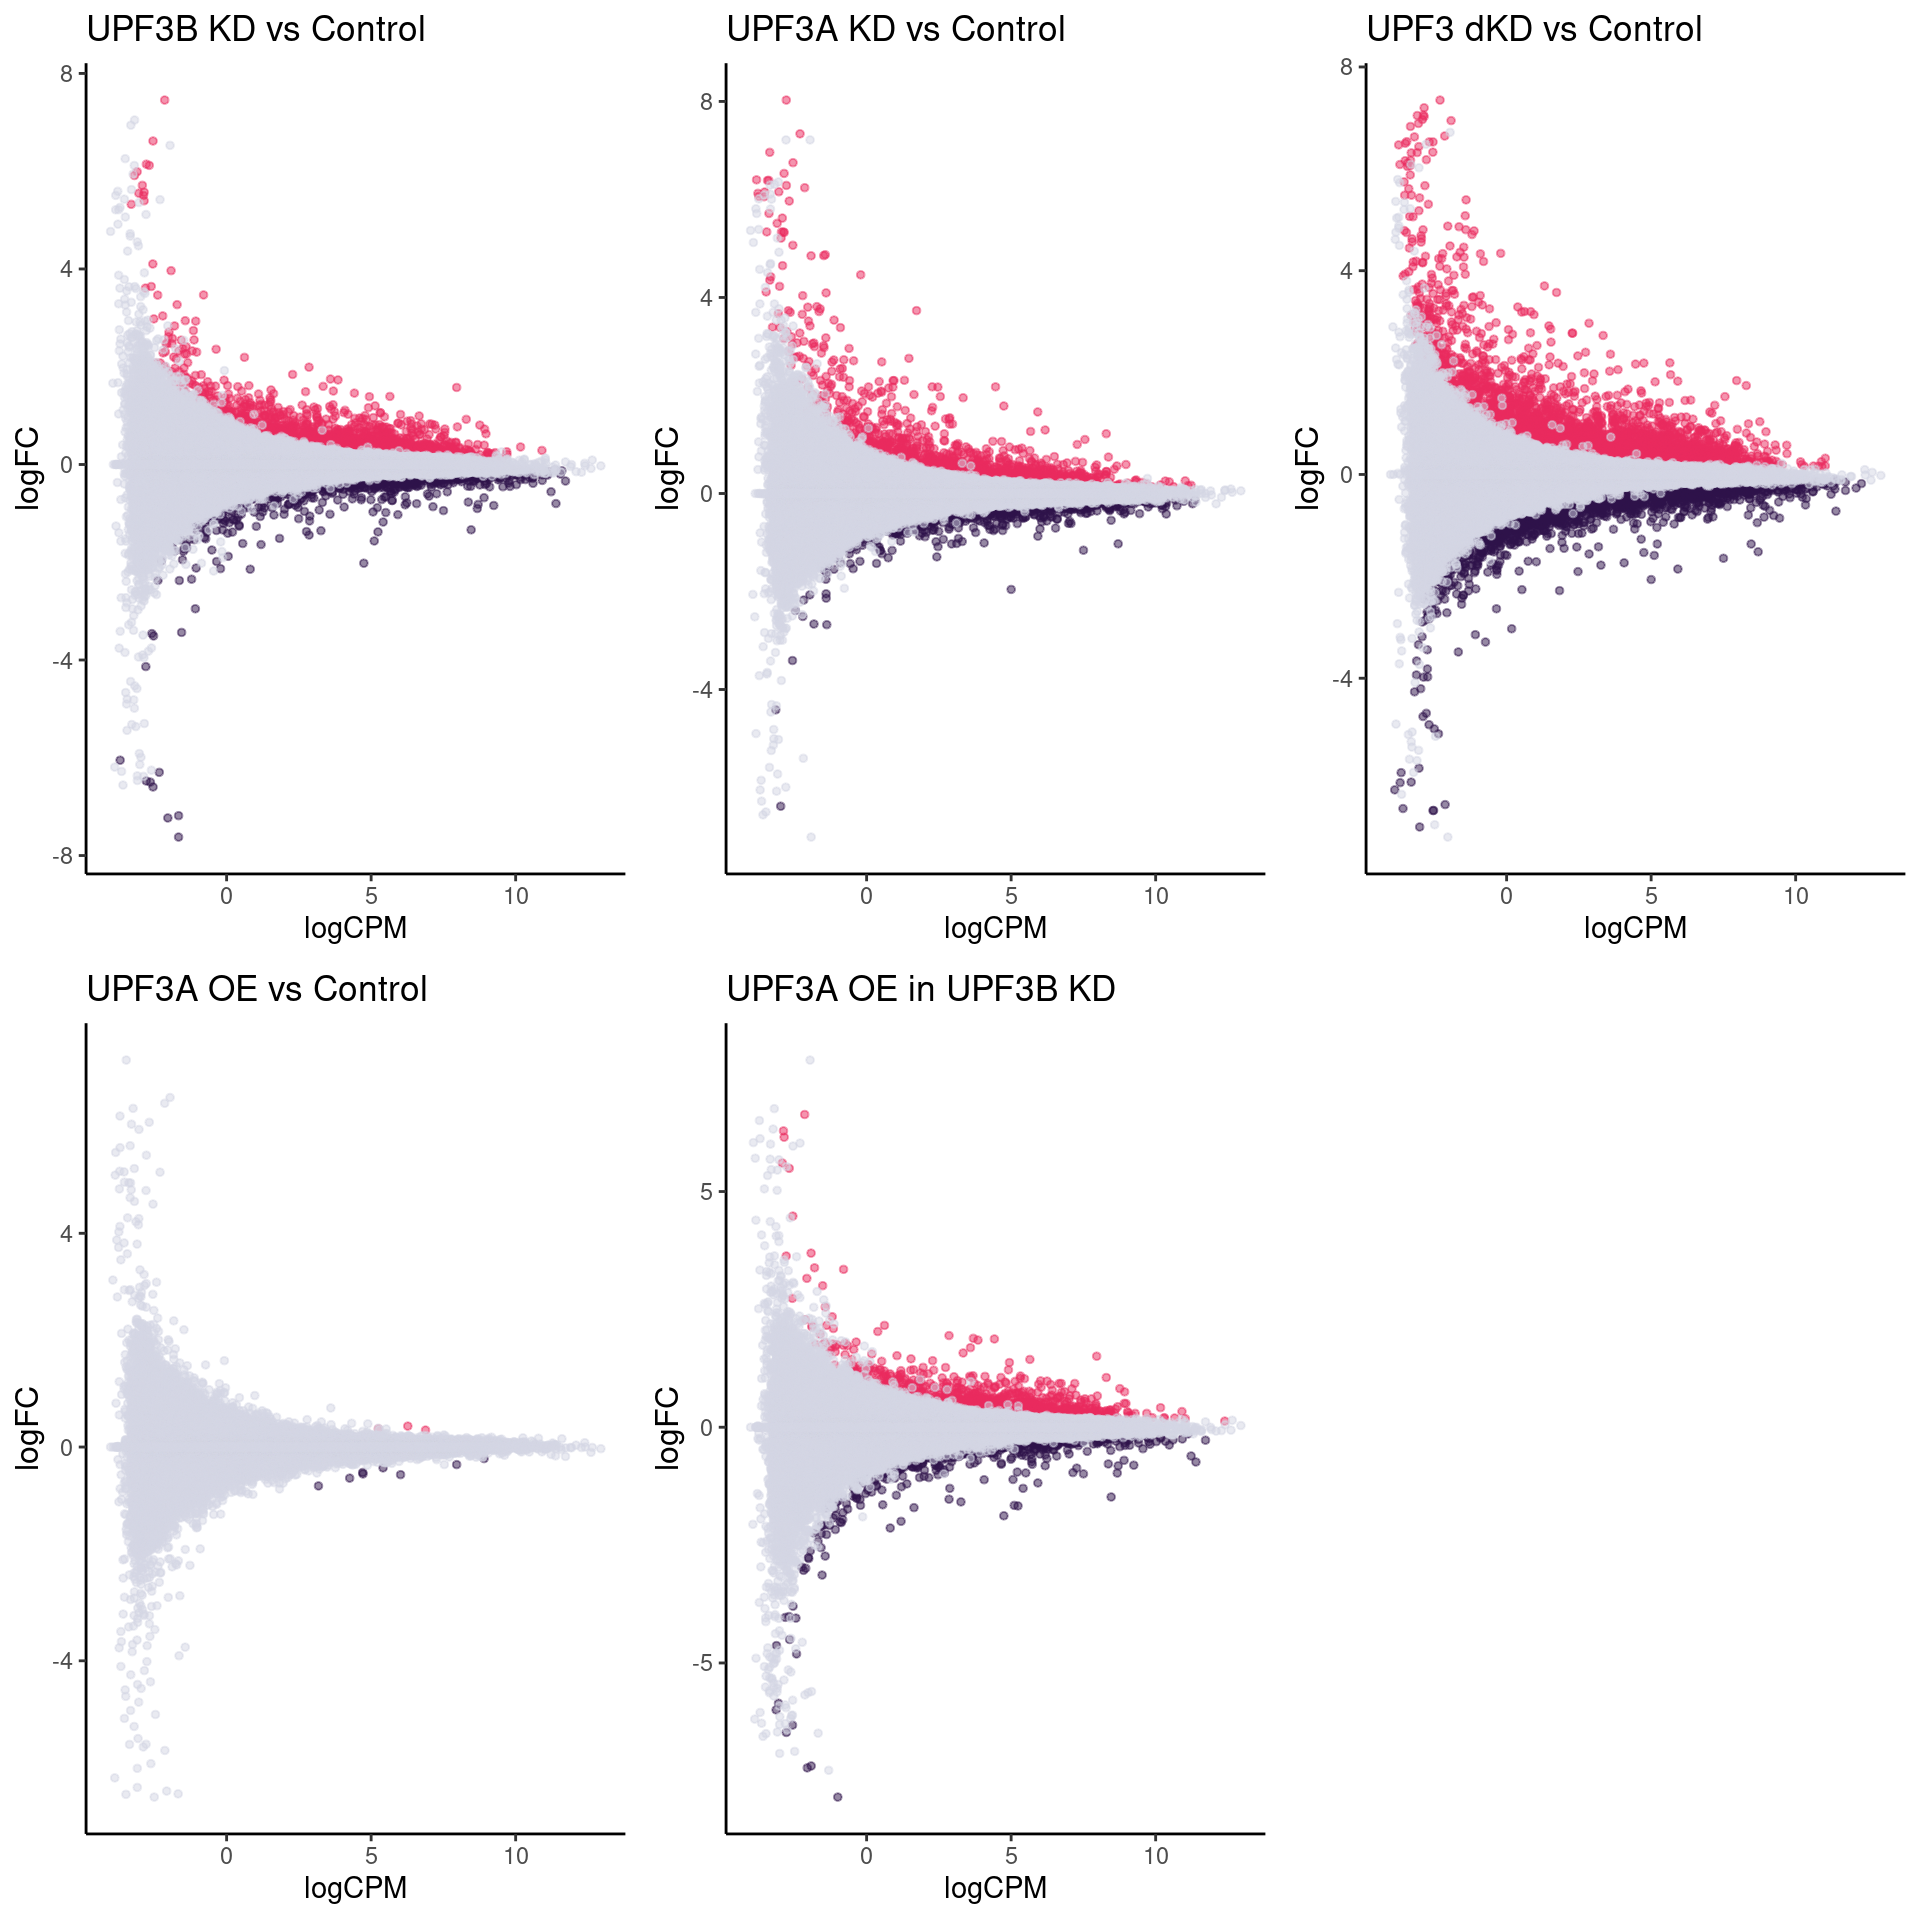
MA plot of comprisons of KD/OE with Controls. Pink highlights significantly upregulated transcripts whereas blue highlights significantly downregulated transcripts
| Version | Author | Date |
|---|---|---|
| 421e1d5 | unawaz1996 | 2023-05-10 |
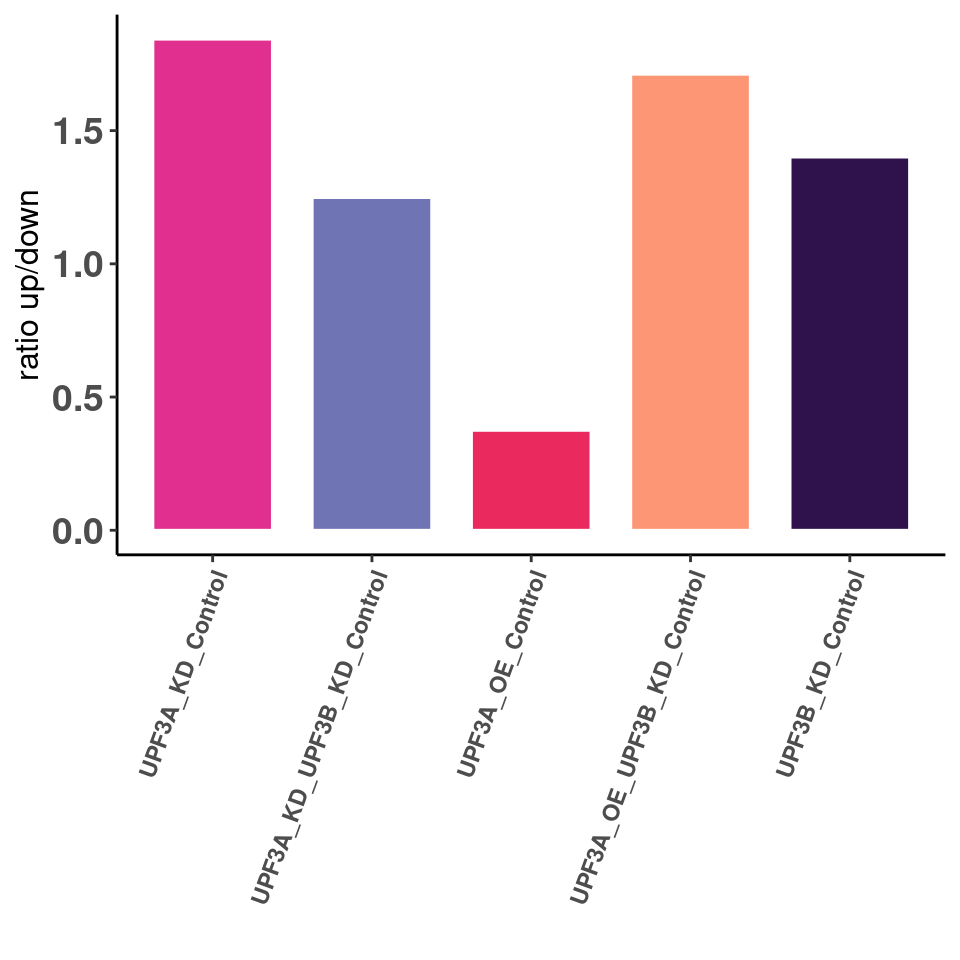
Ratio of up/down differentiallt expressed transcripts
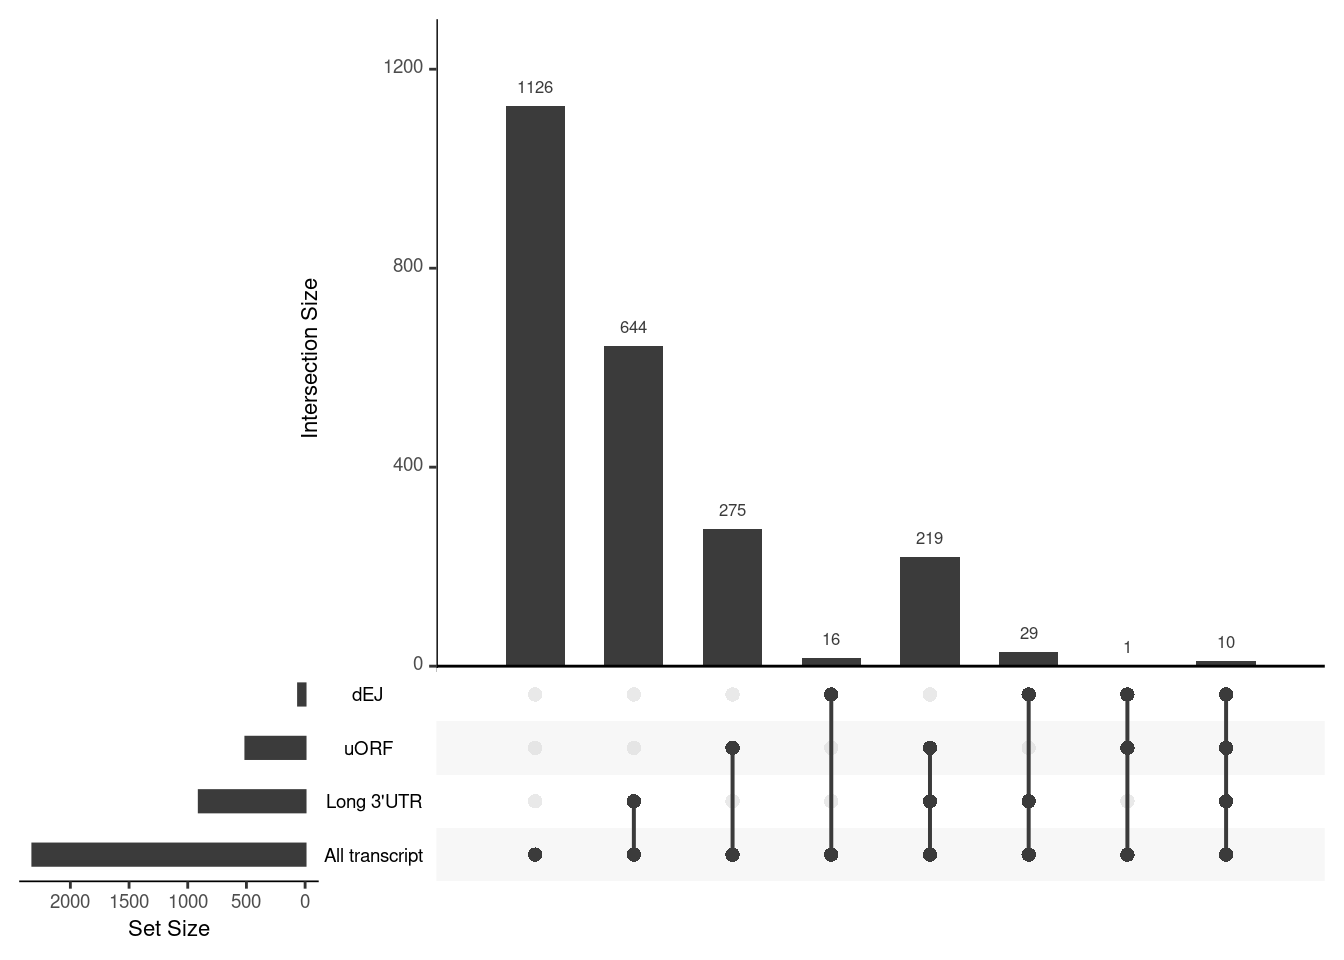
UPF3B transcripts
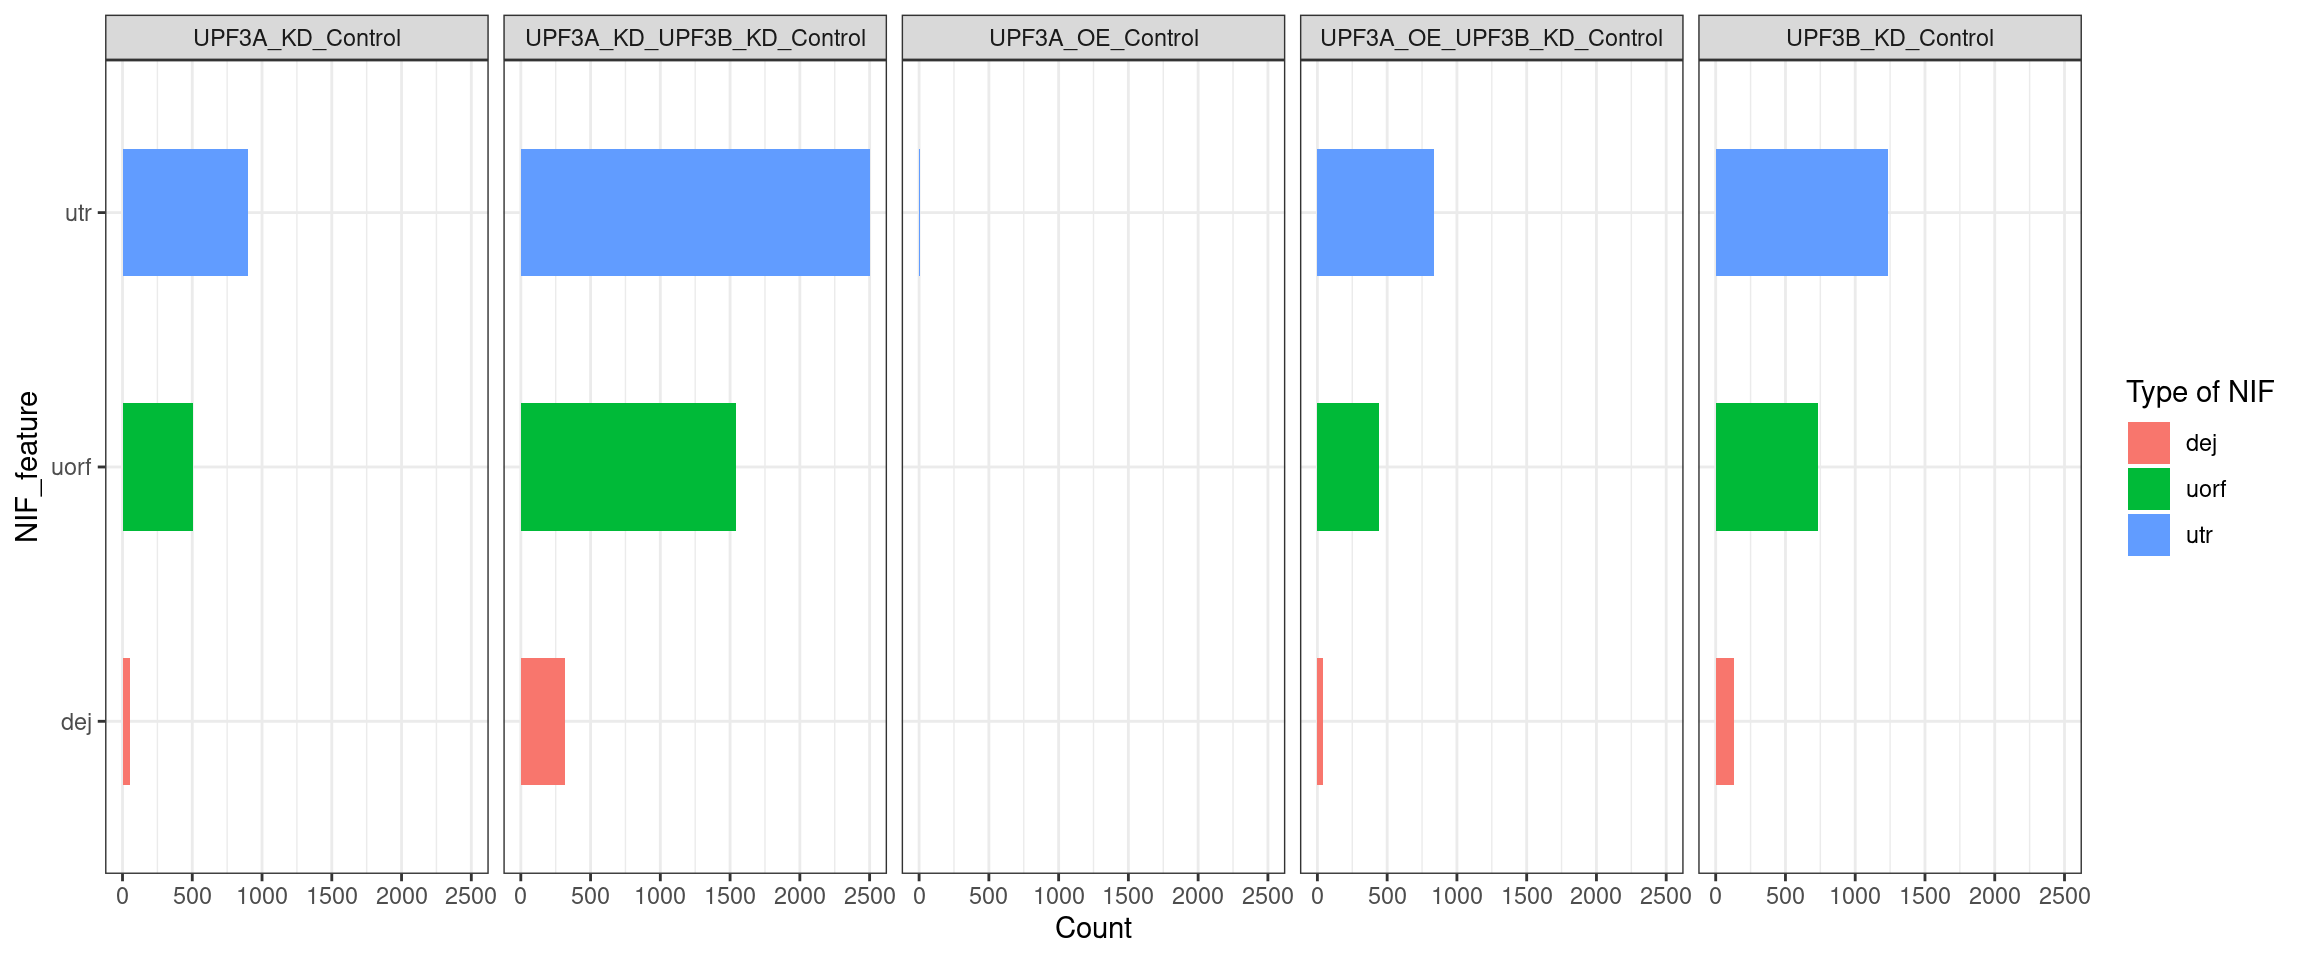
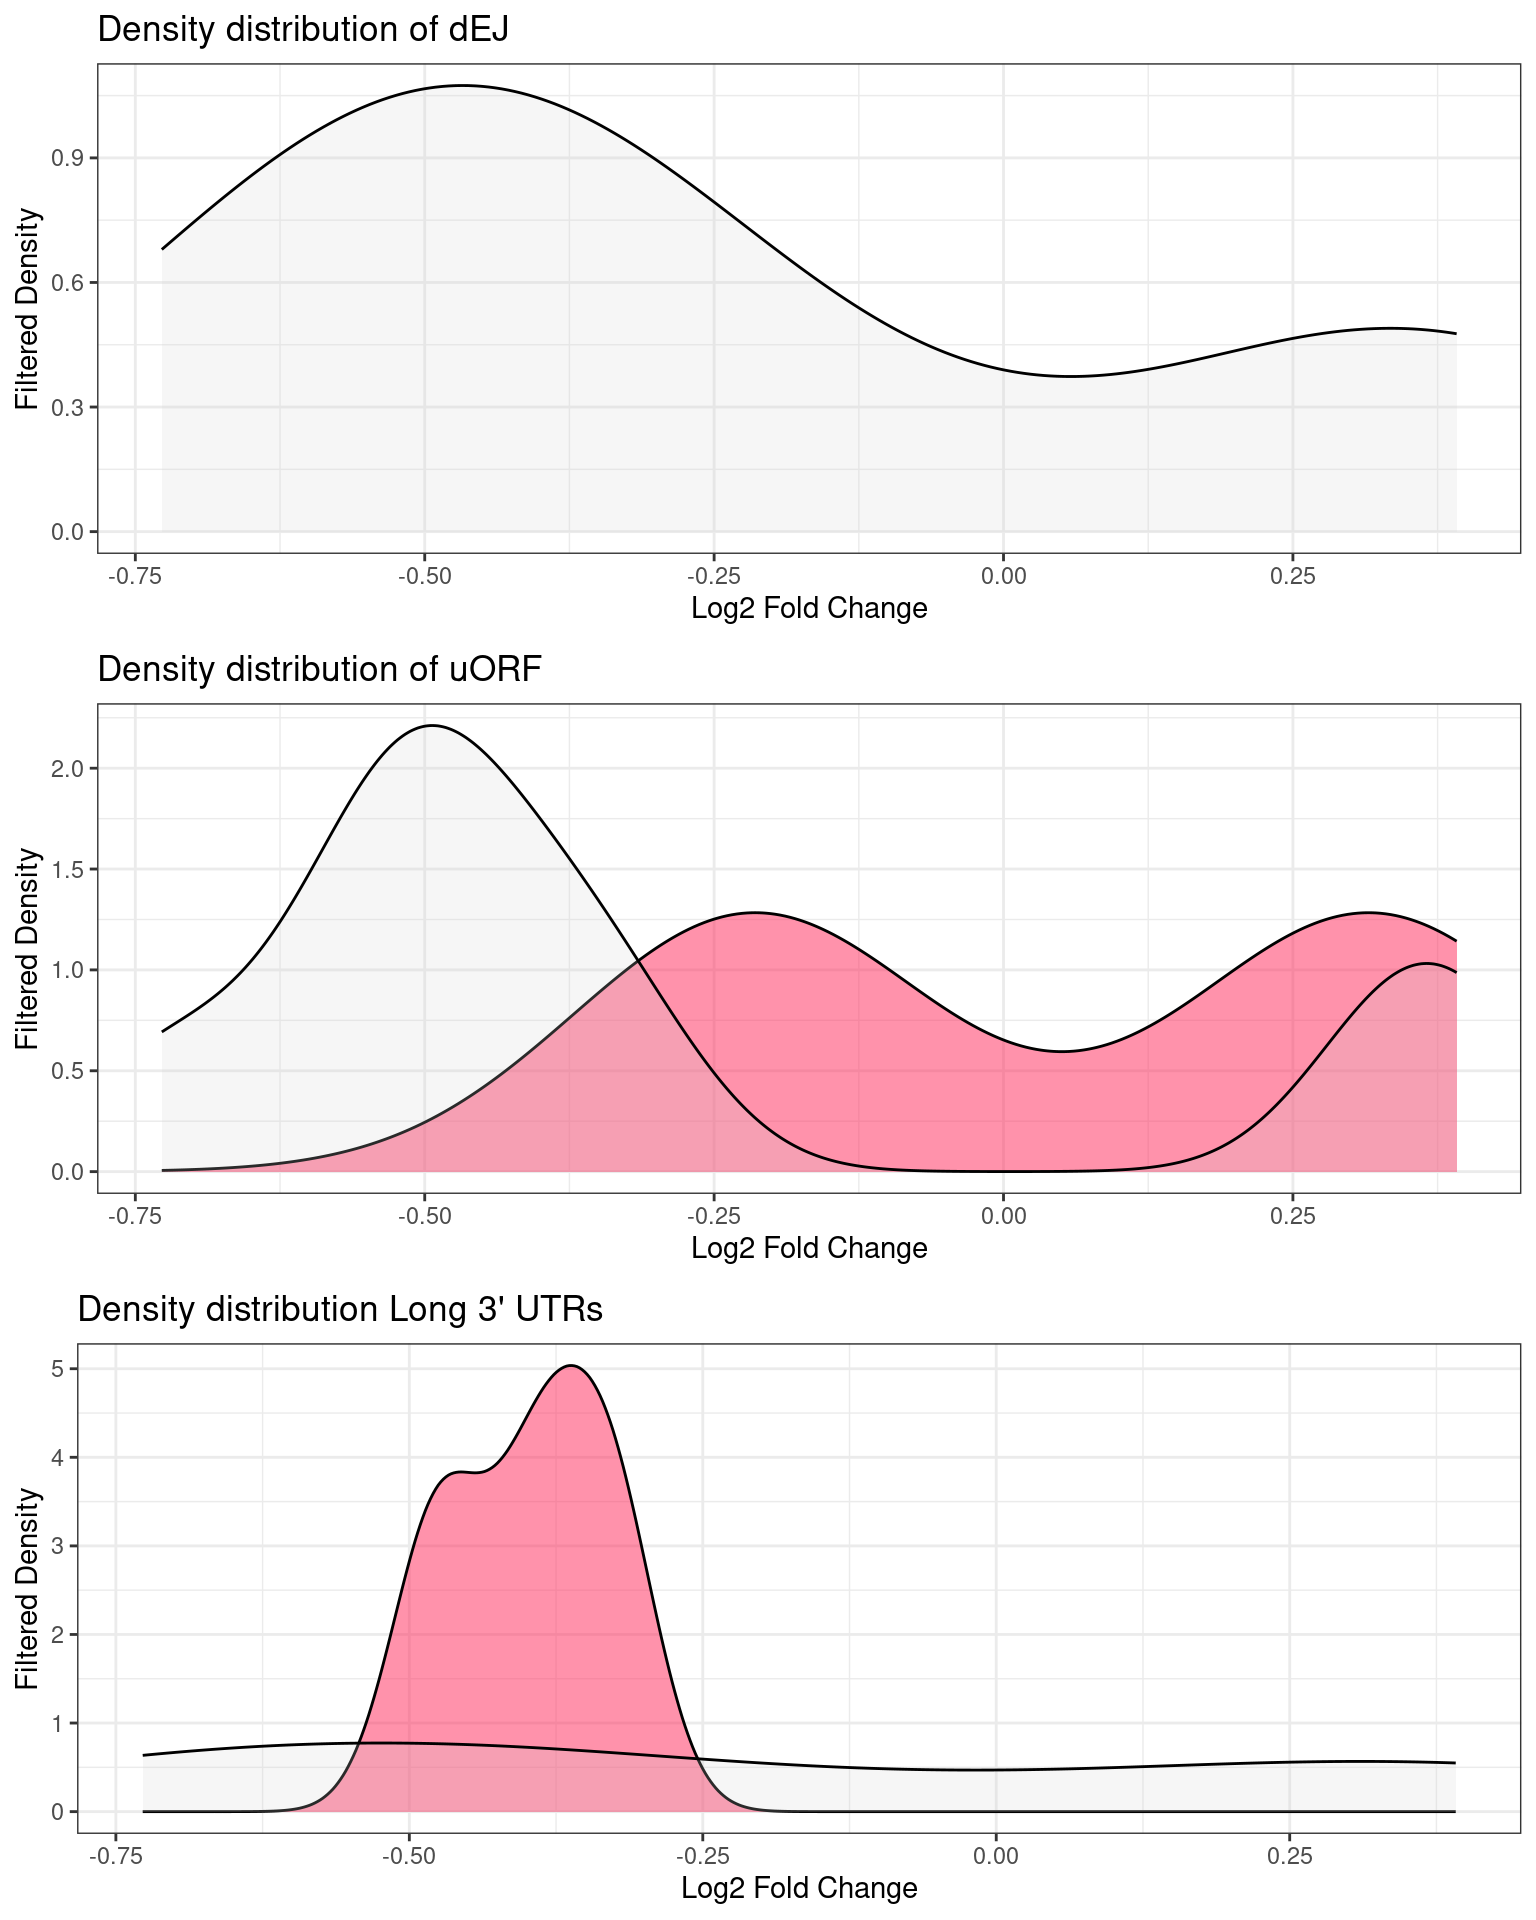
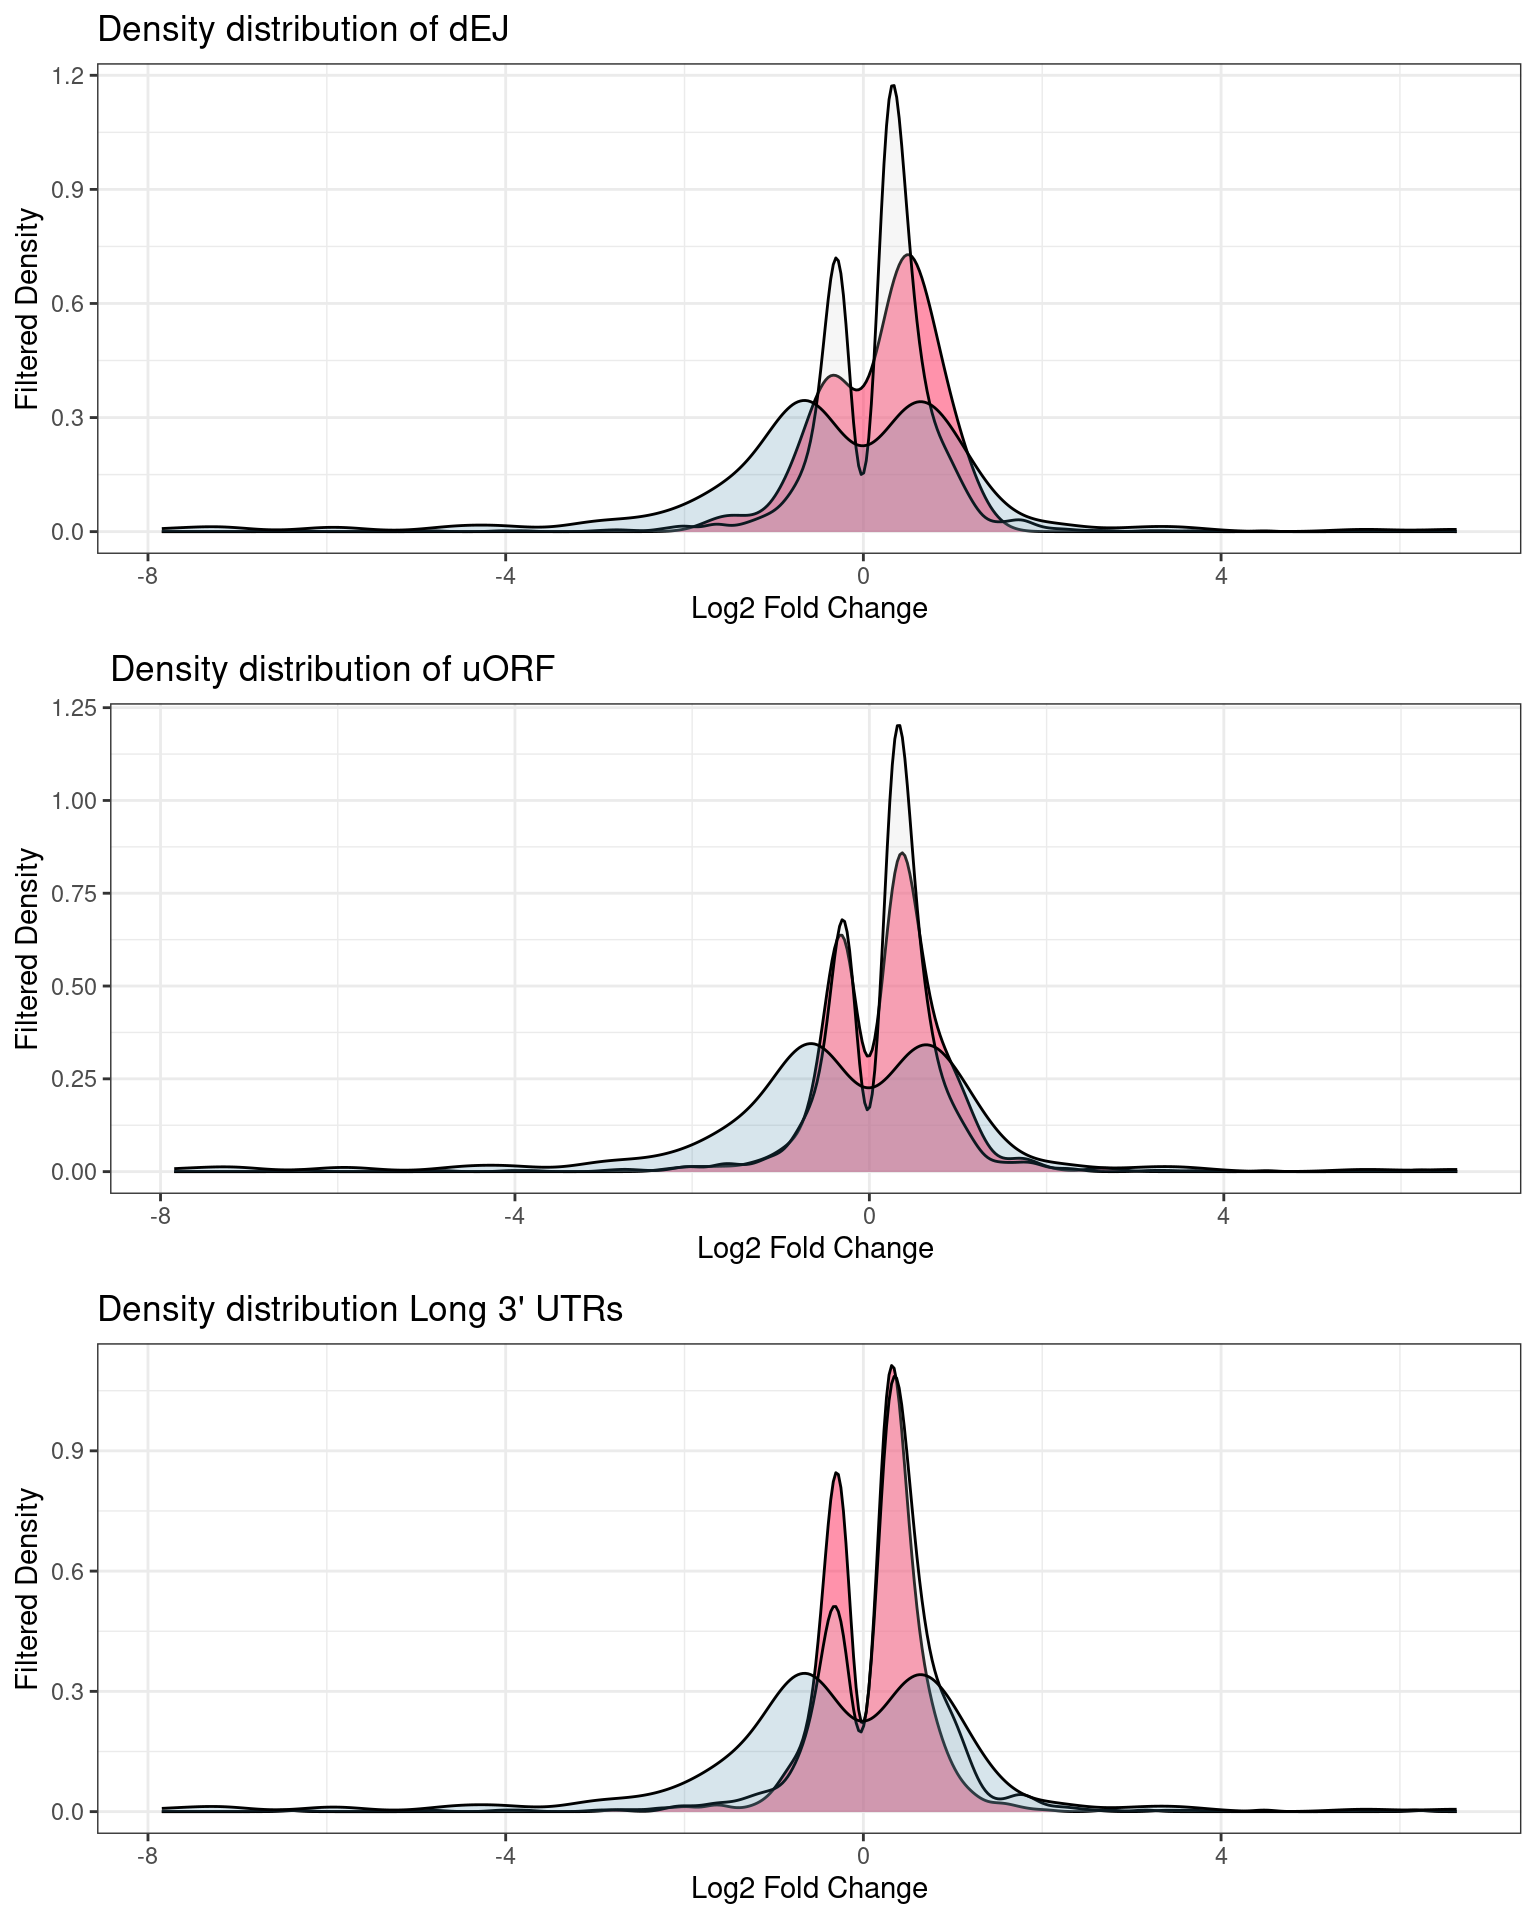
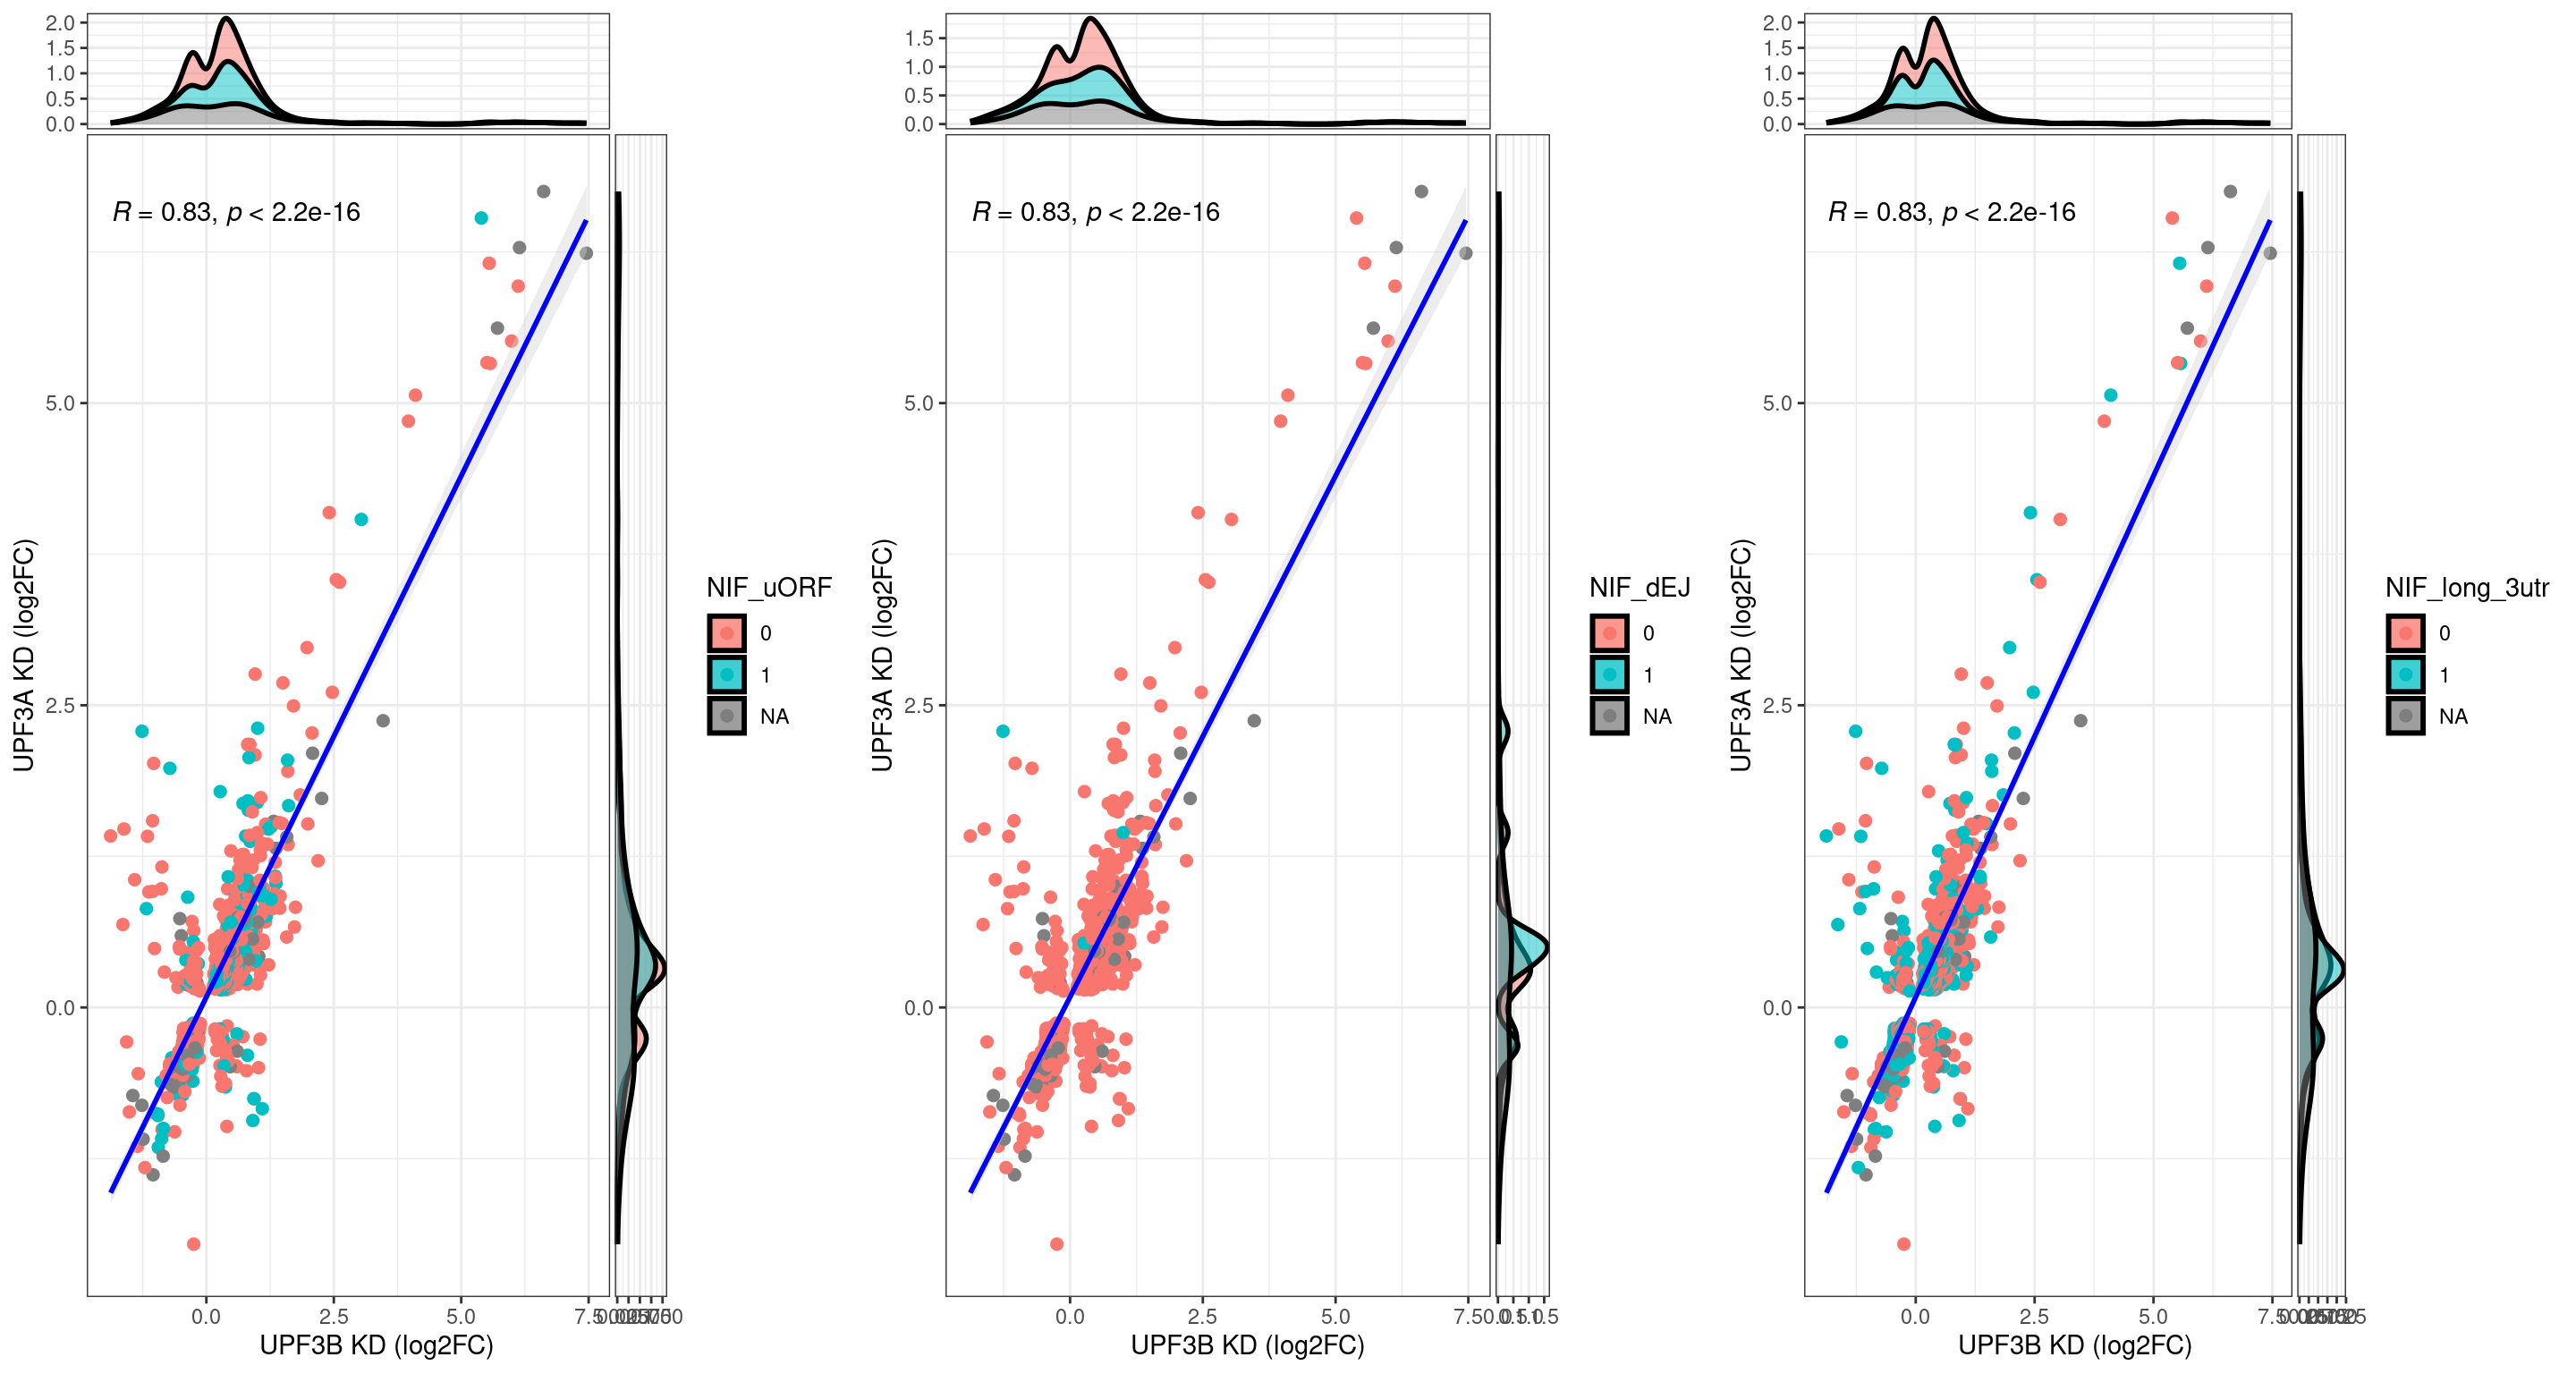
UPF3B transcripts with NMD features
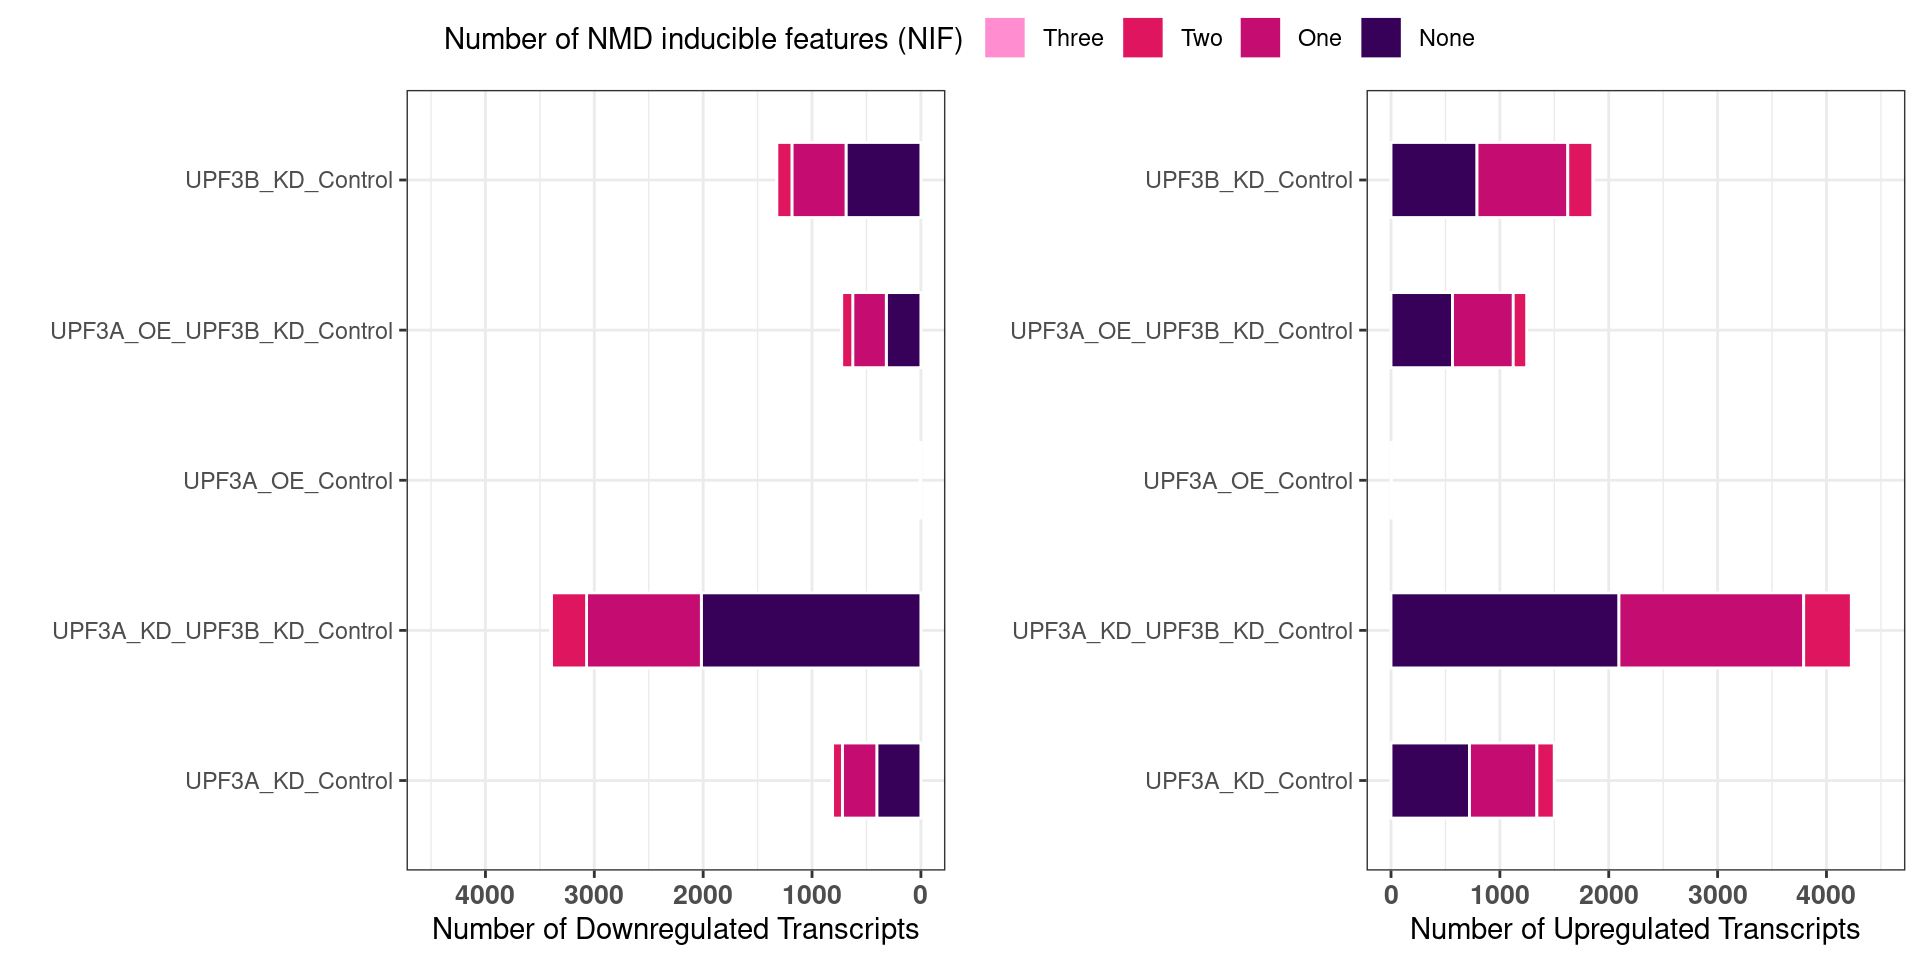
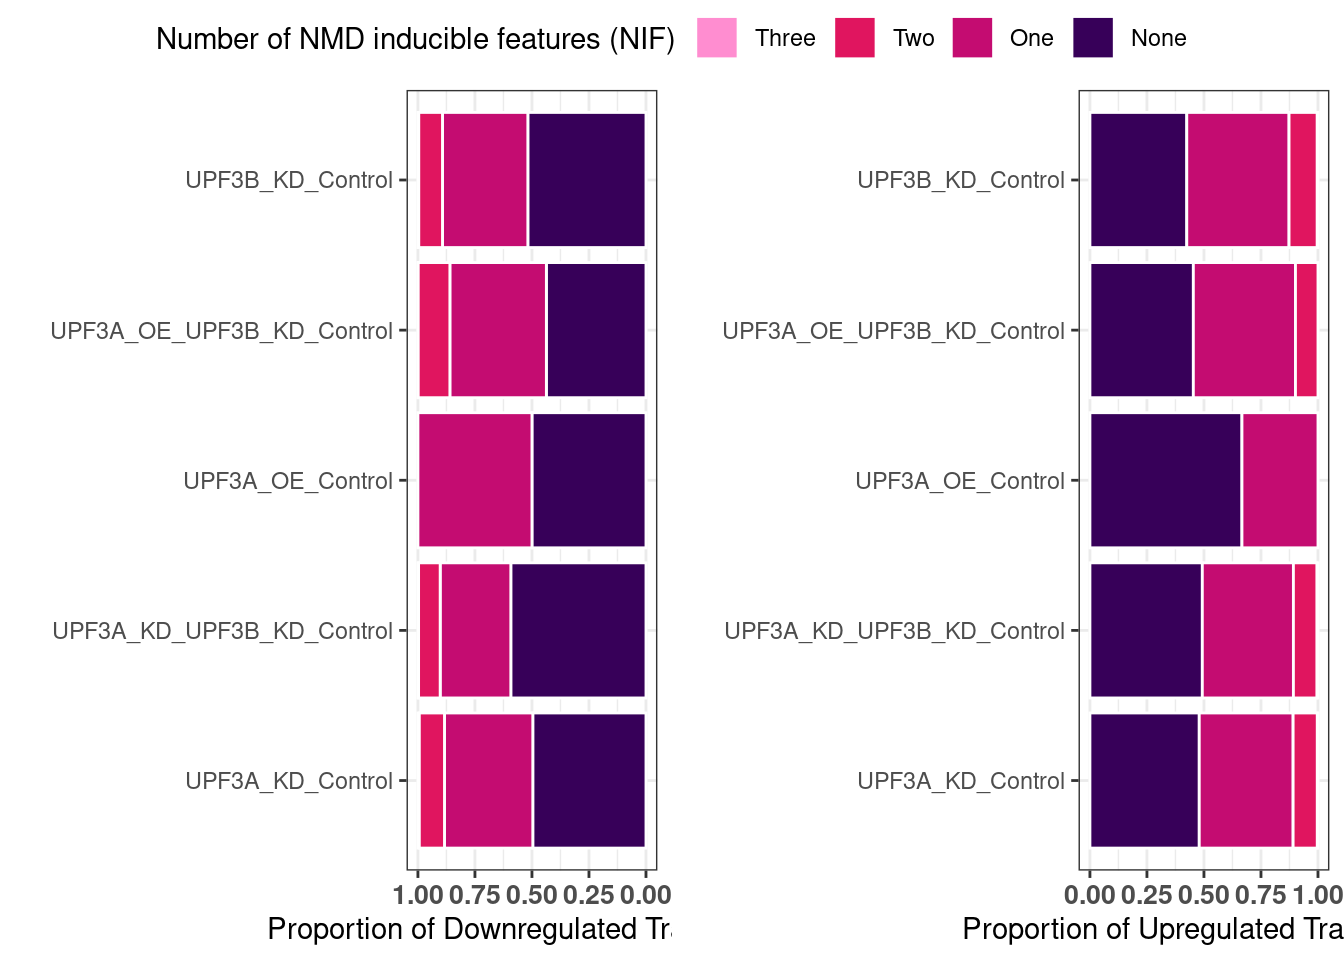
NIF in upregulated transcripts in UPF3B
| Version | Author | Date |
|---|---|---|
| 421e1d5 | unawaz1996 | 2023-05-10 |
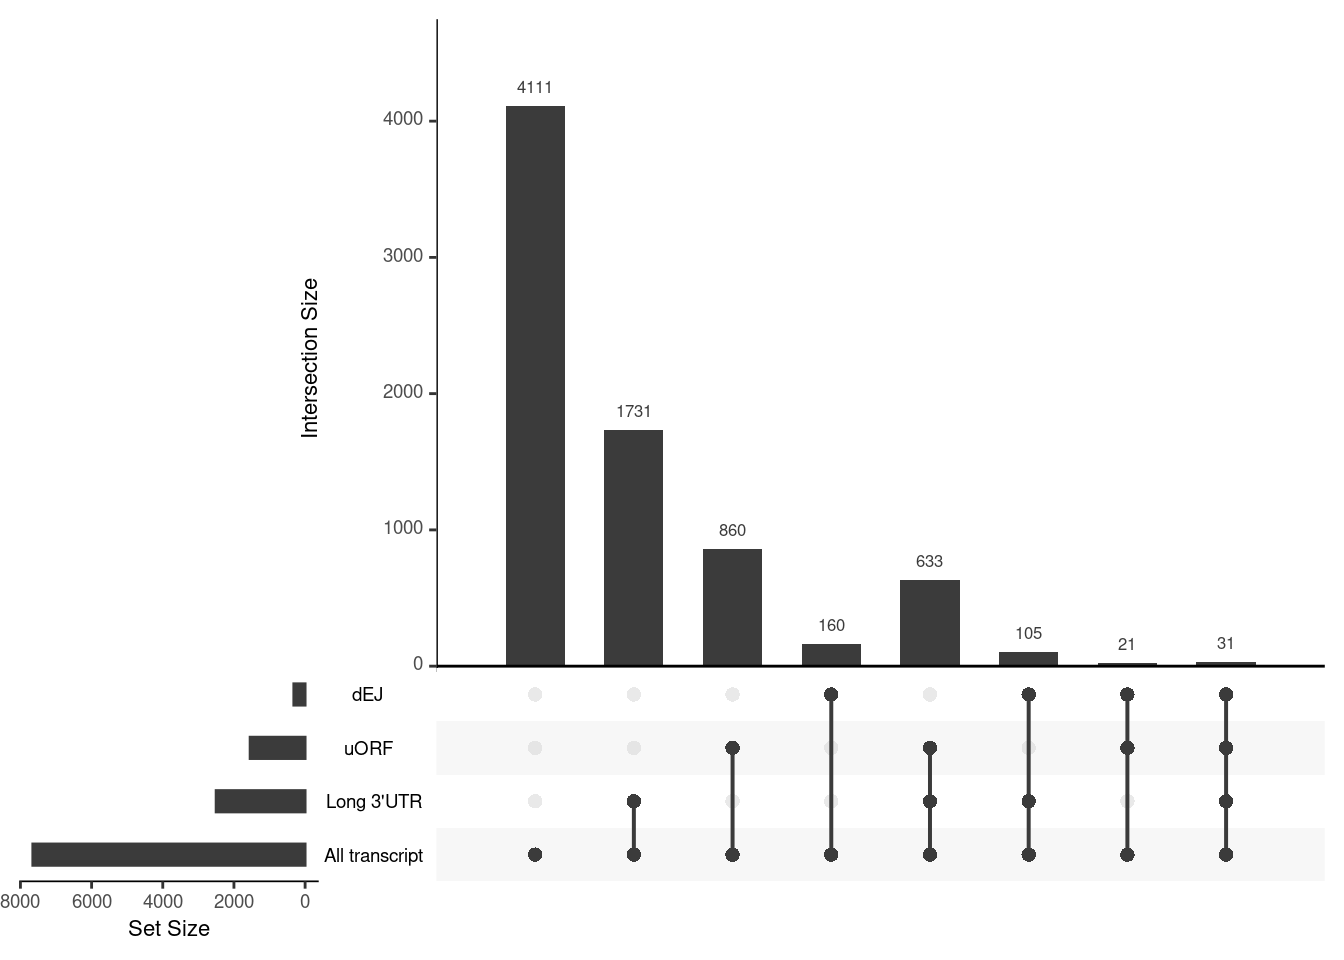
UPF3A transcripts
UPF3A transcripts with NMD features
NIF in upregulated transcripts in UPF3B
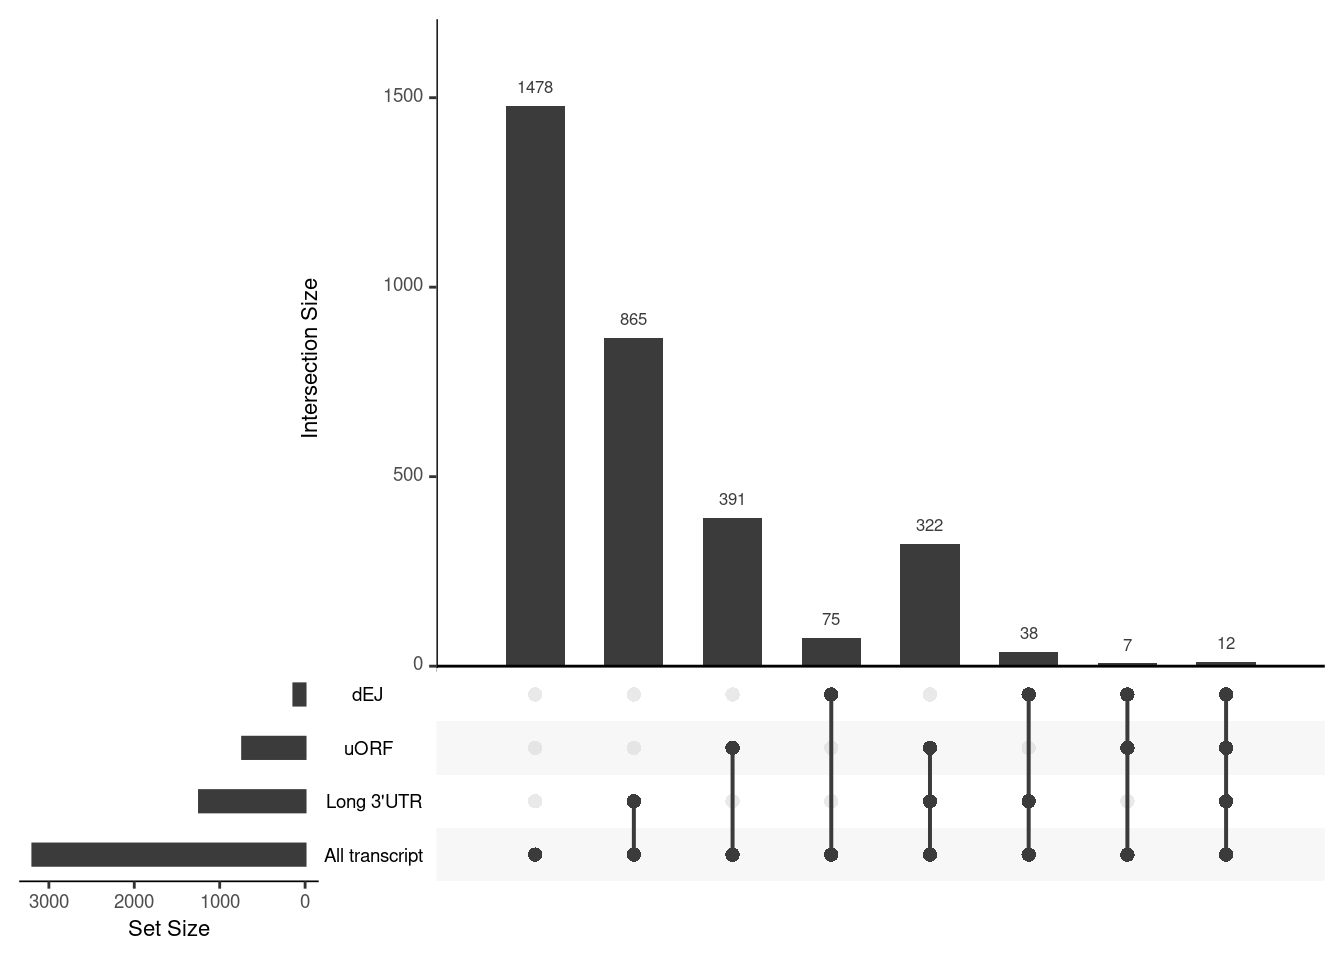
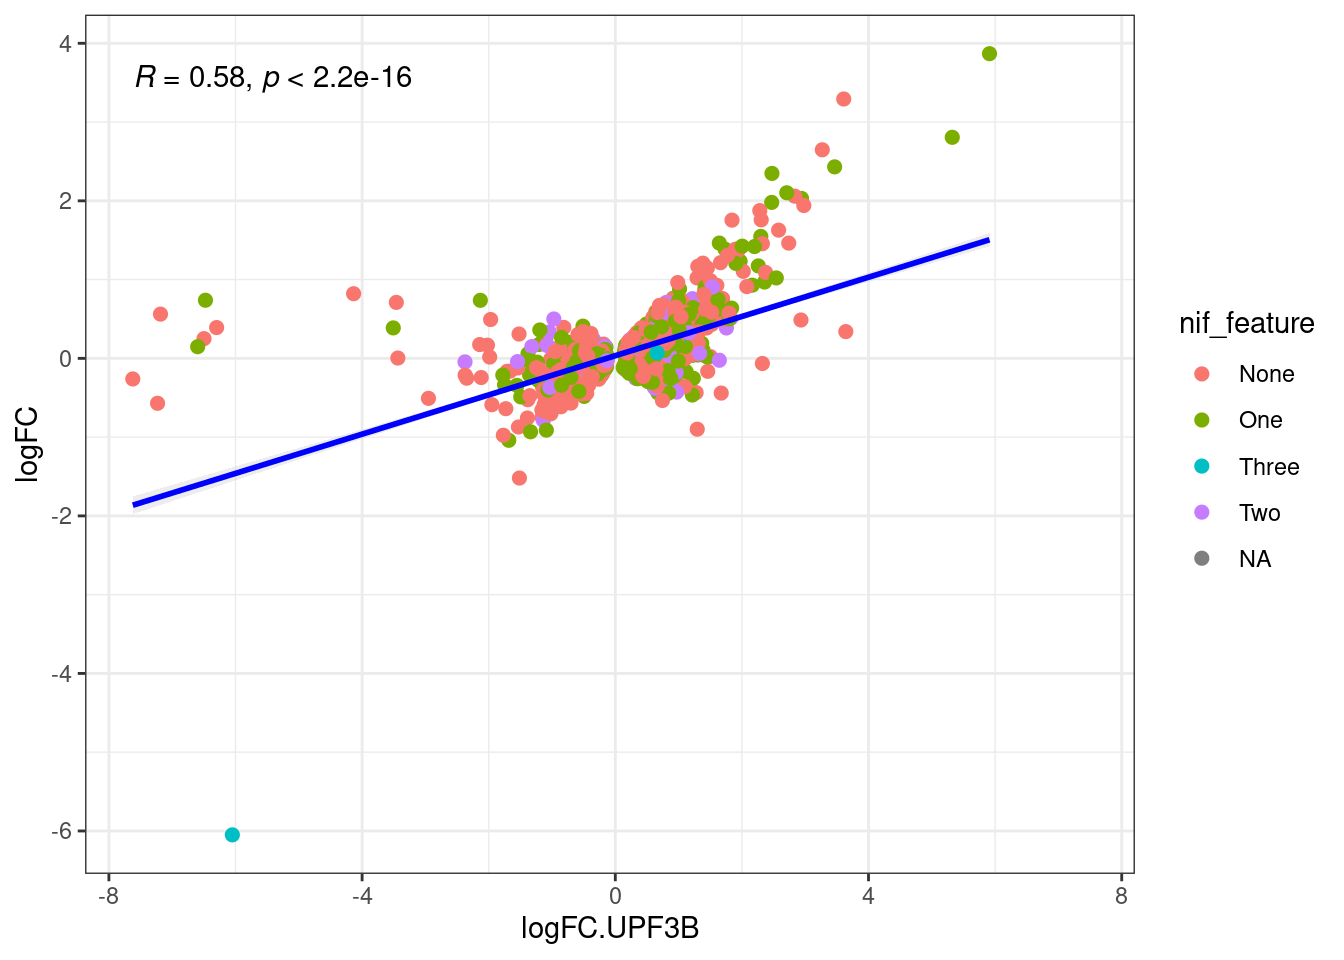
Comparison of DEGs with DETs
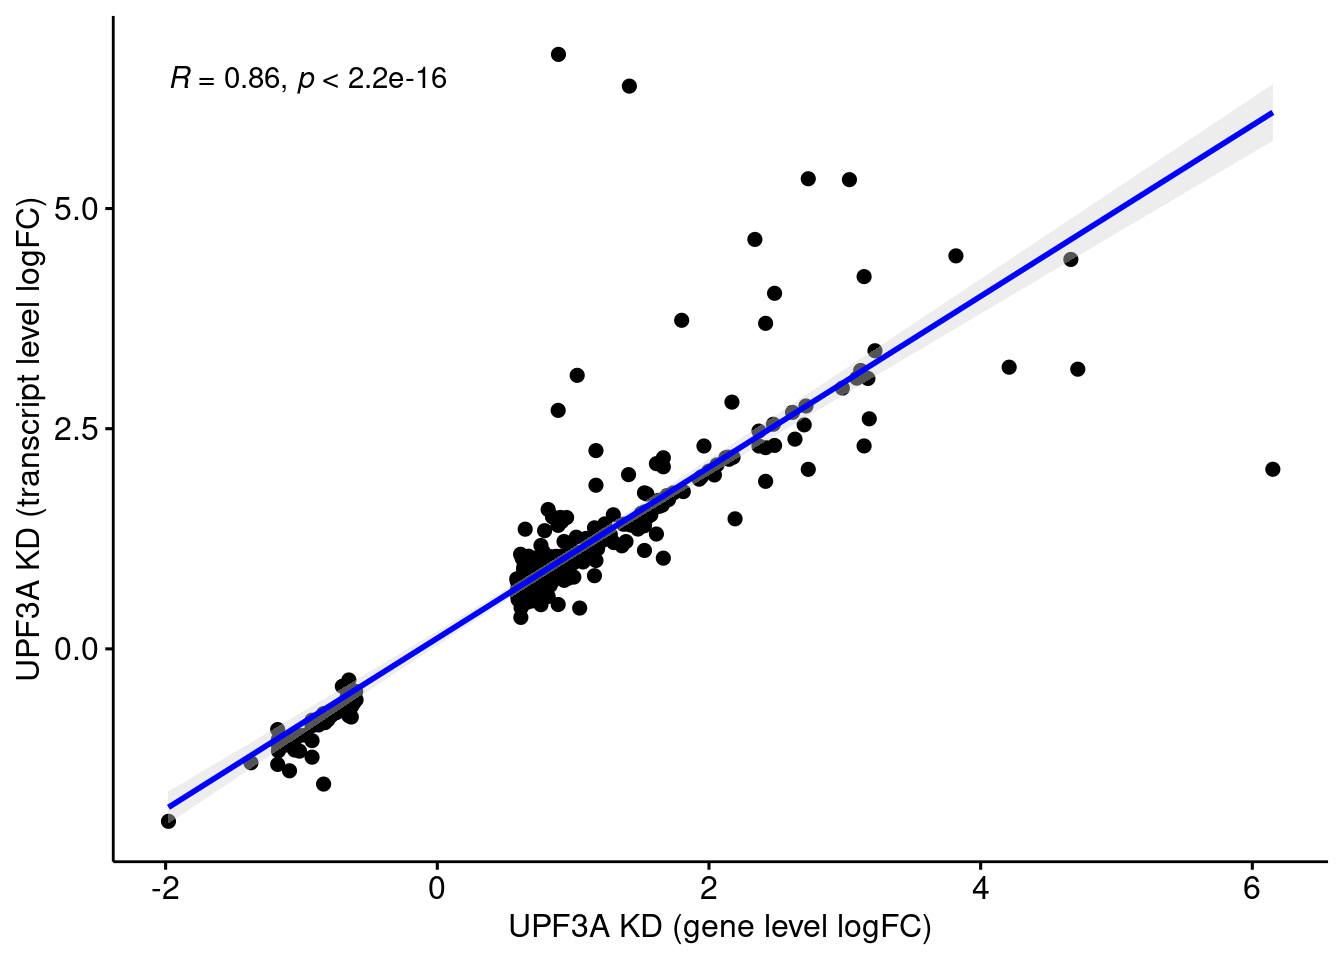
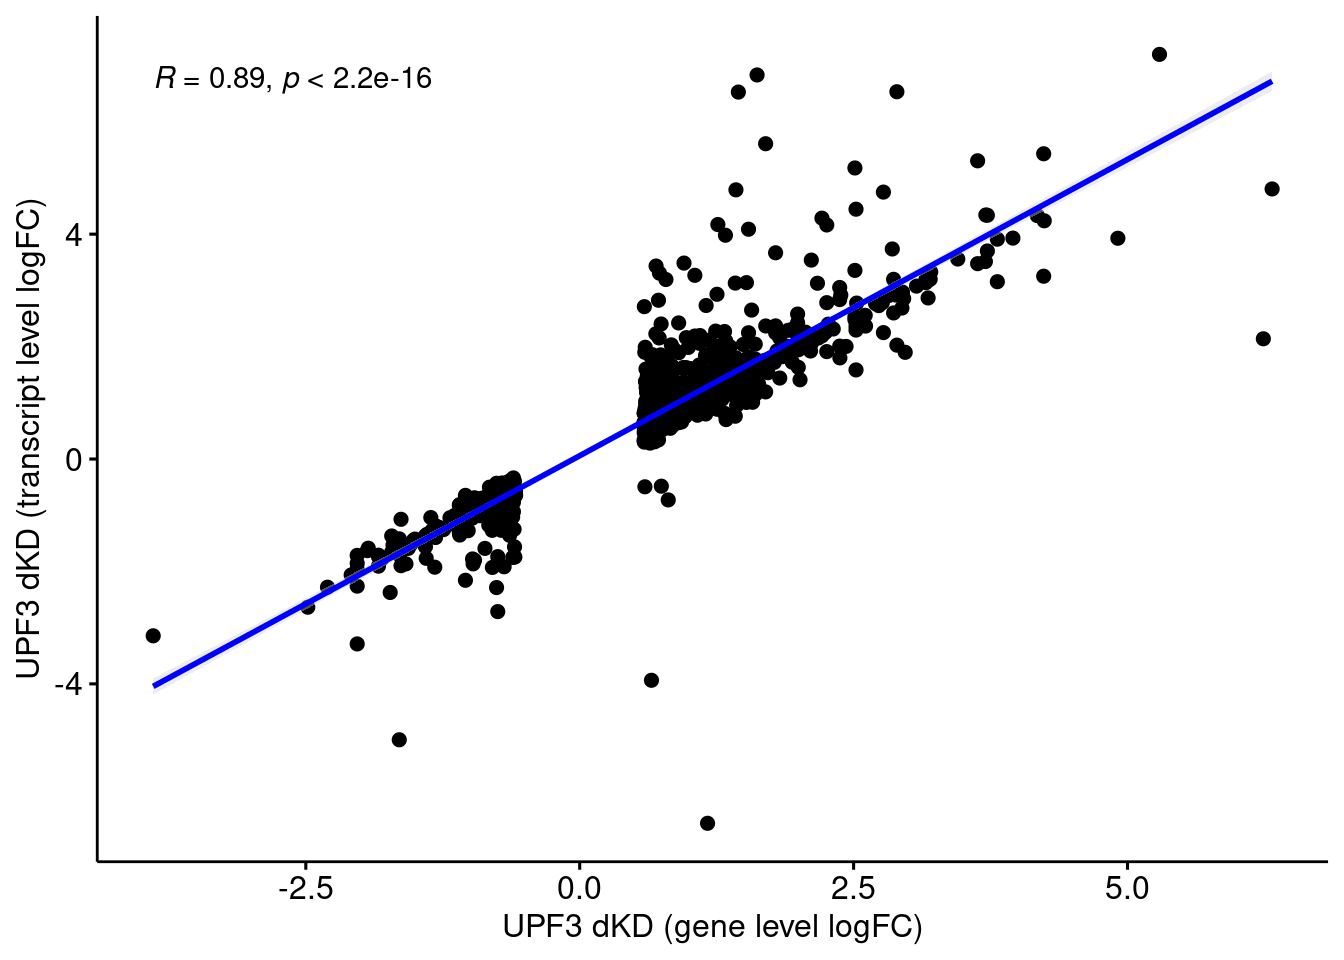
UPF3 dKD
Comparison of DEGs with DETs
Transcripts with NIFs
NIF in upregulated transcripts in UPF3B
UPF3A OE
UPF3A OE in UPF3B KD
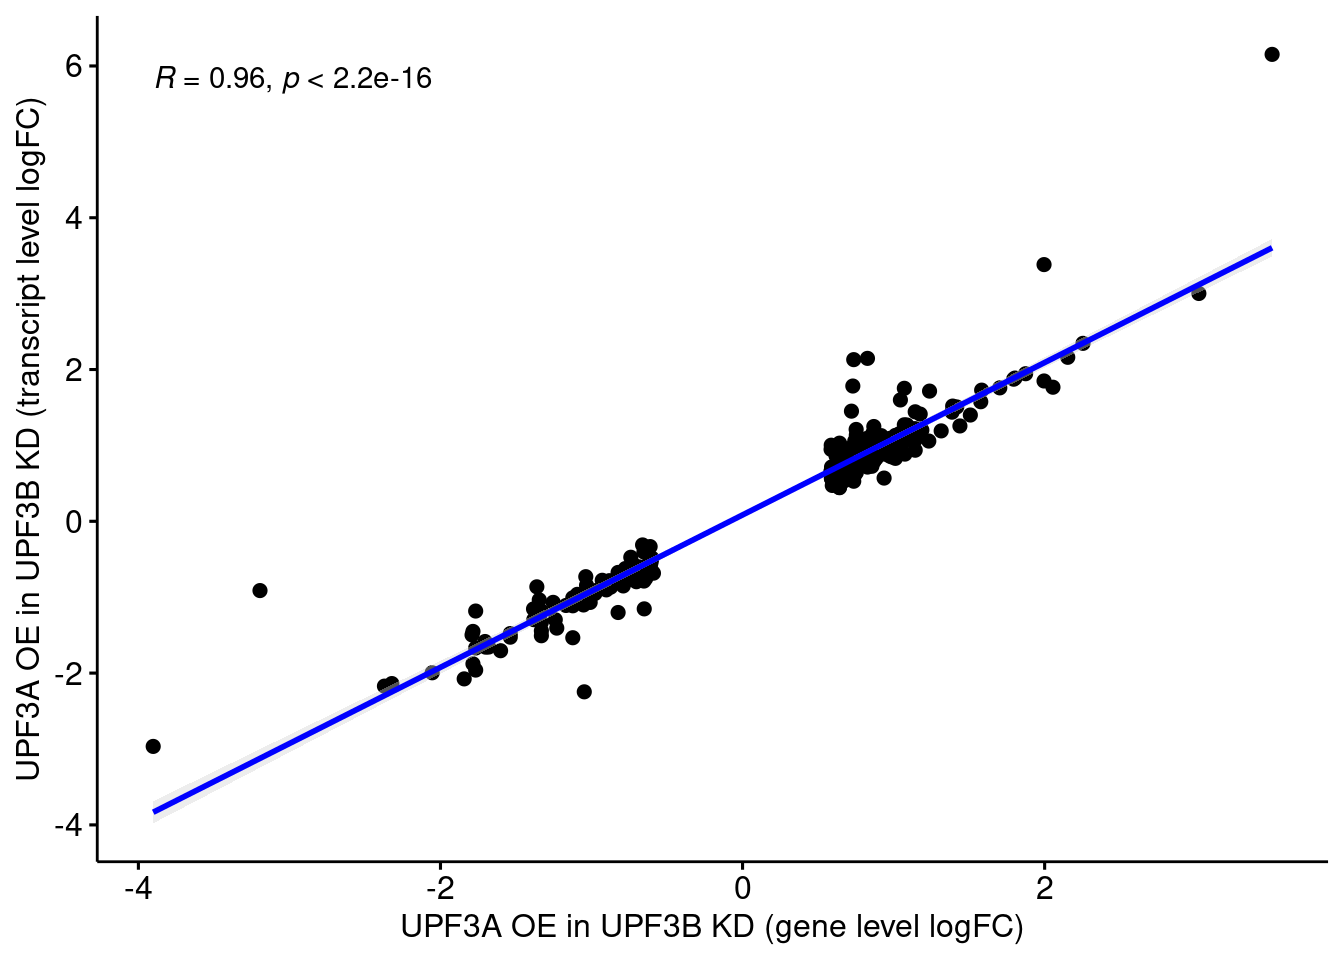
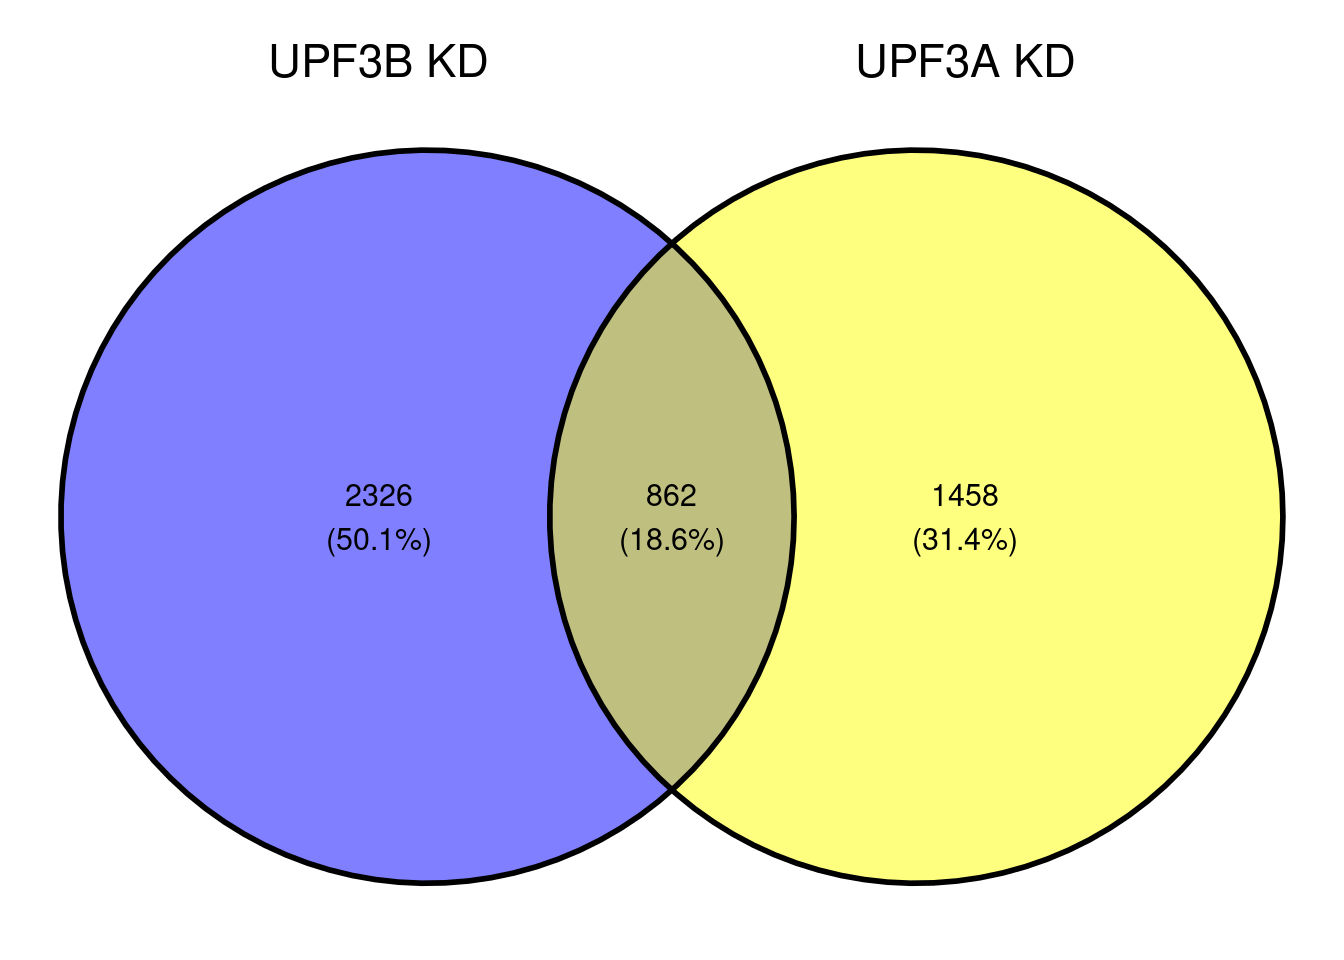
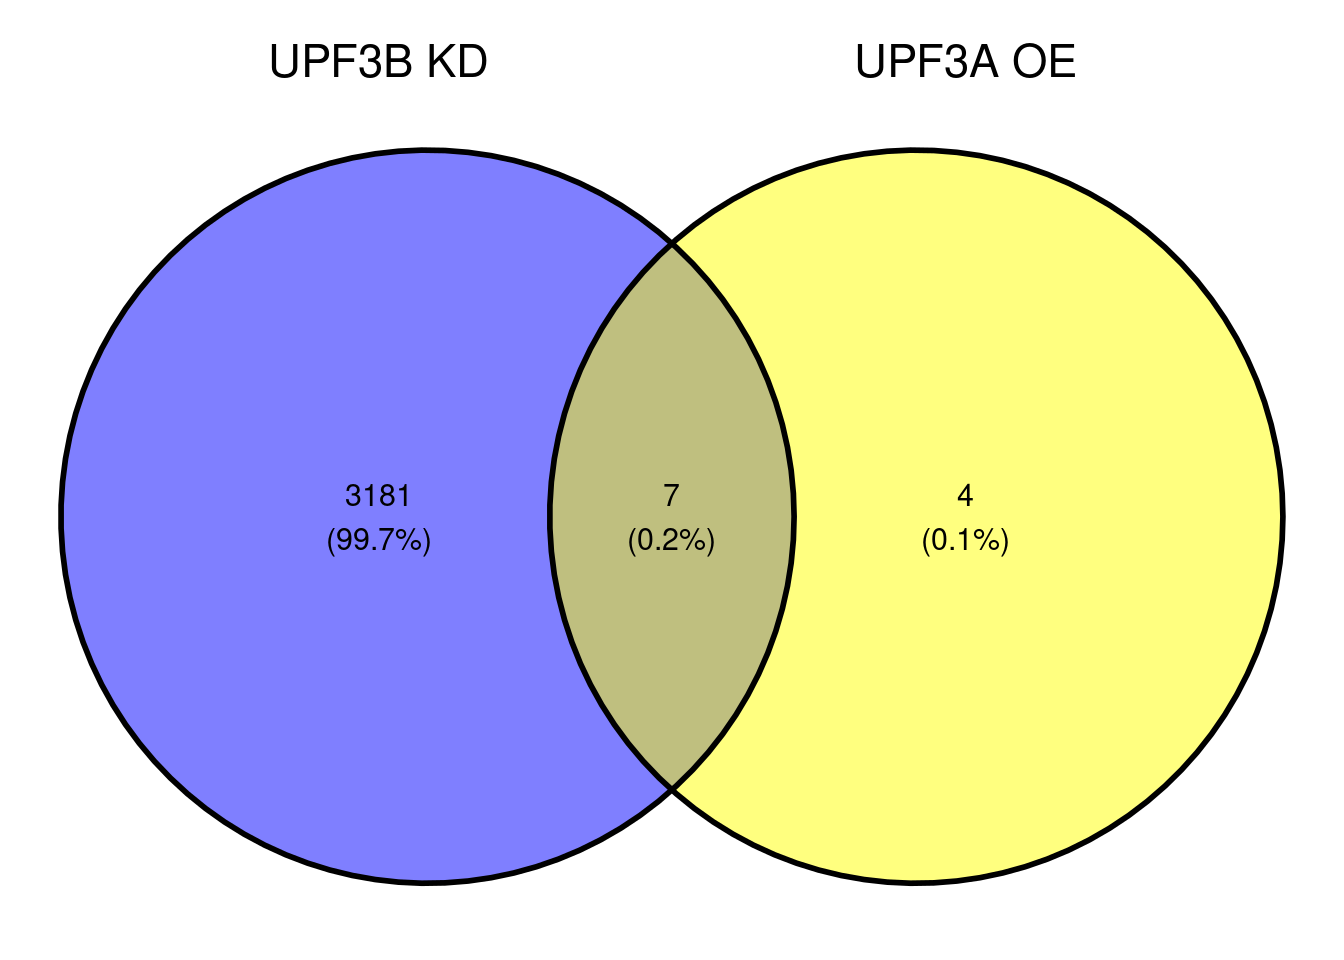
Are DET shared between UPF3B KD and UPF3A KD?
In UPF3B KD, there are 1860 upregulated genes aand 1328 downregulated genes
sign.lfc
  -1    1
 816 1504
In UPF3B KD, there are 1504 upregulated genes and 816 downregulated genes
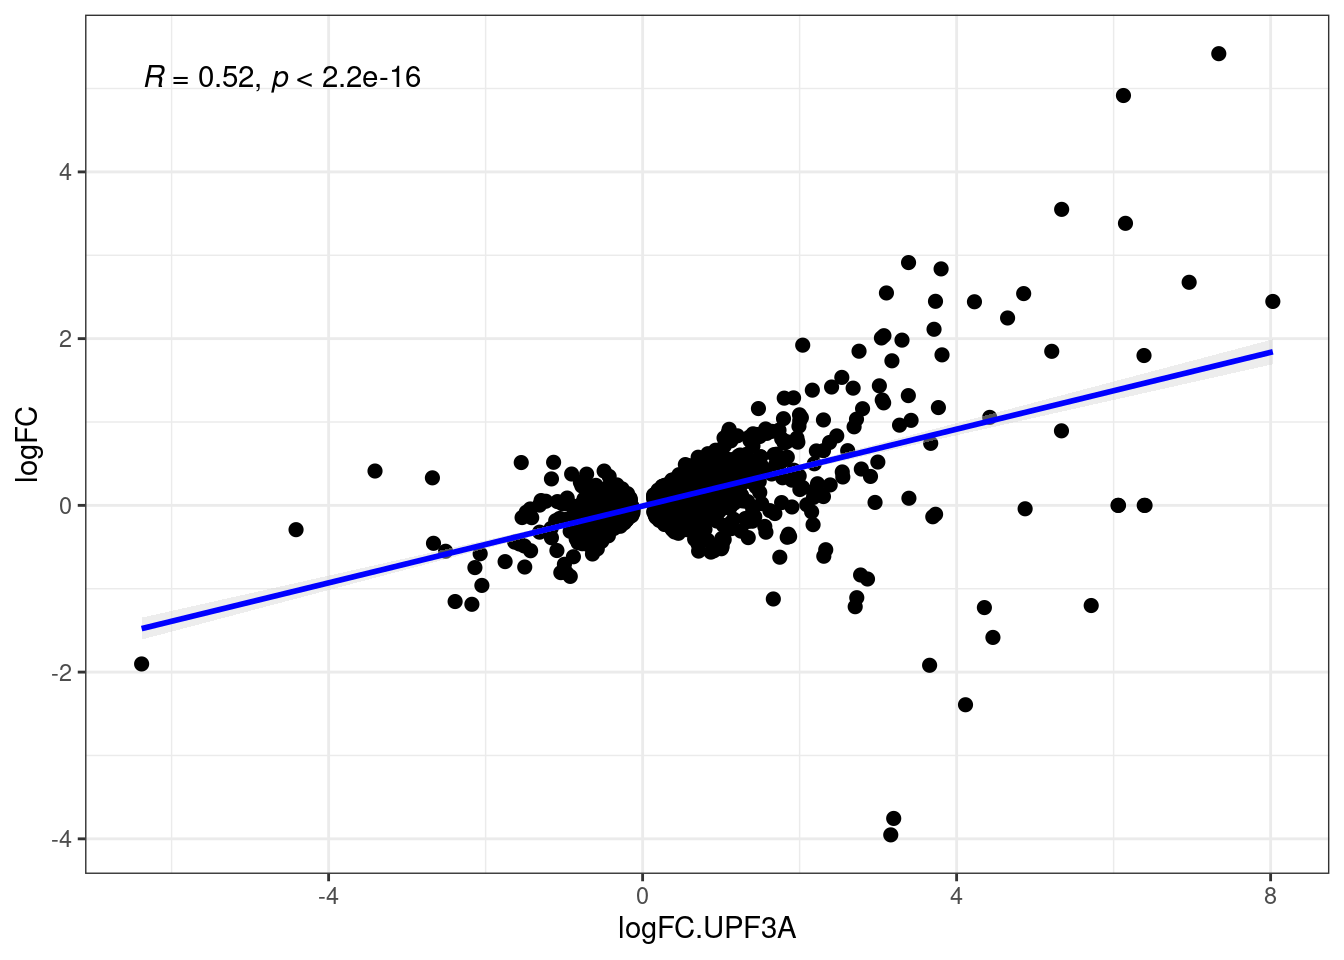
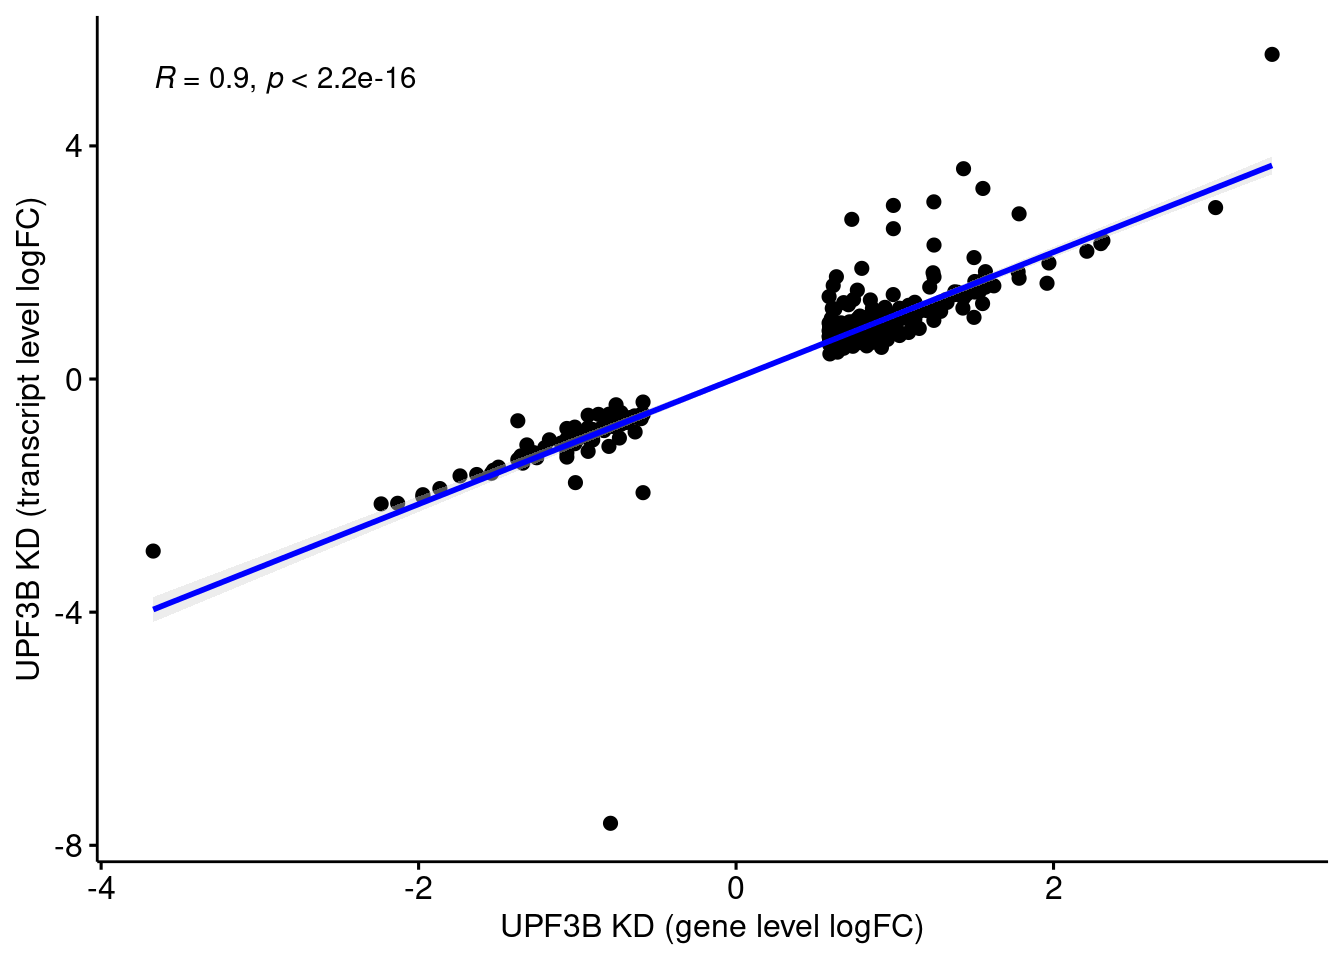
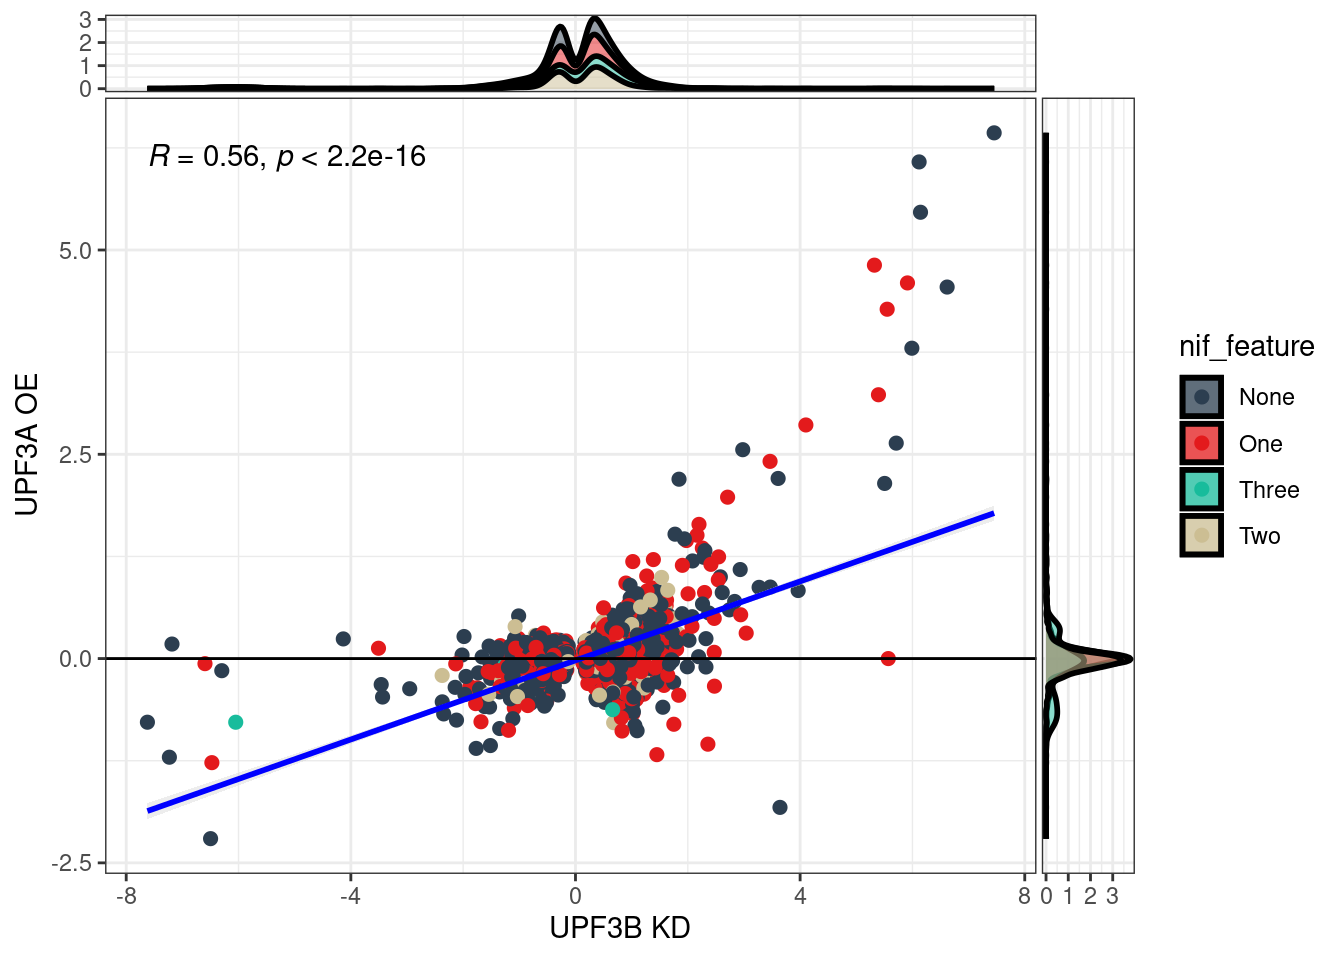
What is the distribution between transcripts in UPF3B KD and UPF3A OE?
** All conditions - transcript and gene level comparison
** Capacity to do genes with isoforms with different NIFs - try in UPF3B
** Is NMD a cell-type specific thing? –? Maybe UPF1 work with brain coexp networks
Any transcript that is expression - 40k transcripts that have multiple transcripts and have a look at the CPM - Just do it in UPF3B - average of the three samples
R version 4.2.2 Patched (2022-11-10 r83330)
Platform: x86_64-pc-linux-gnu (64-bit)
Running under: Ubuntu 22.04.2 LTS

Matrix products: default
BLAS:   /usr/lib/x86_64-linux-gnu/blas/libblas.so.3.10.0
LAPACK: /usr/lib/x86_64-linux-gnu/lapack/liblapack.so.3.10.0

locale:
 [1] LC_CTYPE=en_AU.UTF-8       LC_NUMERIC=C
 [3] LC_TIME=en_AU.UTF-8        LC_COLLATE=en_AU.UTF-8
 [5] LC_MONETARY=en_AU.UTF-8    LC_MESSAGES=en_AU.UTF-8
 [7] LC_PAPER=en_AU.UTF-8       LC_NAME=C
 [9] LC_ADDRESS=C               LC_TELEPHONE=C
[11] LC_MEASUREMENT=en_AU.UTF-8 LC_IDENTIFICATION=C

attached base packages:
 [1] grid      stats4    tools     stats     graphics  grDevices utils
 [8] datasets  methods   base

other attached packages:
  [1] bigPint_1.14.0                naniar_1.0.0
  [3] glmpca_0.2.0                  broom_1.0.4
  [5] glue_1.6.2                    ggfortify_0.4.16
  [7] stargazer_5.2.3               tidyquant_1.0.7
  [9] quantmod_0.4.21               TTR_0.24.3
 [11] PerformanceAnalytics_2.0.4    xts_0.13.0
 [13] zoo_1.8-11                    ggside_0.2.2
 [15] GeneOverlap_1.34.0            fishpond_2.4.1
 [17] IsoformSwitchAnalyzeR_2.01.04 pfamAnalyzeR_0.99.0
 [19] sva_3.46.0                    genefilter_1.80.3
 [21] mgcv_1.8-42                   nlme_3.1-162
 [23] satuRn_1.6.0                  DEXSeq_1.44.0
 [25] BiocParallel_1.32.6           ggrepel_0.9.3
 [27] pander_0.6.5                  msigdbr_7.5.1
 [29] cowplot_1.1.1                 ngsReports_2.0.3
 [31] patchwork_1.1.2               VennDiagram_1.7.3
 [33] futile.logger_1.4.3           UpSetR_1.4.0
 [35] fgsea_1.24.0                  GOplot_1.0.2
 [37] RColorBrewer_1.1-3            gridExtra_2.3
 [39] ggdendro_0.1.23               AnnotationHub_3.6.0
 [41] BiocFileCache_2.6.1           dbplyr_2.3.2
 [43] openxlsx_4.2.5.2              ggiraph_0.8.7
 [45] wasabi_1.0.1                  sleuth_0.30.1
 [47] DT_0.27                       VennDetail_1.14.0
 [49] msigdb_1.6.0                  GSEABase_1.60.0
 [51] graph_1.76.0                  annotate_1.76.0
 [53] XML_3.99-0.14                 pheatmap_1.0.12
 [55] ggvenn_0.1.10                 MetBrewer_0.2.0
 [57] ggpubr_0.6.0                  venn_1.11
 [59] viridis_0.6.2                 viridisLite_0.4.1
 [61] tximeta_1.16.1                tximport_1.26.1
 [63] goseq_1.50.0                  geneLenDataBase_1.34.0
 [65] BiasedUrn_2.0.9               org.Mm.eg.db_3.16.0
 [67] EnsDb.Mmusculus.v79_2.99.0    ensembldb_2.22.0
 [69] AnnotationFilter_1.22.0       GenomicFeatures_1.50.4
 [71] AnnotationDbi_1.60.2          biomaRt_2.54.1
 [73] edgeR_3.40.2                  limma_3.54.2
 [75] DESeq2_1.38.3                 SummarizedExperiment_1.28.0
 [77] Biobase_2.58.0                MatrixGenerics_1.10.0
 [79] matrixStats_0.63.0            GenomicRanges_1.50.2
 [81] GenomeInfoDb_1.34.9           IRanges_2.32.0
 [83] S4Vectors_0.36.2              BiocGenerics_0.44.0
 [85] corrplot_0.92                 lubridate_1.9.2
 [87] forcats_1.0.0                 purrr_1.0.1
 [89] readr_2.1.4                   tidyverse_2.0.0
 [91] stringr_1.5.0                 tidyr_1.3.0
 [93] scales_1.2.1                  data.table_1.14.8
 [95] readxl_1.4.2                  tibble_3.2.1
 [97] magrittr_2.0.3                reshape2_1.4.4
 [99] ggplot2_3.4.2                 dplyr_1.1.1
[101] workflowr_1.7.0

loaded via a namespace (and not attached):
  [1] Hmisc_5.0-1                   ps_1.7.4
  [3] Rsamtools_2.14.0              rprojroot_2.0.3
  [5] crayon_1.5.2                  MASS_7.3-58.3
  [7] rhdf5filters_1.10.1           backports_1.4.1
  [9] rlang_1.1.0                   XVector_0.38.0
 [11] callr_3.7.3                   filelock_1.0.2
 [13] rjson_0.2.21                  bit64_4.0.5
 [15] parallel_4.2.2                processx_3.8.0
 [17] shinydashboard_0.7.2          tidyselect_1.2.0
 [19] GenomicAlignments_1.34.1      xtable_1.8-4
 [21] evaluate_0.20                 cli_3.6.1
 [23] zlibbioc_1.44.0               hwriter_1.3.2.1
 [25] rstudioapi_0.14               whisker_0.4.1
 [27] bslib_0.4.2                   rpart_4.1.19
 [29] fastmatch_1.1-3               locfdr_1.1-8
 [31] lambda.r_1.2.4                shiny_1.7.4
 [33] xfun_0.38                     cluster_2.1.4
 [35] caTools_1.18.2                KEGGREST_1.38.0
 [37] interactiveDisplayBase_1.36.0 Biostrings_2.66.0
 [39] png_0.1-8                     reshape_0.8.9
 [41] withr_2.5.0                   bitops_1.0-7
 [43] plyr_1.8.8                    cellranger_1.1.0
 [45] pillar_1.9.0                  gplots_3.1.3
 [47] cachem_1.0.7                  fs_1.6.1
 [49] vctrs_0.6.1                   ellipsis_0.3.2
 [51] generics_0.1.3                foreign_0.8-84
 [53] munsell_0.5.0                 DelayedArray_0.24.0
 [55] fastmap_1.1.1                 compiler_4.2.2
 [57] abind_1.4-5                   httpuv_1.6.9
 [59] rtracklayer_1.58.0            plotly_4.10.1
 [61] GenomeInfoDbData_1.2.9        lattice_0.20-45
 [63] utf8_1.2.3                    later_1.3.0
 [65] Quandl_2.11.0                 jsonlite_1.8.4
 [67] GGally_2.1.2                  pbapply_1.7-0
 [69] carData_3.0-5                 lazyeval_0.2.2
 [71] promises_1.2.0.1              car_3.1-2
 [73] checkmate_2.1.0               rmarkdown_2.21
 [75] statmod_1.5.0                 BSgenome_1.66.3
 [77] survival_3.5-5                yaml_2.3.7
 [79] systemfonts_1.0.4             htmltools_0.5.5
 [81] memoise_2.0.1                 BiocIO_1.8.0
 [83] locfit_1.5-9.7                quadprog_1.5-8
 [85] digest_0.6.31                 mime_0.12
 [87] rappdirs_0.3.3                futile.options_1.0.1
 [89] RSQLite_2.3.1                 blob_1.2.4
 [91] labeling_0.4.2                splines_4.2.2
 [93] Formula_1.2-5                 Rhdf5lib_1.20.0
 [95] ProtGenerics_1.30.0           RCurl_1.98-1.12
 [97] hms_1.1.3                     rhdf5_2.42.0
 [99] colorspace_2.1-0              base64enc_0.1-3
[101] BiocManager_1.30.20           nnet_7.3-18
[103] sass_0.4.5                    Rcpp_1.0.10
[105] fansi_1.0.4                   tzdb_0.3.0
[107] R6_2.5.1                      lifecycle_1.0.3
[109] formatR_1.14                  zip_2.2.2
[111] curl_5.0.0                    ggsignif_0.6.4
[113] jquerylib_0.1.4               svMisc_1.2.3
[115] Matrix_1.5-3                  htmlwidgets_1.6.2
[117] crosstalk_1.2.0               timechange_0.2.0
[119] htmlTable_2.4.1               codetools_0.2-19
[121] GO.db_3.16.0                  gtools_3.9.4
[123] getPass_0.2-2                 prettyunits_1.1.1
[125] SingleCellExperiment_1.20.1   gtable_0.3.3
[127] DBI_1.1.3                     git2r_0.31.0
[129] visdat_0.6.0                  httr_1.4.5
[131] highr_0.10                    KernSmooth_2.23-20
[133] vroom_1.6.1                   stringi_1.7.12
[135] progress_1.2.2                farver_2.1.1
[137] uuid_1.1-0                    hexbin_1.28.3
[139] xml2_1.3.3                    admisc_0.31
[141] boot_1.3-28.1                 restfulr_0.0.15
[143] geneplotter_1.76.0            BiocVersion_3.16.0
[145] bit_4.0.5                     shinycssloaders_1.0.0
[147] pkgconfig_2.0.3               babelgene_22.9
[149] rstatix_0.7.2                 knitr_1.42