Quality Assessment of NMD RNA-seq data
unawaz1996
2023-03-14
Last updated: 2023-04-24
Checks: 6 1
Knit directory: NMD-analysis/
This reproducible R Markdown analysis was created with workflowr (version 1.7.0). The Checks tab describes the reproducibility checks that were applied when the results were created. The Past versions tab lists the development history.
Great! Since the R Markdown file has been committed to the Git repository, you know the exact version of the code that produced these results.
Great job! The global environment was empty. Objects defined in the global environment can affect the analysis in your R Markdown file in unknown ways. For reproduciblity it’s best to always run the code in an empty environment.
The command set.seed(20230314) was run prior to running
the code in the R Markdown file. Setting a seed ensures that any results
that rely on randomness, e.g. subsampling or permutations, are
reproducible.
Great job! Recording the operating system, R version, and package versions is critical for reproducibility.
Nice! There were no cached chunks for this analysis, so you can be confident that you successfully produced the results during this run.
Using absolute paths to the files within your workflowr project makes it difficult for you and others to run your code on a different machine. Change the absolute path(s) below to the suggested relative path(s) to make your code more reproducible.
| absolute | relative |
|---|---|
| /home/neuro/Documents/NMD_analysis/Analysis/NMD-analysis/output/Transcript/Thesis_figures/transcript-distribution.svg | output/Transcript/Thesis_figures/transcript-distribution.svg |
| /home/neuro/Documents/NMD_analysis/Analysis/NMD-analysis/output/Transcript/Thesis_figures/transcript-composition.svg | output/Transcript/Thesis_figures/transcript-composition.svg |
Great! You are using Git for version control. Tracking code development and connecting the code version to the results is critical for reproducibility.
The results in this page were generated with repository version 6110b63. See the Past versions tab to see a history of the changes made to the R Markdown and HTML files.
Note that you need to be careful to ensure that all relevant files for
the analysis have been committed to Git prior to generating the results
(you can use wflow_publish or
wflow_git_commit). workflowr only checks the R Markdown
file, but you know if there are other scripts or data files that it
depends on. Below is the status of the Git repository when the results
were generated:
Ignored files:
    Ignored:    .Rhistory
    Ignored:    .Rproj.user/
    Ignored:    analysis/Differential-transcript-usage.nb.html
    Ignored:    analysis/Enichment-analysis-fgsea.nb.html
    Ignored:    analysis/Enichment-analysis-goseq.nb.html

Untracked files:
    Untracked:  PCA.png
    Untracked:  PCA_plot.pdf
    Untracked:  PCA_transcript.png
    Untracked:  analysis/Differential-transcript-expression.Rmd
    Untracked:  analysis/Differential-transcript-usage.Rmd
    Untracked:  analysis/UPF3B_KD.Rmd
    Untracked:  analysis/figures.Rmd
    Untracked:  analysis/transcript-preprocessing.Rmd
    Untracked:  code/QuasR_log_7219053fb51a5.txt
    Untracked:  code/QuasR_log_74f7f374c3271.txt
    Untracked:  code/QuasR_log_7a13e31c3d08a.txt
    Untracked:  code/QuasR_log_7ac9f1cedf971.txt
    Untracked:  code/QuasR_log_7bbdc44874ffd.txt
    Untracked:  code/eisaR.R
    Untracked:  code/external_code/
    Untracked:  data/LTK_Sample Metafile_V3.txt
    Untracked:  data/Mus_musculus.GRCm39.105__nifs.tsv
    Untracked:  data/fastqc/
    Untracked:  data/nif_output/
    Untracked:  data/samples.txt
    Untracked:  output/DEG-limma-results.Rda
    Untracked:  output/DEG-list.Rda
    Untracked:  output/DEG/
    Untracked:  output/ISAR/
    Untracked:  output/QC/
    Untracked:  output/Transcript/
    Untracked:  output/isoformSwitchAnalyzeR_isoform_AA_complete.fasta
    Untracked:  output/isoformSwitchAnalyzeR_isoform_AA_subset_1_of_3.fasta
    Untracked:  output/isoformSwitchAnalyzeR_isoform_AA_subset_2_of_3.fasta
    Untracked:  output/isoformSwitchAnalyzeR_isoform_AA_subset_3_of_3.fasta
    Untracked:  output/isoformSwitchAnalyzeR_isoform_nt.fasta
    Untracked:  output/limma-matrices.Rda

Unstaged changes:
    Modified:   analysis/DEG-analysis.Rmd
    Modified:   analysis/Enichment-analysis-fgsea.Rmd
    Modified:   analysis/_site.yml
    Modified:   code/functions.R
    Modified:   code/libraries.R
Note that any generated files, e.g. HTML, png, CSS, etc., are not included in this status report because it is ok for generated content to have uncommitted changes.
These are the previous versions of the repository in which changes were
made to the R Markdown (analysis/Quality-control.Rmd) and
HTML (docs/Quality-control.html) files. If you’ve
configured a remote Git repository (see ?wflow_git_remote),
click on the hyperlinks in the table below to view the files as they
were in that past version.
| File | Version | Author | Date | Message |
|---|---|---|---|---|
| Rmd | 6110b63 | unawaz1996 | 2023-04-24 | wflow_publish("analysis/Quality-control.Rmd") |
| html | be057f2 | unawaz1996 | 2023-04-24 | Build site. |
| Rmd | f5fc094 | unawaz1996 | 2023-04-24 | wflow_publish("analysis/Quality-control.Rmd") |
| html | 5196f41 | unawaz1996 | 2023-04-21 | Build site. |
| Rmd | b9393bc | unawaz1996 | 2023-04-21 | wflow_publish(c("analysis/index.Rmd", "analysis/Quality-control.Rmd")) |
| html | 650317e | unawaz1996 | 2023-03-22 | Build site. |
| Rmd | f2ed11a | unawaz1996 | 2023-03-22 | wflow_publish(c("analysis/index.Rmd", "analysis/Enichment-analysis-fgsea.Rmd", |
Set-up
In order to perform QC, an EnsDB object was obtained using the
AnnotationHub package. This provided the GC content and
length for each of the transcripts contained in the release.
Metadata for each fastq file was also loaded. Reads were provided as paired-end reads, with n = 3 samples for each genotype.
FastQC summary
FastQC summary
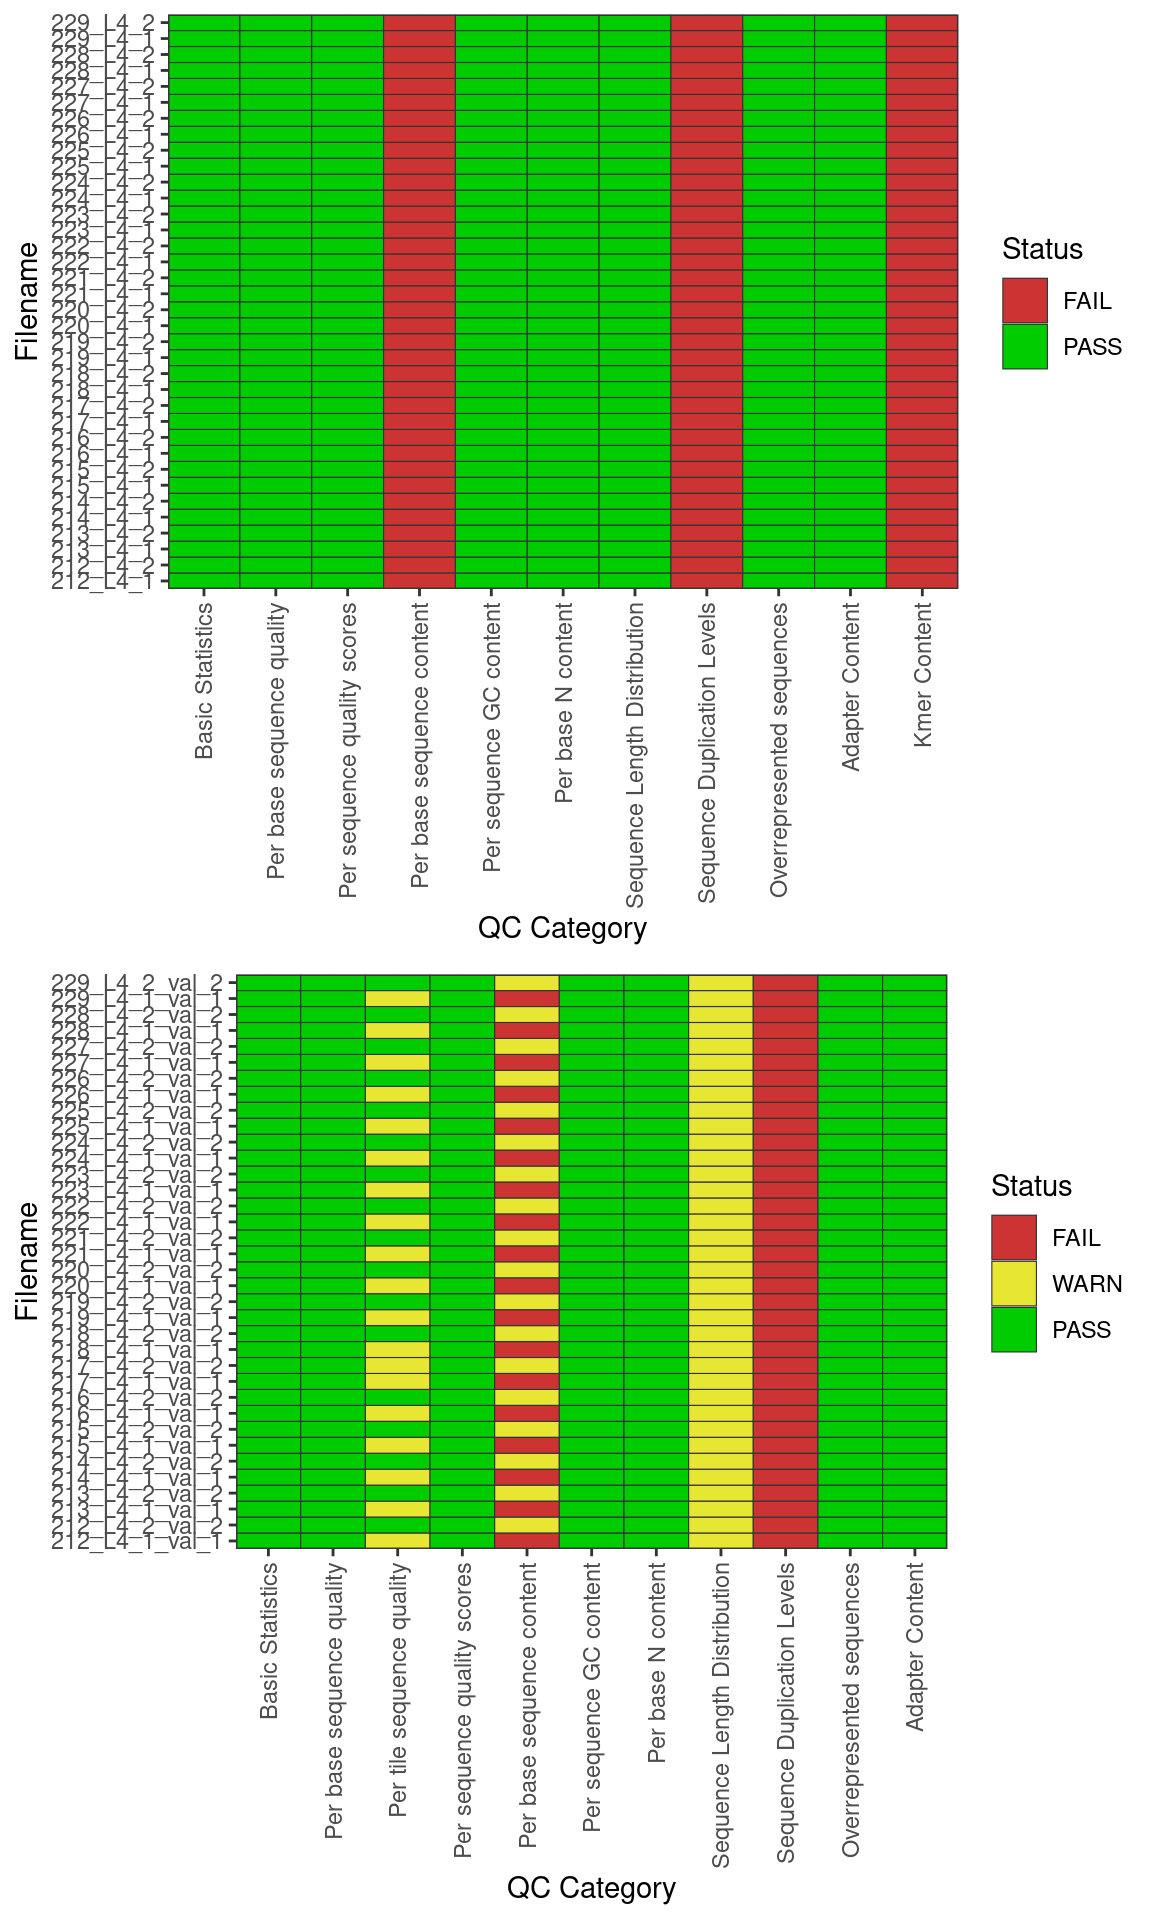
Basic statistics summary plot. Figure (a) hsows the summary of the PASS/FAIl flags prior to base quality and adapter trimming. Figure (b) shows the summary of PASS/FAIL flags after quality trimming with trimgalore. Green: PASS; Yellow: FAIL; Red: WARN
| Version | Author | Date |
|---|---|---|
| 5196f41 | unawaz1996 | 2023-04-21 |
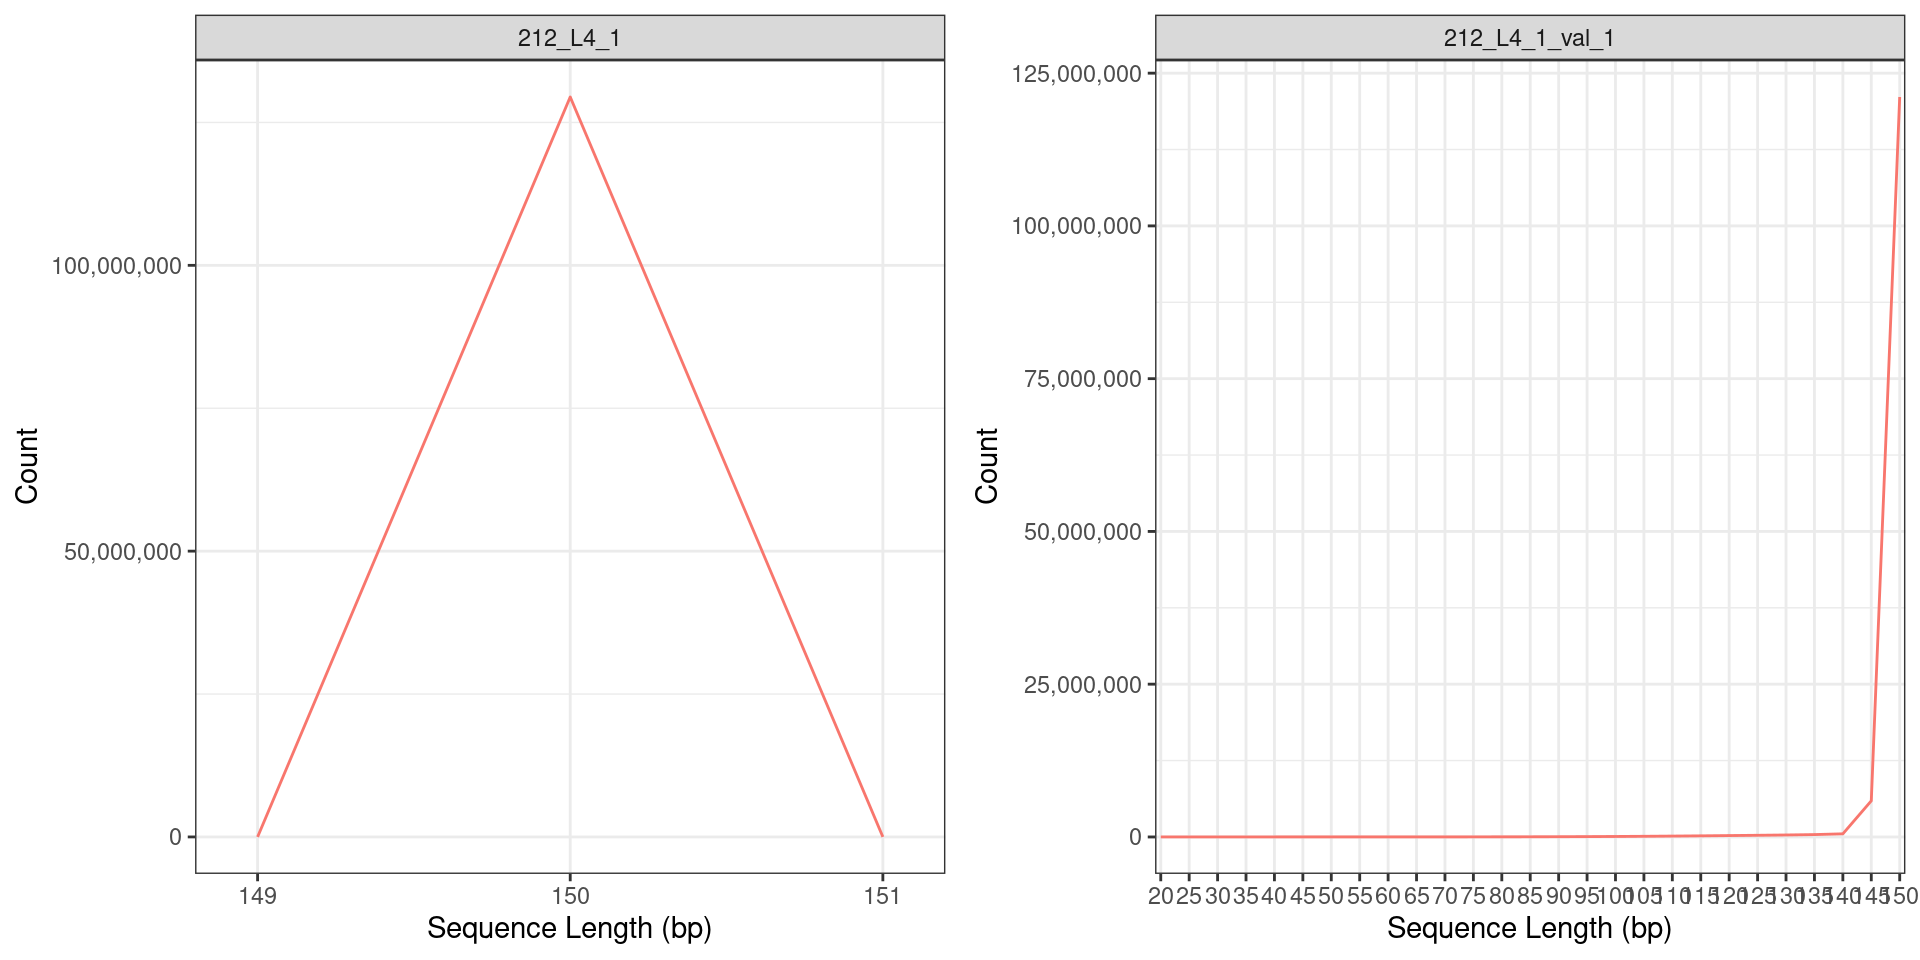
Sequence Length distribution of the RNA seq reads (a) before and (b) after quality trimming. Only reads with the base length of > 150bp were retained after quality trimming.
| Version | Author | Date |
|---|---|---|
| 5196f41 | unawaz1996 | 2023-04-21 |
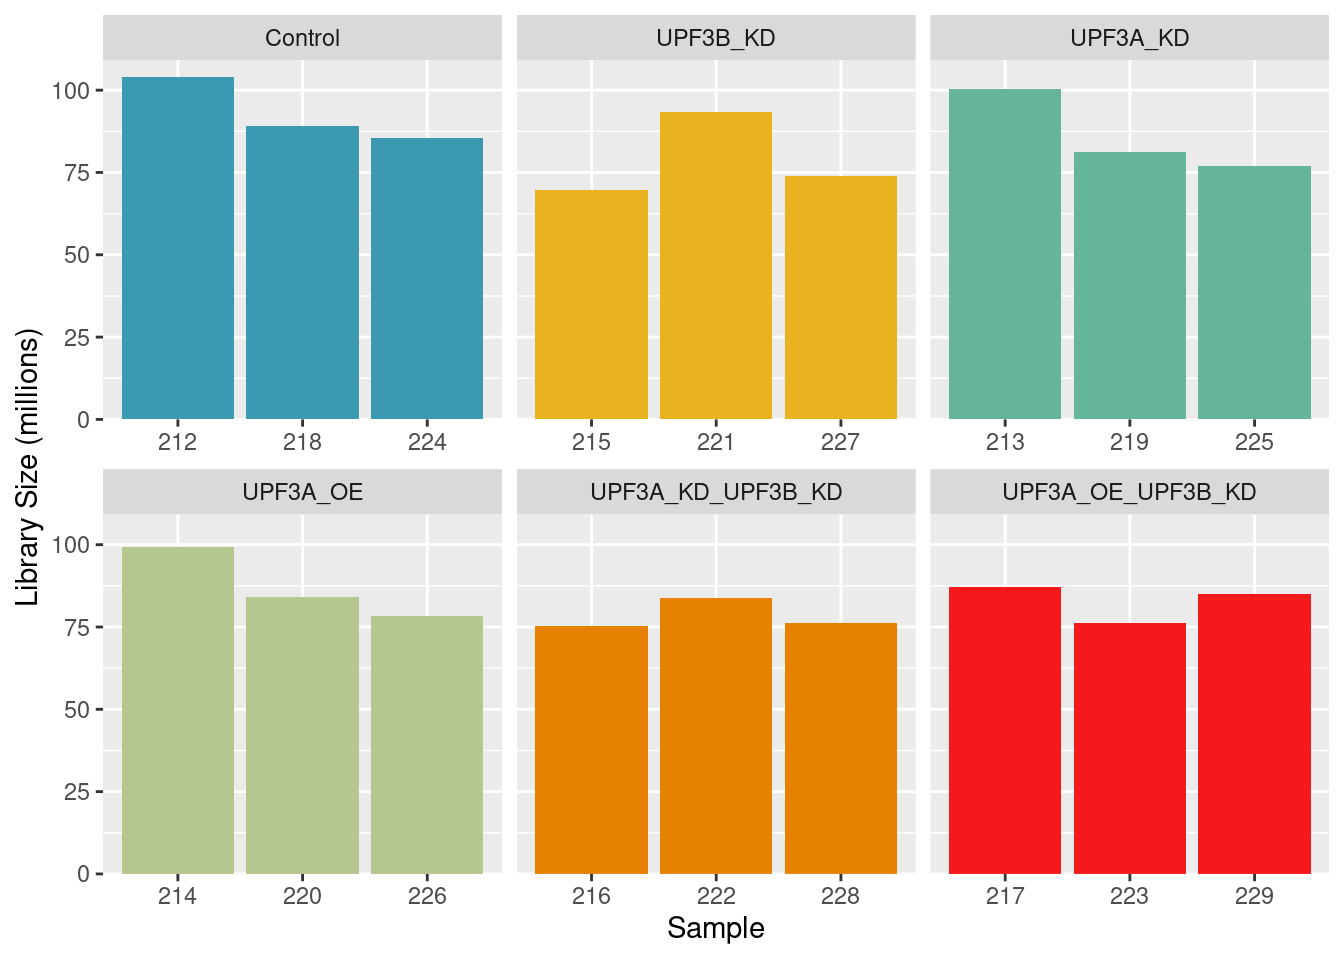
Library sizes
Library sizes for unprocessed data ranged between 86,178,215 and 129,449,694 reads.
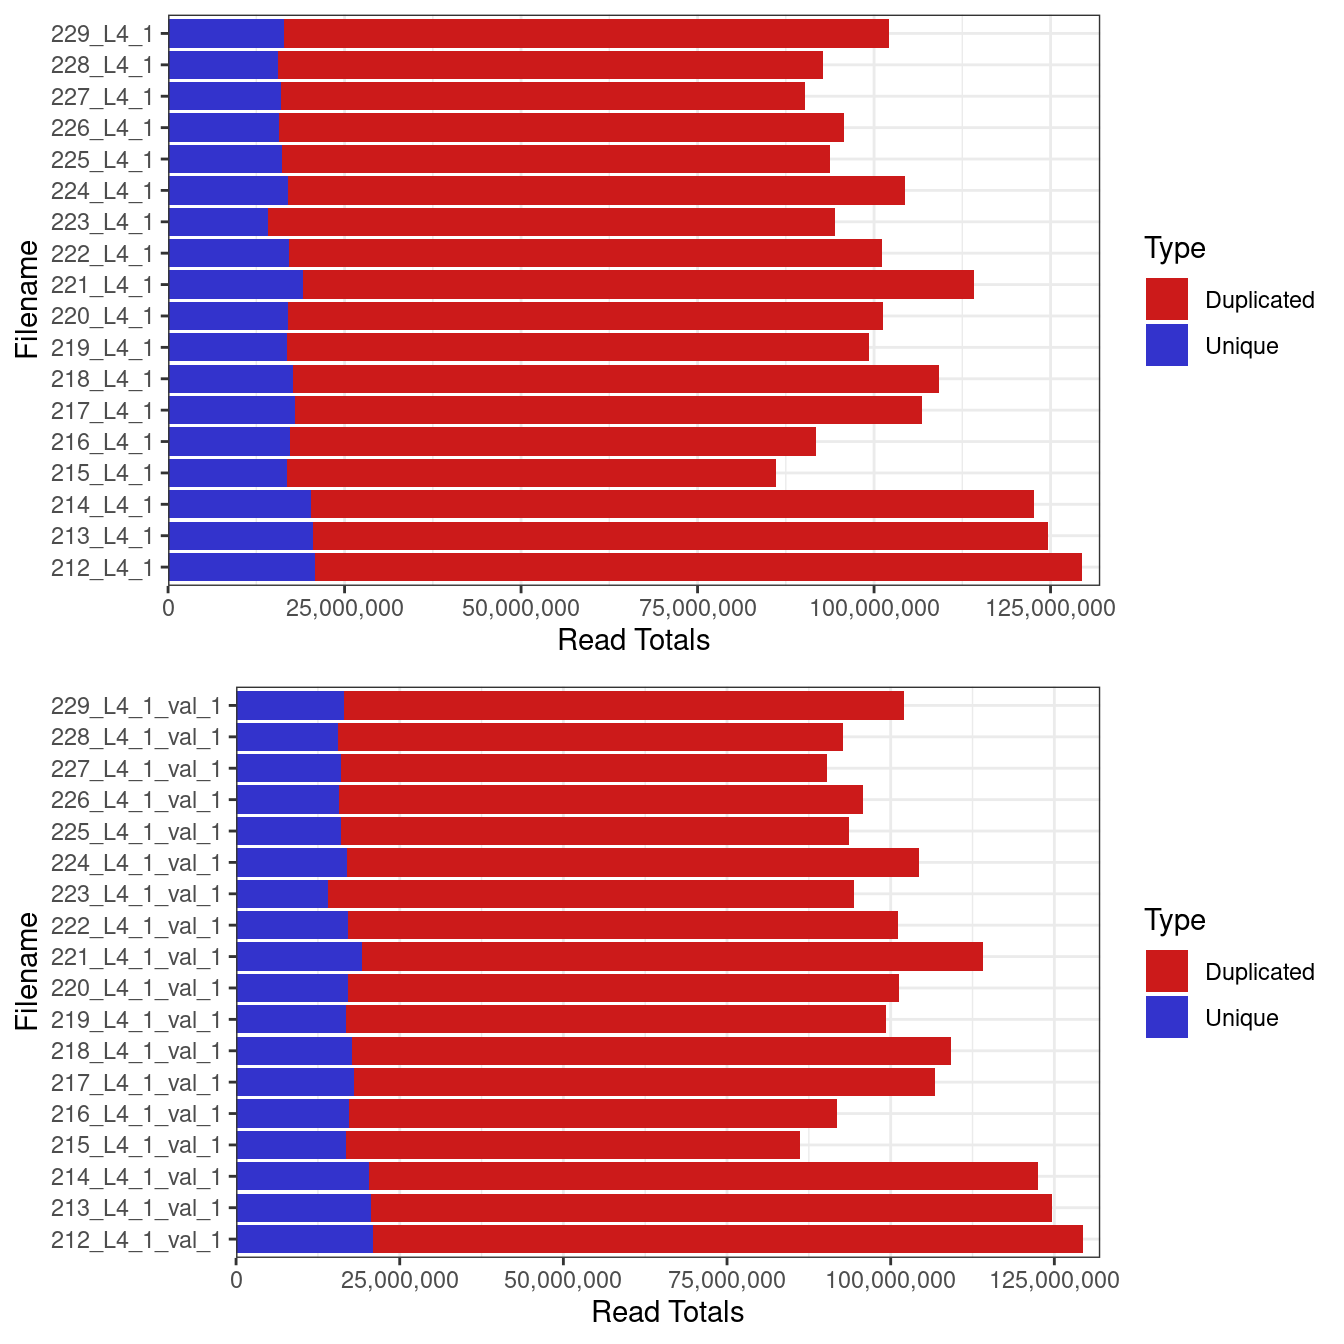
Total numner 0f reads from each sample (a) before and (b) after quality trimming with trimgalore.
| Version | Author | Date |
|---|---|---|
| 5196f41 | unawaz1996 | 2023-04-21 |
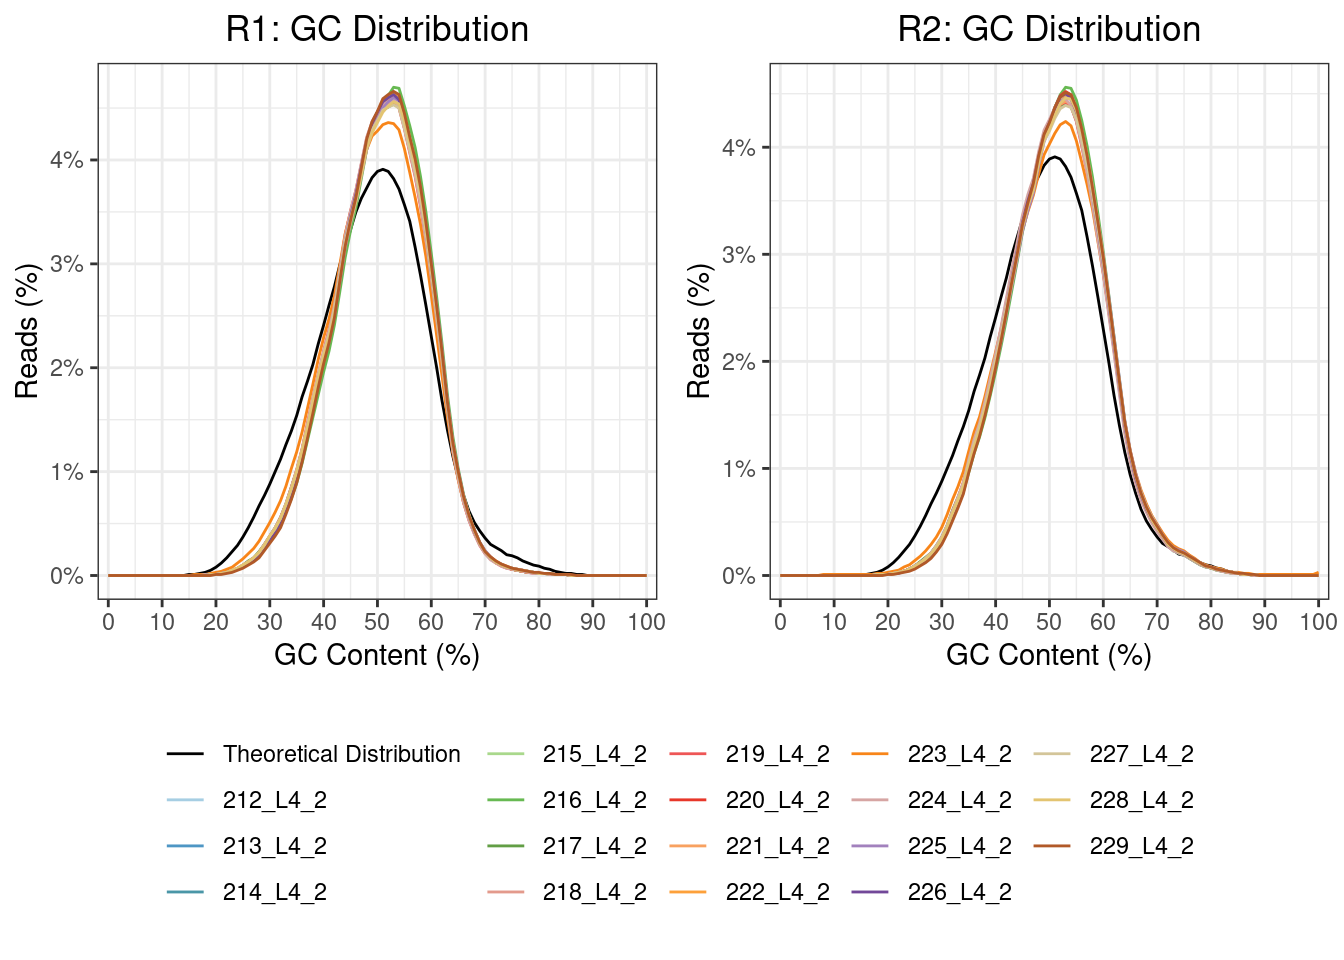
GC content
In poly(A) selected RNA-seq library preparation methods, the nonuniform coverage of transcripts is a prevalent issue. As poly(A) tail only occurs at the 3’ end of the mRNA, this can usually result in an over-representation of the 3’ end. Bias at the 5′ end of RNA can also happen because of various factors, such as the fragmentation method (the 5′ end of RNA is more stable), reverse transcription from RNA to cDNA and strand-oriented library construction protocol.
GC content allows the exploration of the sequencing coverage and can indicate issues in overrepresentation. It has been observed that either high or low GC content will result in lower depth coverage.
| Version | Author | Date |
|---|---|---|
| 5196f41 | unawaz1996 | 2023-04-21 |
Trimmed data
| names | Group | Condition_UPF3B | Condition_UPF3A | Label | Filename | Raw | Trimmed | Discarded | Retained |
|---|---|---|---|---|---|---|---|---|---|
| 212 | Control | Control | Control | S2_Vect_A | 212_L4_1.fq.gz | 129449694 | 129423518 | 0.0002022 | 0.9998 |
| 212 | Control | Control | Control | S2_Vect_A | 212_L4_2.fq.gz | 129449694 | 129423518 | 0.0002259 | 0.9998 |
| 213 | UPF3A_KD | Control | Knockdown | S2_shRNA_A | 213_L4_1.fq.gz | 124647120 | 124618959 | 0.0001968 | 0.9998 |
| 213 | UPF3A_KD | Control | Knockdown | S2_shRNA_A | 213_L4_2.fq.gz | 124647120 | 124618959 | 0.0001568 | 0.9998 |
| 214 | UPF3A_OE | Control | Overexpression | S2_cDNA_A | 214_L4_1.fq.gz | 122589413 | 122565286 | 0.0001785 | 0.9998 |
| 214 | UPF3A_OE | Control | Overexpression | S2_cDNA_A | 214_L4_2.fq.gz | 122589413 | 122565286 | 0.0002056 | 0.9998 |
| 215 | UPF3B_KD | Knockdown | Control | T2_Vect_A | 215_L4_1.fq.gz | 86178215 | 86164704 | 0.0002234 | 0.9998 |
| 215 | UPF3B_KD | Knockdown | Control | T2_Vect_A | 215_L4_2.fq.gz | 86178215 | 86164704 | 0.0002671 | 0.9997 |
| 216 | UPF3A_KD_UPF3B_KD | Knockdown | Knockdown | T2_shRNA_A | 216_L4_1.fq.gz | 91807145 | 91790756 | 0.0001893 | 0.9998 |
| 216 | UPF3A_KD_UPF3B_KD | Knockdown | Knockdown | T2_shRNA_A | 216_L4_2.fq.gz | 91807145 | 91790756 | 0.0001951 | 0.9998 |
| 217 | UPF3A_OE_UPF3B_KD | Knockdown | Overexpression | T2_cDNA_A | 217_L4_1.fq.gz | 106731239 | 106709299 | 0.0002528 | 0.9997 |
| 217 | UPF3A_OE_UPF3B_KD | Knockdown | Overexpression | T2_cDNA_A | 217_L4_2.fq.gz | 106731239 | 106709299 | 0.001988 | 0.998 |
| 218 | Control | Control | Control | S2_Vect_B | 218_L4_1.fq.gz | 109175104 | 109150719 | 0.0002647 | 0.9997 |
| 218 | Control | Control | Control | S2_Vect_B | 218_L4_2.fq.gz | 109175104 | 109150719 | 0.0002736 | 0.9997 |
| 219 | UPF3A_KD | Control | Knockdown | S2_shRNA_B | 219_L4_1.fq.gz | 99242640 | 99216132 | 0.0001691 | 0.9998 |
| 219 | UPF3A_KD | Control | Knockdown | S2_shRNA_B | 219_L4_2.fq.gz | 99242640 | 99216132 | 0.000183 | 0.9998 |
| 220 | UPF3A_OE | Control | Overexpression | S2_cDNA_B | 220_L4_1.fq.gz | 101245190 | 101226023 | 0.000212 | 0.9998 |
| 220 | UPF3A_OE | Control | Overexpression | S2_cDNA_B | 220_L4_2.fq.gz | 101245190 | 101226023 | 0.0001361 | 0.9999 |
| 221 | UPF3B_KD | Knockdown | Control | T2_Vect_B | 221_L4_1.fq.gz | 114129302 | 114107031 | 0.0002022 | 0.9998 |
| 221 | UPF3B_KD | Knockdown | Control | T2_Vect_B | 221_L4_2.fq.gz | 114129302 | 114107031 | 0.0002259 | 0.9998 |
| 222 | UPF3A_KD_UPF3B_KD | Knockdown | Knockdown | T2_shRNA_B | 222_L4_1.fq.gz | 101073551 | 1.01e+08 | 0.0001968 | 0.9998 |
| 222 | UPF3A_KD_UPF3B_KD | Knockdown | Knockdown | T2_shRNA_B | 222_L4_2.fq.gz | 101073551 | 1.01e+08 | 0.0001568 | 0.9998 |
| 223 | UPF3A_OE_UPF3B_KD | Knockdown | Overexpression | T2_cDNA_B | 223_L4_1.fq.gz | 94512220 | 94324353 | 0.0001785 | 0.9998 |
| 223 | UPF3A_OE_UPF3B_KD | Knockdown | Overexpression | T2_cDNA_B | 223_L4_2.fq.gz | 94512220 | 94324353 | 0.0002056 | 0.9998 |
| 224 | Control | Control | Control | S2_Vect_C | 224_L4_1.fq.gz | 104412970 | 104385336 | 0.0002234 | 0.9998 |
| 224 | Control | Control | Control | S2_Vect_C | 224_L4_2.fq.gz | 104412970 | 104385336 | 0.0002671 | 0.9997 |
| 225 | UPF3A_KD | Control | Knockdown | S2_shRNA_C | 225_L4_1.fq.gz | 93692109 | 93666471 | 0.0001893 | 0.9998 |
| 225 | UPF3A_KD | Control | Knockdown | S2_shRNA_C | 225_L4_2.fq.gz | 93692109 | 93666471 | 0.0001951 | 0.9998 |
| 226 | UPF3A_OE | Control | Overexpression | S2_cDNA_C | 226_L4_1.fq.gz | 95761339 | 95745148 | 0.0002528 | 0.9997 |
| 226 | UPF3A_OE | Control | Overexpression | S2_cDNA_C | 226_L4_2.fq.gz | 95761339 | 95745148 | 0.001988 | 0.998 |
| 227 | UPF3B_KD | Knockdown | Control | T2_Vect_C | 227_L4_1.fq.gz | 90236088 | 90219573 | 0.0002647 | 0.9997 |
| 227 | UPF3B_KD | Knockdown | Control | T2_Vect_C | 227_L4_2.fq.gz | 90236088 | 90219573 | 0.0002736 | 0.9997 |
| 228 | UPF3A_KD_UPF3B_KD | Knockdown | Knockdown | T2_shRNA_C | 228_L4_1.fq.gz | 92761079 | 92741417 | 0.0001691 | 0.9998 |
| 228 | UPF3A_KD_UPF3B_KD | Knockdown | Knockdown | T2_shRNA_C | 228_L4_2.fq.gz | 92761079 | 92741417 | 0.000183 | 0.9998 |
| 229 | UPF3A_OE_UPF3B_KD | Knockdown | Overexpression | T2_cDNA_C | 229_L4_1.fq.gz | 102071888 | 102057991 | 0.000212 | 0.9998 |
| 229 | UPF3A_OE_UPF3B_KD | Knockdown | Overexpression | T2_cDNA_C | 229_L4_2.fq.gz | 102071888 | 102057991 | 0.0001361 | 0.9999 |
After adapter trimming, < 1% of reads were discarded.
Aligned data - Salmon quantifications
Counts were generated using Salmon. Briefly, an index was generated
using the GRCm39 build of the mouse transcript with decoys.txt.
Selective alignment mode was used. The reads were also aligned to the
human genome to check for genotyping and to ensure no mislabeling
occurred during any part of the bench work. Counts were imported as
transcript-level and gene-level using tximport and
tximeta respectively.
Annotation data was loaded as an EnsDb object, using
Ensembl resealse 107. Transcript level gene lengths and GC content was
converted to gene level values using:
- GC Content: The total GC content divided by the total length of transcripts
- Gene Length: The mean transcript length
Genotype checking
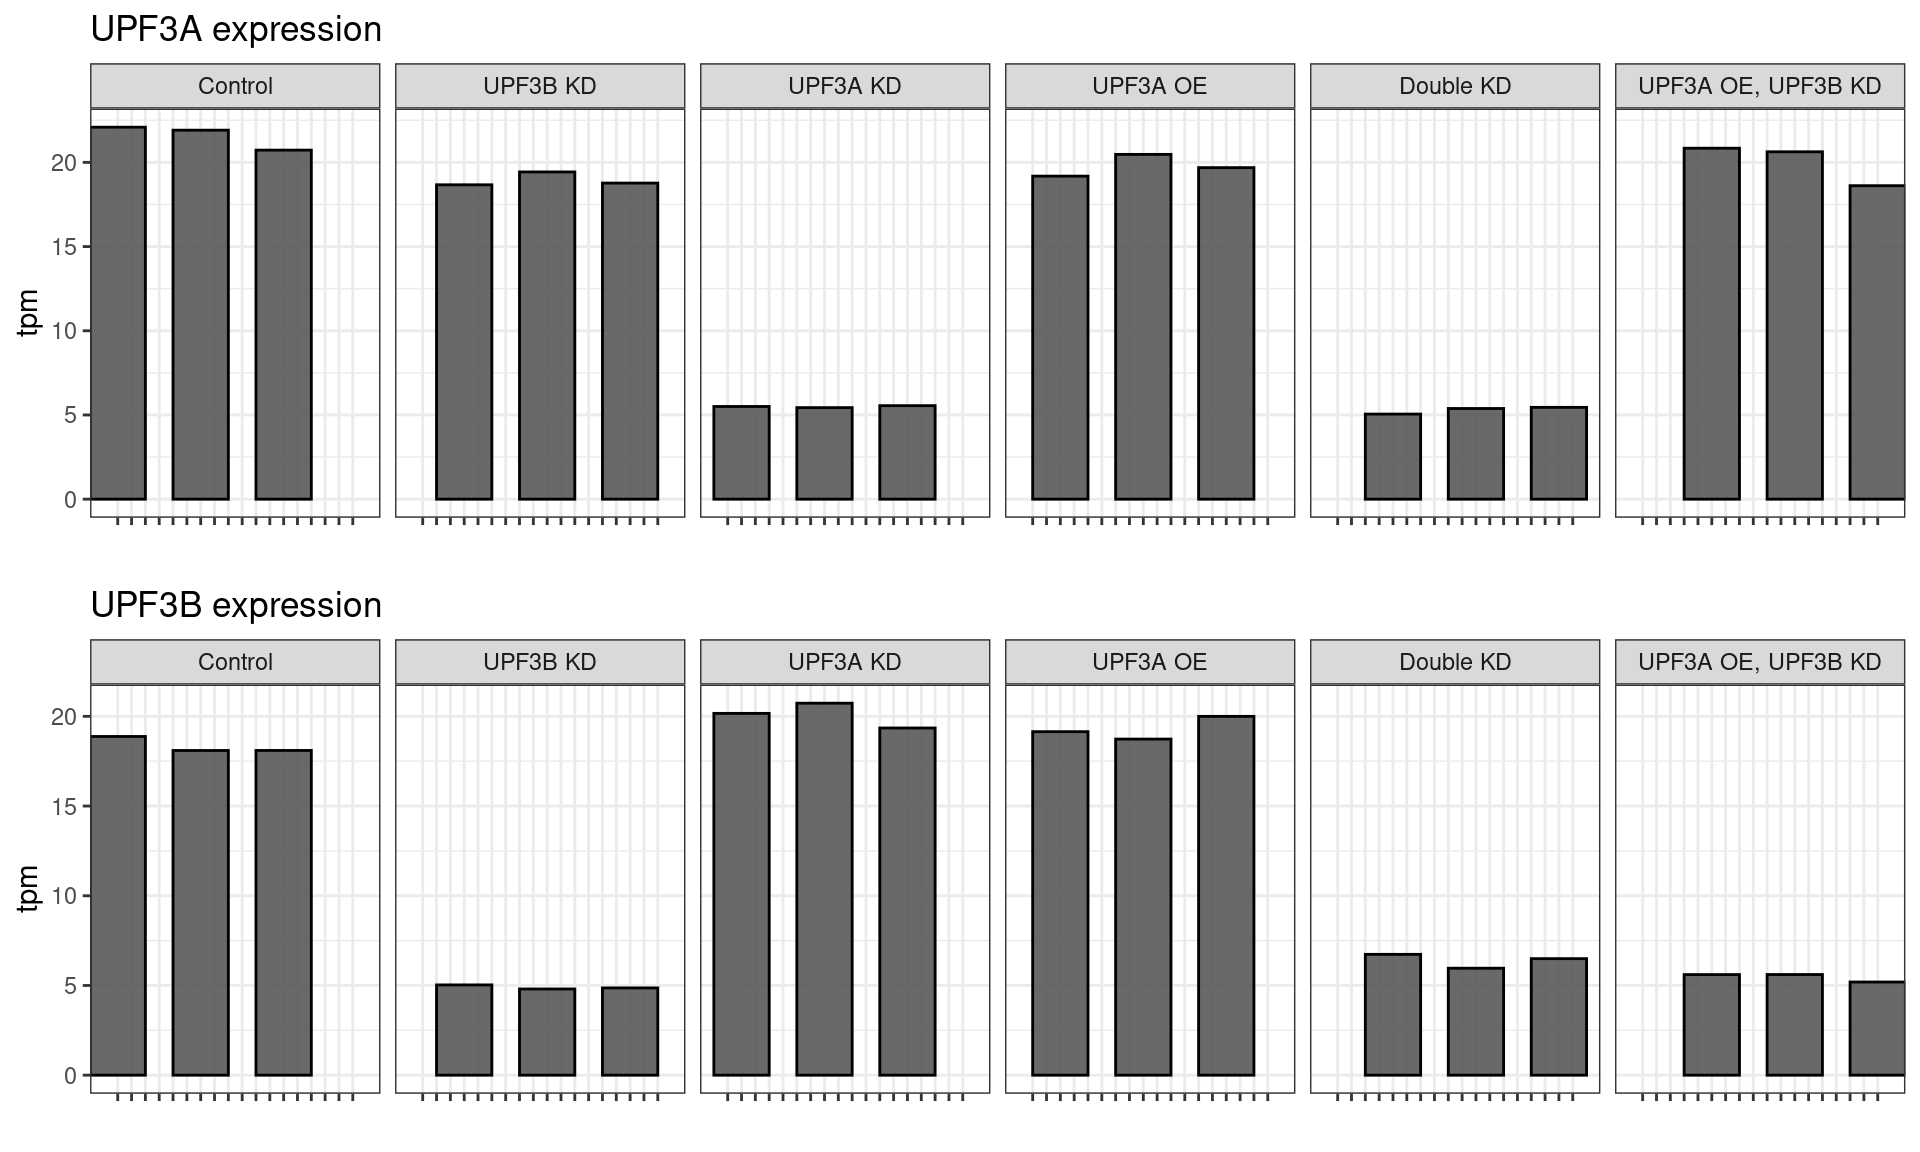
All samples demonstrated the expected expression patterns, no mislabeling was detected in the dataset.
| Version | Author | Date |
|---|---|---|
| 5196f41 | unawaz1996 | 2023-04-21 |
Transcript level exploration of data
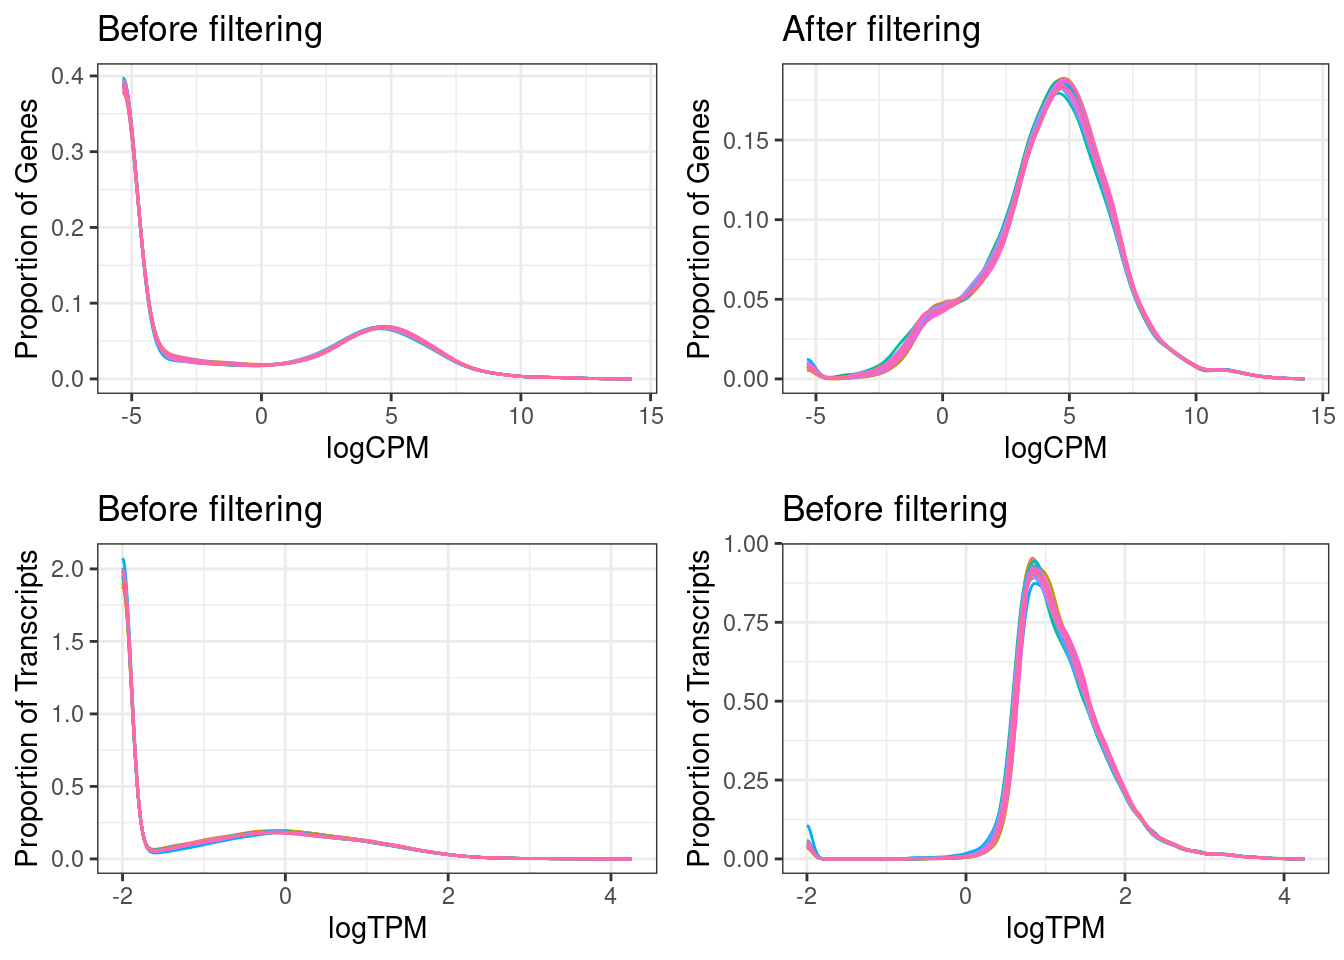
# A tibble: 2 × 3
  Filter `median(rowMeans)` `sd(rowMeans)`
  <fct>               <dbl>          <dbl>
1 before             0.0370           115.
2 after             13.3              298.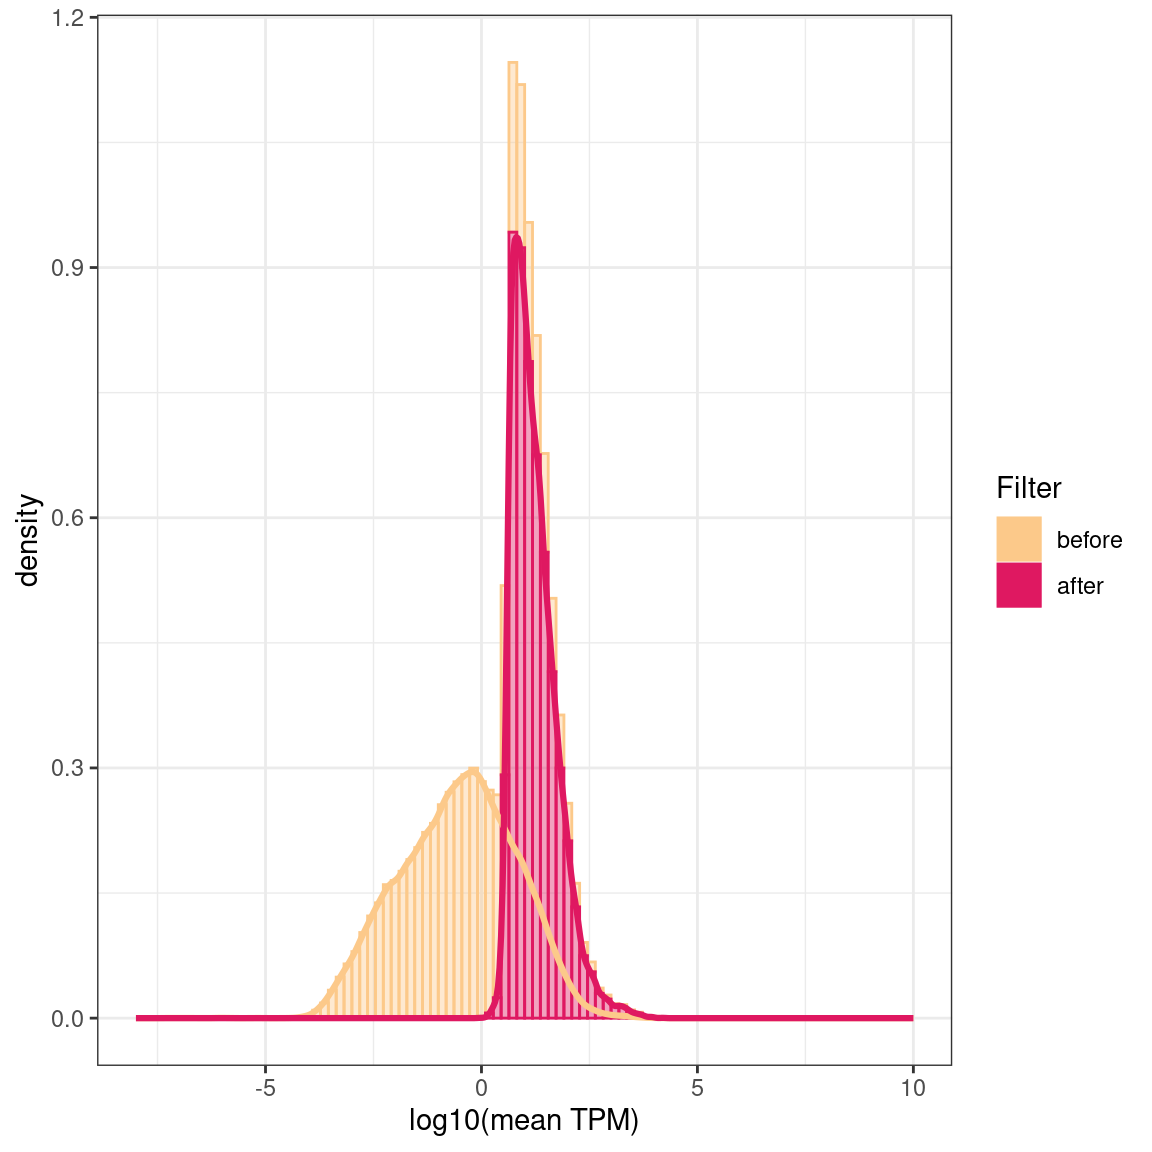
Log10 of the mean TPMs (transcript per million) over all samples before and after filtering out low-expressed transcripts and genes
| Version | Author | Date |
|---|---|---|
| 5196f41 | unawaz1996 | 2023-04-21 |
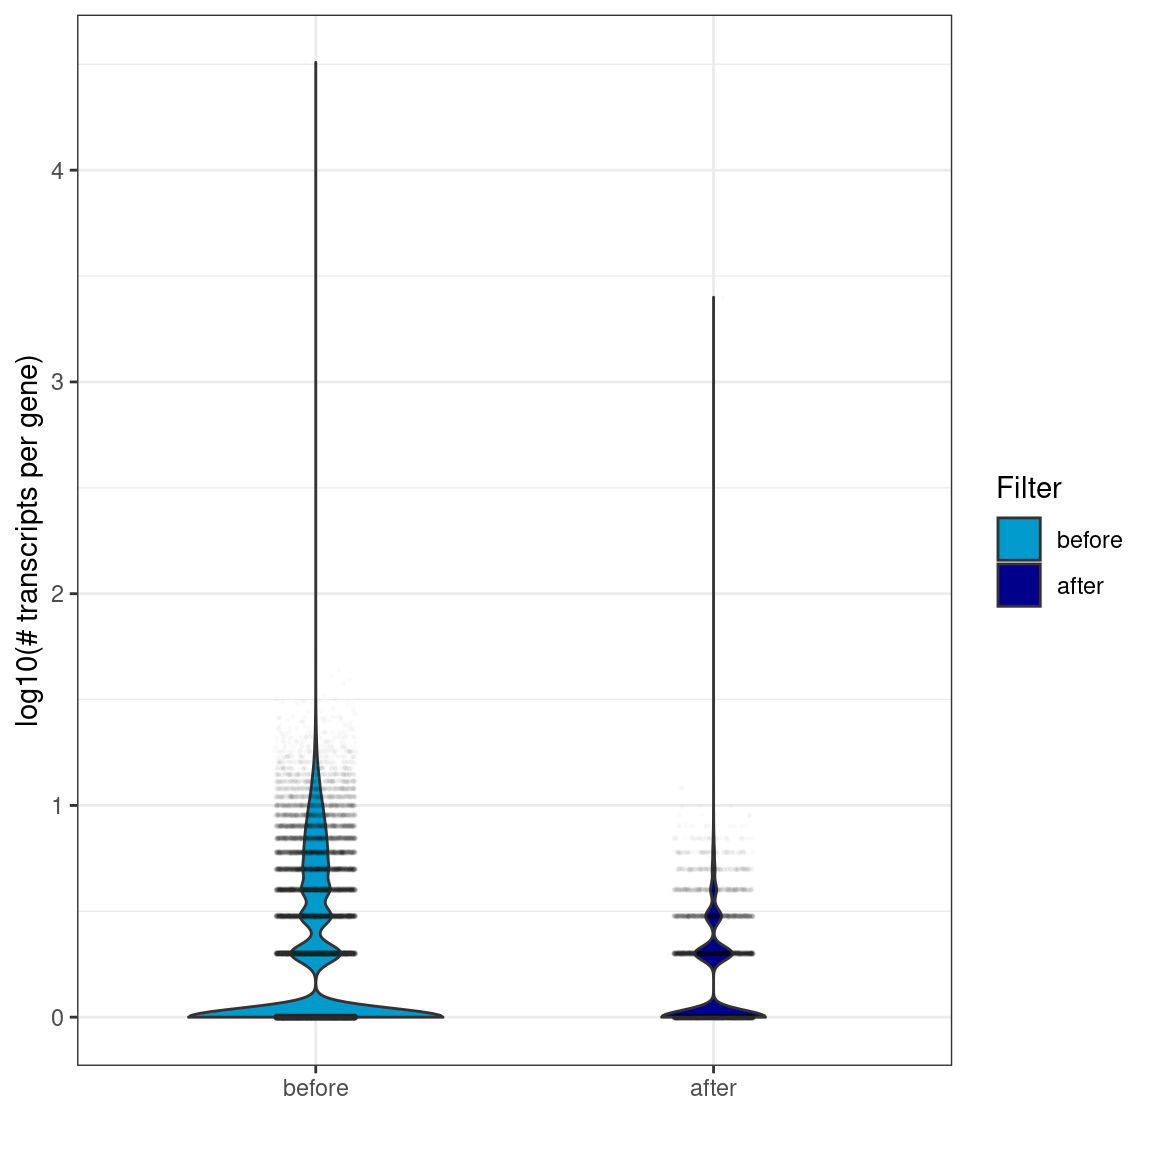
Violin plots showing the distribution of the number of transcripts per gene (in logarithmic scale). Violin width is scaled by the total number of observations while jittered points represent actual observations.
| Version | Author | Date |
|---|---|---|
| 5196f41 | unawaz1996 | 2023-04-21 |
PCA
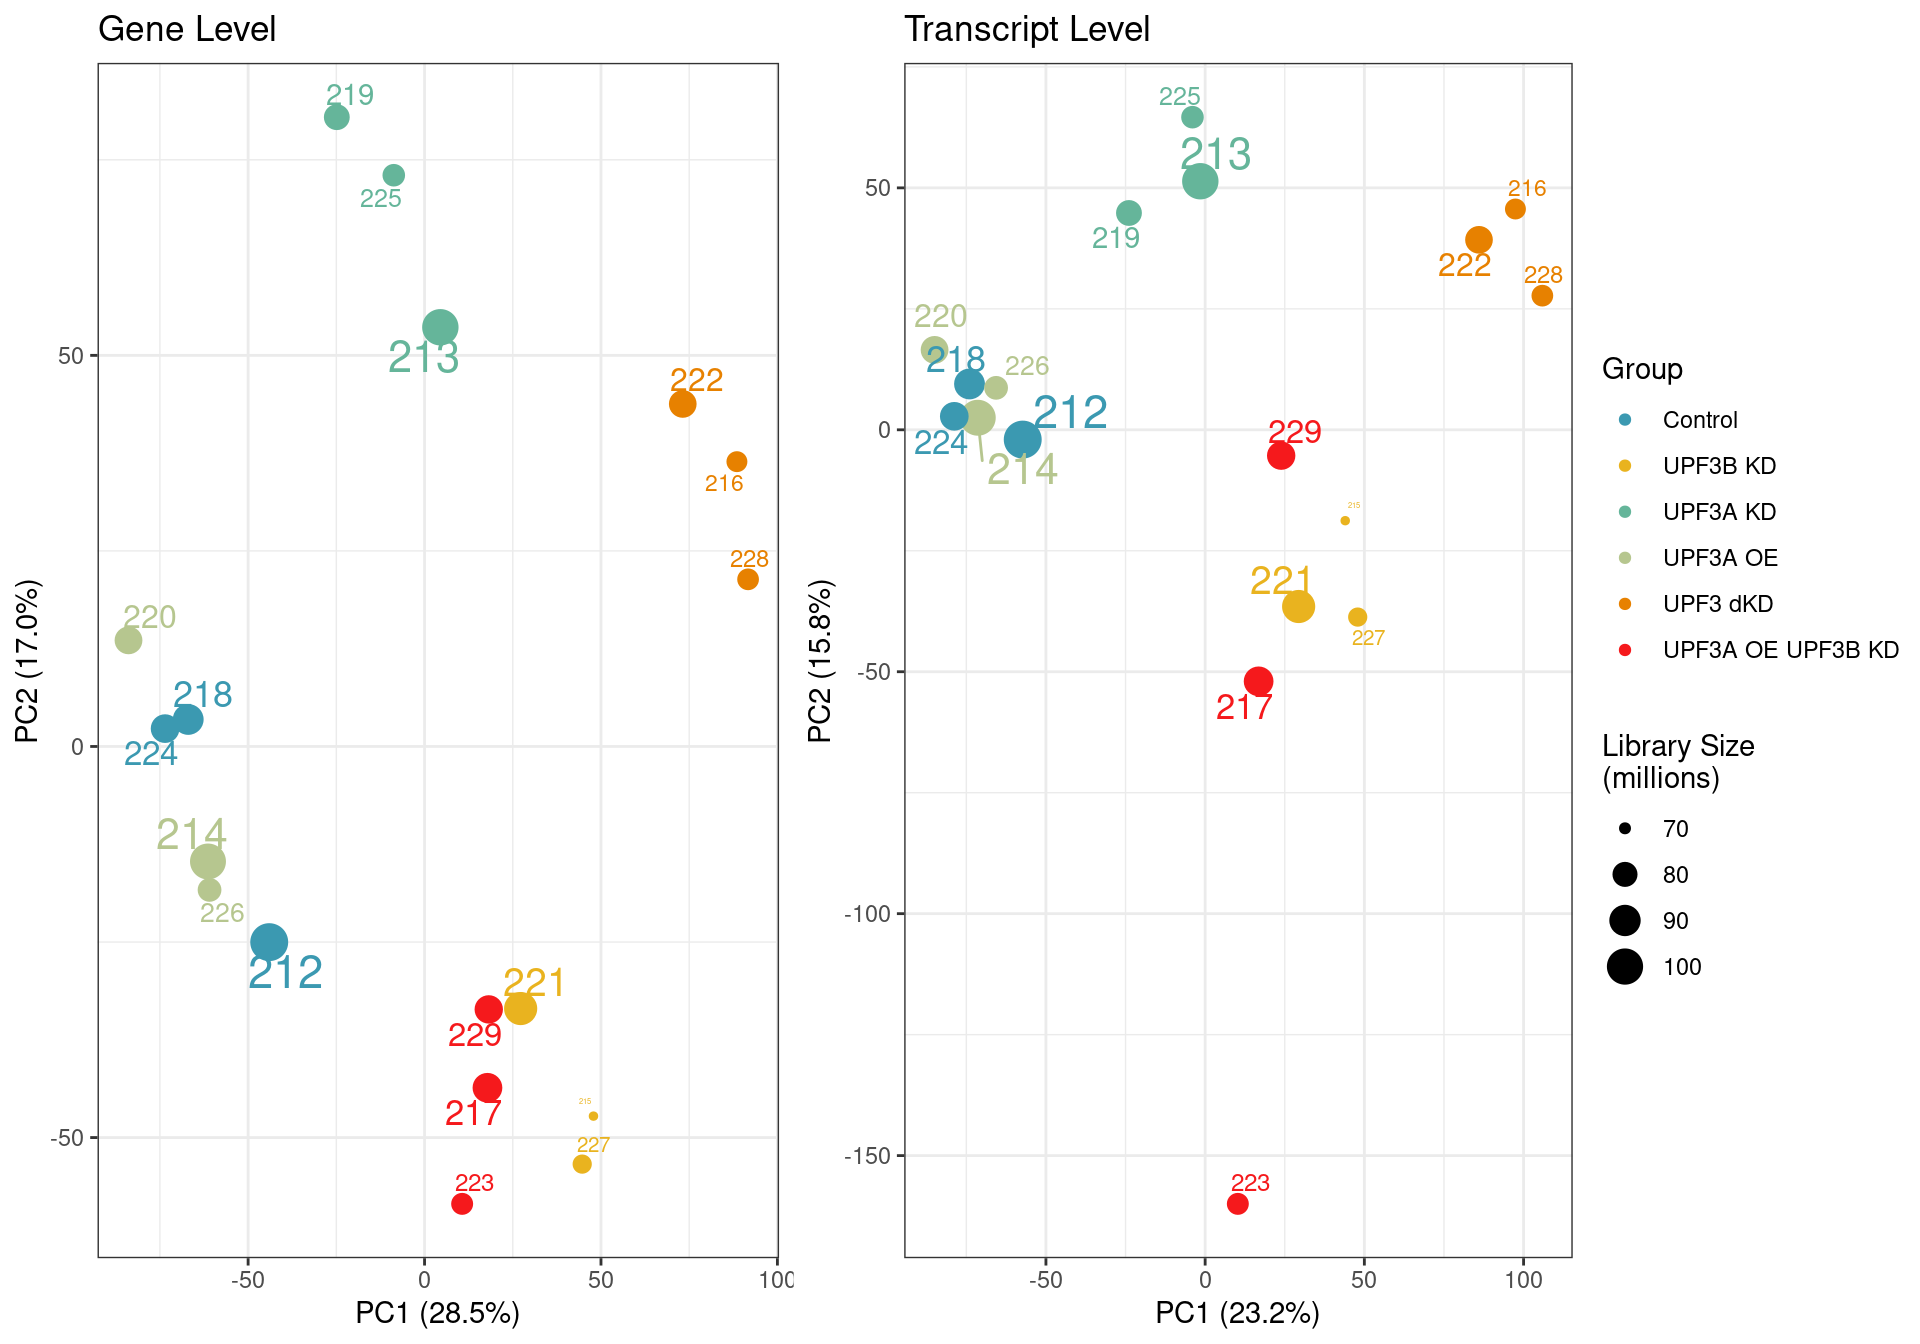
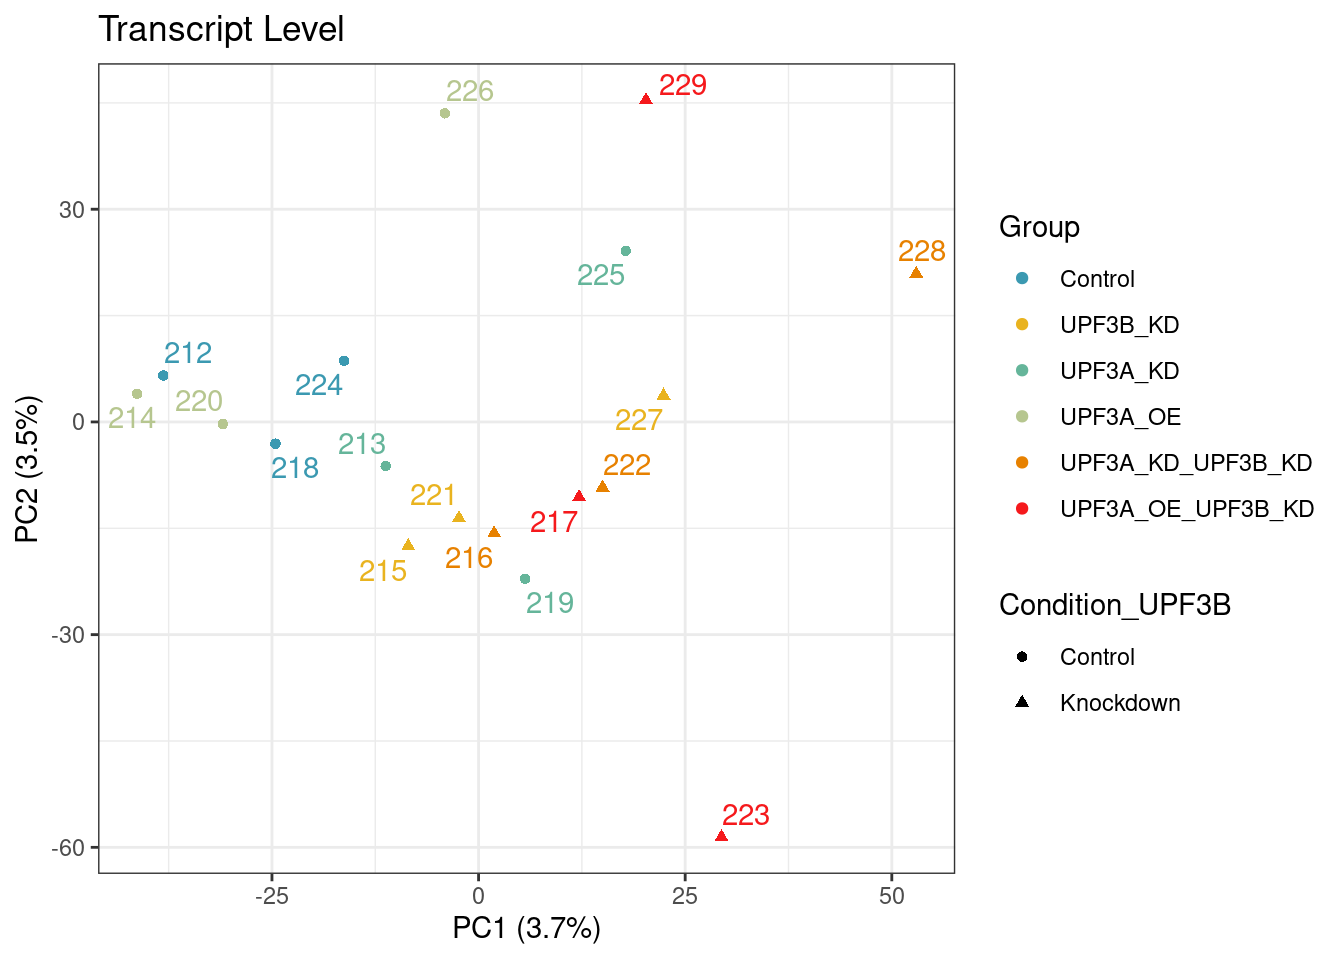
Principal component analysis of gene (left) and transcript (right) level data. PCA was performed on log2 transformed TPMs after filtering for each respective datatype (gene and transcript level). Gene level PCA shows that all samples are clustering closely based on condition, with no impact of library size in PC1 and PC2. Transcript level PCA shows that samples are clustering close to their conditions based on PC1, however one of the samples of the UPF3A OE in UPF3B KD cell line (sample 223), seems to deviate from its condition group and the rest of the data, so needs to be further investigated
To check if the same variation is observed at PC3 in gene level:
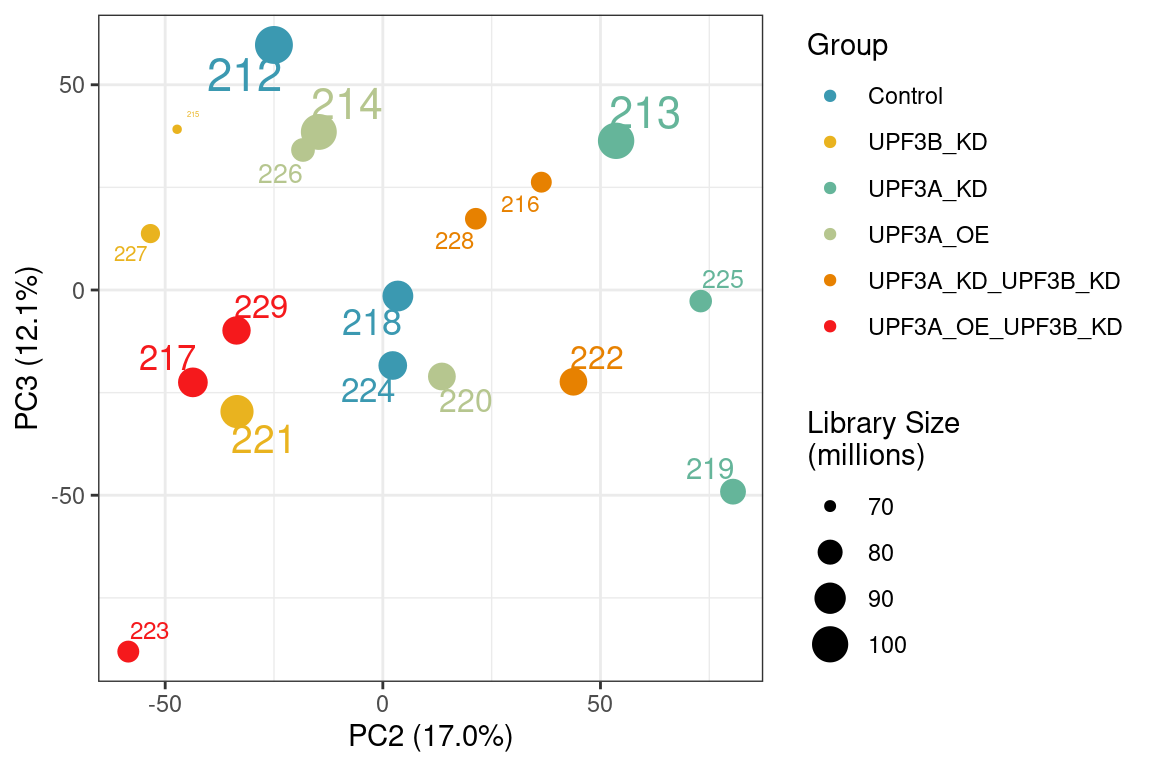
Principal component analysis of gene level data showing PC2 and PC3. Sample 223 seems to cluster away from its condition group in PC3
| Version | Author | Date |
|---|---|---|
| 5196f41 | unawaz1996 | 2023-04-21 |
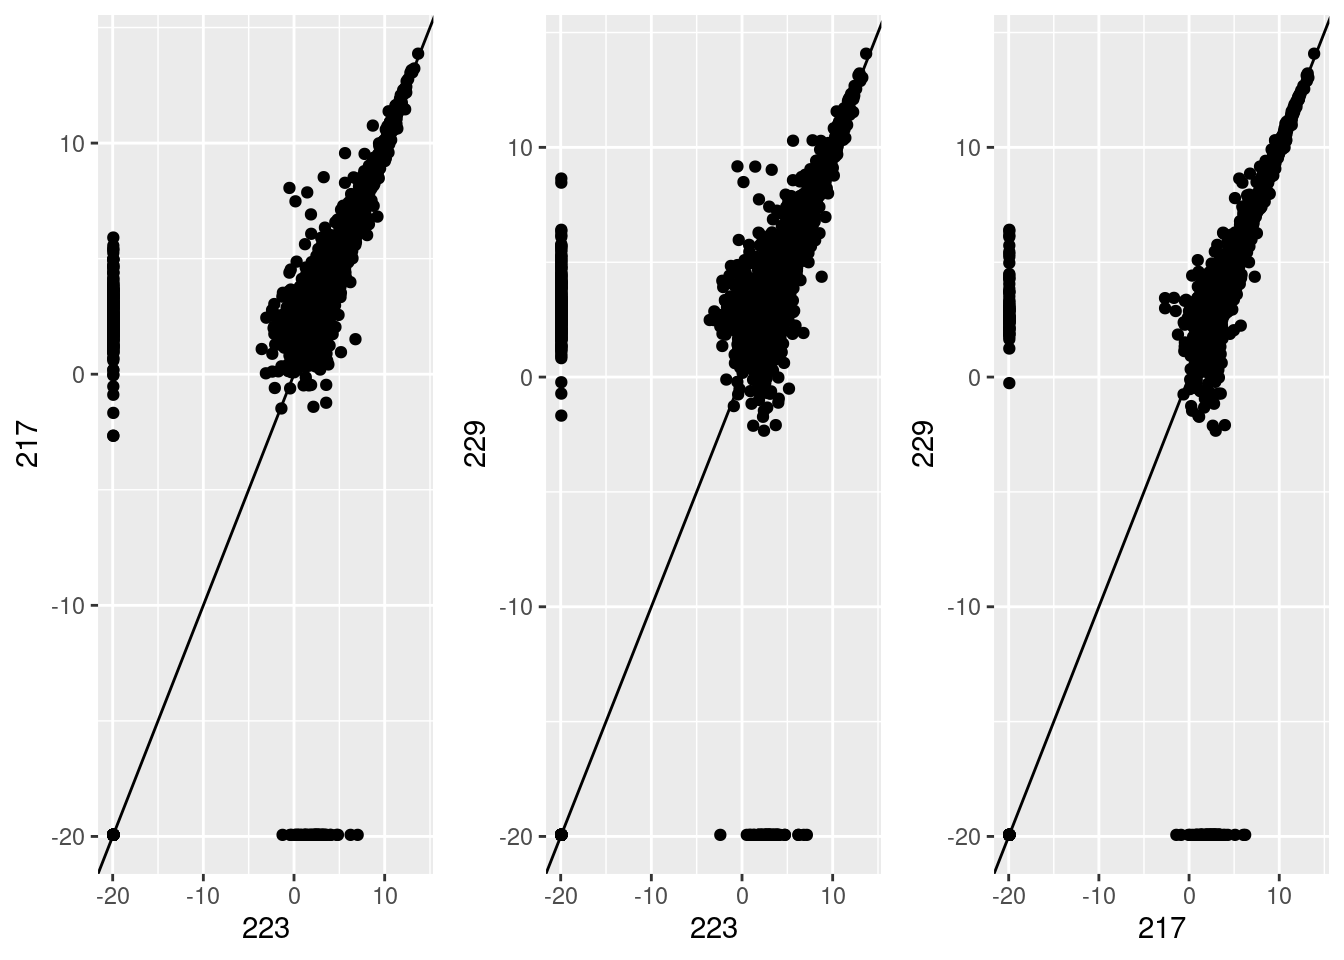
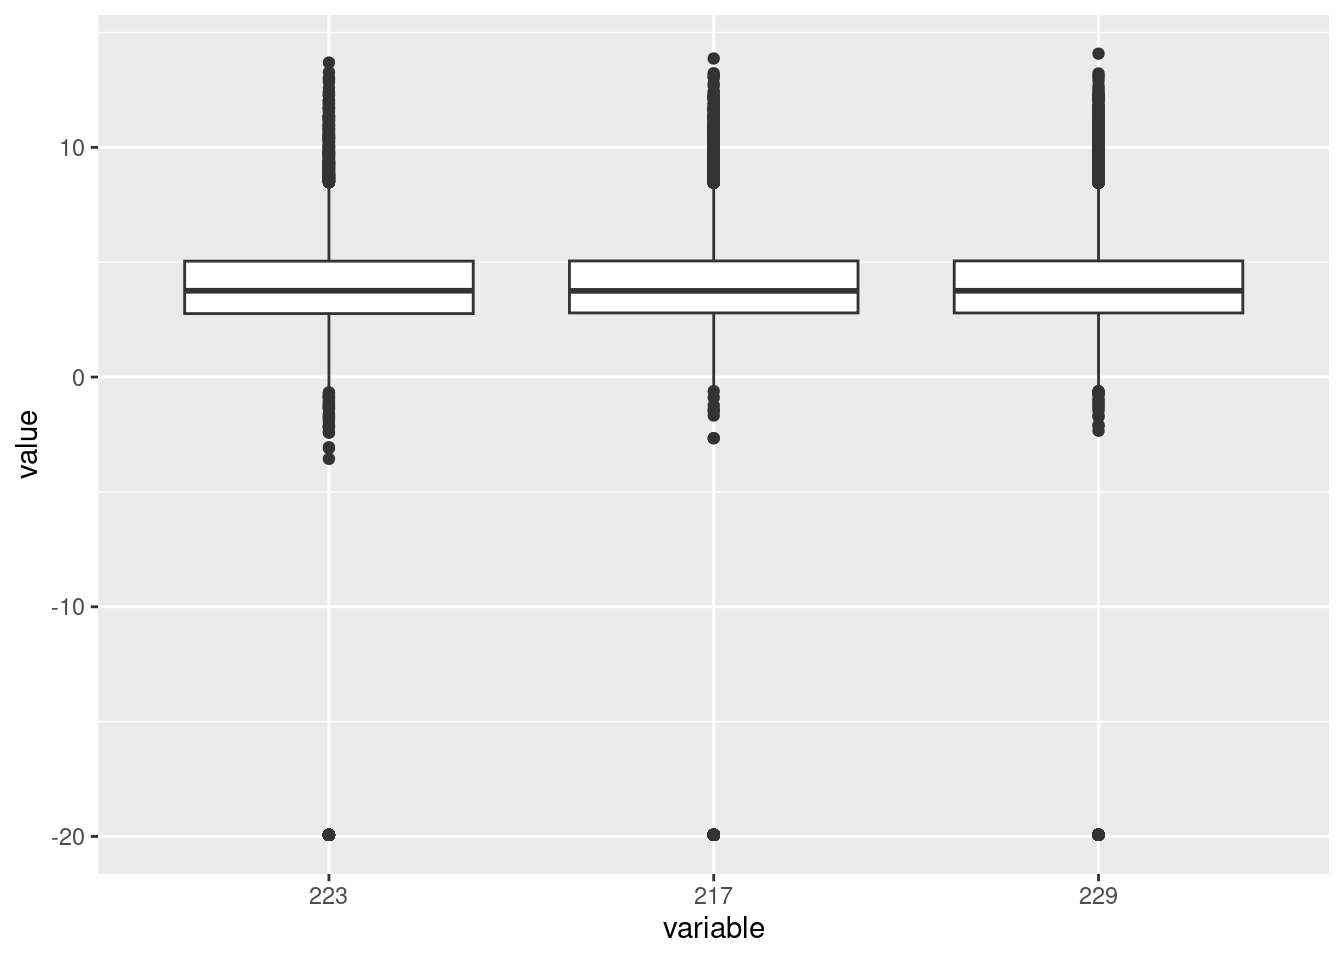
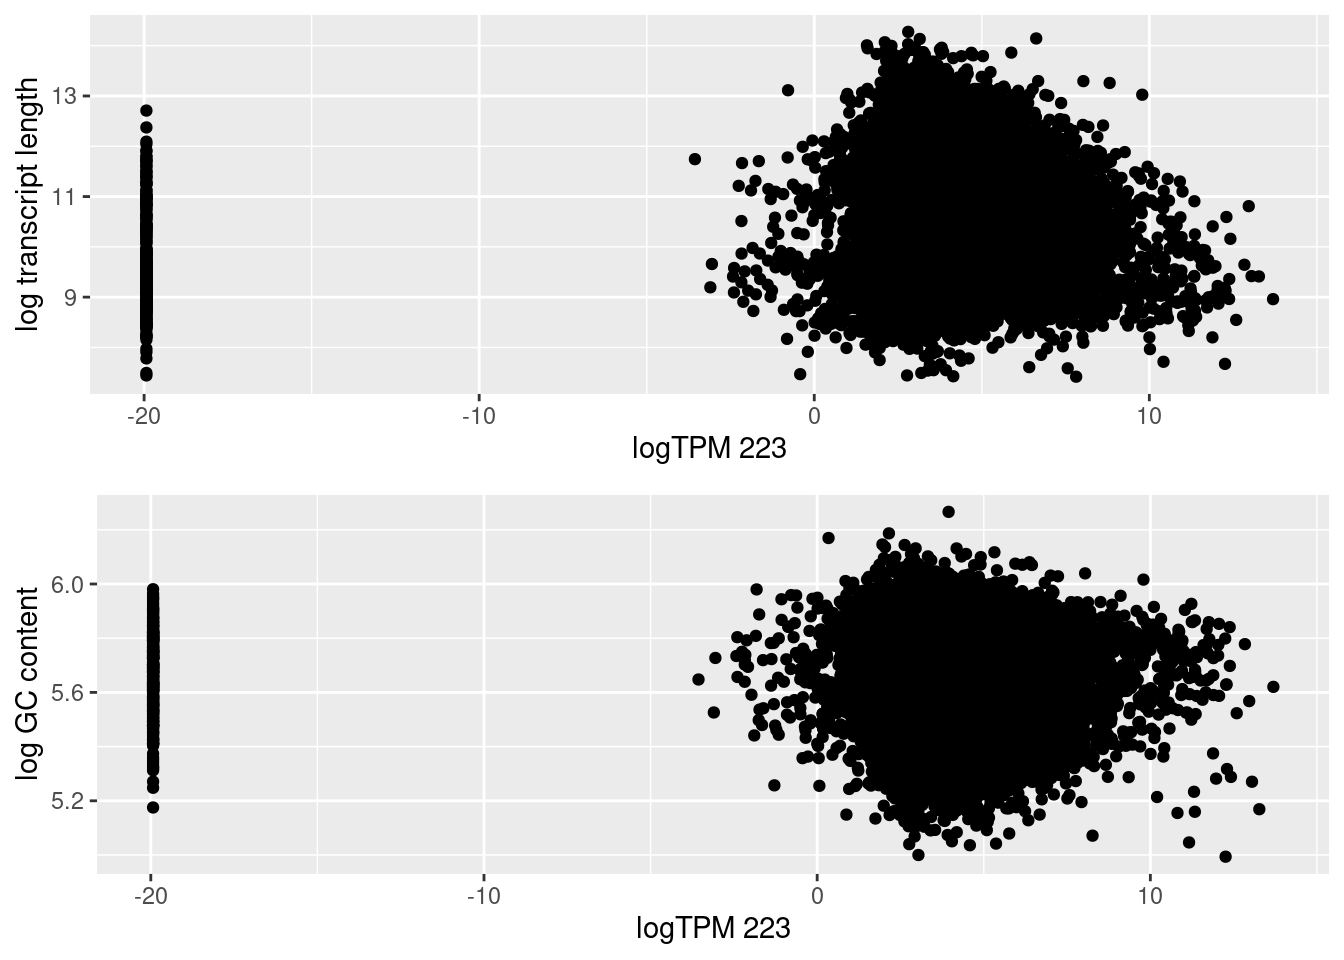
Investigating the differences in samples at transcript level
| Version | Author | Date |
|---|---|---|
| 5196f41 | unawaz1996 | 2023-04-21 |
| Version | Author | Date |
|---|---|---|
| 5196f41 | unawaz1996 | 2023-04-21 |
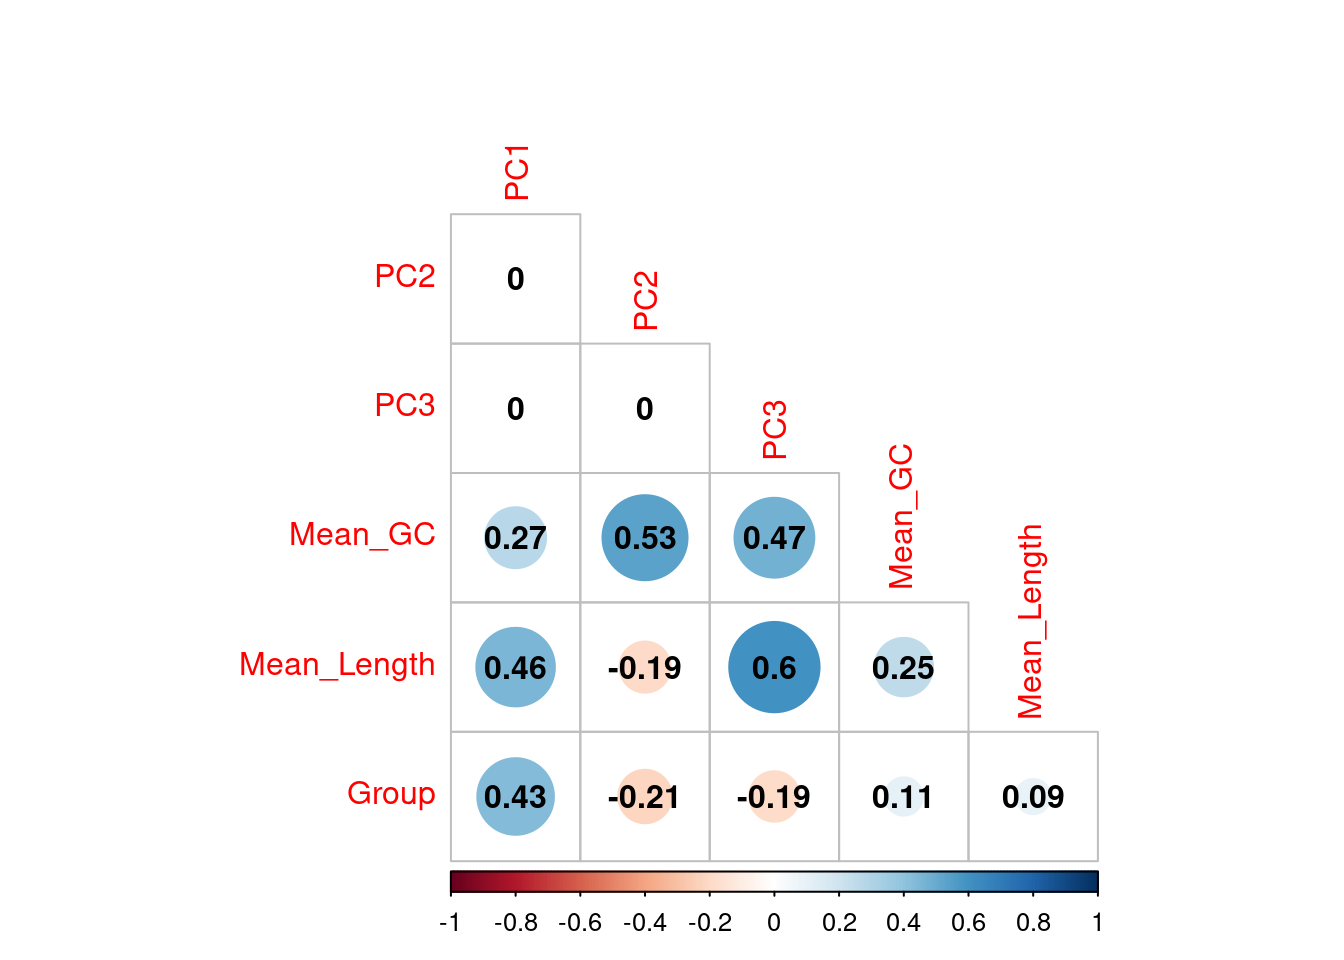
Correlations between the first three principal components and measured variables at transcript level. Sample conditions were converted to an ordered categorical variable for the purposes of visualisation
| Version | Author | Date |
|---|---|---|
| 5196f41 | unawaz1996 | 2023-04-21 |
Transcripts were divided in 10 approximately equal sized bins based on increasing length, and 10 approximately equal sized bins based on increasing GC content, with the final GC/Length bins being the combination 100 bins using both sets. The contribution of each gene to PC1 and PC2 was assessed and a t-test performed on each bin.
If any bin makes a contribution to PC1 the mean will be clearly non-zero, whilst if there is no contribution the mean will be near zero. In this way, the impact of gene length and GC content on variance within the dataset can be assessed.
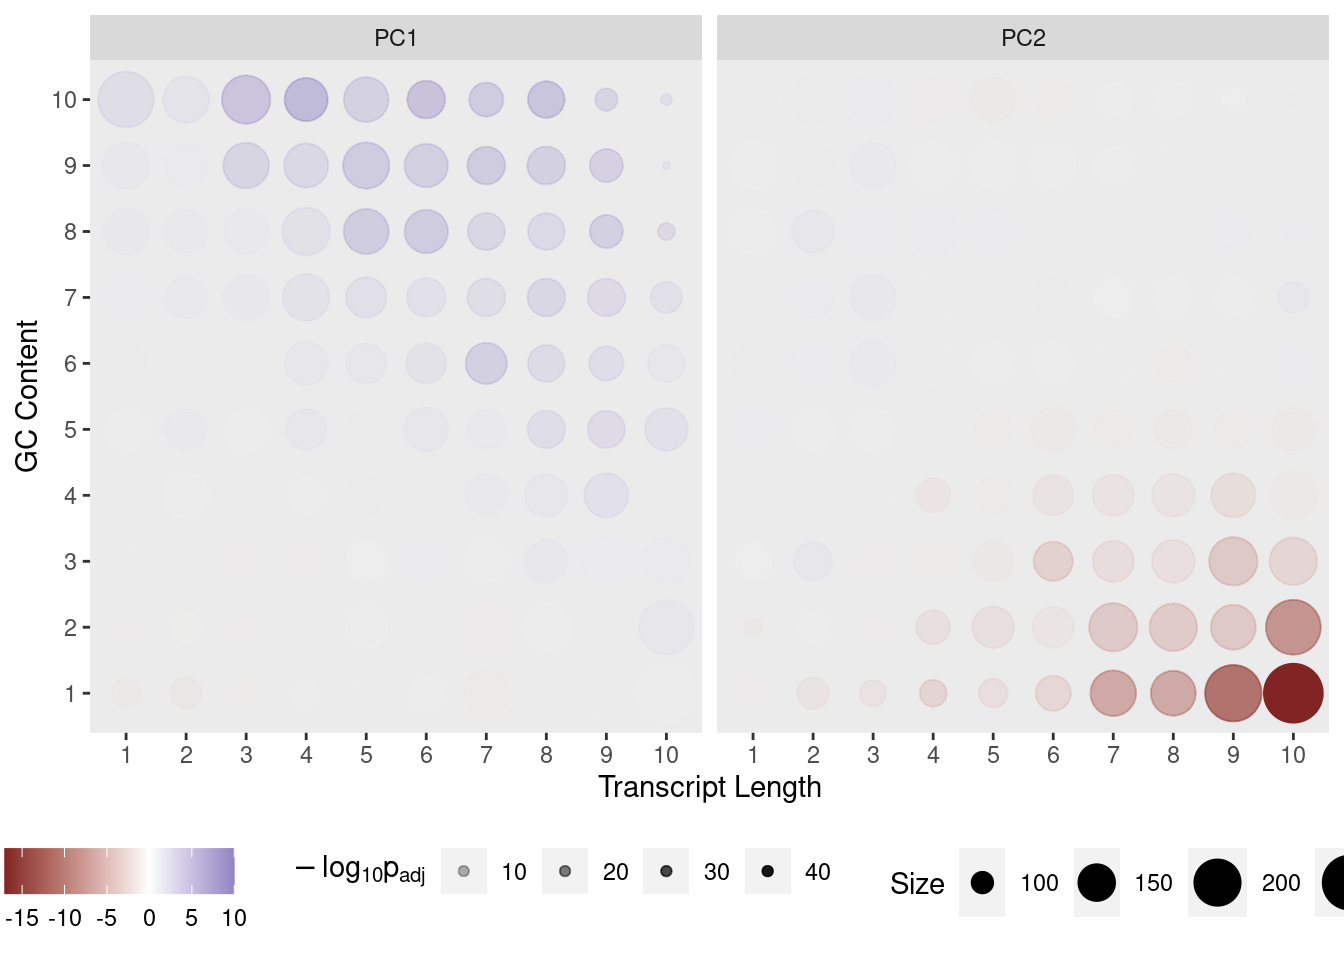
Contribution of each GC/Length Bin to PC1 and PC2. Fill colours indicate the t-statistic, with tranparency denoting significance as -log10(p), using Bonferroni-adjusted p-values.
| Version | Author | Date |
|---|---|---|
| 5196f41 | unawaz1996 | 2023-04-21 |
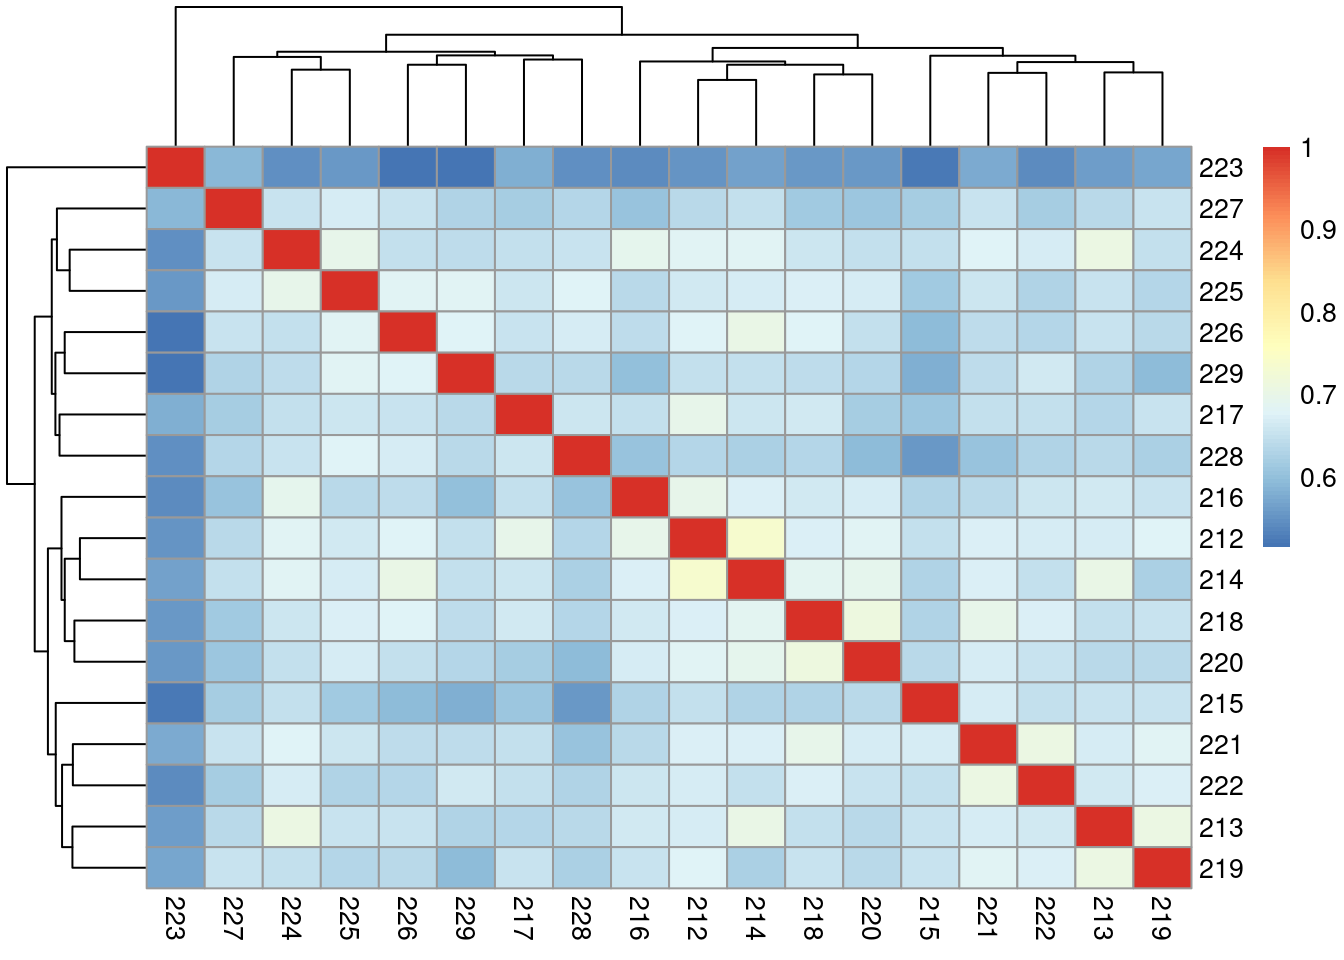
Correlation of samples
| Version | Author | Date |
|---|---|---|
| 5196f41 | unawaz1996 | 2023-04-21 |
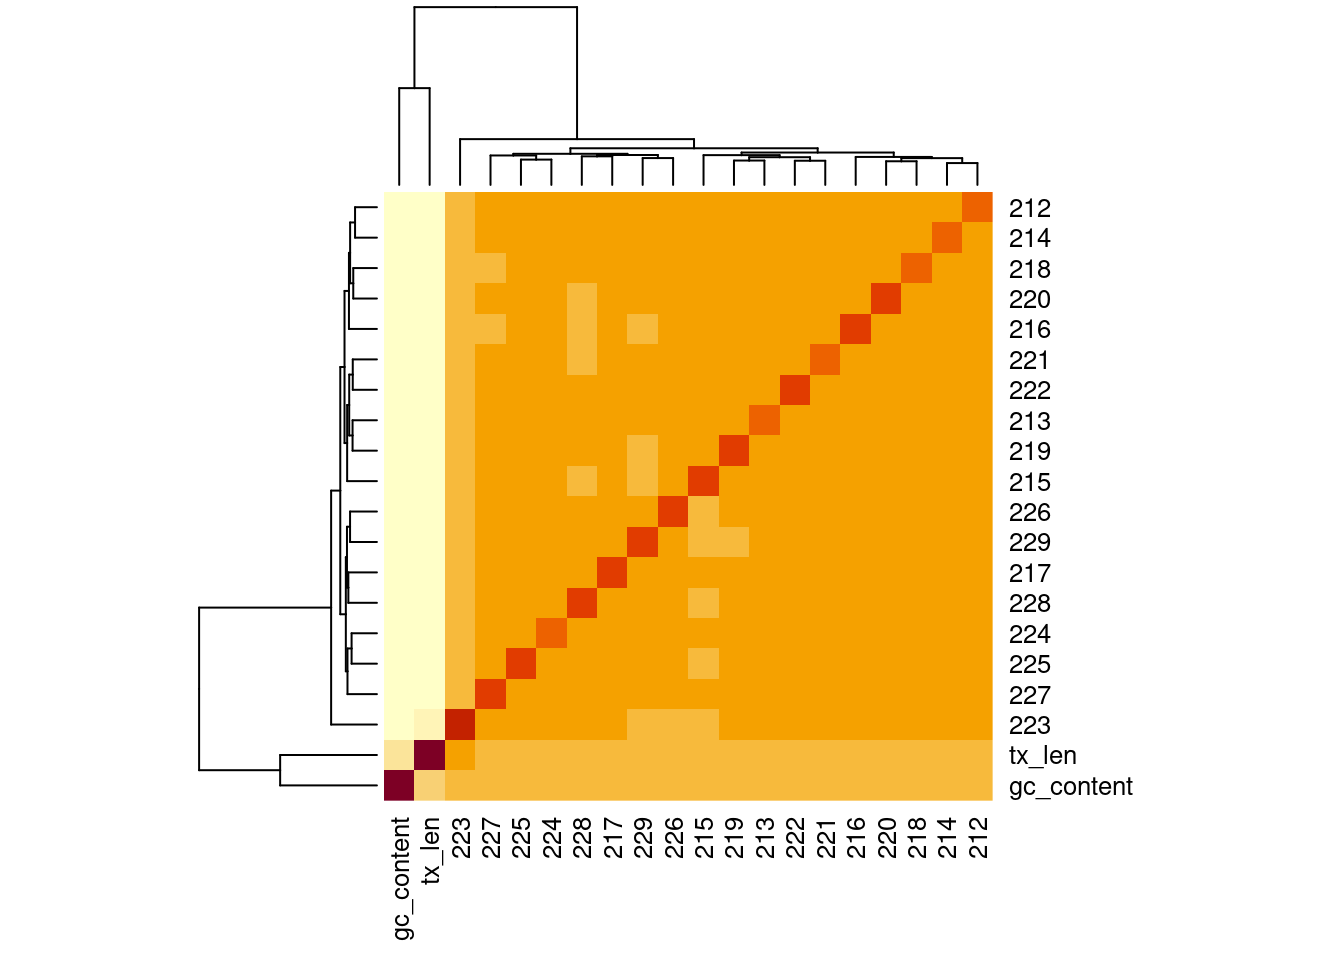
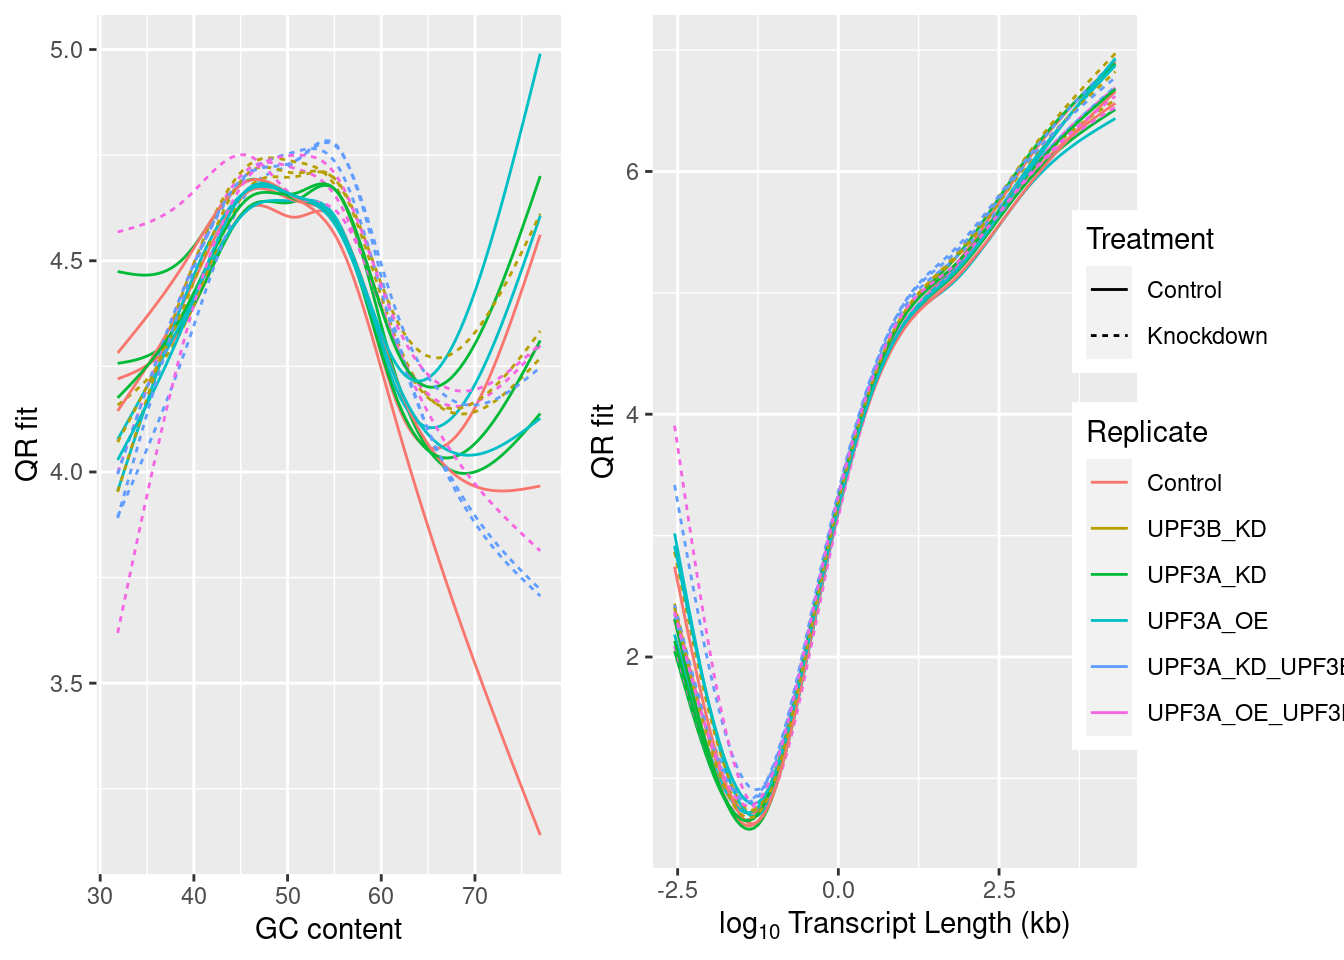
Correlation of samples with GC and transcript length
| Version | Author | Date |
|---|---|---|
| 5196f41 | unawaz1996 | 2023-04-21 |
| Version | Author | Date |
|---|---|---|
| 5196f41 | unawaz1996 | 2023-04-21 |
| Version | Author | Date |
|---|---|---|
| 5196f41 | unawaz1996 | 2023-04-21 |
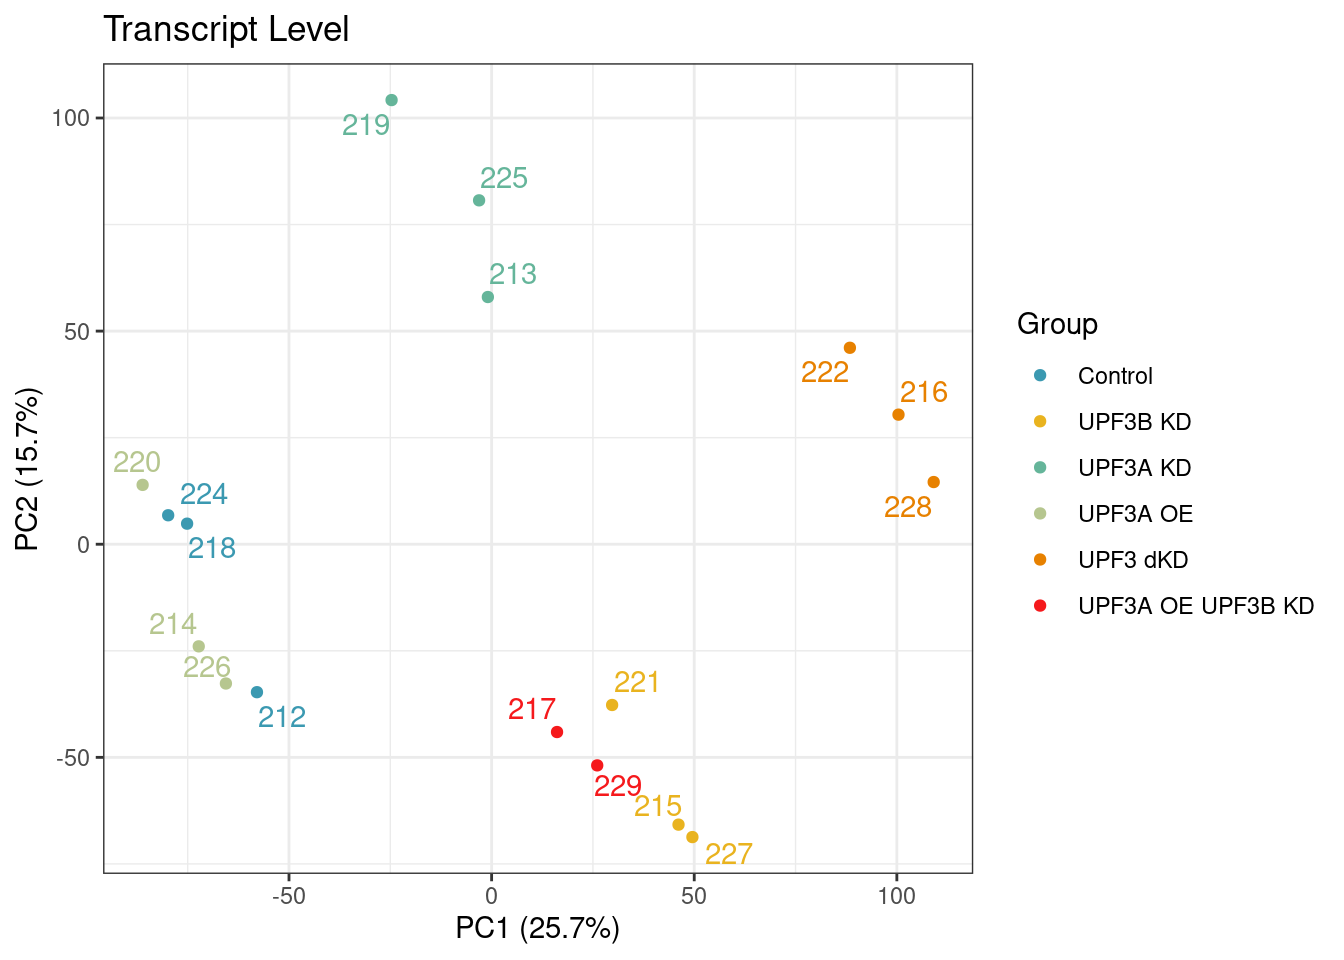
PCA on logCPM from counts post normalization with cqn. As a result of the normlization, it seems that whilst the overall variation within the dataset has reduced, sample 223 is no longer cluster with its condition group on PC1 and PC2
| Version | Author | Date |
|---|---|---|
| 5196f41 | unawaz1996 | 2023-04-21 |
Removing sample
R version 4.2.2 Patched (2022-11-10 r83330)
Platform: x86_64-pc-linux-gnu (64-bit)
Running under: Ubuntu 22.04.2 LTS

Matrix products: default
BLAS:   /usr/lib/x86_64-linux-gnu/blas/libblas.so.3.10.0
LAPACK: /usr/lib/x86_64-linux-gnu/lapack/liblapack.so.3.10.0

locale:
 [1] LC_CTYPE=en_AU.UTF-8       LC_NUMERIC=C
 [3] LC_TIME=en_AU.UTF-8        LC_COLLATE=en_AU.UTF-8
 [5] LC_MONETARY=en_AU.UTF-8    LC_MESSAGES=en_AU.UTF-8
 [7] LC_PAPER=en_AU.UTF-8       LC_NAME=C
 [9] LC_ADDRESS=C               LC_TELEPHONE=C
[11] LC_MEASUREMENT=en_AU.UTF-8 LC_IDENTIFICATION=C

attached base packages:
 [1] splines   grid      stats4    tools     stats     graphics  grDevices
 [8] utils     datasets  methods   base

other attached packages:
 [1] cqn_1.44.0                    quantreg_5.94
 [3] SparseM_1.81                  preprocessCore_1.60.2
 [5] nor1mix_1.3-0                 mclust_6.0.0
 [7] naniar_1.0.0                  glmpca_0.2.0
 [9] broom_1.0.4                   glue_1.6.2
[11] ggfortify_0.4.16              stargazer_5.2.3
[13] IsoformSwitchAnalyzeR_2.01.04 pfamAnalyzeR_0.99.0
[15] sva_3.46.0                    genefilter_1.80.3
[17] mgcv_1.8-42                   nlme_3.1-162
[19] satuRn_1.6.0                  DEXSeq_1.44.0
[21] BiocParallel_1.32.6           ggrepel_0.9.3
[23] pander_0.6.5                  msigdbr_7.5.1
[25] cowplot_1.1.1                 ngsReports_2.0.3
[27] patchwork_1.1.2               VennDiagram_1.7.3
[29] futile.logger_1.4.3           UpSetR_1.4.0
[31] fgsea_1.24.0                  GOplot_1.0.2
[33] RColorBrewer_1.1-3            gridExtra_2.3
[35] ggdendro_0.1.23               AnnotationHub_3.6.0
[37] BiocFileCache_2.6.1           dbplyr_2.3.2
[39] openxlsx_4.2.5.2              ggiraph_0.8.7
[41] wasabi_1.0.1                  sleuth_0.30.1
[43] DT_0.27                       VennDetail_1.14.0
[45] msigdb_1.6.0                  GSEABase_1.60.0
[47] graph_1.76.0                  annotate_1.76.0
[49] XML_3.99-0.14                 pheatmap_1.0.12
[51] ggvenn_0.1.10                 MetBrewer_0.2.0
[53] ggpubr_0.6.0                  venn_1.11
[55] viridis_0.6.2                 viridisLite_0.4.1
[57] tximeta_1.16.1                tximport_1.26.1
[59] goseq_1.50.0                  geneLenDataBase_1.34.0
[61] BiasedUrn_2.0.9               org.Mm.eg.db_3.16.0
[63] EnsDb.Mmusculus.v79_2.99.0    ensembldb_2.22.0
[65] AnnotationFilter_1.22.0       GenomicFeatures_1.50.4
[67] AnnotationDbi_1.60.2          biomaRt_2.54.1
[69] edgeR_3.40.2                  limma_3.54.2
[71] DESeq2_1.38.3                 SummarizedExperiment_1.28.0
[73] Biobase_2.58.0                MatrixGenerics_1.10.0
[75] matrixStats_0.63.0            GenomicRanges_1.50.2
[77] GenomeInfoDb_1.34.9           IRanges_2.32.0
[79] S4Vectors_0.36.2              BiocGenerics_0.44.0
[81] corrplot_0.92                 lubridate_1.9.2
[83] forcats_1.0.0                 purrr_1.0.1
[85] readr_2.1.4                   tidyverse_2.0.0
[87] stringr_1.5.0                 tidyr_1.3.0
[89] scales_1.2.1                  data.table_1.14.8
[91] readxl_1.4.2                  tibble_3.2.1
[93] magrittr_2.0.3                reshape2_1.4.4
[95] ggplot2_3.4.2                 dplyr_1.1.1
[97] workflowr_1.7.0

loaded via a namespace (and not attached):
  [1] rappdirs_0.3.3                rtracklayer_1.58.0
  [3] visdat_0.6.0                  bit64_4.0.5
  [5] knitr_1.42                    DelayedArray_0.24.0
  [7] hwriter_1.3.2.1               KEGGREST_1.38.0
  [9] RCurl_1.98-1.12               generics_0.1.3
 [11] callr_3.7.3                   lambda.r_1.2.4
 [13] RSQLite_2.3.1                 bit_4.0.5
 [15] tzdb_0.3.0                    xml2_1.3.3
 [17] httpuv_1.6.9                  xfun_0.38
 [19] hms_1.1.3                     jquerylib_0.1.4
 [21] babelgene_22.9                evaluate_0.20
 [23] promises_1.2.0.1              fansi_1.0.4
 [25] restfulr_0.0.15               progress_1.2.2
 [27] DBI_1.1.3                     geneplotter_1.76.0
 [29] htmlwidgets_1.6.2             ellipsis_0.3.2
 [31] crosstalk_1.2.0               backports_1.4.1
 [33] locfdr_1.1-8                  vctrs_0.6.1
 [35] abind_1.4-5                   cachem_1.0.7
 [37] withr_2.5.0                   BSgenome_1.66.3
 [39] vroom_1.6.1                   GenomicAlignments_1.34.1
 [41] prettyunits_1.1.1             lazyeval_0.2.2
 [43] crayon_1.5.2                  labeling_0.4.2
 [45] pkgconfig_2.0.3               ProtGenerics_1.30.0
 [47] rlang_1.1.0                   lifecycle_1.0.3
 [49] MatrixModels_0.5-1            filelock_1.0.2
 [51] cellranger_1.1.0              rprojroot_2.0.3
 [53] Matrix_1.5-3                  carData_3.0-5
 [55] boot_1.3-28.1                 Rhdf5lib_1.20.0
 [57] zoo_1.8-11                    whisker_0.4.1
 [59] processx_3.8.0                png_0.1-8
 [61] rjson_0.2.21                  bitops_1.0-7
 [63] getPass_0.2-2                 rhdf5filters_1.10.1
 [65] Biostrings_2.66.0             blob_1.2.4
 [67] rstatix_0.7.2                 ggsignif_0.6.4
 [69] memoise_2.0.1                 plyr_1.8.8
 [71] gdata_2.18.0.1                zlibbioc_1.44.0
 [73] compiler_4.2.2                BiocIO_1.8.0
 [75] Rsamtools_2.14.0              cli_3.6.1
 [77] XVector_0.38.0                pbapply_1.7-0
 [79] ps_1.7.4                      formatR_1.14
 [81] MASS_7.3-58.3                 tidyselect_1.2.0
 [83] stringi_1.7.12                highr_0.10
 [85] yaml_2.3.7                    locfit_1.5-9.7
 [87] sass_0.4.5                    fastmatch_1.1-3
 [89] timechange_0.2.0              parallel_4.2.2
 [91] rstudioapi_0.14               uuid_1.1-0
 [93] git2r_0.31.0                  farver_2.1.1
 [95] digest_0.6.31                 BiocManager_1.30.20
 [97] shiny_1.7.4                   Rcpp_1.0.10
 [99] car_3.1-2                     BiocVersion_3.16.0
[101] later_1.3.0                   httr_1.4.5
[103] colorspace_2.1-0              fs_1.6.1
[105] statmod_1.5.0                 plotly_4.10.1
[107] systemfonts_1.0.4             xtable_1.8-4
[109] jsonlite_1.8.4                futile.options_1.0.1
[111] R6_2.5.1                      pillar_1.9.0
[113] htmltools_0.5.5               mime_0.12
[115] fastmap_1.1.1                 interactiveDisplayBase_1.36.0
[117] codetools_0.2-19              utf8_1.2.3
[119] lattice_0.20-45               bslib_0.4.2
[121] curl_5.0.0                    gtools_3.9.4
[123] zip_2.2.2                     GO.db_3.16.0
[125] survival_3.5-5                admisc_0.31
[127] rmarkdown_2.21                munsell_0.5.0
[129] rhdf5_2.42.0                  GenomeInfoDbData_1.2.9
[131] gtable_0.3.3