Analises Modelos Mistos
LucianoRogerio e HenriqueBernardino
2021-10-12
Last updated: 2023-10-03
Checks: 6 1
Knit directory: HenriqueDGen/
This reproducible R Markdown analysis was created with workflowr (version 1.7.0). The Checks tab describes the reproducibility checks that were applied when the results were created. The Past versions tab lists the development history.
The R Markdown file has staged changes. To know which version of the
R Markdown file created these results, you’ll want to first commit it to
the Git repo. If you’re still working on the analysis, you can ignore
this warning. When you’re finished, you can run
wflow_publish to commit the R Markdown file and build the
HTML.
Great job! The global environment was empty. Objects defined in the global environment can affect the analysis in your R Markdown file in unknown ways. For reproduciblity it’s best to always run the code in an empty environment.
The command set.seed(20211012) was run prior to running
the code in the R Markdown file. Setting a seed ensures that any results
that rely on randomness, e.g. subsampling or permutations, are
reproducible.
Great job! Recording the operating system, R version, and package versions is critical for reproducibility.
Nice! There were no cached chunks for this analysis, so you can be confident that you successfully produced the results during this run.
Great job! Using relative paths to the files within your workflowr project makes it easier to run your code on other machines.
Great! You are using Git for version control. Tracking code development and connecting the code version to the results is critical for reproducibility.
The results in this page were generated with repository version 54268fe. See the Past versions tab to see a history of the changes made to the R Markdown and HTML files.
Note that you need to be careful to ensure that all relevant files for
the analysis have been committed to Git prior to generating the results
(you can use wflow_publish or
wflow_git_commit). workflowr only checks the R Markdown
file, but you know if there are other scripts or data files that it
depends on. Below is the status of the Git repository when the results
were generated:
Ignored files:
Ignored: .DS_Store
Ignored: .Rhistory
Ignored: .Rproj.user/
Ignored: data/.DS_Store
Ignored: output/.DS_Store
Ignored: output/Figures/.DS_Store
Staged changes:
Modified: analysis/AnalisesModelosMistos.Rmd
Modified: analysis/Den_IndSH.Rmd
New: output/MediasBLUPs.txt
Modified: output/ShannonWeaverIndex.csv
Note that any generated files, e.g. HTML, png, CSS, etc., are not included in this status report because it is ok for generated content to have uncommitted changes.
These are the previous versions of the repository in which changes were
made to the R Markdown (analysis/AnalisesModelosMistos.Rmd)
and HTML (docs/AnalisesModelosMistos.html) files. If you’ve
configured a remote Git repository (see ?wflow_git_remote),
click on the hyperlinks in the table below to view the files as they
were in that past version.
| File | Version | Author | Date | Message |
|---|---|---|---|---|
| Rmd | fef5cf2 | LucianoRogerio | 2023-07-26 | Adicao Dados 2022 |
| html | fef5cf2 | LucianoRogerio | 2023-07-26 | Adicao Dados 2022 |
| Rmd | 963096a | LucianoRogerio | 2022-04-19 | Update Website |
| html | 963096a | LucianoRogerio | 2022-04-19 | Update Website |
| Rmd | 745d17f | LucianoRogerio | 2022-04-19 | Update Website |
| html | 745d17f | LucianoRogerio | 2022-04-19 | Update Website |
| Rmd | e08b1a6 | LucianoRogerio | 2022-04-05 | Last Analysis |
| html | e08b1a6 | LucianoRogerio | 2022-04-05 | Last Analysis |
| Rmd | e020351 | LucianoRogerio | 2022-03-29 | Update Henrique Analysis |
| html | e020351 | LucianoRogerio | 2022-03-29 | Update Henrique Analysis |
| Rmd | 350ad46 | LucianoRogerio | 2022-03-23 | Names updates from Data files |
| Rmd | 90b66eb | LucianoRogerio | 2022-03-08 | Update analysis Mixed models Henrique |
| html | 90b66eb | LucianoRogerio | 2022-03-08 | Update analysis Mixed models Henrique |
| Rmd | 2abb2a7 | LucianoRogerio | 2021-12-07 | Small english changes at the website |
| html | 2abb2a7 | LucianoRogerio | 2021-12-07 | Small english changes at the website |
| Rmd | 73653b1 | LucianoRogerio | 2021-12-07 | fix the buttons at the final of each of the webpages |
| html | 73653b1 | LucianoRogerio | 2021-12-07 | fix the buttons at the final of each of the webpages |
| Rmd | f272038 | LucianoRogerio | 2021-12-07 | Update of the analysis and website layout |
| html | f272038 | LucianoRogerio | 2021-12-07 | Update of the analysis and website layout |
| html | f51cdc6 | LucianoRogerio | 2021-11-18 | Add the Dendrogram analysis |
| Rmd | 97d638d | LucianoRogerio | 2021-11-02 | Update of html links |
| html | 97d638d | LucianoRogerio | 2021-11-02 | Update of html links |
| html | b9ef481 | LucianoRogerio | 2021-11-02 | Build site and add new Data |
| Rmd | 7286357 | LucianoRogerio | 2021-11-02 | Insercao do caractere Area de Antracnose e PCA |
| html | 9f9ffff | LucianoRogerio | 2021-10-26 | Build site. |
| Rmd | 170ea91 | LucianoRogerio | 2021-10-26 | BLUPs + Control Means for Diversity analysis |
| Rmd | 60db375 | LucianoRogerio | 2021-10-26 | BLUPS and Means effects estimated for Diversity analysis |
| html | b8ca347 | LucianoRogerio | 2021-10-19 | Build site. |
| Rmd | b87ceea | LucianoRogerio | 2021-10-19 | Add Mixed Models analysis for the repository |
| Rmd | 106f55c | LucianoRogerio | 2021-10-19 | Update Website |
| html | 106f55c | LucianoRogerio | 2021-10-19 | Update Website |
| Rmd | b9ece4f | LucianoRogerio | 2021-10-12 | Second Commit |
| html | b9ece4f | LucianoRogerio | 2021-10-12 | Second Commit |
| Rmd | d2d70ff | LucianoRogerio | 2021-10-12 | Second Commit |
| html | d2d70ff | LucianoRogerio | 2021-10-12 | Second Commit |
Mixed Models Foliar Disease
library(here)here() starts at /Users/luciano/Documents/GitHub/HenriqueDGensuppressMessages(library(tidyverse))
suppressMessages(library(plyr))
library(reactable)
suppressMessages(library(data.table))
suppressMessages(source(here::here("code", "MixedModelsFunctions.R")))
PhenoData <- readRDS(here::here("output", "DadosDoencasv2.RDS"))
PhenoData$block_number <- as.character(PhenoData$block_number)
PhenoData2 <- PhenoData %>% filter(!is.na(Y)) %>%
mutate(TrialBlock = paste0(trial_name, block_number))
traits <- unique(PhenoData2$traits)
fmfit <- PhenoData2 %>% dlply(.variables = c("traits"),
.fun = analyzeTrial.lme4FD)
ResFixEffect <- lapply(fmfit, FUN = as.data.frame(anova))
ResAnInt <- matrix(unlist(ResFixEffect,use.names = T),
nrow = 2, byrow = F)
ResAnFin <- rbind(ResAnInt[,1:4],
ResAnInt[,5:8],
ResAnInt[,9:12],
ResAnInt[,13:16])
colnames(ResAnFin) <- c("DF", "SumSq", "MeanSq", "Fvalue")
ResAnovaFinal <- data.frame(Trait = rep(traits, each = 2),
Factor = rep(c("Trial", "Trial:Block"),
times = 4),
ResAnFin)Table 1. Anova of the fixed effects of Cassava foliar diseases
rdfmfit1 <- PhenoData2 %>% dlply(.variables = c("traits"),
.fun = analyzeTrialrdMod1.lme4)
rdfmfit2 <- PhenoData2 %>% dlply(.variables = c("traits"),
.fun = analyzeTrialrdMod2.lme4)
Deviances <- NULL
for(i in traits){
Deviances[[i]] <- data.frame(Deviance.MM(fmfit[[i]], rdfmfit1[[i]], rdfmfit2[[i]]))[2:3,6:8]
rownames(Deviances[[i]]) <- c("Clone", "GxE")
}refitting model(s) with ML (instead of REML)
refitting model(s) with ML (instead of REML)
refitting model(s) with ML (instead of REML)
refitting model(s) with ML (instead of REML)ResDeviances <- matrix(unlist(Deviances, use.names = T), nrow = 2, byrow = F)
ResDeviances <- rbind(ResDeviances[,1:3],
ResDeviances[,4:6],
ResDeviances[,7:9],
ResDeviances[,10:12])
colnames(ResDeviances) <- c("QuiSq", "DF", "Prob")
ResDeviancesFinal <- data.frame(Trait = rep(traits, each = 2),
Factor = rep(c("Clone", "GxE"),
times = 4),
ResDeviances)Table 2. Deviance Analysis for cassava foliar disease
H2 <- sapply(fmfit, FUN = getVarComp.lme4) %>% t() %>% as.data.frame()
colnames(H2) <- c("VarClone", "VarGE", "VarRes")
MediasFix <- as.matrix(sapply(fmfit, FUN = (fixef))) %>%
.[rownames(.) == "(Intercept)"] %>% data.frame(Mean = .)
RepMean <- tibble()
for(i in traits){
RepMean <- bind_rows(RepMean, tibble(Trait = i,
RepMean = PhenoData2 %>% group_by(traits, trial_name, accession_name) %>%
dplyr::summarise(RepMean = n())%>% .$RepMean %>% mean()))
}`summarise()` has grouped output by 'traits', 'trial_name'. You can override
using the `.groups` argument.
`summarise()` has grouped output by 'traits', 'trial_name'. You can override
using the `.groups` argument.
`summarise()` has grouped output by 'traits', 'trial_name'. You can override
using the `.groups` argument.
`summarise()` has grouped output by 'traits', 'trial_name'. You can override
using the `.groups` argument.H2 <- cbind(H2, MediasFix, RepMean)
H2 <- H2 %>% mutate(VarClone = as.numeric(VarClone),
VarGE = as.numeric(VarGE),
VarRes = as.numeric(VarRes),
VarFen = VarClone + VarGE + VarRes,
VarFenFam = VarClone + VarGE/RepMean + VarRes/(RepMean*2),
H2 = VarClone/VarFen,
H2fam = VarClone/VarFenFam,
CVg = sqrt(VarClone)/Mean,
CVe = sqrt(VarRes)/Mean)
H2[,"Mean"] <- NULL
H2[,"RepMean"] <- NULLTable 3. Heritabilities of cassava foliar disease
Obtain the Mean + BLUPs of the clones
Obtain the Clones BLUPS
BLUPsAle <- lapply(fmfit, FUN = getBLUPs.lme4)
BLUPSDisea <- data.frame(CLONE = rownames(BLUPsAle[1]$Anth))
for(i in names(BLUPsAle)){
drg<-data.frame(CLONE = rownames(BLUPsAle[[i]]), stringsAsFactors=F)
drg[,i] <-BLUPsAle[[i]]
BLUPSDisea<-merge(BLUPSDisea,drg,by="CLONE",all.x=T)
}
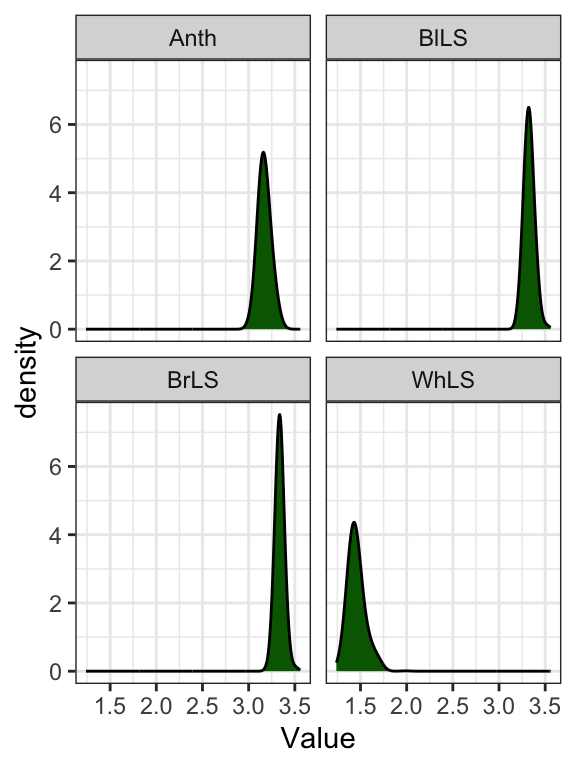
saveRDS(BLUPSDisea, here::here("output", "BLUPsDisease.RDS"))Table 4. Blups of the accessions for cassava foliar diseases
Mixed Models
Yield Traits
suppressMessages(library(lme4)); suppressMessages(library(tidyverse))
library(reactable); library(here)
AgroData <- readRDS(file = here::here("output", "DadosFenotipicos.rds"))
head(AgroData) Ano Campo Fazenda Local Linha Coluna Stand Trait y trial
1 2011 Agroverde1 CNPMF CruzAlmas 27 7 18 DMC 29.91 1
2 2011 Agroverde1 CNPMF CruzAlmas 25 14 17 DMC 29.93 1
3 2011 Agroverde1 CNPMF CruzAlmas 16 24 20 DMC 31.52 1
4 2011 Agroverde1 CNPMF CruzAlmas 7 2 16 DMC 35.34 1
5 2011 Agroverde1 CNPMF CruzAlmas 4 11 17 DMC 26.68 1
6 2011 Agroverde1 CNPMF CruzAlmas 3 20 17 DMC 27.92 1
studyDesign clone rep check new
1 DBC BGM-0023 1 999 1
2 DBC BGM-0023 2 999 1
3 DBC BGM-0023 3 999 1
4 DBC BGM-0025 1 999 1
5 DBC BGM-0025 2 999 1
6 DBC BGM-0025 3 999 1