Single-cell PBMC Example
karltayeb
2022-03-16
Last updated: 2022-03-30
Checks: 7 0
Knit directory: logistic-susie-gsea/
This reproducible R Markdown analysis was created with workflowr (version 1.7.0). The Checks tab describes the reproducibility checks that were applied when the results were created. The Past versions tab lists the development history.
Great! Since the R Markdown file has been committed to the Git repository, you know the exact version of the code that produced these results.
Great job! The global environment was empty. Objects defined in the global environment can affect the analysis in your R Markdown file in unknown ways. For reproduciblity it’s best to always run the code in an empty environment.
The command set.seed(20220105) was run prior to running the code in the R Markdown file. Setting a seed ensures that any results that rely on randomness, e.g. subsampling or permutations, are reproducible.
Great job! Recording the operating system, R version, and package versions is critical for reproducibility.
Nice! There were no cached chunks for this analysis, so you can be confident that you successfully produced the results during this run.
Great job! Using relative paths to the files within your workflowr project makes it easier to run your code on other machines.
Great! You are using Git for version control. Tracking code development and connecting the code version to the results is critical for reproducibility.
The results in this page were generated with repository version 171fb3f. See the Past versions tab to see a history of the changes made to the R Markdown and HTML files.
Note that you need to be careful to ensure that all relevant files for the analysis have been committed to Git prior to generating the results (you can use wflow_publish or wflow_git_commit). workflowr only checks the R Markdown file, but you know if there are other scripts or data files that it depends on. Below is the status of the Git repository when the results were generated:
Ignored files:
    Ignored:    .DS_Store
    Ignored:    .RData
    Ignored:    .Rhistory
    Ignored:    .Rproj.user/
    Ignored:    library/
    Ignored:    renv/library/
    Ignored:    renv/staging/
    Ignored:    staging/

Untracked files:
    Untracked:  _targets.R
    Untracked:  _targets.html
    Untracked:  _targets.md
    Untracked:  _targets/
    Untracked:  _targets_r/
    Untracked:  analysis/fetal_reference_cellid_gsea.Rmd
    Untracked:  analysis/fixed_intercept.Rmd
    Untracked:  analysis/iDEA_examples.Rmd
    Untracked:  analysis/latent_gene_list.Rmd
    Untracked:  analysis/latent_logistic_susie.Rmd
    Untracked:  analysis/libra_setup.Rmd
    Untracked:  analysis/linear_method_failure_modes.Rmd
    Untracked:  analysis/linear_regression_failure_regime.Rmd
    Untracked:  analysis/logistic_susie_veb_boost_vs_vb.Rmd
    Untracked:  analysis/references.bib
    Untracked:  analysis/simulations.Rmd
    Untracked:  analysis/test.Rmd
    Untracked:  analysis/wenhe_baboon_example.Rmd
    Untracked:  baboon_diet_cache/
    Untracked:  build_site.R
    Untracked:  cache/
    Untracked:  code/latent_logistic_susie.R
    Untracked:  code/marginal_sumstat_gsea_collapsed.R
    Untracked:  data/adipose_2yr_topsnp.txt
    Untracked:  data/fetal_reference_cellid_gene_sets.RData
    Untracked:  data/pbmc-purified/
    Untracked:  data/wenhe_baboon_diet/
    Untracked:  docs.zip
    Untracked:  index.md
    Untracked:  latent_logistic_susie_cache/
    Untracked:  simulation_targets/
    Untracked:  single_cell_pbmc_cache/
    Untracked:  summary_stat_gsea_exploration_cache/

Unstaged changes:
    Modified:   _simulation_targets.R
    Modified:   _targets.Rmd
    Modified:   analysis/gseabenchmark_tcga.Rmd
    Modified:   code/fit_baselines.R
    Modified:   code/fit_logistic_susie.R
    Modified:   code/fit_mr_ash.R
    Modified:   code/fit_susie.R
    Modified:   code/load_gene_sets.R
    Modified:   code/marginal_sumstat_gsea.R
    Modified:   code/simulate_gene_lists.R
    Modified:   code/utils.R
    Modified:   target_components/factories.R
    Modified:   target_components/methods.R
Note that any generated files, e.g. HTML, png, CSS, etc., are not included in this status report because it is ok for generated content to have uncommitted changes.
These are the previous versions of the repository in which changes were made to the R Markdown (analysis/single_cell_pbmc.Rmd) and HTML (docs/single_cell_pbmc.html) files. If you’ve configured a remote Git repository (see ?wflow_git_remote), click on the hyperlinks in the table below to view the files as they were in that past version.
| File | Version | Author | Date | Message |
|---|---|---|---|---|
| Rmd | 171fb3f | karltayeb | 2022-03-30 | wflow_publish(“analysis/single_cell_pbmc.Rmd”) |
| html | e572f0a | karltayeb | 2022-03-30 | Build site. |
| Rmd | a6b9318 | karltayeb | 2022-03-30 | wflow_publish(“analysis/single_cell_pbmc.Rmd”) |
| html | 26e6c28 | karltayeb | 2022-03-30 | Build site. |
| Rmd | 11ff3a3 | karltayeb | 2022-03-30 | wflow_publish(pages) |
| html | 8999b58 | karltayeb | 2022-03-29 | Build site. |
| Rmd | 9a5aad9 | karltayeb | 2022-03-29 | wflow_publish(“analysis/single_cell_pbmc.Rmd”) |
| html | cdd6193 | karltayeb | 2022-03-29 | Build site. |
| Rmd | 9cf1df0 | karltayeb | 2022-03-29 | wflow_publish(“analysis/single_cell_pbmc.Rmd”) |
| html | 0369ee2 | karltayeb | 2022-03-29 | Build site. |
| Rmd | 9fcb3b4 | karltayeb | 2022-03-29 | wflow_publish(“analysis/single_cell_pbmc.Rmd”) |
| html | 2fa21ff | karltayeb | 2022-03-29 | Build site. |
| Rmd | 7ee315c | karltayeb | 2022-03-29 | wflow_publish(“analysis/single_cell_pbmc.Rmd”) |
| html | 8314424 | karltayeb | 2022-03-29 | Build site. |
| Rmd | 524d94b | karltayeb | 2022-03-29 | wflow_publish(“analysis/single_cell_pbmc.Rmd”) |
| html | 61540e8 | karltayeb | 2022-03-29 | Build site. |
| Rmd | 54209af | karltayeb | 2022-03-29 | wflow_publish(“analysis/single_cell_pbmc.Rmd”) |
| html | 67bf8cf | karltayeb | 2022-03-29 | Build site. |
| Rmd | 170e480 | karltayeb | 2022-03-29 | wflow_publish(“analysis/single_cell_pbmc.Rmd”) |
| html | 90c6006 | karltayeb | 2022-03-29 | Build site. |
| Rmd | 8159b83 | karltayeb | 2022-03-29 | wflow_publish(“analysis/single_cell_pbmc.Rmd”) |
| html | 9d7fd29 | karltayeb | 2022-03-29 | Build site. |
| Rmd | 51647d4 | karltayeb | 2022-03-29 | wflow_publish(“analysis/single_cell_pbmc.Rmd”) |
| html | 3da7c5b | karltayeb | 2022-03-29 | Build site. |
| Rmd | fc1f3c1 | karltayeb | 2022-03-29 | wflow_publish(“analysis/single_cell_pbmc.Rmd”) |
| html | 8646723 | karltayeb | 2022-03-29 | Build site. |
| Rmd | 6143c44 | karltayeb | 2022-03-29 | wflow_publish(“analysis/single_cell_pbmc.Rmd”) |
| html | 56f8130 | karltayeb | 2022-03-29 | Build site. |
| html | a2bdb56 | karltayeb | 2022-03-29 | Build site. |
| Rmd | 122deec | karltayeb | 2022-03-29 | wflow_publish(pages) |
Introduction
Our goals here are to run Logistic SuSiE on differential expression results from TCGA. We want to assess:
- If the resulting enrichment results look good/interpretable across multiple/concatenated gene sets
- Assess sensitivity to a range of p-value thresholds
- Evaluate the potential of the summary stat latent model
library(GSEABenchmarkeR)
library(EnrichmentBrowser)
library(tidyverse)
library(susieR)
library(DT)
library(kableExtra)

source('code/load_gene_sets.R')
source('code/utils.R')
source('code/logistic_susie_vb.R')
source('code/logistic_susie_veb_boost.R')
source('code/latent_logistic_susie.R')
Setup
Load Gene Sets
loadGeneSetX uniformly formats gene sets and generates the \(X\) matrix We can source any gene set from WebGestaltR::listGeneSet()
gs_list <- WebGestaltR::listGeneSet()
gobp <- loadGeneSetX('geneontology_Biological_Process', min.size=50)  # just huge number of gene sets
gobp_nr <- loadGeneSetX('geneontology_Biological_Process_noRedundant', min.size=1)
gomf <- loadGeneSetX('geneontology_Molecular_Function', min.size=1)
kegg <- loadGeneSetX('pathway_KEGG', min.size=1)
reactome <- loadGeneSetX('pathway_Reactome', min.size=1)
wikipathway_cancer <- loadGeneSetX('pathway_Wikipathway_cancer', min.size=1)
wikipathway <- loadGeneSetX('pathway_Wikipathway', min.size=1)

genesets <- list(
  gobp=gobp,
  gobp_nr=gobp_nr,
  gomf=gomf,
  kegg=kegg,
  reactome=reactome,
  wikipathway_cancer=wikipathway_cancer,
  wikipathway=wikipathway
)
load('data/pbmc-purified/deseq2-pbmc-purified.RData')
convert_labels <- function(y, from='SYMBOL', to='ENTREZID'){
hs <- org.Hs.eg.db::org.Hs.eg.db
gene_symbols <- names(y)
symbol2entrez <- AnnotationDbi::select(hs, keys=gene_symbols, columns=c(to, from), keytype = from)
symbol2entrez <- symbol2entrez[!duplicated(symbol2entrez[[from]]),]
symbol2entrez <- symbol2entrez[!is.na(symbol2entrez[[to]]),]
symbol2entrez <- symbol2entrez[!is.na(symbol2entrez[[from]]),]
rownames(symbol2entrez) <- symbol2entrez[[from]]
ysub <- y[names(y) %in% symbol2entrez[[from]]]
names(ysub) <- symbol2entrez[names(ysub),][[to]]
return(ysub)
}
par(mfrow=c(1,1))
deseq$`CD19+ B` %>% .$padj %>% hist(main='CD19+B p-values')Loading required package: DESeq2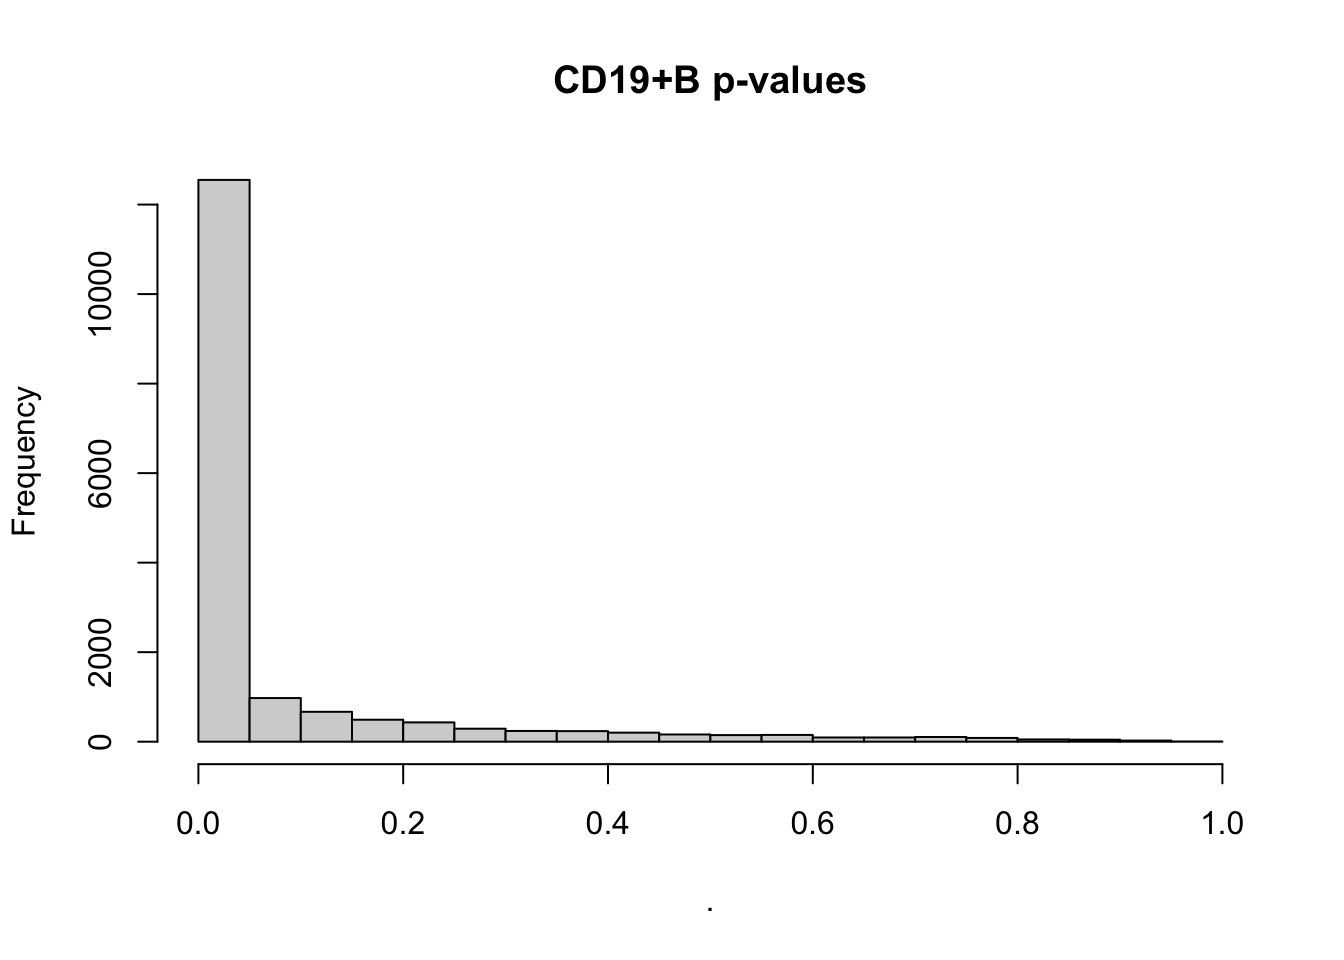
| Version | Author | Date |
|---|---|---|
| a2bdb56 | karltayeb | 2022-03-29 |
Fitting and reporting helpers
#' fit logistic susie, and hypergeometric test
logistic_susie_driver = function(db, celltype, thresh){
  gs <- genesets[[db]]
  data <- deseq[[celltype]]

  # set up binary y
  y <- data %>%
    as.data.frame %>%
    rownames_to_column('gene') %>%
    dplyr::select(gene, padj) %>%
    filter(!is.na(padj)) %>%
    mutate(y = as.integer(padj < thresh)) %>%
    select(gene, y) %>%
    tibble2namedlist %>%
    convert_labels('ENSEMBL')

  u <- process_input(gs$X, y)  # subset to common genes
  vb.fit <- logistic.susie(  # fit model
    u$X, u$y, L=10, init.intercept = 0, verbose=1, maxit=100)

  #' hypergeometric test
  ora <- tibble(
    geneSet = colnames(u$X),
    geneListSize = sum(u$y),
    geneSetSize = colSums(u$X),
    overlap = (u$y %*% u$X)[1,],
    nGenes = length(u$y),
    propInList = overlap / geneListSize,
    propInSet = overlap / geneSetSize,
    oddsRatio = (overlap / (geneListSize - overlap)) / (
      (geneSetSize - overlap) / (nGenes - geneSetSize + overlap)),
    pValueHypergeometric = phyper(
      overlap-1, geneListSize, nGenes, geneSetSize, lower.tail= FALSE),
    db = db,
    celltype = celltype,
    thresh = thresh
  ) %>%
  left_join(gs$geneSet$geneSetDes)

  return(list(
    fit = vb.fit,
    ora = ora,
    db = db, celltype = celltype, thresh = thresh))
}

credible_set_summary = function(res){
  gs <- genesets[[res$db]]
  data <- deseq[[res$celltype]]

  # set up binary y
  y <- data %>%
    as.data.frame %>%
    rownames_to_column('gene') %>%
    dplyr::select(gene, padj) %>%
    filter(!is.na(padj)) %>%
    mutate(y = as.integer(padj < res$thresh)) %>%
    select(gene, y) %>%
    tibble2namedlist %>%
    convert_labels('ENSEMBL')

  u <- process_input(gs$X, y)  # subset to common genes

  #' report top 50 elements in cs
  credible.set.summary <- t(res$fit$alpha) %>%
    data.frame() %>%
    rownames_to_column(var='geneSet') %>%
    rename_with(~str_replace(., 'X', 'L')) %>%
    pivot_longer(starts_with('L'), names_to='component', values_to = 'alpha') %>%
    arrange(component, desc(alpha)) %>%
    dplyr::group_by(component) %>%
    filter(row_number() < 50) %>%
    mutate(cumalpha = c(0, head(cumsum(alpha), -1))) %>%
    mutate(in_cs = cumalpha < 0.95) %>%
    mutate(active_cs = component %in% names(res$fit$sets$cs)) %>%
    left_join(res$ora) %>%
    left_join(gs$geneSet$geneSetDes)

  #' map each gene set to the component with top alpha
  #' report pip
  gene.set.summary <- res$fit$pip %>%
    as_tibble(rownames='geneSet') %>%
    rename(pip=value) %>%
    left_join(res$ora) %>%
    left_join(gs$geneSet$geneSetDes)

  return(credible.set.summary)
}

gene_set_summary = function(res){
  gs <- genesets[[res$db]]
  #' map each gene set to the component with top alpha
  #' report pip
  res$fit$pip %>%
    as_tibble(rownames='geneSet') %>%
    rename(pip=value) %>%
    left_join(res$ora) %>%
    left_join(gs$geneSet$geneSetDes)
}
Example usage
db = 'gobp'
celltype = 'CD19+ B'
thresh = 1e-4
res <- logistic_susie_driver(db, celltype, thresh)
'select()' returned 1:many mapping between keys and columns
convergedJoining, by = "geneSet"credible_set_summary(res) %>% head()'select()' returned 1:many mapping between keys and columns
Joining, by = "geneSet"Joining, by = c("geneSet", "description")Joining, by = "geneSet"Joining, by = c("geneSet", "description")# A tibble: 6 × 18
# Groups: component [1]
geneSet component alpha cumalpha in_cs active_cs geneListSize geneSetSize
<chr> <chr> <dbl> <dbl> <lgl> <lgl> <int> <dbl>
1 GO:00023… L1 1.00e+ 0 0 TRUE TRUE 6911 2228
2 GO:00069… L1 4.25e- 5 1.00 FALSE TRUE 6911 1526
3 GO:00508… L1 2.34e-12 1.00 FALSE TRUE 6911 6070
4 GO:00022… L1 8.01e-15 1.00 FALSE TRUE 6911 973
5 GO:00026… L1 2.95e-15 1.00 FALSE TRUE 6911 1134
6 GO:00507… L1 7.00e-16 1.00 FALSE TRUE 6911 741
# … with 10 more variables: overlap <dbl>, nGenes <int>, propInList <dbl>,
# propInSet <dbl>, oddsRatio <dbl>, pValueHypergeometric <dbl>, db <chr>,
# celltype <chr>, thresh <dbl>, description <chr>gene_set_summary(res) %>% head()Joining, by = "geneSet"
Joining, by = c("geneSet", "description")# A tibble: 6 × 14
geneSet pip geneListSize geneSetSize overlap nGenes propInList propInSet
<chr> <dbl> <int> <dbl> <dbl> <int> <dbl> <dbl>
1 GO:00025… 4.18e-2 6911 95 77 12078 0.0111 0.811
2 GO:00068… 3.91e-4 6911 3750 2317 12078 0.335 0.618
3 GO:00068… 5.74e-4 6911 733 523 12078 0.0757 0.714
4 GO:00081… 7.18e-5 6911 12078 6911 12078 1 0.572
5 GO:00099… 7.70e-5 6911 11191 6442 12078 0.932 0.576
6 GO:00161… 1.36e-3 6911 1610 1055 12078 0.153 0.655
# … with 6 more variables: oddsRatio <dbl>, pValueHypergeometric <dbl>,
# db <chr>, celltype <chr>, thresh <dbl>, description <chr>Fit PBMC data
For each celltype, we fit logistic SuSiE using multiple gene set sources at various threshold of padj.
celltypes <- names(deseq)
pthresh <- c(1e-4) # c(0.1, 0.01, 0.001, 0.0001, 0.00001, 0.000001)
db_name <- names(genesets)
crossed <- cross3(db_name, celltypes, pthresh)

pbmc_res <- xfun::cache_rds({
  res <- purrr::map(crossed, purrr::lift_dl(logistic_susie_driver))
  for (i in 1:length(res)){  # save some space
    res[[i]]$fit$dat <- NULL
  }
  res
  }
)

u <- map(pbmc_res, credible_set_summary)
pbmc.cs.summary <- do.call('rbind', u)
cs.summary <- pbmc.cs.summary

u <- map(pbmc_res, gene_set_summary)
pbmc.geneset.summary <- do.call('rbind', u)
geneset.summary <- pbmc.geneset.summary
Summary functions
Just a few functions to help streamline looking at output
library(kableExtra)
#' takes a tibble
#' organize by database and component
#' report credible set, descriptions, pips, and hypergeometric pvalue
#' in one row, with cs ordered by pip
db_component_kable = function(tbl){
  tbl %>%
  filter(active_set, thresh==1e-4) %>%
  group_by(db, celltype, top_component) %>%
  arrange(db, celltype, top_component, desc(pip)) %>%
  select(geneSet, description, pip, pValueHypergeometric) %>%
  chop(c(geneSet, description, pip, pValueHypergeometric)) %>%
  knitr::kable()
}

#' takes a tibble
#' organize by database and component
#' report credible set, descriptions, pips, and hypergeometric pvalue
#' in one row, with cs ordered by pip
db_component_kable = function(tbl, min_alpha=0, max_sets=10){
  tbl_filtered <-
    tbl %>%
    group_by(celltype, db, component) %>%
    arrange(celltype, db, component, desc(alpha)) %>%
    filter(alpha > min_alpha, row_number() <= max_sets)

  tbl_filtered %>%
    select(geneSet, description, alpha, pValueHypergeometric) %>%
    dplyr::mutate_if(is.numeric, funs(as.character(signif(., 3)))) %>%
    kbl() %>%
    column_spec(c(4, 5, 6), color=ifelse(tbl_filtered$in_cs, 'green', 'red')) %>%
    collapse_rows(columns = c(1, 2), valign = 'top') %>%
    kableExtra::kable_styling()
}
Results
Here for each cell type and gene set database, we look at the top 10 gene sets per SuSiE component. Gene sets are colored green if they’re in the credible set and red otherwise.
There tables are a lot to look at, so I’ll have to come back and summarise results somehow.
General obseravtion: * Virtually ALL of these gene sets report as highly significant by hypergeometric test * For “dense” gene set sources like GO-BP the top 10 gene sets in a component are often closely related, but outside of the credible set often have vanishingly small alpha. So although they are marginally enriched, logistic SuSiE thinks that other gene sets provide a much better explaination for the observed gene list. I think this is the type of result we want to see– credible sets capture related gene sets and nominate one/a few of them * Sometime we see a mix of topics within a component.
The tables are really long, so for each cell-type I summarize the components into “themes”
library(htmltools)

gen.table = function(ct, g){
  pbmc.cs.summary %>%
        filter(celltype == ct, db == g, active_cs) %>%
        db_component_kable() %>%
        htmltools::HTML()
}
possibly.gen.table = possibly(gen.table, otherwise="nothing to report...")

for(ct in celltypes){
  cat("\n")
  cat("##", ct, "\n") # Create second level headings with the names.

  for(g in names(genesets)){
    cat("###", g, "\n") # Create second level headings with the names.
    possibly.gen.table(ct, g) %>% print()
    cat("\n")
  }
}
CD19+ B
gobp
Adding missing grouping variables: `celltype`, `db`, `component`
`mutate_if()` ignored the following grouping variables:
Warning: `funs()` was deprecated in dplyr 0.8.0.
Please use a list of either functions or lambdas:
# Simple named list:
list(mean = mean, median = median)
# Auto named with `tibble::lst()`:
tibble::lst(mean, median)
# Using lambdas
list(~ mean(., trim = .2), ~ median(., na.rm = TRUE))
This warning is displayed once every 8 hours.
Call `lifecycle::last_lifecycle_warnings()` to see where this warning was generated.| celltype | db | component | geneSet | description | alpha | pValueHypergeometric |
|---|---|---|---|---|---|---|
| CD19+ B | gobp | L1 | GO:0002376 | immune system process | 1 | 2.53e-269 |
| CD19+ B | gobp | L1 | GO:0006955 | immune response | 4.25e-05 | 1.15e-202 |
| CD19+ B | gobp | L1 | GO:0050896 | response to stimulus | 2.34e-12 | 0 |
| CD19+ B | gobp | L1 | GO:0002252 | immune effector process | 8.01e-15 | 9.5e-136 |
| CD19+ B | gobp | L1 | GO:0002682 | regulation of immune system process | 2.95e-15 | 9.44e-132 |
| CD19+ B | gobp | L1 | GO:0050776 | regulation of immune response | 7e-16 | 1.44e-98 |
| CD19+ B | gobp | L1 | GO:0051716 | cellular response to stimulus | 6.02e-16 | 0 |
| CD19+ B | gobp | L1 | GO:0006950 | response to stress | 4.51e-16 | 7.19e-233 |
| CD19+ B | gobp | L1 | GO:0007154 | cell communication | 1.39e-16 | 2.2399997657715e-317 |
| CD19+ B | gobp | L1 | GO:0034097 | response to cytokine | 1.28e-16 | 8.55e-99 |
| CD19+ B | gobp | L2 | GO:0045047 | protein targeting to ER | 0.962 | 2.53e-36 |
| CD19+ B | gobp | L2 | GO:0006613 | cotranslational protein targeting to membrane | 0.0208 | 1.98e-34 |
| CD19+ B | gobp | L2 | GO:0072599 | establishment of protein localization to endoplasmic reticulum | 0.0138 | 8.26e-35 |
| CD19+ B | gobp | L2 | GO:0006614 | SRP-dependent cotranslational protein targeting to membrane | 0.00332 | 9.43e-33 |
| CD19+ B | gobp | L2 | GO:0070972 | protein localization to endoplasmic reticulum | 2.52e-07 | 1.06e-33 |
| CD19+ B | gobp | L2 | GO:0006413 | translational initiation | 2.2e-12 | 1.35e-36 |
| CD19+ B | gobp | L2 | GO:0000184 | nuclear-transcribed mRNA catabolic process, nonsense-mediated decay | 1.77e-14 | 3.49e-24 |
| CD19+ B | gobp | L2 | GO:0006612 | protein targeting to membrane | 4.35e-15 | 4.29e-29 |
| CD19+ B | gobp | L2 | GO:0043604 | amide biosynthetic process | 2.51e-18 | 9.42e-64 |
| CD19+ B | gobp | L2 | GO:0006518 | peptide metabolic process | 2.02e-18 | 4.63e-66 |
| CD19+ B | gobp | L3 | GO:0042773 | ATP synthesis coupled electron transport | 0.624 | 1.61e-25 |
| CD19+ B | gobp | L3 | GO:0042775 | mitochondrial ATP synthesis coupled electron transport | 0.36 | 4.06e-25 |
| CD19+ B | gobp | L3 | GO:0006119 | oxidative phosphorylation | 0.0162 | 2.08e-29 |
| CD19+ B | gobp | L3 | GO:0022904 | respiratory electron transport chain | 7.59e-05 | 3.6e-22 |
| CD19+ B | gobp | L3 | GO:0022900 | electron transport chain | 4.32e-06 | 6.53e-28 |
| CD19+ B | gobp | L3 | GO:0009123 | nucleoside monophosphate metabolic process | 6.14e-07 | 3.08e-41 |
| CD19+ B | gobp | L3 | GO:0046034 | ATP metabolic process | 1.52e-07 | 1.04e-34 |
| CD19+ B | gobp | L3 | GO:0009126 | purine nucleoside monophosphate metabolic process | 1.06e-07 | 7.48e-38 |
| CD19+ B | gobp | L3 | GO:0009167 | purine ribonucleoside monophosphate metabolic process | 1.06e-07 | 7.48e-38 |
| CD19+ B | gobp | L3 | GO:0009161 | ribonucleoside monophosphate metabolic process | 6.22e-08 | 4.79e-38 |
| CD19+ B | gobp | L5 | GO:0001775 | cell activation | 0.978 | 4.43e-165 |
| CD19+ B | gobp | L5 | GO:0045321 | leukocyte activation | 0.0217 | 7.69e-152 |
| CD19+ B | gobp | L5 | GO:0002366 | leukocyte activation involved in immune response | 0.00012 | 1.41e-97 |
| CD19+ B | gobp | L5 | GO:0002263 | cell activation involved in immune response | 0.000112 | 8.24e-98 |
| CD19+ B | gobp | L5 | GO:0045055 | regulated exocytosis | 1.89e-05 | 1.34e-88 |
| CD19+ B | gobp | L5 | GO:0006955 | immune response | 1.46e-05 | 1.15e-202 |
| CD19+ B | gobp | L5 | GO:0002252 | immune effector process | 8.26e-06 | 9.5e-136 |
| CD19+ B | gobp | L5 | GO:0002274 | myeloid leukocyte activation | 8.07e-06 | 1.7e-87 |
| CD19+ B | gobp | L5 | GO:0002444 | myeloid leukocyte mediated immunity | 3.59e-06 | 3.55e-79 |
| CD19+ B | gobp | L5 | GO:0042119 | neutrophil activation | 2.34e-06 | 2.04e-73 |
| CD19+ B | gobp | L6 | GO:0008380 | RNA splicing | 0.823 | 2.99e-36 |
| CD19+ B | gobp | L6 | GO:0000377 | RNA splicing, via transesterification reactions with bulged adenosine as nucleophile | 0.0492 | 3.39e-28 |
| CD19+ B | gobp | L6 | GO:0000398 | mRNA splicing, via spliceosome | 0.0492 | 3.39e-28 |
| CD19+ B | gobp | L6 | GO:0000375 | RNA splicing, via transesterification reactions | 0.0326 | 6.89e-28 |
| CD19+ B | gobp | L6 | GO:0006397 | mRNA processing | 0.0169 | 4.15e-35 |
| CD19+ B | gobp | L6 | GO:0050684 | regulation of mRNA processing | 0.00633 | 6.49e-18 |
| CD19+ B | gobp | L6 | GO:0043484 | regulation of RNA splicing | 0.00555 | 1.88e-17 |
| CD19+ B | gobp | L6 | GO:0000380 | alternative mRNA splicing, via spliceosome | 0.00085 | 7.77e-12 |
| CD19+ B | gobp | L6 | GO:0016071 | mRNA metabolic process | 0.000744 | 1.88e-61 |
| CD19+ B | gobp | L6 | GO:0006338 | chromatin remodeling | 0.00065 | 8.45e-20 |
gobp_nr
Adding missing grouping variables: `celltype`, `db`, `component`
`mutate_if()` ignored the following grouping variables:| celltype | db | component | geneSet | description | alpha | pValueHypergeometric |
|---|---|---|---|---|---|---|
| CD19+ B | gobp_nr | L1 | GO:0002446 | neutrophil mediated immunity | 0.515 | 4.78e-71 |
| CD19+ B | gobp_nr | L1 | GO:0036230 | granulocyte activation | 0.485 | 2.94e-71 |
| CD19+ B | gobp_nr | L1 | GO:0002576 | platelet degranulation | 2.06e-13 | 1.66e-18 |
| CD19+ B | gobp_nr | L1 | GO:0001906 | cell killing | 8.55e-14 | 2.12e-20 |
| CD19+ B | gobp_nr | L1 | GO:0034109 | homotypic cell-cell adhesion | 2.66e-14 | 3.44e-13 |
| CD19+ B | gobp_nr | L1 | GO:0006338 | chromatin remodeling | 2.38e-14 | 3.84e-19 |
| CD19+ B | gobp_nr | L1 | GO:0051647 | nucleus localization | 2.14e-14 | 8.32e-08 |
| CD19+ B | gobp_nr | L1 | GO:0034612 | response to tumor necrosis factor | 1.88e-14 | 3.93e-24 |
| CD19+ B | gobp_nr | L1 | GO:0070661 | leukocyte proliferation | 1.81e-14 | 5.37e-36 |
| CD19+ B | gobp_nr | L1 | GO:0002250 | adaptive immune response | 1.77e-14 | 4.83e-44 |
| CD19+ B | gobp_nr | L2 | GO:0070972 | protein localization to endoplasmic reticulum | 1 | 7.38e-33 |
| CD19+ B | gobp_nr | L2 | GO:0006413 | translational initiation | 4.2e-05 | 1.46e-35 |
| CD19+ B | gobp_nr | L2 | GO:0090150 | establishment of protein localization to membrane | 4.14e-11 | 2.77e-32 |
| CD19+ B | gobp_nr | L2 | GO:0006605 | protein targeting | 5.31e-12 | 1.7e-36 |
| CD19+ B | gobp_nr | L2 | GO:0002181 | cytoplasmic translation | 2.5e-12 | 3.18e-14 |
| CD19+ B | gobp_nr | L2 | GO:0006401 | RNA catabolic process | 1.44e-12 | 4.75e-29 |
| CD19+ B | gobp_nr | L2 | GO:0051647 | nucleus localization | 3.76e-13 | 8.32e-08 |
| CD19+ B | gobp_nr | L2 | GO:0002576 | platelet degranulation | 2.86e-13 | 1.66e-18 |
| CD19+ B | gobp_nr | L2 | GO:0072348 | sulfur compound transport | 2.13e-13 | 0.869 |
| CD19+ B | gobp_nr | L2 | GO:0006338 | chromatin remodeling | 1.69e-13 | 3.84e-19 |
| CD19+ B | gobp_nr | L4 | GO:0009123 | nucleoside monophosphate metabolic process | 0.984 | 7.37e-40 |
| CD19+ B | gobp_nr | L4 | GO:0009141 | nucleoside triphosphate metabolic process | 0.0154 | 2.01e-35 |
| CD19+ B | gobp_nr | L4 | GO:0006091 | generation of precursor metabolites and energy | 8.63e-05 | 7.23e-39 |
| CD19+ B | gobp_nr | L4 | GO:0009259 | ribonucleotide metabolic process | 1.7e-05 | 4.05e-37 |
| CD19+ B | gobp_nr | L4 | GO:0002576 | platelet degranulation | 3.54e-06 | 1.66e-18 |
| CD19+ B | gobp_nr | L4 | GO:0010257 | NADH dehydrogenase complex assembly | 3.51e-06 | 2.29e-11 |
| CD19+ B | gobp_nr | L4 | GO:0033108 | mitochondrial respiratory chain complex assembly | 2.51e-06 | 3.9e-13 |
| CD19+ B | gobp_nr | L4 | GO:0006338 | chromatin remodeling | 1.93e-06 | 3.84e-19 |
| CD19+ B | gobp_nr | L4 | GO:0051647 | nucleus localization | 1.19e-06 | 8.32e-08 |
| CD19+ B | gobp_nr | L4 | GO:0008380 | RNA splicing | 1.09e-06 | 9.42e-35 |
| CD19+ B | gobp_nr | L5 | GO:0002764 | immune response-regulating signaling pathway | 0.996 | 8.09e-55 |
| CD19+ B | gobp_nr | L5 | GO:0002250 | adaptive immune response | 0.00109 | 4.83e-44 |
| CD19+ B | gobp_nr | L5 | GO:0070661 | leukocyte proliferation | 0.00031 | 5.37e-36 |
| CD19+ B | gobp_nr | L5 | GO:0002694 | regulation of leukocyte activation | 0.000186 | 4.27e-53 |
| CD19+ B | gobp_nr | L5 | GO:0045088 | regulation of innate immune response | 0.000112 | 2.14e-33 |
| CD19+ B | gobp_nr | L5 | GO:0042113 | B cell activation | 0.000102 | 1.31e-32 |
| CD19+ B | gobp_nr | L5 | GO:0050867 | positive regulation of cell activation | 8.82e-05 | 6.76e-38 |
| CD19+ B | gobp_nr | L5 | GO:0009615 | response to virus | 8.7e-05 | 2.4e-28 |
| CD19+ B | gobp_nr | L5 | GO:0002576 | platelet degranulation | 8.44e-05 | 1.66e-18 |
| CD19+ B | gobp_nr | L5 | GO:0034612 | response to tumor necrosis factor | 7.43e-05 | 3.93e-24 |
gomf
Adding missing grouping variables: `celltype`, `db`, `component`
`mutate_if()` ignored the following grouping variables:| celltype | db | component | geneSet | description | alpha | pValueHypergeometric |
|---|---|---|---|---|---|---|
| CD19+ B | gomf | L1 | GO:0003723 | RNA binding | 1 | 3.71e-127 |
| CD19+ B | gomf | L1 | GO:0005515 | protein binding | 0.000249 | 0 |
| CD19+ B | gomf | L1 | GO:0044877 | protein-containing complex binding | 9.71e-07 | 9.7e-70 |
| CD19+ B | gomf | L1 | GO:0042802 | identical protein binding | 8.91e-07 | 4.01e-91 |
| CD19+ B | gomf | L1 | GO:0046983 | protein dimerization activity | 3.56e-07 | 1.07e-65 |
| CD19+ B | gomf | L1 | GO:0019899 | enzyme binding | 2.08e-07 | 2.79e-122 |
| CD19+ B | gomf | L1 | GO:0042803 | protein homodimerization activity | 1.51e-07 | 1.04e-48 |
| CD19+ B | gomf | L1 | GO:0003682 | chromatin binding | 1.09e-07 | 3.34e-34 |
| CD19+ B | gomf | L1 | GO:0019904 | protein domain specific binding | 4.16e-08 | 9.31e-44 |
| CD19+ B | gomf | L1 | GO:0009055 | electron transfer activity | 3.72e-08 | 5.05e-16 |
| CD19+ B | gomf | L2 | GO:0000981 | DNA-binding transcription factor activity, RNA polymerase II-specific | 0.995 | 1.94e-16 |
| CD19+ B | gomf | L2 | GO:0003700 | DNA-binding transcription factor activity | 0.005 | 2.74e-20 |
| CD19+ B | gomf | L2 | GO:0140110 | transcription regulator activity | 5.42e-08 | 5.42e-34 |
| CD19+ B | gomf | L2 | GO:0003677 | DNA binding | 2.18e-10 | 9.7e-50 |
| CD19+ B | gomf | L2 | GO:0003676 | nucleic acid binding | 5.53e-15 | 1.45e-148 |
| CD19+ B | gomf | L2 | GO:1901363 | heterocyclic compound binding | 5.96e-17 | 3.22e-226 |
| CD19+ B | gomf | L2 | GO:0097159 | organic cyclic compound binding | 2.02e-17 | 4e-231 |
| CD19+ B | gomf | L2 | GO:0046872 | metal ion binding | 1.27e-19 | 1.55e-94 |
| CD19+ B | gomf | L2 | GO:0000976 | transcription regulatory region sequence-specific DNA binding | 1.24e-19 | 5.23e-34 |
| CD19+ B | gomf | L2 | GO:0044212 | transcription regulatory region DNA binding | 9.57e-20 | 5.77e-36 |
| CD19+ B | gomf | L3 | GO:0000977 | RNA polymerase II regulatory region sequence-specific DNA binding | 0.487 | 2.82e-34 |
| CD19+ B | gomf | L3 | GO:0001012 | RNA polymerase II regulatory region DNA binding | 0.431 | 2.66e-34 |
| CD19+ B | gomf | L3 | GO:0000987 | proximal promoter sequence-specific DNA binding | 0.0364 | 8.33e-30 |
| CD19+ B | gomf | L3 | GO:0000978 | RNA polymerase II proximal promoter sequence-specific DNA binding | 0.0242 | 2.66e-29 |
| CD19+ B | gomf | L3 | GO:0000976 | transcription regulatory region sequence-specific DNA binding | 0.0131 | 5.23e-34 |
| CD19+ B | gomf | L3 | GO:0003690 | double-stranded DNA binding | 0.00581 | 8.31e-44 |
| CD19+ B | gomf | L3 | GO:1990837 | sequence-specific double-stranded DNA binding | 0.00128 | 1.07e-35 |
| CD19+ B | gomf | L3 | GO:0001067 | regulatory region nucleic acid binding | 0.000374 | 1.99e-36 |
| CD19+ B | gomf | L3 | GO:0044212 | transcription regulatory region DNA binding | 0.000265 | 5.77e-36 |
| CD19+ B | gomf | L3 | GO:0043565 | sequence-specific DNA binding | 2.39e-05 | 2.54e-38 |
| CD19+ B | gomf | L6 | GO:0003735 | structural constituent of ribosome | 0.995 | 2.99e-32 |
| CD19+ B | gomf | L6 | GO:0003823 | antigen binding | 0.000162 | 1.69e-12 |
| CD19+ B | gomf | L6 | GO:0016860 | intramolecular oxidoreductase activity | 0.000138 | 1.22e-11 |
| CD19+ B | gomf | L6 | GO:0005070 | SH3/SH2 adaptor activity | 9.78e-05 | 2.28e-12 |
| CD19+ B | gomf | L6 | GO:0042287 | MHC protein binding | 4.95e-05 | 9.76e-09 |
| CD19+ B | gomf | L6 | GO:0009055 | electron transfer activity | 4.49e-05 | 5.05e-16 |
| CD19+ B | gomf | L6 | GO:0005515 | protein binding | 4.4e-05 | 0 |
| CD19+ B | gomf | L6 | GO:0030276 | clathrin binding | 3.62e-05 | 1.18e-09 |
| CD19+ B | gomf | L6 | GO:0004842 | ubiquitin-protein transferase activity | 3.19e-05 | 1.3e-05 |
| CD19+ B | gomf | L6 | GO:0061659 | ubiquitin-like protein ligase activity | 3e-05 | 0.0152 |
| CD19+ B | gomf | L7 | GO:0003954 | NADH dehydrogenase activity | 0.326 | 1.39e-13 |
| CD19+ B | gomf | L7 | GO:0008137 | NADH dehydrogenase (ubiquinone) activity | 0.218 | 3.41e-13 |
| CD19+ B | gomf | L7 | GO:0050136 | NADH dehydrogenase (quinone) activity | 0.218 | 3.41e-13 |
| CD19+ B | gomf | L7 | GO:0016655 | oxidoreductase activity, acting on NAD(P)H, quinone or similar compound as acceptor | 0.177 | 1.32e-14 |
| CD19+ B | gomf | L7 | GO:0016651 | oxidoreductase activity, acting on NAD(P)H | 0.0382 | 2.2e-17 |
| CD19+ B | gomf | L7 | GO:0009055 | electron transfer activity | 0.00115 | 5.05e-16 |
| CD19+ B | gomf | L7 | GO:0003823 | antigen binding | 0.000759 | 1.69e-12 |
| CD19+ B | gomf | L7 | GO:0016491 | oxidoreductase activity | 0.000748 | 1.41e-45 |
| CD19+ B | gomf | L7 | GO:0016860 | intramolecular oxidoreductase activity | 0.000667 | 1.22e-11 |
| CD19+ B | gomf | L7 | GO:0005070 | SH3/SH2 adaptor activity | 0.000431 | 2.28e-12 |
kegg
Adding missing grouping variables: `celltype`, `db`, `component`
`mutate_if()` ignored the following grouping variables:| celltype | db | component | geneSet | description | alpha | pValueHypergeometric |
|---|---|---|---|---|---|---|
| CD19+ B | kegg | L1 | hsa00190 | Oxidative phosphorylation | 0.998 | 5.03e-29 |
| CD19+ B | kegg | L1 | hsa05012 | Parkinson disease | 0.002 | 3.7e-27 |
| CD19+ B | kegg | L1 | hsa05010 | Alzheimer disease | 1.62e-05 | 9.68e-28 |
| CD19+ B | kegg | L1 | hsa05016 | Huntington disease | 3.95e-07 | 1.19e-24 |
| CD19+ B | kegg | L1 | hsa04714 | Thermogenesis | 4.8e-08 | 9e-25 |
| CD19+ B | kegg | L1 | hsa04932 | Non-alcoholic fatty liver disease (NAFLD) | 6.5e-09 | 5.27e-19 |
| CD19+ B | kegg | L1 | hsa04260 | Cardiac muscle contraction | 1.33e-09 | 7.49e-10 |
| CD19+ B | kegg | L1 | hsa00770 | Pantothenate and CoA biosynthesis | 1.13e-09 | 0.941 |
| CD19+ B | kegg | L1 | hsa04512 | ECM-receptor interaction | 9.86e-10 | 0.295 |
| CD19+ B | kegg | L1 | hsa01200 | Carbon metabolism | 8.65e-10 | 3.34e-16 |
| CD19+ B | kegg | L2 | hsa04640 | Hematopoietic cell lineage | 1 | 8.55e-21 |
| CD19+ B | kegg | L2 | hsa05332 | Graft-versus-host disease | 5.56e-05 | 4.22e-13 |
| CD19+ B | kegg | L2 | hsa04659 | Th17 cell differentiation | 1.8e-05 | 1.16e-18 |
| CD19+ B | kegg | L2 | hsa05330 | Allograft rejection | 1.73e-05 | 1.73e-11 |
| CD19+ B | kegg | L2 | hsa04940 | Type I diabetes mellitus | 1.69e-05 | 1.14e-11 |
| CD19+ B | kegg | L2 | hsa04658 | Th1 and Th2 cell differentiation | 1.06e-05 | 1.86e-16 |
| CD19+ B | kegg | L2 | hsa04612 | Antigen processing and presentation | 1.05e-05 | 2.11e-14 |
| CD19+ B | kegg | L2 | hsa05169 | Epstein-Barr virus infection | 7.29e-06 | 1.83e-25 |
| CD19+ B | kegg | L2 | hsa05340 | Primary immunodeficiency | 6e-06 | 1.13e-09 |
| CD19+ B | kegg | L2 | hsa05320 | Autoimmune thyroid disease | 5.57e-06 | 4.12e-10 |
| CD19+ B | kegg | L3 | hsa03010 | Ribosome | 1 | 3.25e-30 |
| CD19+ B | kegg | L3 | hsa00770 | Pantothenate and CoA biosynthesis | 8.95e-10 | 0.941 |
| CD19+ B | kegg | L3 | hsa04512 | ECM-receptor interaction | 7.99e-10 | 0.295 |
| CD19+ B | kegg | L3 | hsa03022 | Basal transcription factors | 5.84e-10 | 0.722 |
| CD19+ B | kegg | L3 | hsa00330 | Arginine and proline metabolism | 5.81e-10 | 2.21e-09 |
| CD19+ B | kegg | L3 | hsa00900 | Terpenoid backbone biosynthesis | 4.47e-10 | 0.845 |
| CD19+ B | kegg | L3 | hsa00062 | Fatty acid elongation | 4.24e-10 | 1.89e-07 |
| CD19+ B | kegg | L3 | hsa05202 | Transcriptional misregulation in cancer | 4.09e-10 | 2.41e-21 |
| CD19+ B | kegg | L3 | hsa03050 | Proteasome | 3.89e-10 | 1.38e-09 |
| CD19+ B | kegg | L3 | hsa01200 | Carbon metabolism | 3.7e-10 | 3.34e-16 |
reactome
Adding missing grouping variables: `celltype`, `db`, `component`
`mutate_if()` ignored the following grouping variables:| celltype | db | component | geneSet | description | alpha | pValueHypergeometric |
|---|---|---|---|---|---|---|
| CD19+ B | reactome | L1 | R-HSA-168256 | Immune System | 1 | 7.93e-180 |
| CD19+ B | reactome | L1 | R-HSA-168249 | Innate Immune System | 9.79e-22 | 4.95e-110 |
| CD19+ B | reactome | L1 | R-HSA-1280218 | Adaptive Immune System | 2.36e-22 | 1.32e-59 |
| CD19+ B | reactome | L1 | R-HSA-6798695 | Neutrophil degranulation | 1.89e-29 | 1.03e-66 |
| CD19+ B | reactome | L1 | R-HSA-1280215 | Cytokine Signaling in Immune system | 8.78e-32 | 2.62e-67 |
| CD19+ B | reactome | L1 | R-HSA-449147 | Signaling by Interleukins | 6.96e-37 | 3.43e-47 |
| CD19+ B | reactome | L1 | R-HSA-198933 | Immunoregulatory interactions between a Lymphoid and a non-Lymphoid cell | 6.1e-37 | 3.33e-27 |
| CD19+ B | reactome | L1 | R-HSA-983169 | Class I MHC mediated antigen processing & presentation | 1.43e-37 | 4.42e-14 |
| CD19+ B | reactome | L1 | R-HSA-983168 | Antigen processing: Ubiquitination & Proteasome degradation | 6.01e-39 | 6.66e-09 |
| CD19+ B | reactome | L1 | R-HSA-6785807 | Interleukin-4 and Interleukin-13 signaling | 8.15e-40 | 1.82e-19 |
| CD19+ B | reactome | L2 | R-HSA-156842 | Eukaryotic Translation Elongation | 0.761 | 7.99e-32 |
| CD19+ B | reactome | L2 | R-HSA-156902 | Peptide chain elongation | 0.124 | 1.39e-30 |
| CD19+ B | reactome | L2 | R-HSA-192823 | Viral mRNA Translation | 0.0668 | 1.39e-30 |
| CD19+ B | reactome | L2 | R-HSA-2408557 | Selenocysteine synthesis | 0.0256 | 9.15e-31 |
| CD19+ B | reactome | L2 | R-HSA-72764 | Eukaryotic Translation Termination | 0.0169 | 9.15e-31 |
| CD19+ B | reactome | L2 | R-HSA-72689 | Formation of a pool of free 40S subunits | 0.00282 | 2.88e-31 |
| CD19+ B | reactome | L2 | R-HSA-1799339 | SRP-dependent cotranslational protein targeting to membrane | 0.0023 | 2.25e-34 |
| CD19+ B | reactome | L2 | R-HSA-72706 | GTP hydrolysis and joining of the 60S ribosomal subunit | 0.000534 | 4.39e-33 |
| CD19+ B | reactome | L2 | R-HSA-156827 | L13a-mediated translational silencing of Ceruloplasmin expression | 0.000372 | 1.1e-32 |
| CD19+ B | reactome | L2 | R-HSA-2408522 | Selenoamino acid metabolism | 7.31e-05 | 4.84e-31 |
| CD19+ B | reactome | L3 | R-HSA-74160 | Gene expression (Transcription) | 0.886 | 8.3e-30 |
| CD19+ B | reactome | L3 | R-HSA-212436 | Generic Transcription Pathway | 0.0726 | 2.3e-21 |
| CD19+ B | reactome | L3 | R-HSA-73857 | RNA Polymerase II Transcription | 0.0417 | 4.5e-27 |
| CD19+ B | reactome | L3 | R-HSA-211000 | Gene Silencing by RNA | 7.75e-06 | 0.277 |
| CD19+ B | reactome | L3 | R-HSA-159231 | Transport of Mature mRNA Derived from an Intronless Transcript | 2.77e-07 | 0.415 |
| CD19+ B | reactome | L3 | R-HSA-159234 | Transport of Mature mRNAs Derived from Intronless Transcripts | 1.86e-07 | 0.34 |
| CD19+ B | reactome | L3 | R-HSA-5578749 | Transcriptional regulation by small RNAs | 1.51e-07 | 0.0743 |
| CD19+ B | reactome | L3 | R-HSA-72766 | Translation | 1.5e-07 | 1.05e-46 |
| CD19+ B | reactome | L3 | R-HSA-6807505 | RNA polymerase II transcribes snRNA genes | 1.04e-07 | 0.208 |
| CD19+ B | reactome | L3 | R-HSA-159227 | Transport of the SLBP independent Mature mRNA | 9.38e-08 | 0.463 |
| CD19+ B | reactome | L4 | R-HSA-163200 | Respiratory electron transport, ATP synthesis by chemiosmotic coupling, and heat production by uncoupling proteins. | 0.845 | 9.26e-26 |
| CD19+ B | reactome | L4 | R-HSA-1428517 | The citric acid (TCA) cycle and respiratory electron transport | 0.149 | 5.56e-29 |
| CD19+ B | reactome | L4 | R-HSA-611105 | Respiratory electron transport | 0.00565 | 1.02e-20 |
| CD19+ B | reactome | L4 | R-HSA-6799198 | Complex I biogenesis | 4.24e-08 | 9.82e-11 |
| CD19+ B | reactome | L4 | R-HSA-8949613 | Cristae formation | 3.73e-08 | 1.08e-09 |
| CD19+ B | reactome | L4 | R-HSA-163210 | Formation of ATP by chemiosmotic coupling | 1.26e-08 | 5.78e-07 |
| CD19+ B | reactome | L4 | R-HSA-1430728 | Metabolism | 6.68e-09 | 1.35e-133 |
| CD19+ B | reactome | L4 | R-HSA-3700989 | Transcriptional Regulation by TP53 | 6.43e-09 | 9.38e-20 |
| CD19+ B | reactome | L4 | R-HSA-199220 | Vitamin B5 (pantothenate) metabolism | 4.79e-09 | 0.979 |
| CD19+ B | reactome | L4 | R-HSA-983189 | Kinesins | 4.28e-09 | 0.251 |
| CD19+ B | reactome | L5 | R-HSA-983168 | Antigen processing: Ubiquitination & Proteasome degradation | 0.997 | 6.66e-09 |
| CD19+ B | reactome | L5 | R-HSA-983169 | Class I MHC mediated antigen processing & presentation | 0.00295 | 4.42e-14 |
| CD19+ B | reactome | L5 | R-HSA-8951664 | Neddylation | 3.74e-11 | 1.11e-09 |
| CD19+ B | reactome | L5 | R-HSA-1280218 | Adaptive Immune System | 1.52e-13 | 1.32e-59 |
| CD19+ B | reactome | L5 | R-HSA-5619115 | Disorders of transmembrane transporters | 9.64e-14 | 4.41e-06 |
| CD19+ B | reactome | L5 | R-HSA-4608870 | Asymmetric localization of PCP proteins | 2.67e-14 | 2.61e-08 |
| CD19+ B | reactome | L5 | R-HSA-5358346 | Hedgehog ligand biogenesis | 2.13e-14 | 1.31e-08 |
| CD19+ B | reactome | L5 | R-HSA-597592 | Post-translational protein modification | 1.77e-14 | 1.43e-43 |
| CD19+ B | reactome | L5 | R-HSA-4641258 | Degradation of DVL | 1.33e-14 | 1.32e-09 |
| CD19+ B | reactome | L5 | R-HSA-4641257 | Degradation of AXIN | 1.26e-14 | 2.79e-09 |
| CD19+ B | reactome | L6 | R-HSA-180585 | Vif-mediated degradation of APOBEC3G | 0.749 | 2.43e-13 |
| CD19+ B | reactome | L6 | R-HSA-1234176 | Oxygen-dependent proline hydroxylation of Hypoxia-inducible Factor Alpha | 0.0314 | 1.74e-13 |
| CD19+ B | reactome | L6 | R-HSA-211733 | Regulation of activated PAK-2p34 by proteasome mediated degradation | 0.0252 | 7.19e-12 |
| CD19+ B | reactome | L6 | R-HSA-69601 | Ubiquitin Mediated Degradation of Phosphorylated Cdc25A | 0.0239 | 5.42e-12 |
| CD19+ B | reactome | L6 | R-HSA-69610 | p53-Independent DNA Damage Response | 0.0239 | 5.42e-12 |
| CD19+ B | reactome | L6 | R-HSA-69613 | p53-Independent G1/S DNA damage checkpoint | 0.0239 | 5.42e-12 |
| CD19+ B | reactome | L6 | R-HSA-69541 | Stabilization of p53 | 0.0221 | 1.74e-12 |
| CD19+ B | reactome | L6 | R-HSA-69229 | Ubiquitin-dependent degradation of Cyclin D1 | 0.0116 | 1.24e-11 |
| CD19+ B | reactome | L6 | R-HSA-75815 | Ubiquitin-dependent degradation of Cyclin D | 0.0116 | 1.24e-11 |
| CD19+ B | reactome | L6 | R-HSA-180534 | Vpu mediated degradation of CD4 | 0.0116 | 1.24e-11 |
| CD19+ B | reactome | L7 | R-HSA-72163 | mRNA Splicing - Major Pathway | 0.546 | 1.51e-22 |
| CD19+ B | reactome | L7 | R-HSA-72172 | mRNA Splicing | 0.444 | 6.08e-23 |
| CD19+ B | reactome | L7 | R-HSA-109688 | Cleavage of Growing Transcript in the Termination Region | 0.00106 | 1.75e-08 |
| CD19+ B | reactome | L7 | R-HSA-73856 | RNA Polymerase II Transcription Termination | 0.00106 | 1.75e-08 |
| CD19+ B | reactome | L7 | R-HSA-72203 | Processing of Capped Intron-Containing Pre-mRNA | 0.000369 | 5.75e-20 |
| CD19+ B | reactome | L7 | R-HSA-72187 | mRNA 3’-end processing | 0.000246 | 3.86e-07 |
| CD19+ B | reactome | L7 | R-HSA-983189 | Kinesins | 0.000154 | 0.251 |
| CD19+ B | reactome | L7 | R-HSA-72766 | Translation | 0.000116 | 1.05e-46 |
| CD19+ B | reactome | L7 | R-HSA-198933 | Immunoregulatory interactions between a Lymphoid and a non-Lymphoid cell | 0.000108 | 3.33e-27 |
| CD19+ B | reactome | L7 | R-HSA-199220 | Vitamin B5 (pantothenate) metabolism | 0.000107 | 0.979 |
| CD19+ B | reactome | L8 | R-HSA-76005 | Response to elevated platelet cytosolic Ca2+ | 0.706 | 1.61e-20 |
| CD19+ B | reactome | L8 | R-HSA-114608 | Platelet degranulation | 0.231 | 3.96e-19 |
| CD19+ B | reactome | L8 | R-HSA-76002 | Platelet activation, signaling and aggregation | 0.0249 | 1.77e-29 |
| CD19+ B | reactome | L8 | R-HSA-199220 | Vitamin B5 (pantothenate) metabolism | 0.000717 | 0.979 |
| CD19+ B | reactome | L8 | R-HSA-8862803 | Deregulated CDK5 triggers multiple neurodegenerative pathways in Alzheimer’s disease models | 0.000709 | 3.44e-08 |
| CD19+ B | reactome | L8 | R-HSA-8863678 | Neurodegenerative Diseases | 0.000709 | 3.44e-08 |
| CD19+ B | reactome | L8 | R-HSA-983189 | Kinesins | 0.000665 | 0.251 |
| CD19+ B | reactome | L8 | R-HSA-198933 | Immunoregulatory interactions between a Lymphoid and a non-Lymphoid cell | 0.000475 | 3.33e-27 |
| CD19+ B | reactome | L8 | R-HSA-72766 | Translation | 0.000472 | 1.05e-46 |
| CD19+ B | reactome | L8 | R-HSA-159231 | Transport of Mature mRNA Derived from an Intronless Transcript | 0.000452 | 0.415 |
wikipathway_cancer
Adding missing grouping variables: `celltype`, `db`, `component`
`mutate_if()` ignored the following grouping variables:| celltype | db | component | geneSet | description | alpha | pValueHypergeometric |
|---|---|---|---|---|---|---|
| CD19+ B | wikipathway_cancer | L1 | WP619 | Type II interferon signaling (IFNG) | 1 | 2.26e-11 |
| CD19+ B | wikipathway_cancer | L1 | WP4585 | Cancer immunotherapy by PD-1 blockade | 1.94e-05 | 2.48e-07 |
| CD19+ B | wikipathway_cancer | L1 | WP254 | Apoptosis | 1.49e-05 | 1.7e-15 |
| CD19+ B | wikipathway_cancer | L1 | WP3617 | Photodynamic therapy-induced NF-kB survival signaling | 7.98e-06 | 2.04e-07 |
| CD19+ B | wikipathway_cancer | L1 | WP4284 | Ultraconserved region 339 modulation of tumor suppressor microRNAs in cancer | 7.93e-06 | 1 |
| CD19+ B | wikipathway_cancer | L1 | WP4204 | Tumor suppressor activity of SMARCB1 | 6.9e-06 | 4.57e-07 |
| CD19+ B | wikipathway_cancer | L1 | WP585 | Interferon type I signaling pathways | 5.45e-06 | 5.84e-09 |
| CD19+ B | wikipathway_cancer | L1 | WP704 | Methylation Pathways | 5.38e-06 | 0.00357 |
| CD19+ B | wikipathway_cancer | L1 | WP2868 | TCA Cycle Nutrient Utilization and Invasiveness of Ovarian Cancer | 5.24e-06 | 0.0234 |
| CD19+ B | wikipathway_cancer | L1 | WP364 | IL-6 signaling pathway | 4.33e-06 | 7.41e-07 |
wikipathway
Adding missing grouping variables: `celltype`, `db`, `component`
`mutate_if()` ignored the following grouping variables:| celltype | db | component | geneSet | description | alpha | pValueHypergeometric |
|---|---|---|---|---|---|---|
| CD19+ B | wikipathway | L1 | WP477 | Cytoplasmic Ribosomal Proteins | 1 | 1.25e-28 |
| CD19+ B | wikipathway | L1 | WP619 | Type II interferon signaling (IFNG) | 4.55e-15 | 2.43e-11 |
| CD19+ B | wikipathway | L1 | WP4150 | Wnt Signaling in Kidney Disease | 4.55e-15 | 0.951 |
| CD19+ B | wikipathway | L1 | WP3945 | TYROBP Causal Network | 3.5e-15 | 2.45e-14 |
| CD19+ B | wikipathway | L1 | WP3995 | Prion disease pathway | 3.46e-15 | 9.73e-11 |
| CD19+ B | wikipathway | L1 | WP183 | Proteasome Degradation | 2.71e-15 | 2.45e-14 |
| CD19+ B | wikipathway | L1 | WP3613 | Photodynamic therapy-induced unfolded protein response | 1.94e-15 | 1.88e-08 |
| CD19+ B | wikipathway | L1 | WP254 | Apoptosis | 1.55e-15 | 2.83e-15 |
| CD19+ B | wikipathway | L1 | WP411 | mRNA Processing | 1.48e-15 | 3.38e-19 |
| CD19+ B | wikipathway | L1 | WP311 | Synthesis and Degradation of Ketone Bodies | 1.4e-15 | 1 |
| CD19+ B | wikipathway | L2 | WP111 | Electron Transport Chain (OXPHOS system in mitochondria) | 1 | 4.73e-27 |
| CD19+ B | wikipathway | L2 | WP623 | Oxidative phosphorylation | 8.14e-05 | 1.25e-17 |
| CD19+ B | wikipathway | L2 | WP4396 | Nonalcoholic fatty liver disease | 1.42e-08 | 8.84e-20 |
| CD19+ B | wikipathway | L2 | WP619 | Type II interferon signaling (IFNG) | 1.75e-09 | 2.43e-11 |
| CD19+ B | wikipathway | L2 | WP4150 | Wnt Signaling in Kidney Disease | 1.71e-09 | 0.951 |
| CD19+ B | wikipathway | L2 | WP3995 | Prion disease pathway | 1.35e-09 | 9.73e-11 |
| CD19+ B | wikipathway | L2 | WP183 | Proteasome Degradation | 1.12e-09 | 2.45e-14 |
| CD19+ B | wikipathway | L2 | WP3945 | TYROBP Causal Network | 1.09e-09 | 2.45e-14 |
| CD19+ B | wikipathway | L2 | WP4324 | Mitochondrial complex I assembly model OXPHOS system | 9.74e-10 | 1.62e-09 |
| CD19+ B | wikipathway | L2 | WP3613 | Photodynamic therapy-induced unfolded protein response | 7.54e-10 | 1.88e-08 |
CD56+ NK
gobp
Adding missing grouping variables: `celltype`, `db`, `component`
`mutate_if()` ignored the following grouping variables:| celltype | db | component | geneSet | description | alpha | pValueHypergeometric |
|---|---|---|---|---|---|---|
| CD56+ NK | gobp | L1 | GO:0002376 | immune system process | 1 | 2.95e-276 |
| CD56+ NK | gobp | L1 | GO:0006955 | immune response | 1.58e-06 | 5.77e-208 |
| CD56+ NK | gobp | L1 | GO:0001775 | cell activation | 2.16e-11 | 2.96e-167 |
| CD56+ NK | gobp | L1 | GO:0045321 | leukocyte activation | 3.07e-12 | 1.29e-156 |
| CD56+ NK | gobp | L1 | GO:0002252 | immune effector process | 5.34e-17 | 3.42e-142 |
| CD56+ NK | gobp | L1 | GO:0002682 | regulation of immune system process | 2.27e-21 | 2.93e-138 |
| CD56+ NK | gobp | L1 | GO:0050896 | response to stimulus | 9.83e-24 | 0 |
| CD56+ NK | gobp | L1 | GO:0050776 | regulation of immune response | 1.11e-25 | 1.72e-101 |
| CD56+ NK | gobp | L1 | GO:0002443 | leukocyte mediated immunity | 1.1e-25 | 1.43e-100 |
| CD56+ NK | gobp | L1 | GO:0002366 | leukocyte activation involved in immune response | 1.1e-25 | 2.94e-97 |
| CD56+ NK | gobp | L2 | GO:0045047 | protein targeting to ER | 0.683 | 9.5e-34 |
| CD56+ NK | gobp | L2 | GO:0072599 | establishment of protein localization to endoplasmic reticulum | 0.209 | 1.28e-33 |
| CD56+ NK | gobp | L2 | GO:0006614 | SRP-dependent cotranslational protein targeting to membrane | 0.0706 | 1.09e-31 |
| CD56+ NK | gobp | L2 | GO:0006613 | cotranslational protein targeting to membrane | 0.0375 | 6.69e-32 |
| CD56+ NK | gobp | L2 | GO:0070972 | protein localization to endoplasmic reticulum | 2.93e-06 | 2.39e-31 |
| CD56+ NK | gobp | L2 | GO:0006413 | translational initiation | 7.85e-09 | 1.09e-37 |
| CD56+ NK | gobp | L2 | GO:0000184 | nuclear-transcribed mRNA catabolic process, nonsense-mediated decay | 6.52e-10 | 6.67e-26 |
| CD56+ NK | gobp | L2 | GO:0006612 | protein targeting to membrane | 3.91e-11 | 4.75e-30 |
| CD56+ NK | gobp | L2 | GO:0090150 | establishment of protein localization to membrane | 4.07e-12 | 2.77e-40 |
| CD56+ NK | gobp | L2 | GO:0006518 | peptide metabolic process | 2.22e-13 | 5.37e-76 |
| CD56+ NK | gobp | L4 | GO:0006119 | oxidative phosphorylation | 0.982 | 2.92e-26 |
| CD56+ NK | gobp | L4 | GO:0009123 | nucleoside monophosphate metabolic process | 0.00536 | 3.2e-41 |
| CD56+ NK | gobp | L4 | GO:0042773 | ATP synthesis coupled electron transport | 0.00439 | 3.83e-19 |
| CD56+ NK | gobp | L4 | GO:0042775 | mitochondrial ATP synthesis coupled electron transport | 0.00291 | 8.79e-19 |
| CD56+ NK | gobp | L4 | GO:0009161 | ribonucleoside monophosphate metabolic process | 0.00187 | 6.51e-39 |
| CD56+ NK | gobp | L4 | GO:0009126 | purine nucleoside monophosphate metabolic process | 0.000901 | 2.43e-37 |
| CD56+ NK | gobp | L4 | GO:0009167 | purine ribonucleoside monophosphate metabolic process | 0.000901 | 2.43e-37 |
| CD56+ NK | gobp | L4 | GO:0022904 | respiratory electron transport chain | 0.000875 | 1.99e-19 |
| CD56+ NK | gobp | L4 | GO:0022900 | electron transport chain | 0.000494 | 8.54e-26 |
| CD56+ NK | gobp | L4 | GO:0046034 | ATP metabolic process | 0.000357 | 5.93e-33 |
| CD56+ NK | gobp | L5 | GO:0008380 | RNA splicing | 0.591 | 1.14e-39 |
| CD56+ NK | gobp | L5 | GO:0006397 | mRNA processing | 0.222 | 2.28e-42 |
| CD56+ NK | gobp | L5 | GO:0000375 | RNA splicing, via transesterification reactions | 0.0579 | 9.01e-32 |
| CD56+ NK | gobp | L5 | GO:0000377 | RNA splicing, via transesterification reactions with bulged adenosine as nucleophile | 0.054 | 1.55e-31 |
| CD56+ NK | gobp | L5 | GO:0000398 | mRNA splicing, via spliceosome | 0.054 | 1.55e-31 |
| CD56+ NK | gobp | L5 | GO:0016071 | mRNA metabolic process | 0.0141 | 3.47e-72 |
| CD56+ NK | gobp | L5 | GO:0097237 | cellular response to toxic substance | 0.000244 | 1.02e-31 |
| CD56+ NK | gobp | L5 | GO:0006333 | chromatin assembly or disassembly | 0.00021 | 2.36e-18 |
| CD56+ NK | gobp | L5 | GO:0006338 | chromatin remodeling | 0.000209 | 1.72e-19 |
| CD56+ NK | gobp | L5 | GO:0006518 | peptide metabolic process | 0.000182 | 5.37e-76 |
gobp_nr
Adding missing grouping variables: `celltype`, `db`, `component`
`mutate_if()` ignored the following grouping variables:| celltype | db | component | geneSet | description | alpha | pValueHypergeometric |
|---|---|---|---|---|---|---|
| CD56+ NK | gobp_nr | L1 | GO:0036230 | granulocyte activation | 0.665 | 8.81e-72 |
| CD56+ NK | gobp_nr | L1 | GO:0002446 | neutrophil mediated immunity | 0.335 | 8.54e-71 |
| CD56+ NK | gobp_nr | L1 | GO:0002764 | immune response-regulating signaling pathway | 2.1e-12 | 1.99e-58 |
| CD56+ NK | gobp_nr | L1 | GO:0002576 | platelet degranulation | 1.76e-12 | 1.71e-19 |
| CD56+ NK | gobp_nr | L1 | GO:0009615 | response to virus | 5.06e-13 | 1.72e-37 |
| CD56+ NK | gobp_nr | L1 | GO:0006909 | phagocytosis | 3.63e-13 | 1.64e-28 |
| CD56+ NK | gobp_nr | L1 | GO:0019882 | antigen processing and presentation | 3.59e-13 | 1.21e-21 |
| CD56+ NK | gobp_nr | L1 | GO:0052547 | regulation of peptidase activity | 3.36e-13 | 8.65e-35 |
| CD56+ NK | gobp_nr | L1 | GO:0046677 | response to antibiotic | 2.61e-13 | 4.55e-32 |
| CD56+ NK | gobp_nr | L1 | GO:0050953 | sensory perception of light stimulus | 2.6e-13 | 0.417 |
| CD56+ NK | gobp_nr | L2 | GO:0006413 | translational initiation | 0.995 | 9.23e-37 |
| CD56+ NK | gobp_nr | L2 | GO:0070972 | protein localization to endoplasmic reticulum | 0.00452 | 1.25e-30 |
| CD56+ NK | gobp_nr | L2 | GO:0090150 | establishment of protein localization to membrane | 1.69e-06 | 4.51e-39 |
| CD56+ NK | gobp_nr | L2 | GO:0006401 | RNA catabolic process | 1.66e-08 | 1.81e-35 |
| CD56+ NK | gobp_nr | L2 | GO:0006605 | protein targeting | 9.57e-09 | 1.52e-39 |
| CD56+ NK | gobp_nr | L2 | GO:0002181 | cytoplasmic translation | 7.05e-09 | 2.41e-14 |
| CD56+ NK | gobp_nr | L2 | GO:0009615 | response to virus | 2.02e-09 | 1.72e-37 |
| CD56+ NK | gobp_nr | L2 | GO:0002576 | platelet degranulation | 1.88e-09 | 1.71e-19 |
| CD56+ NK | gobp_nr | L2 | GO:0050953 | sensory perception of light stimulus | 1.41e-09 | 0.417 |
| CD56+ NK | gobp_nr | L2 | GO:0001578 | microtubule bundle formation | 1.29e-09 | 0.621 |
| CD56+ NK | gobp_nr | L3 | GO:0042110 | T cell activation | 0.986 | 3.06e-58 |
| CD56+ NK | gobp_nr | L3 | GO:0007159 | leukocyte cell-cell adhesion | 0.00655 | 4.2e-42 |
| CD56+ NK | gobp_nr | L3 | GO:0002764 | immune response-regulating signaling pathway | 0.00509 | 1.99e-58 |
| CD56+ NK | gobp_nr | L3 | GO:0002250 | adaptive immune response | 0.000849 | 5.42e-47 |
| CD56+ NK | gobp_nr | L3 | GO:0002521 | leukocyte differentiation | 0.000279 | 1.39e-54 |
| CD56+ NK | gobp_nr | L3 | GO:0009615 | response to virus | 0.000212 | 1.72e-37 |
| CD56+ NK | gobp_nr | L3 | GO:0022407 | regulation of cell-cell adhesion | 8.42e-05 | 2.73e-38 |
| CD56+ NK | gobp_nr | L3 | GO:0002576 | platelet degranulation | 6.71e-05 | 1.71e-19 |
| CD56+ NK | gobp_nr | L3 | GO:1903706 | regulation of hemopoiesis | 5e-05 | 1.65e-39 |
| CD56+ NK | gobp_nr | L3 | GO:0052547 | regulation of peptidase activity | 4.82e-05 | 8.65e-35 |
| CD56+ NK | gobp_nr | L4 | GO:0009123 | nucleoside monophosphate metabolic process | 0.982 | 5.28e-40 |
| CD56+ NK | gobp_nr | L4 | GO:0009141 | nucleoside triphosphate metabolic process | 0.0147 | 6.18e-35 |
| CD56+ NK | gobp_nr | L4 | GO:0033108 | mitochondrial respiratory chain complex assembly | 0.00158 | 9.5e-18 |
| CD56+ NK | gobp_nr | L4 | GO:0009259 | ribonucleotide metabolic process | 0.000451 | 6.21e-41 |
| CD56+ NK | gobp_nr | L4 | GO:0006091 | generation of precursor metabolites and energy | 0.000313 | 5.06e-40 |
| CD56+ NK | gobp_nr | L4 | GO:0010257 | NADH dehydrogenase complex assembly | 0.000241 | 2.31e-13 |
| CD56+ NK | gobp_nr | L4 | GO:0002576 | platelet degranulation | 7.6e-05 | 1.71e-19 |
| CD56+ NK | gobp_nr | L4 | GO:0050953 | sensory perception of light stimulus | 4.31e-05 | 0.417 |
| CD56+ NK | gobp_nr | L4 | GO:0009615 | response to virus | 3.8e-05 | 1.72e-37 |
| CD56+ NK | gobp_nr | L4 | GO:0001578 | microtubule bundle formation | 3.56e-05 | 0.621 |
| CD56+ NK | gobp_nr | L5 | GO:0042113 | B cell activation | 0.997 | 9.38e-38 |
| CD56+ NK | gobp_nr | L5 | GO:0002764 | immune response-regulating signaling pathway | 0.00108 | 1.99e-58 |
| CD56+ NK | gobp_nr | L5 | GO:0002250 | adaptive immune response | 0.000133 | 5.42e-47 |
| CD56+ NK | gobp_nr | L5 | GO:0002576 | platelet degranulation | 9.28e-05 | 1.71e-19 |
| CD56+ NK | gobp_nr | L5 | GO:0009615 | response to virus | 9.01e-05 | 1.72e-37 |
| CD56+ NK | gobp_nr | L5 | GO:0050953 | sensory perception of light stimulus | 6.15e-05 | 0.417 |
| CD56+ NK | gobp_nr | L5 | GO:0001578 | microtubule bundle formation | 5.35e-05 | 0.621 |
| CD56+ NK | gobp_nr | L5 | GO:0046677 | response to antibiotic | 4.37e-05 | 4.55e-32 |
| CD56+ NK | gobp_nr | L5 | GO:0052547 | regulation of peptidase activity | 3.7e-05 | 8.65e-35 |
| CD56+ NK | gobp_nr | L5 | GO:0006338 | chromatin remodeling | 3.63e-05 | 6.5e-19 |
gomf
Adding missing grouping variables: `celltype`, `db`, `component`
`mutate_if()` ignored the following grouping variables:| celltype | db | component | geneSet | description | alpha | pValueHypergeometric |
|---|---|---|---|---|---|---|
| CD56+ NK | gomf | L1 | GO:0003735 | structural constituent of ribosome | 1 | 1.18e-44 |
| CD56+ NK | gomf | L1 | GO:0003723 | RNA binding | 7.05e-16 | 5.07e-130 |
| CD56+ NK | gomf | L1 | GO:0005198 | structural molecule activity | 1.56e-16 | 4.76e-54 |
| CD56+ NK | gomf | L1 | GO:0008821 | crossover junction endodeoxyribonuclease activity | 4.67e-19 | 1 |
| CD56+ NK | gomf | L1 | GO:0016209 | antioxidant activity | 3.18e-19 | 7.04e-16 |
| CD56+ NK | gomf | L1 | GO:0005515 | protein binding | 3.11e-19 | 0 |
| CD56+ NK | gomf | L1 | GO:1901682 | sulfur compound transmembrane transporter activity | 3.05e-19 | 0.975 |
| CD56+ NK | gomf | L1 | GO:0045296 | cadherin binding | 2.89e-19 | 5e-32 |
| CD56+ NK | gomf | L1 | GO:0016655 | oxidoreductase activity, acting on NAD(P)H, quinone or similar compound as acceptor | 2.69e-19 | 4.52e-15 |
| CD56+ NK | gomf | L1 | GO:0042287 | MHC protein binding | 2.64e-19 | 8.95e-10 |
| CD56+ NK | gomf | L2 | GO:0000981 | DNA-binding transcription factor activity, RNA polymerase II-specific | 0.997 | 3.24e-18 |
| CD56+ NK | gomf | L2 | GO:0003700 | DNA-binding transcription factor activity | 0.00323 | 3.41e-22 |
| CD56+ NK | gomf | L2 | GO:0140110 | transcription regulator activity | 9.43e-11 | 4.86e-39 |
| CD56+ NK | gomf | L2 | GO:0003677 | DNA binding | 3.37e-13 | 2.85e-56 |
| CD56+ NK | gomf | L2 | GO:0046872 | metal ion binding | 6.11e-23 | 1.22e-106 |
| CD56+ NK | gomf | L2 | GO:0044212 | transcription regulatory region DNA binding | 1.41e-23 | 4.44e-38 |
| CD56+ NK | gomf | L2 | GO:0001067 | regulatory region nucleic acid binding | 8.31e-24 | 1.53e-38 |
| CD56+ NK | gomf | L2 | GO:0043169 | cation binding | 4.61e-24 | 9.32e-113 |
| CD56+ NK | gomf | L2 | GO:0001012 | RNA polymerase II regulatory region DNA binding | 2.84e-24 | 2.22e-36 |
| CD56+ NK | gomf | L2 | GO:0003676 | nucleic acid binding | 2.2e-24 | 4.06e-159 |
| CD56+ NK | gomf | L3 | GO:0000977 | RNA polymerase II regulatory region sequence-specific DNA binding | 0.525 | 6.62e-37 |
| CD56+ NK | gomf | L3 | GO:0000976 | transcription regulatory region sequence-specific DNA binding | 0.282 | 8.88e-39 |
| CD56+ NK | gomf | L3 | GO:0001012 | RNA polymerase II regulatory region DNA binding | 0.176 | 2.22e-36 |
| CD56+ NK | gomf | L3 | GO:1990837 | sequence-specific double-stranded DNA binding | 0.0109 | 3.66e-40 |
| CD56+ NK | gomf | L3 | GO:0003690 | double-stranded DNA binding | 0.00648 | 6.12e-47 |
| CD56+ NK | gomf | L3 | GO:0043565 | sequence-specific DNA binding | 0.000385 | 6.95e-44 |
| CD56+ NK | gomf | L3 | GO:0000987 | proximal promoter sequence-specific DNA binding | 8.45e-05 | 1.16e-28 |
| CD56+ NK | gomf | L3 | GO:0001067 | regulatory region nucleic acid binding | 7.25e-05 | 1.53e-38 |
| CD56+ NK | gomf | L3 | GO:0044212 | transcription regulatory region DNA binding | 4.82e-05 | 4.44e-38 |
| CD56+ NK | gomf | L3 | GO:0000978 | RNA polymerase II proximal promoter sequence-specific DNA binding | 2.66e-05 | 1.07e-27 |
kegg
Adding missing grouping variables: `celltype`, `db`, `component`
`mutate_if()` ignored the following grouping variables:| celltype | db | component | geneSet | description | alpha | pValueHypergeometric |
|---|---|---|---|---|---|---|
| CD56+ NK | kegg | L1 | hsa03010 | Ribosome | 1 | 9.22e-36 |
| CD56+ NK | kegg | L1 | hsa04512 | ECM-receptor interaction | 1.69e-14 | 0.345 |
| CD56+ NK | kegg | L1 | hsa00730 | Thiamine metabolism | 1.43e-14 | 0.938 |
| CD56+ NK | kegg | L1 | hsa03460 | Fanconi anemia pathway | 9.91e-15 | 0.477 |
| CD56+ NK | kegg | L1 | hsa00630 | Glyoxylate and dicarboxylate metabolism | 9.53e-15 | 5.85e-08 |
| CD56+ NK | kegg | L1 | hsa04650 | Natural killer cell mediated cytotoxicity | 9.11e-15 | 5.53e-21 |
| CD56+ NK | kegg | L1 | hsa00052 | Galactose metabolism | 8.8e-15 | 5.85e-08 |
| CD56+ NK | kegg | L1 | hsa05033 | Nicotine addiction | 7.06e-15 | 1 |
| CD56+ NK | kegg | L1 | hsa00533 | Glycosaminoglycan biosynthesis | 5.27e-15 | 3.61e-05 |
| CD56+ NK | kegg | L1 | hsa00062 | Fatty acid elongation | 4.9e-15 | 3.16e-07 |
| CD56+ NK | kegg | L2 | hsa05012 | Parkinson disease | 1 | 2.59e-32 |
| CD56+ NK | kegg | L2 | hsa00190 | Oxidative phosphorylation | 1.95e-06 | 4.18e-24 |
| CD56+ NK | kegg | L2 | hsa04714 | Thermogenesis | 1.9e-07 | 3.67e-32 |
| CD56+ NK | kegg | L2 | hsa05016 | Huntington disease | 1.8e-08 | 9.65e-26 |
| CD56+ NK | kegg | L2 | hsa05010 | Alzheimer disease | 1.19e-08 | 5.81e-25 |
| CD56+ NK | kegg | L2 | hsa04932 | Non-alcoholic fatty liver disease (NAFLD) | 5.28e-10 | 4.57e-21 |
| CD56+ NK | kegg | L2 | hsa04512 | ECM-receptor interaction | 3.41e-11 | 0.345 |
| CD56+ NK | kegg | L2 | hsa00730 | Thiamine metabolism | 2.69e-11 | 0.938 |
| CD56+ NK | kegg | L2 | hsa04650 | Natural killer cell mediated cytotoxicity | 2.2e-11 | 5.53e-21 |
| CD56+ NK | kegg | L2 | hsa04723 | Retrograde endocannabinoid signaling | 2.1e-11 | 9.08e-14 |
| CD56+ NK | kegg | L3 | hsa04640 | Hematopoietic cell lineage | 0.998 | 4.77e-19 |
| CD56+ NK | kegg | L3 | hsa04612 | Antigen processing and presentation | 0.000392 | 7.9e-16 |
| CD56+ NK | kegg | L3 | hsa05332 | Graft-versus-host disease | 0.000199 | 2.42e-11 |
| CD56+ NK | kegg | L3 | hsa04658 | Th1 and Th2 cell differentiation | 0.000129 | 7.71e-16 |
| CD56+ NK | kegg | L3 | hsa04650 | Natural killer cell mediated cytotoxicity | 6.07e-05 | 5.53e-21 |
| CD56+ NK | kegg | L3 | hsa00730 | Thiamine metabolism | 5.71e-05 | 0.938 |
| CD56+ NK | kegg | L3 | hsa03460 | Fanconi anemia pathway | 4.82e-05 | 0.477 |
| CD56+ NK | kegg | L3 | hsa00630 | Glyoxylate and dicarboxylate metabolism | 4.31e-05 | 5.85e-08 |
| CD56+ NK | kegg | L3 | hsa00052 | Galactose metabolism | 3.99e-05 | 5.85e-08 |
| CD56+ NK | kegg | L3 | hsa05340 | Primary immunodeficiency | 3.79e-05 | 2.52e-08 |
reactome
Adding missing grouping variables: `celltype`, `db`, `component`
`mutate_if()` ignored the following grouping variables:| celltype | db | component | geneSet | description | alpha | pValueHypergeometric |
|---|---|---|---|---|---|---|
| CD56+ NK | reactome | L1 | R-HSA-168256 | Immune System | 1 | 9.31e-193 |
| CD56+ NK | reactome | L1 | R-HSA-168249 | Innate Immune System | 3.44e-14 | 2.67e-117 |
| CD56+ NK | reactome | L1 | R-HSA-1280218 | Adaptive Immune System | 8.59e-20 | 1.08e-66 |
| CD56+ NK | reactome | L1 | R-HSA-6798695 | Neutrophil degranulation | 3.94e-23 | 2.5e-68 |
| CD56+ NK | reactome | L1 | R-HSA-1280215 | Cytokine Signaling in Immune system | 5.94e-27 | 1.89e-65 |
| CD56+ NK | reactome | L1 | R-HSA-198933 | Immunoregulatory interactions between a Lymphoid and a non-Lymphoid cell | 4.21e-31 | 4.56e-26 |
| CD56+ NK | reactome | L1 | R-HSA-449147 | Signaling by Interleukins | 2.02e-31 | 7.16e-43 |
| CD56+ NK | reactome | L1 | R-HSA-983169 | Class I MHC mediated antigen processing & presentation | 6.87e-32 | 1.16e-19 |
| CD56+ NK | reactome | L1 | R-HSA-983168 | Antigen processing: Ubiquitination & Proteasome degradation | 4.92e-33 | 4.6e-14 |
| CD56+ NK | reactome | L1 | R-HSA-109581 | Apoptosis | 1.4e-33 | 2.08e-24 |
| CD56+ NK | reactome | L2 | R-HSA-156842 | Eukaryotic Translation Elongation | 0.865 | 6.21e-34 |
| CD56+ NK | reactome | L2 | R-HSA-156902 | Peptide chain elongation | 0.106 | 1.06e-32 |
| CD56+ NK | reactome | L2 | R-HSA-192823 | Viral mRNA Translation | 0.0265 | 1.06e-32 |
| CD56+ NK | reactome | L2 | R-HSA-72764 | Eukaryotic Translation Termination | 0.00176 | 1.16e-32 |
| CD56+ NK | reactome | L2 | R-HSA-72689 | Formation of a pool of free 40S subunits | 0.000534 | 2.53e-34 |
| CD56+ NK | reactome | L2 | R-HSA-2408557 | Selenocysteine synthesis | 0.000143 | 4.17e-31 |
| CD56+ NK | reactome | L2 | R-HSA-72706 | GTP hydrolysis and joining of the 60S ribosomal subunit | 1.21e-05 | 8.93e-36 |
| CD56+ NK | reactome | L2 | R-HSA-156827 | L13a-mediated translational silencing of Ceruloplasmin expression | 9.35e-06 | 2.23e-35 |
| CD56+ NK | reactome | L2 | R-HSA-975956 | Nonsense Mediated Decay (NMD) independent of the Exon Junction Complex (EJC) | 8.92e-06 | 1.9e-30 |
| CD56+ NK | reactome | L2 | R-HSA-2408522 | Selenoamino acid metabolism | 8.48e-08 | 3.48e-32 |
| CD56+ NK | reactome | L3 | R-HSA-212436 | Generic Transcription Pathway | 0.681 | 1.32e-30 |
| CD56+ NK | reactome | L3 | R-HSA-74160 | Gene expression (Transcription) | 0.297 | 3.1e-41 |
| CD56+ NK | reactome | L3 | R-HSA-73857 | RNA Polymerase II Transcription | 0.0221 | 2.09e-37 |
| CD56+ NK | reactome | L3 | R-HSA-211000 | Gene Silencing by RNA | 1.79e-08 | 0.00117 |
| CD56+ NK | reactome | L3 | R-HSA-448424 | Interleukin-17 signaling | 7.77e-09 | 0.0144 |
| CD56+ NK | reactome | L3 | R-HSA-450294 | MAP kinase activation | 4.16e-09 | 0.0174 |
| CD56+ NK | reactome | L3 | R-HSA-3232142 | SUMOylation of ubiquitinylation proteins | 4e-09 | 0.326 |
| CD56+ NK | reactome | L3 | R-HSA-76005 | Response to elevated platelet cytosolic Ca2+ | 3.9e-09 | 2.43e-21 |
| CD56+ NK | reactome | L3 | R-HSA-5368286 | Mitochondrial translation initiation | 3.85e-09 | 1.27e-14 |
| CD56+ NK | reactome | L3 | R-HSA-168138 | Toll Like Receptor 9 (TLR9) Cascade | 2.94e-09 | 8.9e-05 |
| CD56+ NK | reactome | L4 | R-HSA-163200 | Respiratory electron transport, ATP synthesis by chemiosmotic coupling, and heat production by uncoupling proteins. | 0.993 | 1.78e-25 |
| CD56+ NK | reactome | L4 | R-HSA-1428517 | The citric acid (TCA) cycle and respiratory electron transport | 0.00561 | 1.15e-26 |
| CD56+ NK | reactome | L4 | R-HSA-611105 | Respiratory electron transport | 0.00106 | 7.19e-19 |
| CD56+ NK | reactome | L4 | R-HSA-6799198 | Complex I biogenesis | 1.15e-06 | 6.16e-12 |
| CD56+ NK | reactome | L4 | R-HSA-163210 | Formation of ATP by chemiosmotic coupling | 4.05e-07 | 3.2e-08 |
| CD56+ NK | reactome | L4 | R-HSA-3700989 | Transcriptional Regulation by TP53 | 3.29e-07 | 8.12e-24 |
| CD56+ NK | reactome | L4 | R-HSA-8949613 | Cristae formation | 1.73e-07 | 2.44e-09 |
| CD56+ NK | reactome | L4 | R-HSA-1430728 | Metabolism | 6.44e-08 | 5.19e-148 |
| CD56+ NK | reactome | L4 | R-HSA-76005 | Response to elevated platelet cytosolic Ca2+ | 5.51e-08 | 2.43e-21 |
| CD56+ NK | reactome | L4 | R-HSA-72163 | mRNA Splicing - Major Pathway | 3.54e-08 | 3.64e-23 |
| CD56+ NK | reactome | L5 | R-HSA-8878171 | Transcriptional regulation by RUNX1 | 0.971 | 4.65e-25 |
| CD56+ NK | reactome | L5 | R-HSA-8939236 | RUNX1 regulates transcription of genes involved in differentiation of HSCs | 0.0185 | 2.98e-17 |
| CD56+ NK | reactome | L5 | R-HSA-157118 | Signaling by NOTCH | 0.00959 | 1.64e-27 |
| CD56+ NK | reactome | L5 | R-HSA-8878159 | Transcriptional regulation by RUNX3 | 0.000102 | 1.97e-15 |
| CD56+ NK | reactome | L5 | R-HSA-4641257 | Degradation of AXIN | 7.08e-05 | 3.59e-12 |
| CD56+ NK | reactome | L5 | R-HSA-8948751 | Regulation of PTEN stability and activity | 6.68e-05 | 6.86e-14 |
| CD56+ NK | reactome | L5 | R-HSA-180585 | Vif-mediated degradation of APOBEC3G | 5.75e-05 | 8.01e-12 |
| CD56+ NK | reactome | L5 | R-HSA-69481 | G2/M Checkpoints | 5.42e-05 | 6.46e-18 |
| CD56+ NK | reactome | L5 | R-HSA-8941858 | Regulation of RUNX3 expression and activity | 2.83e-05 | 1.35e-11 |
| CD56+ NK | reactome | L5 | R-HSA-9013694 | Signaling by NOTCH4 | 2.25e-05 | 5.79e-14 |
| CD56+ NK | reactome | L6 | R-HSA-983168 | Antigen processing: Ubiquitination & Proteasome degradation | 0.881 | 4.6e-14 |
| CD56+ NK | reactome | L6 | R-HSA-983169 | Class I MHC mediated antigen processing & presentation | 0.119 | 1.16e-19 |
| CD56+ NK | reactome | L6 | R-HSA-8951664 | Neddylation | 0.000295 | 1.84e-09 |
| CD56+ NK | reactome | L6 | R-HSA-448424 | Interleukin-17 signaling | 4.14e-06 | 0.0144 |
| CD56+ NK | reactome | L6 | R-HSA-76005 | Response to elevated platelet cytosolic Ca2+ | 3.56e-06 | 2.43e-21 |
| CD56+ NK | reactome | L6 | R-HSA-450321 | JNK (c-Jun kinases) phosphorylation and activation mediated by activated human TAK1 | 2.76e-06 | 0.525 |
| CD56+ NK | reactome | L6 | R-HSA-72163 | mRNA Splicing - Major Pathway | 2.74e-06 | 3.64e-23 |
| CD56+ NK | reactome | L6 | R-HSA-72172 | mRNA Splicing | 2.26e-06 | 1.75e-23 |
| CD56+ NK | reactome | L6 | R-HSA-450294 | MAP kinase activation | 2.12e-06 | 0.0174 |
| CD56+ NK | reactome | L6 | R-HSA-114608 | Platelet degranulation | 2.12e-06 | 5.81e-20 |
wikipathway_cancer
Adding missing grouping variables: `celltype`, `db`, `component`
`mutate_if()` ignored the following grouping variables:
Warning in ensure_len_html(color, nrows, "color"): The number of provided values
in color does not equal to the number of rows.[1] “nothing to report…”
wikipathway
Adding missing grouping variables: `celltype`, `db`, `component`
`mutate_if()` ignored the following grouping variables:| celltype | db | component | geneSet | description | alpha | pValueHypergeometric |
|---|---|---|---|---|---|---|
| CD56+ NK | wikipathway | L1 | WP477 | Cytoplasmic Ribosomal Proteins | 1 | 3.73e-31 |
| CD56+ NK | wikipathway | L1 | WP2805 | exRNA mechanism of action and biogenesis | 5.69e-20 | 1 |
| CD56+ NK | wikipathway | L1 | WP3945 | TYROBP Causal Network | 3.47e-20 | 4.57e-16 |
| CD56+ NK | wikipathway | L1 | WP183 | Proteasome Degradation | 1.52e-20 | 5.7e-14 |
| CD56+ NK | wikipathway | L1 | WP410 | Exercise-induced Circadian Regulation | 1.1e-20 | 9.72e-11 |
| CD56+ NK | wikipathway | L1 | WP254 | Apoptosis | 7.79e-21 | 7.82e-15 |
| CD56+ NK | wikipathway | L1 | WP43 | Oxidation by Cytochrome P450 | 7.63e-21 | 0.59 |
| CD56+ NK | wikipathway | L1 | WP4150 | Wnt Signaling in Kidney Disease | 7.27e-21 | 0.662 |
| CD56+ NK | wikipathway | L1 | WP619 | Type II interferon signaling (IFNG) | 7.14e-21 | 1.34e-08 |
| CD56+ NK | wikipathway | L1 | WP3302 | eIF5A regulation in response to inhibition of the nuclear export system | 7.12e-21 | 1 |
| CD56+ NK | wikipathway | L2 | WP111 | Electron Transport Chain (OXPHOS system in mitochondria) | 0.991 | 3.36e-24 |
| CD56+ NK | wikipathway | L2 | WP623 | Oxidative phosphorylation | 0.00911 | 3.19e-17 |
| CD56+ NK | wikipathway | L2 | WP4396 | Nonalcoholic fatty liver disease | 1.86e-05 | 2.56e-21 |
| CD56+ NK | wikipathway | L2 | WP3945 | TYROBP Causal Network | 2.61e-06 | 4.57e-16 |
| CD56+ NK | wikipathway | L2 | WP2805 | exRNA mechanism of action and biogenesis | 2.25e-06 | 1 |
| CD56+ NK | wikipathway | L2 | WP183 | Proteasome Degradation | 1.59e-06 | 5.7e-14 |
| CD56+ NK | wikipathway | L2 | WP410 | Exercise-induced Circadian Regulation | 1.38e-06 | 9.72e-11 |
| CD56+ NK | wikipathway | L2 | WP4324 | Mitochondrial complex I assembly model OXPHOS system | 1.28e-06 | 5.33e-10 |
| CD56+ NK | wikipathway | L2 | WP254 | Apoptosis | 8.6e-07 | 7.82e-15 |
| CD56+ NK | wikipathway | L2 | WP43 | Oxidation by Cytochrome P450 | 7.38e-07 | 0.59 |
T cell
gobp
Adding missing grouping variables: `celltype`, `db`, `component`
`mutate_if()` ignored the following grouping variables:| celltype | db | component | geneSet | description | alpha | pValueHypergeometric |
|---|---|---|---|---|---|---|
| T cell | gobp | L1 | GO:0001775 | cell activation | 0.998 | 1.1e-248 |
| T cell | gobp | L1 | GO:0045321 | leukocyte activation | 0.00176 | 2.33e-226 |
| T cell | gobp | L1 | GO:0002263 | cell activation involved in immune response | 4.39e-09 | 2.89e-145 |
| T cell | gobp | L1 | GO:0002366 | leukocyte activation involved in immune response | 2.91e-09 | 3.2e-144 |
| T cell | gobp | L1 | GO:0002274 | myeloid leukocyte activation | 9.46e-10 | 2.5e-134 |
| T cell | gobp | L1 | GO:0002443 | leukocyte mediated immunity | 2.66e-10 | 5.41e-152 |
| T cell | gobp | L1 | GO:0045055 | regulated exocytosis | 1.14e-10 | 1.58e-142 |
| T cell | gobp | L1 | GO:0006887 | exocytosis | 3.13e-11 | 4.75e-152 |
| T cell | gobp | L1 | GO:0043299 | leukocyte degranulation | 1.81e-11 | 2.47e-116 |
| T cell | gobp | L1 | GO:0042119 | neutrophil activation | 1.47e-11 | 1.09e-111 |
| T cell | gobp | L2 | GO:0006119 | oxidative phosphorylation | 0.999 | 1.89e-33 |
| T cell | gobp | L2 | GO:0042773 | ATP synthesis coupled electron transport | 0.000673 | 9.26e-25 |
| T cell | gobp | L2 | GO:0042775 | mitochondrial ATP synthesis coupled electron transport | 0.000457 | 2.1e-24 |
| T cell | gobp | L2 | GO:0046034 | ATP metabolic process | 2.91e-06 | 1.9e-45 |
| T cell | gobp | L2 | GO:0022904 | respiratory electron transport chain | 1.84e-06 | 1.89e-23 |
| T cell | gobp | L2 | GO:0009126 | purine nucleoside monophosphate metabolic process | 6.9e-08 | 4.6e-47 |
| T cell | gobp | L2 | GO:0009167 | purine ribonucleoside monophosphate metabolic process | 6.9e-08 | 4.6e-47 |
| T cell | gobp | L2 | GO:0009205 | purine ribonucleoside triphosphate metabolic process | 3.34e-08 | 3.43e-45 |
| T cell | gobp | L2 | GO:0009123 | nucleoside monophosphate metabolic process | 2.53e-08 | 1.58e-49 |
| T cell | gobp | L2 | GO:0009144 | purine nucleoside triphosphate metabolic process | 1.87e-08 | 1.43e-45 |
| T cell | gobp | L3 | GO:0010941 | regulation of cell death | 0.403 | 2.14e-192 |
| T cell | gobp | L3 | GO:0008219 | cell death | 0.366 | 7.03e-238 |
| T cell | gobp | L3 | GO:0043067 | regulation of programmed cell death | 0.0588 | 3.66e-176 |
| T cell | gobp | L3 | GO:0042981 | regulation of apoptotic process | 0.0585 | 1.38e-174 |
| T cell | gobp | L3 | GO:0012501 | programmed cell death | 0.0419 | 1.13e-219 |
| T cell | gobp | L3 | GO:0006915 | apoptotic process | 0.0376 | 4.51e-213 |
| T cell | gobp | L3 | GO:0097190 | apoptotic signaling pathway | 0.017 | 1.88e-89 |
| T cell | gobp | L3 | GO:0010942 | positive regulation of cell death | 0.00417 | 7.69e-95 |
| T cell | gobp | L3 | GO:0048518 | positive regulation of biological process | 0.00213 | 0 |
| T cell | gobp | L3 | GO:0048522 | positive regulation of cellular process | 0.00108 | 0 |
| T cell | gobp | L4 | GO:0045047 | protein targeting to ER | 0.422 | 6.74e-29 |
| T cell | gobp | L4 | GO:0006614 | SRP-dependent cotranslational protein targeting to membrane | 0.369 | 2.7e-27 |
| T cell | gobp | L4 | GO:0072599 | establishment of protein localization to endoplasmic reticulum | 0.137 | 1.07e-28 |
| T cell | gobp | L4 | GO:0070972 | protein localization to endoplasmic reticulum | 0.0423 | 2.39e-33 |
| T cell | gobp | L4 | GO:0006613 | cotranslational protein targeting to membrane | 0.0302 | 4.02e-26 |
| T cell | gobp | L4 | GO:0000184 | nuclear-transcribed mRNA catabolic process, nonsense-mediated decay | 0.000183 | 3.52e-27 |
| T cell | gobp | L4 | GO:0006413 | translational initiation | 4.8e-05 | 3.9e-38 |
| T cell | gobp | L4 | GO:0006612 | protein targeting to membrane | 8.81e-06 | 5.84e-34 |
| T cell | gobp | L4 | GO:0090150 | establishment of protein localization to membrane | 1.22e-07 | 1.73e-46 |
| T cell | gobp | L4 | GO:0016071 | mRNA metabolic process | 5.06e-08 | 5.76e-91 |
| T cell | gobp | L5 | GO:0002376 | immune system process | 0.998 | 0 |
| T cell | gobp | L5 | GO:0006955 | immune response | 0.00153 | 2.06e-293 |
| T cell | gobp | L5 | GO:0002252 | immune effector process | 3.11e-09 | 3.3e-199 |
| T cell | gobp | L5 | GO:0050896 | response to stimulus | 3.08e-09 | 0 |
| T cell | gobp | L5 | GO:0006952 | defense response | 5.29e-10 | 4.56e-177 |
| T cell | gobp | L5 | GO:0032940 | secretion by cell | 5.18e-10 | 1.77e-205 |
| T cell | gobp | L5 | GO:0048518 | positive regulation of biological process | 4.73e-10 | 0 |
| T cell | gobp | L5 | GO:0016192 | vesicle-mediated transport | 3.93e-10 | 2.5e-247 |
| T cell | gobp | L5 | GO:0051716 | cellular response to stimulus | 2.23e-10 | 0 |
| T cell | gobp | L5 | GO:0006887 | exocytosis | 1.73e-10 | 4.75e-152 |
gobp_nr
Adding missing grouping variables: `celltype`, `db`, `component`
`mutate_if()` ignored the following grouping variables:| celltype | db | component | geneSet | description | alpha | pValueHypergeometric |
|---|---|---|---|---|---|---|
| T cell | gobp_nr | L1 | GO:0036230 | granulocyte activation | 0.732 | 8.89e-111 |
| T cell | gobp_nr | L1 | GO:0002446 | neutrophil mediated immunity | 0.268 | 9.71e-110 |
| T cell | gobp_nr | L1 | GO:0032103 | positive regulation of response to external stimulus | 1.12e-27 | 1.22e-45 |
| T cell | gobp_nr | L1 | GO:0098542 | defense response to other organism | 6.3e-28 | 6.8e-59 |
| T cell | gobp_nr | L1 | GO:0006959 | humoral immune response | 5.97e-28 | 9.7e-30 |
| T cell | gobp_nr | L1 | GO:0002764 | immune response-regulating signaling pathway | 4.46e-28 | 7.65e-74 |
| T cell | gobp_nr | L1 | GO:0001819 | positive regulation of cytokine production | 3.31e-28 | 8.81e-67 |
| T cell | gobp_nr | L1 | GO:0006490 | oligosaccharide-lipid intermediate biosynthetic process | 3.23e-28 | 0.818 |
| T cell | gobp_nr | L1 | GO:0000959 | mitochondrial RNA metabolic process | 2.56e-28 | 0.368 |
| T cell | gobp_nr | L1 | GO:0009123 | nucleoside monophosphate metabolic process | 2.08e-28 | 1.1e-48 |
| T cell | gobp_nr | L2 | GO:0042110 | T cell activation | 1 | 2.42e-82 |
| T cell | gobp_nr | L2 | GO:0002694 | regulation of leukocyte activation | 3.06e-06 | 7.09e-78 |
| T cell | gobp_nr | L2 | GO:0007159 | leukocyte cell-cell adhesion | 2.59e-06 | 9.16e-58 |
| T cell | gobp_nr | L2 | GO:0002521 | leukocyte differentiation | 1.85e-06 | 6.93e-78 |
| T cell | gobp_nr | L2 | GO:0050867 | positive regulation of cell activation | 1.27e-06 | 1.16e-58 |
| T cell | gobp_nr | L2 | GO:0045785 | positive regulation of cell adhesion | 4.91e-07 | 9.52e-63 |
| T cell | gobp_nr | L2 | GO:0002250 | adaptive immune response | 1.07e-07 | 1.04e-61 |
| T cell | gobp_nr | L2 | GO:0022407 | regulation of cell-cell adhesion | 4.81e-08 | 1.3e-57 |
| T cell | gobp_nr | L2 | GO:0070661 | leukocyte proliferation | 6.9e-09 | 4.95e-45 |
| T cell | gobp_nr | L2 | GO:0001819 | positive regulation of cytokine production | 4.06e-09 | 8.81e-67 |
| T cell | gobp_nr | L3 | GO:0070972 | protein localization to endoplasmic reticulum | 1 | 7.08e-33 |
| T cell | gobp_nr | L3 | GO:0006413 | translational initiation | 0.000141 | 1.53e-37 |
| T cell | gobp_nr | L3 | GO:0090150 | establishment of protein localization to membrane | 9.6e-07 | 1.16e-45 |
| T cell | gobp_nr | L3 | GO:0006490 | oligosaccharide-lipid intermediate biosynthetic process | 3.5e-07 | 0.818 |
| T cell | gobp_nr | L3 | GO:0000959 | mitochondrial RNA metabolic process | 2.76e-07 | 0.368 |
| T cell | gobp_nr | L3 | GO:0006401 | RNA catabolic process | 1.36e-07 | 6.06e-46 |
| T cell | gobp_nr | L3 | GO:0072348 | sulfur compound transport | 1.32e-07 | 0.453 |
| T cell | gobp_nr | L3 | GO:0070193 | synaptonemal complex organization | 7.79e-08 | 0.707 |
| T cell | gobp_nr | L3 | GO:0006605 | protein targeting | 7.78e-08 | 1.69e-52 |
| T cell | gobp_nr | L3 | GO:2001233 | regulation of apoptotic signaling pathway | 4.76e-08 | 1.82e-57 |
gomf
Adding missing grouping variables: `celltype`, `db`, `component`
`mutate_if()` ignored the following grouping variables:| celltype | db | component | geneSet | description | alpha | pValueHypergeometric |
|---|---|---|---|---|---|---|
| T cell | gomf | L1 | GO:0005515 | protein binding | 1 | 0 |
| T cell | gomf | L1 | GO:0005488 | binding | 4.48e-15 | 0 |
| T cell | gomf | L1 | GO:0003674 | molecular_function | 7.91e-18 | 0 |
| T cell | gomf | L1 | GO:0019899 | enzyme binding | 1.19e-40 | 3.3e-234 |
| T cell | gomf | L1 | GO:0003824 | catalytic activity | 9.43e-43 | 0 |
| T cell | gomf | L1 | GO:0097159 | organic cyclic compound binding | 8.78e-45 | 0 |
| T cell | gomf | L1 | GO:1901363 | heterocyclic compound binding | 1.69e-45 | 0 |
| T cell | gomf | L1 | GO:0003723 | RNA binding | 8.1e-46 | 1.71e-189 |
| T cell | gomf | L1 | GO:0042802 | identical protein binding | 6.54e-49 | 3.5e-152 |
| T cell | gomf | L1 | GO:0046983 | protein dimerization activity | 4.86e-49 | 3.06e-119 |
kegg
Adding missing grouping variables: `celltype`, `db`, `component`
`mutate_if()` ignored the following grouping variables:| celltype | db | component | geneSet | description | alpha | pValueHypergeometric |
|---|---|---|---|---|---|---|
| T cell | kegg | L1 | hsa05010 | Alzheimer disease | 1 | 1.47e-43 |
| T cell | kegg | L1 | hsa05012 | Parkinson disease | 7.16e-07 | 3.58e-35 |
| T cell | kegg | L1 | hsa00190 | Oxidative phosphorylation | 1.46e-08 | 1.36e-30 |
| T cell | kegg | L1 | hsa05016 | Huntington disease | 1.63e-09 | 1.01e-36 |
| T cell | kegg | L1 | hsa04932 | Non-alcoholic fatty liver disease (NAFLD) | 3.42e-11 | 1.44e-28 |
| T cell | kegg | L1 | hsa04714 | Thermogenesis | 2.27e-12 | 1.54e-35 |
| T cell | kegg | L1 | hsa04723 | Retrograde endocannabinoid signaling | 1.58e-12 | 8.39e-22 |
| T cell | kegg | L1 | hsa05167 | Kaposi sarcoma-associated herpesvirus infection | 1.12e-13 | 1.52e-32 |
| T cell | kegg | L1 | hsa04062 | Chemokine signaling pathway | 8.92e-14 | 1.42e-30 |
| T cell | kegg | L1 | hsa05332 | Graft-versus-host disease | 7e-14 | 4.01e-13 |
reactome
Adding missing grouping variables: `celltype`, `db`, `component`
`mutate_if()` ignored the following grouping variables:| celltype | db | component | geneSet | description | alpha | pValueHypergeometric |
|---|---|---|---|---|---|---|
| T cell | reactome | L1 | R-HSA-6798695 | Neutrophil degranulation | 1 | 4.55e-106 |
| T cell | reactome | L1 | R-HSA-168249 | Innate Immune System | 6.29e-13 | 6.01e-153 |
| T cell | reactome | L1 | R-HSA-168256 | Immune System | 2.78e-16 | 5.39e-262 |
| T cell | reactome | L1 | R-HSA-76002 | Platelet activation, signaling and aggregation | 5.14e-28 | 5.32e-42 |
| T cell | reactome | L1 | R-HSA-198933 | Immunoregulatory interactions between a Lymphoid and a non-Lymphoid cell | 4.69e-28 | 1.32e-26 |
| T cell | reactome | L1 | R-HSA-109582 | Hemostasis | 2.94e-28 | 7.72e-72 |
| T cell | reactome | L1 | R-HSA-162582 | Signal Transduction | 1.68e-28 | 7.1e-220 |
| T cell | reactome | L1 | R-HSA-1280215 | Cytokine Signaling in Immune system | 1.47e-28 | 7.01e-82 |
| T cell | reactome | L1 | R-HSA-3781860 | Diseases associated with N-glycosylation of proteins | 1.34e-28 | 0.914 |
| T cell | reactome | L1 | R-HSA-6785807 | Interleukin-4 and Interleukin-13 signaling | 1.25e-28 | 1.08e-21 |
| T cell | reactome | L2 | R-HSA-72706 | GTP hydrolysis and joining of the 60S ribosomal subunit | 0.585 | 4.81e-34 |
| T cell | reactome | L2 | R-HSA-156827 | L13a-mediated translational silencing of Ceruloplasmin expression | 0.399 | 1.1e-33 |
| T cell | reactome | L2 | R-HSA-72689 | Formation of a pool of free 40S subunits | 0.00721 | 4.13e-30 |
| T cell | reactome | L2 | R-HSA-72613 | Eukaryotic Translation Initiation | 0.00282 | 2.52e-32 |
| T cell | reactome | L2 | R-HSA-72737 | Cap-dependent Translation Initiation | 0.00282 | 2.52e-32 |
| T cell | reactome | L2 | R-HSA-192823 | Viral mRNA Translation | 0.00122 | 6.8e-29 |
| T cell | reactome | L2 | R-HSA-156902 | Peptide chain elongation | 0.000931 | 6.8e-29 |
| T cell | reactome | L2 | R-HSA-72764 | Eukaryotic Translation Termination | 0.000178 | 9.61e-29 |
| T cell | reactome | L2 | R-HSA-156842 | Eukaryotic Translation Elongation | 0.000129 | 2.2e-28 |
| T cell | reactome | L2 | R-HSA-975956 | Nonsense Mediated Decay (NMD) independent of the Exon Junction Complex (EJC) | 6.03e-05 | 5.62e-28 |
wikipathway_cancer
Adding missing grouping variables: `celltype`, `db`, `component`
`mutate_if()` ignored the following grouping variables:
Warning in ensure_len_html(color, nrows, "color"): The number of provided values
in color does not equal to the number of rows.[1] “nothing to report…”
wikipathway
Adding missing grouping variables: `celltype`, `db`, `component`
`mutate_if()` ignored the following grouping variables:
Warning in ensure_len_html(color, nrows, "color"): The number of provided values
in color does not equal to the number of rows.[1] “nothing to report…”
CD14+ Monocyte
gobp
Adding missing grouping variables: `celltype`, `db`, `component`
`mutate_if()` ignored the following grouping variables:| celltype | db | component | geneSet | description | alpha | pValueHypergeometric |
|---|---|---|---|---|---|---|
| CD14+ Monocyte | gobp | L1 | GO:0045321 | leukocyte activation | 0.914 | 1.27e-152 |
| CD14+ Monocyte | gobp | L1 | GO:0001775 | cell activation | 0.086 | 4.88e-159 |
| CD14+ Monocyte | gobp | L1 | GO:0002376 | immune system process | 4.67e-06 | 3.66e-228 |
| CD14+ Monocyte | gobp | L1 | GO:0006955 | immune response | 3.98e-07 | 8.73e-175 |
| CD14+ Monocyte | gobp | L1 | GO:0002443 | leukocyte mediated immunity | 8.29e-10 | 1.82e-108 |
| CD14+ Monocyte | gobp | L1 | GO:0002366 | leukocyte activation involved in immune response | 6.44e-10 | 6.66e-105 |
| CD14+ Monocyte | gobp | L1 | GO:0002263 | cell activation involved in immune response | 5.38e-10 | 3.79e-105 |
| CD14+ Monocyte | gobp | L1 | GO:0002274 | myeloid leukocyte activation | 2.28e-10 | 2.2e-100 |
| CD14+ Monocyte | gobp | L1 | GO:0042119 | neutrophil activation | 9.48e-12 | 8.79e-89 |
| CD14+ Monocyte | gobp | L1 | GO:0002275 | myeloid cell activation involved in immune response | 5.79e-12 | 7.43e-92 |
| CD14+ Monocyte | gobp | L2 | GO:0045047 | protein targeting to ER | 0.862 | 6.38e-36 |
| CD14+ Monocyte | gobp | L2 | GO:0006614 | SRP-dependent cotranslational protein targeting to membrane | 0.0573 | 1.17e-33 |
| CD14+ Monocyte | gobp | L2 | GO:0006613 | cotranslational protein targeting to membrane | 0.0476 | 6.35e-34 |
| CD14+ Monocyte | gobp | L2 | GO:0072599 | establishment of protein localization to endoplasmic reticulum | 0.0334 | 1.64e-34 |
| CD14+ Monocyte | gobp | L2 | GO:0070972 | protein localization to endoplasmic reticulum | 0.000211 | 6.3e-36 |
| CD14+ Monocyte | gobp | L2 | GO:0006612 | protein targeting to membrane | 4.14e-08 | 1.55e-34 |
| CD14+ Monocyte | gobp | L2 | GO:0090150 | establishment of protein localization to membrane | 3.13e-09 | 3.11e-45 |
| CD14+ Monocyte | gobp | L2 | GO:0000184 | nuclear-transcribed mRNA catabolic process, nonsense-mediated decay | 2.76e-09 | 5.73e-29 |
| CD14+ Monocyte | gobp | L2 | GO:0006413 | translational initiation | 6.92e-10 | 8.46e-43 |
| CD14+ Monocyte | gobp | L2 | GO:0006605 | protein targeting | 6.28e-12 | 1.38e-44 |
| CD14+ Monocyte | gobp | L3 | GO:0006119 | oxidative phosphorylation | 0.999 | 1.78e-31 |
| CD14+ Monocyte | gobp | L3 | GO:0042773 | ATP synthesis coupled electron transport | 0.000398 | 7.45e-24 |
| CD14+ Monocyte | gobp | L3 | GO:0042775 | mitochondrial ATP synthesis coupled electron transport | 0.000223 | 1.88e-23 |
| CD14+ Monocyte | gobp | L3 | GO:0009123 | nucleoside monophosphate metabolic process | 0.000175 | 2.02e-45 |
| CD14+ Monocyte | gobp | L3 | GO:0009126 | purine nucleoside monophosphate metabolic process | 5.85e-05 | 1.11e-42 |
| CD14+ Monocyte | gobp | L3 | GO:0009167 | purine ribonucleoside monophosphate metabolic process | 5.85e-05 | 1.11e-42 |
| CD14+ Monocyte | gobp | L3 | GO:0009161 | ribonucleoside monophosphate metabolic process | 1.15e-05 | 4.52e-42 |
| CD14+ Monocyte | gobp | L3 | GO:0009144 | purine nucleoside triphosphate metabolic process | 8.94e-06 | 1.93e-41 |
| CD14+ Monocyte | gobp | L3 | GO:0046034 | ATP metabolic process | 6.87e-06 | 8.17e-38 |
| CD14+ Monocyte | gobp | L3 | GO:0022904 | respiratory electron transport chain | 6.08e-06 | 6.09e-23 |
| CD14+ Monocyte | gobp | L4 | GO:0016192 | vesicle-mediated transport | 0.985 | 2.93e-145 |
| CD14+ Monocyte | gobp | L4 | GO:0002376 | immune system process | 0.00849 | 3.66e-228 |
| CD14+ Monocyte | gobp | L4 | GO:0006955 | immune response | 0.00197 | 8.73e-175 |
| CD14+ Monocyte | gobp | L4 | GO:0045055 | regulated exocytosis | 0.000873 | 1.87e-97 |
| CD14+ Monocyte | gobp | L4 | GO:0006810 | transport | 0.000864 | 3.32e-280 |
| CD14+ Monocyte | gobp | L4 | GO:0051234 | establishment of localization | 0.000683 | 1.58e-285 |
| CD14+ Monocyte | gobp | L4 | GO:0006887 | exocytosis | 0.000639 | 1.3e-98 |
| CD14+ Monocyte | gobp | L4 | GO:0042119 | neutrophil activation | 0.000259 | 8.79e-89 |
| CD14+ Monocyte | gobp | L4 | GO:0036230 | granulocyte activation | 0.000175 | 7.97e-89 |
| CD14+ Monocyte | gobp | L4 | GO:0043299 | leukocyte degranulation | 0.000152 | 1.41e-91 |
| CD14+ Monocyte | gobp | L5 | GO:0006915 | apoptotic process | 0.272 | 4.45e-113 |
| CD14+ Monocyte | gobp | L5 | GO:0012501 | programmed cell death | 0.195 | 8.3e-116 |
| CD14+ Monocyte | gobp | L5 | GO:0043067 | regulation of programmed cell death | 0.194 | 7.9e-95 |
| CD14+ Monocyte | gobp | L5 | GO:0042981 | regulation of apoptotic process | 0.158 | 1.19e-93 |
| CD14+ Monocyte | gobp | L5 | GO:0010941 | regulation of cell death | 0.101 | 4e-100 |
| CD14+ Monocyte | gobp | L5 | GO:0008219 | cell death | 0.0513 | 1.27e-119 |
| CD14+ Monocyte | gobp | L5 | GO:0002376 | immune system process | 0.00709 | 3.66e-228 |
| CD14+ Monocyte | gobp | L5 | GO:0016032 | viral process | 0.00345 | 2.8e-65 |
| CD14+ Monocyte | gobp | L5 | GO:0097190 | apoptotic signaling pathway | 0.00227 | 1.84e-46 |
| CD14+ Monocyte | gobp | L5 | GO:0044419 | interspecies interaction between organisms | 0.00226 | 1.33e-70 |
| CD14+ Monocyte | gobp | L6 | GO:0006518 | peptide metabolic process | 0.791 | 4.68e-78 |
| CD14+ Monocyte | gobp | L6 | GO:0006412 | translation | 0.12 | 1.09e-65 |
| CD14+ Monocyte | gobp | L6 | GO:0043043 | peptide biosynthetic process | 0.0828 | 4.55e-66 |
| CD14+ Monocyte | gobp | L6 | GO:0043603 | cellular amide metabolic process | 0.00248 | 2.33e-80 |
| CD14+ Monocyte | gobp | L6 | GO:0070125 | mitochondrial translational elongation | 0.00176 | 6.79e-17 |
| CD14+ Monocyte | gobp | L6 | GO:0043604 | amide biosynthetic process | 0.00117 | 8.36e-66 |
| CD14+ Monocyte | gobp | L6 | GO:0070126 | mitochondrial translational termination | 0.00066 | 4.56e-16 |
| CD14+ Monocyte | gobp | L6 | GO:0006413 | translational initiation | 0.000301 | 8.46e-43 |
| CD14+ Monocyte | gobp | L6 | GO:0006415 | translational termination | 0.000143 | 1.75e-15 |
| CD14+ Monocyte | gobp | L6 | GO:0006414 | translational elongation | 5.84e-05 | 5.01e-17 |
| CD14+ Monocyte | gobp | L7 | GO:0008380 | RNA splicing | 0.422 | 9.75e-38 |
| CD14+ Monocyte | gobp | L7 | GO:0000375 | RNA splicing, via transesterification reactions | 0.197 | 7.44e-32 |
| CD14+ Monocyte | gobp | L7 | GO:0000377 | RNA splicing, via transesterification reactions with bulged adenosine as nucleophile | 0.179 | 1.39e-31 |
| CD14+ Monocyte | gobp | L7 | GO:0000398 | mRNA splicing, via spliceosome | 0.179 | 1.39e-31 |
| CD14+ Monocyte | gobp | L7 | GO:0006397 | mRNA processing | 0.0211 | 7.47e-38 |
| CD14+ Monocyte | gobp | L7 | GO:0016071 | mRNA metabolic process | 0.0015 | 2.42e-69 |
| CD14+ Monocyte | gobp | L7 | GO:0016032 | viral process | 6.58e-05 | 2.8e-65 |
| CD14+ Monocyte | gobp | L7 | GO:0044419 | interspecies interaction between organisms | 3.83e-05 | 1.33e-70 |
| CD14+ Monocyte | gobp | L7 | GO:0044403 | symbiont process | 2.46e-05 | 2.16e-67 |
| CD14+ Monocyte | gobp | L7 | GO:0009124 | nucleoside monophosphate biosynthetic process | 2e-05 | 8.97e-24 |
gobp_nr
Adding missing grouping variables: `celltype`, `db`, `component`
`mutate_if()` ignored the following grouping variables:| celltype | db | component | geneSet | description | alpha | pValueHypergeometric |
|---|---|---|---|---|---|---|
| CD14+ Monocyte | gobp_nr | L1 | GO:0036230 | granulocyte activation | 0.976 | 2.4e-86 |
| CD14+ Monocyte | gobp_nr | L1 | GO:0002446 | neutrophil mediated immunity | 0.0241 | 1.75e-83 |
| CD14+ Monocyte | gobp_nr | L1 | GO:0002532 | production of molecular mediator involved in inflammatory response | 2.75e-26 | 4.73e-16 |
| CD14+ Monocyte | gobp_nr | L1 | GO:0002764 | immune response-regulating signaling pathway | 1.12e-26 | 1.24e-44 |
| CD14+ Monocyte | gobp_nr | L1 | GO:0006979 | response to oxidative stress | 8.64e-28 | 3.65e-35 |
| CD14+ Monocyte | gobp_nr | L1 | GO:0002576 | platelet degranulation | 7.4e-28 | 2e-14 |
| CD14+ Monocyte | gobp_nr | L1 | GO:2001057 | reactive nitrogen species metabolic process | 6.91e-28 | 2.12e-12 |
| CD14+ Monocyte | gobp_nr | L1 | GO:0006959 | humoral immune response | 6.84e-28 | 6.3e-18 |
| CD14+ Monocyte | gobp_nr | L1 | GO:0002250 | adaptive immune response | 5.86e-28 | 1.05e-37 |
| CD14+ Monocyte | gobp_nr | L1 | GO:0006968 | cellular defense response | 5.6e-28 | 3.02e-10 |
| CD14+ Monocyte | gobp_nr | L2 | GO:0006413 | translational initiation | 1 | 1.13e-41 |
| CD14+ Monocyte | gobp_nr | L2 | GO:0070972 | protein localization to endoplasmic reticulum | 5.97e-06 | 4.74e-35 |
| CD14+ Monocyte | gobp_nr | L2 | GO:0002181 | cytoplasmic translation | 7.07e-09 | 2.09e-16 |
| CD14+ Monocyte | gobp_nr | L2 | GO:0006401 | RNA catabolic process | 1.85e-09 | 1.51e-35 |
| CD14+ Monocyte | gobp_nr | L2 | GO:0002532 | production of molecular mediator involved in inflammatory response | 1.46e-09 | 4.73e-16 |
| CD14+ Monocyte | gobp_nr | L2 | GO:0006414 | translational elongation | 6.35e-10 | 1.98e-16 |
| CD14+ Monocyte | gobp_nr | L2 | GO:0006338 | chromatin remodeling | 5.41e-10 | 5.77e-19 |
| CD14+ Monocyte | gobp_nr | L2 | GO:0006605 | protein targeting | 3.47e-10 | 6.38e-43 |
| CD14+ Monocyte | gobp_nr | L2 | GO:0002764 | immune response-regulating signaling pathway | 3.16e-10 | 1.24e-44 |
| CD14+ Monocyte | gobp_nr | L2 | GO:0042769 | DNA damage response, detection of DNA damage | 2.54e-10 | 5.51e-09 |
| CD14+ Monocyte | gobp_nr | L3 | GO:0009123 | nucleoside monophosphate metabolic process | 0.988 | 5.79e-44 |
| CD14+ Monocyte | gobp_nr | L3 | GO:0009141 | nucleoside triphosphate metabolic process | 0.0117 | 5.15e-40 |
| CD14+ Monocyte | gobp_nr | L3 | GO:0006091 | generation of precursor metabolites and energy | 3.6e-06 | 2.13e-41 |
| CD14+ Monocyte | gobp_nr | L3 | GO:0033108 | mitochondrial respiratory chain complex assembly | 5.23e-07 | 2.43e-18 |
| CD14+ Monocyte | gobp_nr | L3 | GO:0009259 | ribonucleotide metabolic process | 4.64e-07 | 4.81e-39 |
| CD14+ Monocyte | gobp_nr | L3 | GO:0010257 | NADH dehydrogenase complex assembly | 8.77e-09 | 1.27e-12 |
| CD14+ Monocyte | gobp_nr | L3 | GO:0072522 | purine-containing compound biosynthetic process | 3.05e-09 | 9.37e-23 |
| CD14+ Monocyte | gobp_nr | L3 | GO:0002532 | production of molecular mediator involved in inflammatory response | 1.19e-09 | 4.73e-16 |
| CD14+ Monocyte | gobp_nr | L3 | GO:1901293 | nucleoside phosphate biosynthetic process | 1.13e-09 | 4.64e-25 |
| CD14+ Monocyte | gobp_nr | L3 | GO:1902600 | proton transmembrane transport | 1.08e-09 | 5.62e-15 |
| CD14+ Monocyte | gobp_nr | L4 | GO:0002521 | leukocyte differentiation | 0.619 | 9.45e-48 |
| CD14+ Monocyte | gobp_nr | L4 | GO:0042110 | T cell activation | 0.356 | 2.31e-47 |
| CD14+ Monocyte | gobp_nr | L4 | GO:0002250 | adaptive immune response | 0.00864 | 1.05e-37 |
| CD14+ Monocyte | gobp_nr | L4 | GO:0042113 | B cell activation | 0.00749 | 2.43e-29 |
| CD14+ Monocyte | gobp_nr | L4 | GO:0002694 | regulation of leukocyte activation | 0.00398 | 1.22e-45 |
| CD14+ Monocyte | gobp_nr | L4 | GO:1903706 | regulation of hemopoiesis | 0.00156 | 1.24e-35 |
| CD14+ Monocyte | gobp_nr | L4 | GO:0050867 | positive regulation of cell activation | 0.00108 | 2.63e-33 |
| CD14+ Monocyte | gobp_nr | L4 | GO:0002764 | immune response-regulating signaling pathway | 0.000618 | 1.24e-44 |
| CD14+ Monocyte | gobp_nr | L4 | GO:0007159 | leukocyte cell-cell adhesion | 0.000441 | 1.1e-32 |
| CD14+ Monocyte | gobp_nr | L4 | GO:0070661 | leukocyte proliferation | 0.00022 | 1.04e-28 |
| CD14+ Monocyte | gobp_nr | L5 | GO:0008380 | RNA splicing | 0.877 | 3.39e-36 |
| CD14+ Monocyte | gobp_nr | L5 | GO:0006397 | mRNA processing | 0.089 | 3.35e-36 |
| CD14+ Monocyte | gobp_nr | L5 | GO:0002532 | production of molecular mediator involved in inflammatory response | 0.00137 | 4.73e-16 |
| CD14+ Monocyte | gobp_nr | L5 | GO:0006338 | chromatin remodeling | 0.00135 | 5.77e-19 |
| CD14+ Monocyte | gobp_nr | L5 | GO:0033044 | regulation of chromosome organization | 0.00129 | 2.63e-28 |
| CD14+ Monocyte | gobp_nr | L5 | GO:1903311 | regulation of mRNA metabolic process | 0.00128 | 9.73e-24 |
| CD14+ Monocyte | gobp_nr | L5 | GO:0006414 | translational elongation | 0.00124 | 1.98e-16 |
| CD14+ Monocyte | gobp_nr | L5 | GO:0002764 | immune response-regulating signaling pathway | 0.000716 | 1.24e-44 |
| CD14+ Monocyte | gobp_nr | L5 | GO:0008213 | protein alkylation | 0.00058 | 2.78e-16 |
| CD14+ Monocyte | gobp_nr | L5 | GO:0042113 | B cell activation | 0.000485 | 2.43e-29 |
| CD14+ Monocyte | gobp_nr | L6 | GO:0090150 | establishment of protein localization to membrane | 0.756 | 9.08e-44 |
| CD14+ Monocyte | gobp_nr | L6 | GO:0070972 | protein localization to endoplasmic reticulum | 0.238 | 4.74e-35 |
| CD14+ Monocyte | gobp_nr | L6 | GO:0006605 | protein targeting | 0.00287 | 6.38e-43 |
| CD14+ Monocyte | gobp_nr | L6 | GO:0002532 | production of molecular mediator involved in inflammatory response | 0.000341 | 4.73e-16 |
| CD14+ Monocyte | gobp_nr | L6 | GO:0006414 | translational elongation | 0.000159 | 1.98e-16 |
| CD14+ Monocyte | gobp_nr | L6 | GO:0006338 | chromatin remodeling | 0.000112 | 5.77e-19 |
| CD14+ Monocyte | gobp_nr | L6 | GO:0002764 | immune response-regulating signaling pathway | 0.000108 | 1.24e-44 |
| CD14+ Monocyte | gobp_nr | L6 | GO:1904950 | negative regulation of establishment of protein localization | 8.32e-05 | 1.55e-17 |
| CD14+ Monocyte | gobp_nr | L6 | GO:0033044 | regulation of chromosome organization | 6.05e-05 | 2.63e-28 |
| CD14+ Monocyte | gobp_nr | L6 | GO:0033108 | mitochondrial respiratory chain complex assembly | 5.56e-05 | 2.43e-18 |
gomf
Adding missing grouping variables: `celltype`, `db`, `component`
`mutate_if()` ignored the following grouping variables:| celltype | db | component | geneSet | description | alpha | pValueHypergeometric |
|---|---|---|---|---|---|---|
| CD14+ Monocyte | gomf | L1 | GO:0003723 | RNA binding | 1 | 1.17e-141 |
| CD14+ Monocyte | gomf | L1 | GO:0005515 | protein binding | 1.75e-07 | 0 |
| CD14+ Monocyte | gomf | L1 | GO:0042802 | identical protein binding | 3.12e-10 | 1.44e-82 |
| CD14+ Monocyte | gomf | L1 | GO:0019899 | enzyme binding | 2.55e-10 | 1.68e-117 |
| CD14+ Monocyte | gomf | L1 | GO:0044877 | protein-containing complex binding | 2.34e-10 | 9.87e-64 |
| CD14+ Monocyte | gomf | L1 | GO:0003743 | translation initiation factor activity | 7.73e-11 | 1.26e-12 |
| CD14+ Monocyte | gomf | L1 | GO:0051082 | unfolded protein binding | 5.5e-11 | 9.32e-16 |
| CD14+ Monocyte | gomf | L1 | GO:0003682 | chromatin binding | 3.76e-11 | 2.63e-33 |
| CD14+ Monocyte | gomf | L1 | GO:0044389 | ubiquitin-like protein ligase binding | 1.63e-11 | 1.37e-24 |
| CD14+ Monocyte | gomf | L1 | GO:0031625 | ubiquitin protein ligase binding | 1.37e-11 | 1.65e-23 |
| CD14+ Monocyte | gomf | L2 | GO:0000981 | DNA-binding transcription factor activity, RNA polymerase II-specific | 1 | 1.4e-15 |
| CD14+ Monocyte | gomf | L2 | GO:0003700 | DNA-binding transcription factor activity | 0.000172 | 1.31e-20 |
| CD14+ Monocyte | gomf | L2 | GO:0003677 | DNA binding | 3.13e-08 | 5.11e-45 |
| CD14+ Monocyte | gomf | L2 | GO:0140110 | transcription regulator activity | 4.48e-10 | 1.25e-35 |
| CD14+ Monocyte | gomf | L2 | GO:0003676 | nucleic acid binding | 2.63e-12 | 2.63e-149 |
| CD14+ Monocyte | gomf | L2 | GO:0097159 | organic cyclic compound binding | 3.17e-15 | 1.19e-221 |
| CD14+ Monocyte | gomf | L2 | GO:1901363 | heterocyclic compound binding | 2.8e-15 | 6.92e-220 |
| CD14+ Monocyte | gomf | L2 | GO:0000976 | transcription regulatory region sequence-specific DNA binding | 9.49e-18 | 2.15e-36 |
| CD14+ Monocyte | gomf | L2 | GO:0001067 | regulatory region nucleic acid binding | 6.02e-18 | 3.23e-38 |
| CD14+ Monocyte | gomf | L2 | GO:0044212 | transcription regulatory region DNA binding | 5.61e-18 | 3.42e-38 |
| CD14+ Monocyte | gomf | L3 | GO:0001012 | RNA polymerase II regulatory region DNA binding | 0.66 | 1.25e-37 |
| CD14+ Monocyte | gomf | L3 | GO:0000977 | RNA polymerase II regulatory region sequence-specific DNA binding | 0.292 | 4.37e-37 |
| CD14+ Monocyte | gomf | L3 | GO:0000987 | proximal promoter sequence-specific DNA binding | 0.0358 | 2.76e-33 |
| CD14+ Monocyte | gomf | L3 | GO:0000978 | RNA polymerase II proximal promoter sequence-specific DNA binding | 0.00754 | 3.45e-32 |
| CD14+ Monocyte | gomf | L3 | GO:0000976 | transcription regulatory region sequence-specific DNA binding | 0.003 | 2.15e-36 |
| CD14+ Monocyte | gomf | L3 | GO:1990837 | sequence-specific double-stranded DNA binding | 0.000625 | 1.01e-38 |
| CD14+ Monocyte | gomf | L3 | GO:0043565 | sequence-specific DNA binding | 0.000263 | 5.05e-44 |
| CD14+ Monocyte | gomf | L3 | GO:0044212 | transcription regulatory region DNA binding | 2.75e-05 | 3.42e-38 |
| CD14+ Monocyte | gomf | L3 | GO:0001067 | regulatory region nucleic acid binding | 2.02e-05 | 3.23e-38 |
| CD14+ Monocyte | gomf | L3 | GO:0003690 | double-stranded DNA binding | 1.06e-05 | 5.83e-43 |
| CD14+ Monocyte | gomf | L4 | GO:0003735 | structural constituent of ribosome | 1 | 4.92e-44 |
| CD14+ Monocyte | gomf | L4 | GO:0015370 | solute:sodium symporter activity | 9.36e-14 | 0.991 |
| CD14+ Monocyte | gomf | L4 | GO:0003823 | antigen binding | 7.42e-14 | 3.66e-10 |
| CD14+ Monocyte | gomf | L4 | GO:0019199 | transmembrane receptor protein kinase activity | 6.22e-14 | 0.894 |
| CD14+ Monocyte | gomf | L4 | GO:0005310 | dicarboxylic acid transmembrane transporter activity | 4.74e-14 | 0.984 |
| CD14+ Monocyte | gomf | L4 | GO:0008157 | protein phosphatase 1 binding | 4.04e-14 | 6.26e-08 |
| CD14+ Monocyte | gomf | L4 | GO:0004298 | threonine-type endopeptidase activity | 3.67e-14 | 2.66e-07 |
| CD14+ Monocyte | gomf | L4 | GO:0070003 | threonine-type peptidase activity | 3.67e-14 | 2.66e-07 |
| CD14+ Monocyte | gomf | L4 | GO:0042287 | MHC protein binding | 3.2e-14 | 8.24e-08 |
| CD14+ Monocyte | gomf | L4 | GO:0140098 | catalytic activity, acting on RNA | 3.2e-14 | 7.85e-08 |
| CD14+ Monocyte | gomf | L5 | GO:0016655 | oxidoreductase activity, acting on NAD(P)H, quinone or similar compound as acceptor | 0.827 | 2.85e-17 |
| CD14+ Monocyte | gomf | L5 | GO:0008137 | NADH dehydrogenase (ubiquinone) activity | 0.0776 | 9.08e-15 |
| CD14+ Monocyte | gomf | L5 | GO:0050136 | NADH dehydrogenase (quinone) activity | 0.0776 | 9.08e-15 |
| CD14+ Monocyte | gomf | L5 | GO:0003954 | NADH dehydrogenase activity | 0.0176 | 5.48e-14 |
| CD14+ Monocyte | gomf | L5 | GO:0016651 | oxidoreductase activity, acting on NAD(P)H | 0.000139 | 1.13e-15 |
| CD14+ Monocyte | gomf | L5 | GO:0009055 | electron transfer activity | 3.59e-06 | 3.84e-14 |
| CD14+ Monocyte | gomf | L5 | GO:0015370 | solute:sodium symporter activity | 2.01e-06 | 0.991 |
| CD14+ Monocyte | gomf | L5 | GO:0016491 | oxidoreductase activity | 1.58e-06 | 2.38e-39 |
| CD14+ Monocyte | gomf | L5 | GO:0003823 | antigen binding | 1.54e-06 | 3.66e-10 |
| CD14+ Monocyte | gomf | L5 | GO:0019199 | transmembrane receptor protein kinase activity | 1.28e-06 | 0.894 |
| CD14+ Monocyte | gomf | L6 | GO:0045296 | cadherin binding | 0.789 | 4.05e-37 |
| CD14+ Monocyte | gomf | L6 | GO:0050839 | cell adhesion molecule binding | 0.188 | 1.11e-41 |
| CD14+ Monocyte | gomf | L6 | GO:0005515 | protein binding | 0.0011 | 0 |
| CD14+ Monocyte | gomf | L6 | GO:0042802 | identical protein binding | 0.000964 | 1.44e-82 |
| CD14+ Monocyte | gomf | L6 | GO:0044877 | protein-containing complex binding | 0.000567 | 9.87e-64 |
| CD14+ Monocyte | gomf | L6 | GO:0019899 | enzyme binding | 0.000473 | 1.68e-117 |
| CD14+ Monocyte | gomf | L6 | GO:0051082 | unfolded protein binding | 0.000388 | 9.32e-16 |
| CD14+ Monocyte | gomf | L6 | GO:0003823 | antigen binding | 0.000326 | 3.66e-10 |
| CD14+ Monocyte | gomf | L6 | GO:0019199 | transmembrane receptor protein kinase activity | 0.000265 | 0.894 |
| CD14+ Monocyte | gomf | L6 | GO:0015370 | solute:sodium symporter activity | 0.000254 | 0.991 |
kegg
Adding missing grouping variables: `celltype`, `db`, `component`
`mutate_if()` ignored the following grouping variables:| celltype | db | component | geneSet | description | alpha | pValueHypergeometric |
|---|---|---|---|---|---|---|
| CD14+ Monocyte | kegg | L1 | hsa03010 | Ribosome | 1 | 7.45e-35 |
| CD14+ Monocyte | kegg | L1 | hsa04640 | Hematopoietic cell lineage | 5.21e-15 | 8.77e-16 |
| CD14+ Monocyte | kegg | L1 | hsa04659 | Th17 cell differentiation | 3.25e-15 | 5.12e-17 |
| CD14+ Monocyte | kegg | L1 | hsa04350 | TGF-beta signaling pathway | 2.86e-15 | 0.415 |
| CD14+ Monocyte | kegg | L1 | hsa04142 | Lysosome | 2.82e-15 | 1.26e-15 |
| CD14+ Monocyte | kegg | L1 | hsa04512 | ECM-receptor interaction | 2.58e-15 | 0.447 |
| CD14+ Monocyte | kegg | L1 | hsa04390 | Hippo signaling pathway | 2.39e-15 | 0.144 |
| CD14+ Monocyte | kegg | L1 | hsa00030 | Pentose phosphate pathway | 2.37e-15 | 2.27e-06 |
| CD14+ Monocyte | kegg | L1 | hsa00900 | Terpenoid backbone biosynthesis | 2.31e-15 | 0.82 |
| CD14+ Monocyte | kegg | L1 | hsa05033 | Nicotine addiction | 2.03e-15 | 1 |
| CD14+ Monocyte | kegg | L2 | hsa05012 | Parkinson disease | 1 | 2.61e-33 |
| CD14+ Monocyte | kegg | L2 | hsa00190 | Oxidative phosphorylation | 9.66e-05 | 3.03e-29 |
| CD14+ Monocyte | kegg | L2 | hsa05016 | Huntington disease | 1.97e-06 | 1.99e-31 |
| CD14+ Monocyte | kegg | L2 | hsa04714 | Thermogenesis | 2.64e-08 | 1.86e-31 |
| CD14+ Monocyte | kegg | L2 | hsa05010 | Alzheimer disease | 1.14e-08 | 1.2e-26 |
| CD14+ Monocyte | kegg | L2 | hsa04932 | Non-alcoholic fatty liver disease (NAFLD) | 4.24e-12 | 2.34e-18 |
| CD14+ Monocyte | kegg | L2 | hsa04723 | Retrograde endocannabinoid signaling | 3.46e-13 | 8.1e-14 |
| CD14+ Monocyte | kegg | L2 | hsa04640 | Hematopoietic cell lineage | 9.59e-14 | 8.77e-16 |
| CD14+ Monocyte | kegg | L2 | hsa04659 | Th17 cell differentiation | 5.98e-14 | 5.12e-17 |
| CD14+ Monocyte | kegg | L2 | hsa05152 | Tuberculosis | 5.56e-14 | 4.88e-20 |
reactome
Adding missing grouping variables: `celltype`, `db`, `component`
`mutate_if()` ignored the following grouping variables:| celltype | db | component | geneSet | description | alpha | pValueHypergeometric |
|---|---|---|---|---|---|---|
| CD14+ Monocyte | reactome | L1 | R-HSA-6798695 | Neutrophil degranulation | 1 | 3.11e-81 |
| CD14+ Monocyte | reactome | L1 | R-HSA-168249 | Innate Immune System | 4.65e-06 | 8.93e-111 |
| CD14+ Monocyte | reactome | L1 | R-HSA-168256 | Immune System | 9.77e-14 | 8.76e-160 |
| CD14+ Monocyte | reactome | L1 | R-HSA-449147 | Signaling by Interleukins | 3.46e-26 | 1.04e-36 |
| CD14+ Monocyte | reactome | L1 | R-HSA-109582 | Hemostasis | 2.09e-26 | 1.61e-39 |
| CD14+ Monocyte | reactome | L1 | R-HSA-76002 | Platelet activation, signaling and aggregation | 1.47e-26 | 4.48e-25 |
| CD14+ Monocyte | reactome | L1 | R-HSA-1280215 | Cytokine Signaling in Immune system | 1.17e-26 | 1.93e-46 |
| CD14+ Monocyte | reactome | L1 | R-HSA-6785807 | Interleukin-4 and Interleukin-13 signaling | 1e-26 | 1.99e-16 |
| CD14+ Monocyte | reactome | L1 | R-HSA-5663205 | Infectious disease | 8.41e-27 | 4.06e-48 |
| CD14+ Monocyte | reactome | L1 | R-HSA-8953897 | Cellular responses to external stimuli | 6.25e-27 | 2.42e-32 |
| CD14+ Monocyte | reactome | L2 | R-HSA-72766 | Translation | 1 | 5.17e-59 |
| CD14+ Monocyte | reactome | L2 | R-HSA-156827 | L13a-mediated translational silencing of Ceruloplasmin expression | 1.51e-13 | 1.05e-40 |
| CD14+ Monocyte | reactome | L2 | R-HSA-72706 | GTP hydrolysis and joining of the 60S ribosomal subunit | 3.15e-14 | 1.48e-39 |
| CD14+ Monocyte | reactome | L2 | R-HSA-72613 | Eukaryotic Translation Initiation | 3.21e-15 | 3.57e-38 |
| CD14+ Monocyte | reactome | L2 | R-HSA-72737 | Cap-dependent Translation Initiation | 3.21e-15 | 3.57e-38 |
| CD14+ Monocyte | reactome | L2 | R-HSA-72689 | Formation of a pool of free 40S subunits | 6.26e-16 | 1.98e-36 |
| CD14+ Monocyte | reactome | L2 | R-HSA-1799339 | SRP-dependent cotranslational protein targeting to membrane | 3.36e-16 | 1.21e-36 |
| CD14+ Monocyte | reactome | L2 | R-HSA-156842 | Eukaryotic Translation Elongation | 2.2e-17 | 3.46e-34 |
| CD14+ Monocyte | reactome | L2 | R-HSA-2408522 | Selenoamino acid metabolism | 4.76e-18 | 3.97e-33 |
| CD14+ Monocyte | reactome | L2 | R-HSA-156902 | Peptide chain elongation | 4.19e-18 | 6.69e-33 |
| CD14+ Monocyte | reactome | L3 | R-HSA-163200 | Respiratory electron transport, ATP synthesis by chemiosmotic coupling, and heat production by uncoupling proteins. | 1 | 1.29e-30 |
| CD14+ Monocyte | reactome | L3 | R-HSA-611105 | Respiratory electron transport | 0.000365 | 2.56e-24 |
| CD14+ Monocyte | reactome | L3 | R-HSA-1428517 | The citric acid (TCA) cycle and respiratory electron transport | 2.39e-05 | 2.02e-28 |
| CD14+ Monocyte | reactome | L3 | R-HSA-6799198 | Complex I biogenesis | 2.81e-10 | 7.22e-13 |
| CD14+ Monocyte | reactome | L3 | R-HSA-8949613 | Cristae formation | 4.75e-11 | 3.54e-11 |
| CD14+ Monocyte | reactome | L3 | R-HSA-163210 | Formation of ATP by chemiosmotic coupling | 1.31e-11 | 1.25e-08 |
| CD14+ Monocyte | reactome | L3 | R-HSA-1592230 | Mitochondrial biogenesis | 3.27e-12 | 1.76e-14 |
| CD14+ Monocyte | reactome | L3 | R-HSA-1430728 | Metabolism | 1.04e-12 | 8.22e-117 |
| CD14+ Monocyte | reactome | L3 | R-HSA-202433 | Generation of second messenger molecules | 2.29e-13 | 1.53e-09 |
| CD14+ Monocyte | reactome | L3 | R-HSA-2871809 | FCERI mediated Ca+2 mobilization | 2e-13 | 1.32e-09 |
| CD14+ Monocyte | reactome | L5 | R-HSA-72172 | mRNA Splicing | 0.675 | 2.54e-25 |
| CD14+ Monocyte | reactome | L5 | R-HSA-72163 | mRNA Splicing - Major Pathway | 0.306 | 3.29e-24 |
| CD14+ Monocyte | reactome | L5 | R-HSA-72203 | Processing of Capped Intron-Containing Pre-mRNA | 0.018 | 2.1e-25 |
| CD14+ Monocyte | reactome | L5 | R-HSA-109688 | Cleavage of Growing Transcript in the Termination Region | 3.96e-05 | 3.41e-10 |
| CD14+ Monocyte | reactome | L5 | R-HSA-73856 | RNA Polymerase II Transcription Termination | 3.96e-05 | 3.41e-10 |
| CD14+ Monocyte | reactome | L5 | R-HSA-72187 | mRNA 3’-end processing | 3.31e-05 | 1.7e-09 |
| CD14+ Monocyte | reactome | L5 | R-HSA-5663205 | Infectious disease | 2.31e-05 | 4.06e-48 |
| CD14+ Monocyte | reactome | L5 | R-HSA-6785807 | Interleukin-4 and Interleukin-13 signaling | 2.27e-05 | 1.99e-16 |
| CD14+ Monocyte | reactome | L5 | R-HSA-202433 | Generation of second messenger molecules | 1.91e-05 | 1.53e-09 |
| CD14+ Monocyte | reactome | L5 | R-HSA-2871809 | FCERI mediated Ca+2 mobilization | 1.78e-05 | 1.32e-09 |
| CD14+ Monocyte | reactome | L6 | R-HSA-198933 | Immunoregulatory interactions between a Lymphoid and a non-Lymphoid cell | 0.997 | 5.1e-21 |
| CD14+ Monocyte | reactome | L6 | R-HSA-168256 | Immune System | 0.00054 | 8.76e-160 |
| CD14+ Monocyte | reactome | L6 | R-HSA-1280218 | Adaptive Immune System | 0.000359 | 1.66e-53 |
| CD14+ Monocyte | reactome | L6 | R-HSA-202433 | Generation of second messenger molecules | 0.000136 | 1.53e-09 |
| CD14+ Monocyte | reactome | L6 | R-HSA-6785807 | Interleukin-4 and Interleukin-13 signaling | 5.37e-05 | 1.99e-16 |
| CD14+ Monocyte | reactome | L6 | R-HSA-2871809 | FCERI mediated Ca+2 mobilization | 3.47e-05 | 1.32e-09 |
| CD14+ Monocyte | reactome | L6 | R-HSA-6782315 | tRNA modification in the nucleus and cytosol | 2.24e-05 | 0.891 |
| CD14+ Monocyte | reactome | L6 | R-HSA-983695 | Antigen activates B Cell Receptor (BCR) leading to generation of second messengers | 2.23e-05 | 7.73e-09 |
| CD14+ Monocyte | reactome | L6 | R-HSA-3299685 | Detoxification of Reactive Oxygen Species | 2.2e-05 | 3.81e-09 |
| CD14+ Monocyte | reactome | L6 | R-HSA-8856825 | Cargo recognition for clathrin-mediated endocytosis | 2.13e-05 | 2.5e-12 |
| CD14+ Monocyte | reactome | L7 | R-HSA-379726 | Mitochondrial tRNA aminoacylation | 0.997 | 0.693 |
| CD14+ Monocyte | reactome | L7 | R-HSA-202433 | Generation of second messenger molecules | 7.9e-05 | 1.53e-09 |
| CD14+ Monocyte | reactome | L7 | R-HSA-379724 | tRNA Aminoacylation | 7.71e-05 | 0.000221 |
| CD14+ Monocyte | reactome | L7 | R-HSA-2871809 | FCERI mediated Ca+2 mobilization | 6.76e-05 | 1.32e-09 |
| CD14+ Monocyte | reactome | L7 | R-HSA-6785807 | Interleukin-4 and Interleukin-13 signaling | 5.07e-05 | 1.99e-16 |
| CD14+ Monocyte | reactome | L7 | R-HSA-3299685 | Detoxification of Reactive Oxygen Species | 4.37e-05 | 3.81e-09 |
| CD14+ Monocyte | reactome | L7 | R-HSA-877312 | Regulation of IFNG signaling | 4e-05 | 7.16e-07 |
| CD14+ Monocyte | reactome | L7 | R-HSA-6782315 | tRNA modification in the nucleus and cytosol | 3.99e-05 | 0.891 |
| CD14+ Monocyte | reactome | L7 | R-HSA-1433557 | Signaling by SCF-KIT | 2.81e-05 | 7.59e-10 |
| CD14+ Monocyte | reactome | L7 | R-HSA-5578775 | Ion homeostasis | 2.81e-05 | 3.29e-08 |
wikipathway_cancer
Adding missing grouping variables: `celltype`, `db`, `component`
`mutate_if()` ignored the following grouping variables:
Warning in ensure_len_html(color, nrows, "color"): The number of provided values
in color does not equal to the number of rows.[1] “nothing to report…”
wikipathway
Adding missing grouping variables: `celltype`, `db`, `component`
`mutate_if()` ignored the following grouping variables:| celltype | db | component | geneSet | description | alpha | pValueHypergeometric |
|---|---|---|---|---|---|---|
| CD14+ Monocyte | wikipathway | L1 | WP477 | Cytoplasmic Ribosomal Proteins | 1 | 1.21e-29 |
| CD14+ Monocyte | wikipathway | L1 | WP3945 | TYROBP Causal Network | 7.93e-17 | 5.9e-14 |
| CD14+ Monocyte | wikipathway | L1 | WP2805 | exRNA mechanism of action and biogenesis | 6.57e-17 | 1 |
| CD14+ Monocyte | wikipathway | L1 | WP619 | Type II interferon signaling (IFNG) | 5.36e-17 | 4.08e-09 |
| CD14+ Monocyte | wikipathway | L1 | WP4304 | Oligodendrocyte Specification and differentiation(including remyelination), leading to Myelin Components for CNS | 3.06e-17 | 0.911 |
| CD14+ Monocyte | wikipathway | L1 | WP2328 | Allograft Rejection | 2.92e-17 | 2.7e-12 |
| CD14+ Monocyte | wikipathway | L1 | WP3888 | VEGFA-VEGFR2 Signaling Pathway | 2.48e-17 | 6.32e-35 |
| CD14+ Monocyte | wikipathway | L1 | WP411 | mRNA Processing | 2.3e-17 | 2.78e-17 |
| CD14+ Monocyte | wikipathway | L1 | WP4204 | Tumor suppressor activity of SMARCB1 | 2.17e-17 | 2.47e-07 |
| CD14+ Monocyte | wikipathway | L1 | WP3931 | ESC Pluripotency Pathways | 2.07e-17 | 0.273 |
| CD14+ Monocyte | wikipathway | L2 | WP111 | Electron Transport Chain (OXPHOS system in mitochondria) | 1 | 9.06e-28 |
| CD14+ Monocyte | wikipathway | L2 | WP623 | Oxidative phosphorylation | 0.00017 | 1.42e-19 |
| CD14+ Monocyte | wikipathway | L2 | WP4324 | Mitochondrial complex I assembly model OXPHOS system | 2.87e-09 | 1.53e-12 |
| CD14+ Monocyte | wikipathway | L2 | WP4396 | Nonalcoholic fatty liver disease | 2.81e-10 | 9.27e-18 |
| CD14+ Monocyte | wikipathway | L2 | WP3945 | TYROBP Causal Network | 4.08e-11 | 5.9e-14 |
| CD14+ Monocyte | wikipathway | L2 | WP619 | Type II interferon signaling (IFNG) | 3.57e-11 | 4.08e-09 |
| CD14+ Monocyte | wikipathway | L2 | WP2805 | exRNA mechanism of action and biogenesis | 3.27e-11 | 1 |
| CD14+ Monocyte | wikipathway | L2 | WP2328 | Allograft Rejection | 2.06e-11 | 2.7e-12 |
| CD14+ Monocyte | wikipathway | L2 | WP4304 | Oligodendrocyte Specification and differentiation(including remyelination), leading to Myelin Components for CNS | 1.94e-11 | 0.911 |
| CD14+ Monocyte | wikipathway | L2 | WP411 | mRNA Processing | 1.66e-11 | 2.78e-17 |
CD34+
gobp
Adding missing grouping variables: `celltype`, `db`, `component`
`mutate_if()` ignored the following grouping variables:| celltype | db | component | geneSet | description | alpha | pValueHypergeometric |
|---|---|---|---|---|---|---|
| CD34+ | gobp | L1 | GO:0001775 | cell activation | 0.987 | 2.63e-189 |
| CD34+ | gobp | L1 | GO:0045321 | leukocyte activation | 0.013 | 3.97e-173 |
| CD34+ | gobp | L1 | GO:0002376 | immune system process | 2.22e-08 | 8.2e-308 |
| CD34+ | gobp | L1 | GO:0002443 | leukocyte mediated immunity | 3.37e-11 | 5.91e-114 |
| CD34+ | gobp | L1 | GO:0006955 | immune response | 3.15e-11 | 7.56e-218 |
| CD34+ | gobp | L1 | GO:0002366 | leukocyte activation involved in immune response | 2.18e-11 | 8.13e-107 |
| CD34+ | gobp | L1 | GO:0002263 | cell activation involved in immune response | 1.72e-11 | 6.65e-107 |
| CD34+ | gobp | L1 | GO:0046649 | lymphocyte activation | 6.57e-13 | 1.91e-98 |
| CD34+ | gobp | L1 | GO:0002252 | immune effector process | 1.19e-13 | 2.02e-145 |
| CD34+ | gobp | L1 | GO:0043299 | leukocyte degranulation | 2.36e-14 | 9.84e-85 |
| CD34+ | gobp | L2 | GO:0006613 | cotranslational protein targeting to membrane | 0.813 | 7.18e-30 |
| CD34+ | gobp | L2 | GO:0006614 | SRP-dependent cotranslational protein targeting to membrane | 0.152 | 2.12e-28 |
| CD34+ | gobp | L2 | GO:0045047 | protein targeting to ER | 0.0274 | 4.08e-30 |
| CD34+ | gobp | L2 | GO:0072599 | establishment of protein localization to endoplasmic reticulum | 0.00688 | 6.23e-30 |
| CD34+ | gobp | L2 | GO:0070972 | protein localization to endoplasmic reticulum | 2.82e-06 | 2.47e-29 |
| CD34+ | gobp | L2 | GO:0006413 | translational initiation | 4.51e-07 | 5.03e-39 |
| CD34+ | gobp | L2 | GO:0000184 | nuclear-transcribed mRNA catabolic process, nonsense-mediated decay | 1.09e-07 | 2.52e-25 |
| CD34+ | gobp | L2 | GO:0006612 | protein targeting to membrane | 3.21e-09 | 2.61e-30 |
| CD34+ | gobp | L2 | GO:0043043 | peptide biosynthetic process | 3.02e-10 | 3.37e-78 |
| CD34+ | gobp | L2 | GO:0006412 | translation | 1.89e-10 | 4e-75 |
| CD34+ | gobp | L3 | GO:0006119 | oxidative phosphorylation | 0.999 | 4.56e-31 |
| CD34+ | gobp | L3 | GO:0042773 | ATP synthesis coupled electron transport | 0.000526 | 6.68e-22 |
| CD34+ | gobp | L3 | GO:0042775 | mitochondrial ATP synthesis coupled electron transport | 0.000367 | 1.5e-21 |
| CD34+ | gobp | L3 | GO:0046034 | ATP metabolic process | 8.31e-05 | 4.95e-41 |
| CD34+ | gobp | L3 | GO:0022904 | respiratory electron transport chain | 3.74e-05 | 2.46e-22 |
| CD34+ | gobp | L3 | GO:0009123 | nucleoside monophosphate metabolic process | 8.85e-06 | 4.08e-47 |
| CD34+ | gobp | L3 | GO:0009126 | purine nucleoside monophosphate metabolic process | 7.62e-06 | 2.32e-43 |
| CD34+ | gobp | L3 | GO:0009167 | purine ribonucleoside monophosphate metabolic process | 7.62e-06 | 2.32e-43 |
| CD34+ | gobp | L3 | GO:0009161 | ribonucleoside monophosphate metabolic process | 6.53e-06 | 1.45e-44 |
| CD34+ | gobp | L3 | GO:0009199 | ribonucleoside triphosphate metabolic process | 4.25e-06 | 1.61e-42 |
| CD34+ | gobp | L4 | GO:0044419 | interspecies interaction between organisms | 0.42 | 2.03e-99 |
| CD34+ | gobp | L4 | GO:0016032 | viral process | 0.383 | 3.87e-91 |
| CD34+ | gobp | L4 | GO:0044403 | symbiont process | 0.194 | 3.24e-95 |
| CD34+ | gobp | L4 | GO:0070887 | cellular response to chemical stimulus | 0.000206 | 4.8e-265 |
| CD34+ | gobp | L4 | GO:0051716 | cellular response to stimulus | 0.000151 | 0 |
| CD34+ | gobp | L4 | GO:0043933 | protein-containing complex subunit organization | 9.07e-05 | 5.77e-201 |
| CD34+ | gobp | L4 | GO:0032984 | protein-containing complex disassembly | 9.03e-05 | 2.49e-41 |
| CD34+ | gobp | L4 | GO:0010033 | response to organic substance | 8.85e-05 | 5.22e-265 |
| CD34+ | gobp | L4 | GO:0019058 | viral life cycle | 7.06e-05 | 3.9e-38 |
| CD34+ | gobp | L4 | GO:0002376 | immune system process | 6.4e-05 | 8.2e-308 |
gobp_nr
Adding missing grouping variables: `celltype`, `db`, `component`
`mutate_if()` ignored the following grouping variables:| celltype | db | component | geneSet | description | alpha | pValueHypergeometric |
|---|---|---|---|---|---|---|
| CD34+ | gobp_nr | L1 | GO:0002446 | neutrophil mediated immunity | 0.607 | 1.59e-76 |
| CD34+ | gobp_nr | L1 | GO:0036230 | granulocyte activation | 0.393 | 1.32e-76 |
| CD34+ | gobp_nr | L1 | GO:0009123 | nucleoside monophosphate metabolic process | 2.7e-09 | 2.05e-46 |
| CD34+ | gobp_nr | L1 | GO:0052547 | regulation of peptidase activity | 2.15e-09 | 8.57e-45 |
| CD34+ | gobp_nr | L1 | GO:0006091 | generation of precursor metabolites and energy | 1.38e-09 | 1.05e-55 |
| CD34+ | gobp_nr | L1 | GO:0006457 | protein folding | 1.34e-09 | 2.08e-29 |
| CD34+ | gobp_nr | L1 | GO:0019058 | viral life cycle | 1.14e-09 | 1.53e-37 |
| CD34+ | gobp_nr | L1 | GO:0006338 | chromatin remodeling | 1.04e-09 | 2.63e-24 |
| CD34+ | gobp_nr | L1 | GO:0032984 | protein-containing complex disassembly | 8.68e-10 | 1.16e-40 |
| CD34+ | gobp_nr | L1 | GO:0009141 | nucleoside triphosphate metabolic process | 7.22e-10 | 5.76e-42 |
| CD34+ | gobp_nr | L2 | GO:0006413 | translational initiation | 1 | 1.65e-38 |
| CD34+ | gobp_nr | L2 | GO:0070972 | protein localization to endoplasmic reticulum | 0.000335 | 5.99e-29 |
| CD34+ | gobp_nr | L2 | GO:0090150 | establishment of protein localization to membrane | 7.81e-07 | 2.76e-41 |
| CD34+ | gobp_nr | L2 | GO:0006401 | RNA catabolic process | 4.43e-07 | 3.94e-42 |
| CD34+ | gobp_nr | L2 | GO:0006338 | chromatin remodeling | 1.31e-07 | 2.63e-24 |
| CD34+ | gobp_nr | L2 | GO:0009123 | nucleoside monophosphate metabolic process | 1.16e-07 | 2.05e-46 |
| CD34+ | gobp_nr | L2 | GO:0032984 | protein-containing complex disassembly | 1.08e-07 | 1.16e-40 |
| CD34+ | gobp_nr | L2 | GO:0006605 | protein targeting | 9.03e-08 | 3.22e-47 |
| CD34+ | gobp_nr | L2 | GO:0010257 | NADH dehydrogenase complex assembly | 8.33e-08 | 1.83e-15 |
| CD34+ | gobp_nr | L2 | GO:0052547 | regulation of peptidase activity | 7.68e-08 | 8.57e-45 |
gomf
Adding missing grouping variables: `celltype`, `db`, `component`
`mutate_if()` ignored the following grouping variables:| celltype | db | component | geneSet | description | alpha | pValueHypergeometric |
|---|---|---|---|---|---|---|
| CD34+ | gomf | L1 | GO:0003735 | structural constituent of ribosome | 1 | 4.13e-42 |
| CD34+ | gomf | L1 | GO:0003723 | RNA binding | 4.15e-12 | 4.44e-179 |
| CD34+ | gomf | L1 | GO:0005198 | structural molecule activity | 8.87e-15 | 5.62e-62 |
| CD34+ | gomf | L1 | GO:0052744 | phosphatidylinositol monophosphate phosphatase activity | 6.94e-15 | 0.977 |
| CD34+ | gomf | L1 | GO:0004438 | phosphatidylinositol-3-phosphatase activity | 3.07e-15 | 0.965 |
| CD34+ | gomf | L1 | GO:0052629 | phosphatidylinositol-3,5-bisphosphate 3-phosphatase activity | 1.71e-15 | 0.973 |
| CD34+ | gomf | L1 | GO:0016655 | oxidoreductase activity, acting on NAD(P)H, quinone or similar compound as acceptor | 1.65e-15 | 1.11e-16 |
| CD34+ | gomf | L1 | GO:0008137 | NADH dehydrogenase (ubiquinone) activity | 1.52e-15 | 6.24e-15 |
| CD34+ | gomf | L1 | GO:0050136 | NADH dehydrogenase (quinone) activity | 1.52e-15 | 6.24e-15 |
| CD34+ | gomf | L1 | GO:0043812 | phosphatidylinositol-4-phosphate phosphatase activity | 7.83e-16 | 1 |
| CD34+ | gomf | L2 | GO:0005515 | protein binding | 1 | 0 |
| CD34+ | gomf | L2 | GO:0005488 | binding | 3.49e-13 | 0 |
| CD34+ | gomf | L2 | GO:0003674 | molecular_function | 3.67e-15 | 0 |
| CD34+ | gomf | L2 | GO:0019899 | enzyme binding | 1.55e-31 | 1.28e-207 |
| CD34+ | gomf | L2 | GO:0003824 | catalytic activity | 9.91e-37 | 0 |
| CD34+ | gomf | L2 | GO:0003723 | RNA binding | 7.77e-38 | 4.44e-179 |
| CD34+ | gomf | L2 | GO:0042802 | identical protein binding | 1.72e-39 | 2.63e-134 |
| CD34+ | gomf | L2 | GO:0044877 | protein-containing complex binding | 7.71e-41 | 7.68e-100 |
| CD34+ | gomf | L2 | GO:0097159 | organic cyclic compound binding | 1.83e-41 | 0 |
| CD34+ | gomf | L2 | GO:1901363 | heterocyclic compound binding | 5.95e-42 | 0 |
kegg
Adding missing grouping variables: `celltype`, `db`, `component`
`mutate_if()` ignored the following grouping variables:| celltype | db | component | geneSet | description | alpha | pValueHypergeometric |
|---|---|---|---|---|---|---|
| CD34+ | kegg | L1 | hsa00190 | Oxidative phosphorylation | 0.992 | 4.89e-32 |
| CD34+ | kegg | L1 | hsa05012 | Parkinson disease | 0.00739 | 6.35e-33 |
| CD34+ | kegg | L1 | hsa05010 | Alzheimer disease | 0.000527 | 8e-37 |
| CD34+ | kegg | L1 | hsa05016 | Huntington disease | 2.37e-06 | 1.2e-32 |
| CD34+ | kegg | L1 | hsa04714 | Thermogenesis | 1.19e-06 | 7.54e-36 |
| CD34+ | kegg | L1 | hsa04932 | Non-alcoholic fatty liver disease (NAFLD) | 3.53e-08 | 2.53e-24 |
| CD34+ | kegg | L1 | hsa04723 | Retrograde endocannabinoid signaling | 5.87e-09 | 4.75e-19 |
| CD34+ | kegg | L1 | hsa04260 | Cardiac muscle contraction | 2.18e-09 | 7.21e-12 |
| CD34+ | kegg | L1 | hsa05130 | Pathogenic Escherichia coli infection | 1.36e-09 | 1.67e-13 |
| CD34+ | kegg | L1 | hsa04640 | Hematopoietic cell lineage | 1.23e-09 | 2.31e-18 |
| CD34+ | kegg | L2 | hsa03010 | Ribosome | 1 | 5.68e-34 |
| CD34+ | kegg | L2 | hsa05130 | Pathogenic Escherichia coli infection | 2.32e-10 | 1.67e-13 |
| CD34+ | kegg | L2 | hsa04640 | Hematopoietic cell lineage | 2.11e-10 | 2.31e-18 |
| CD34+ | kegg | L2 | hsa04720 | Long-term potentiation | 2.08e-10 | 3.3e-14 |
| CD34+ | kegg | L2 | hsa04512 | ECM-receptor interaction | 1.56e-10 | 0.0742 |
| CD34+ | kegg | L2 | hsa00780 | Biotin metabolism | 1.25e-10 | 1 |
| CD34+ | kegg | L2 | hsa00430 | Taurine and hypotaurine metabolism | 1.08e-10 | 0.934 |
| CD34+ | kegg | L2 | hsa00790 | Folate biosynthesis | 1.03e-10 | 0.476 |
| CD34+ | kegg | L2 | hsa04670 | Leukocyte transendothelial migration | 9.03e-11 | 1.11e-17 |
| CD34+ | kegg | L2 | hsa00563 | Glycosylphosphatidylinositol (GPI)-anchor biosynthesis | 7.9e-11 | 0.356 |
reactome
Adding missing grouping variables: `celltype`, `db`, `component`
`mutate_if()` ignored the following grouping variables:| celltype | db | component | geneSet | description | alpha | pValueHypergeometric |
|---|---|---|---|---|---|---|
| CD34+ | reactome | L1 | R-HSA-72764 | Eukaryotic Translation Termination | 0.993 | 2.28e-33 |
| CD34+ | reactome | L1 | R-HSA-156902 | Peptide chain elongation | 0.00453 | 7.76e-32 |
| CD34+ | reactome | L1 | R-HSA-156842 | Eukaryotic Translation Elongation | 0.00214 | 5.5e-33 |
| CD34+ | reactome | L1 | R-HSA-192823 | Viral mRNA Translation | 0.000224 | 4.8e-30 |
| CD34+ | reactome | L1 | R-HSA-975956 | Nonsense Mediated Decay (NMD) independent of the Exon Junction Complex (EJC) | 6.05e-05 | 1.13e-30 |
| CD34+ | reactome | L1 | R-HSA-72689 | Formation of a pool of free 40S subunits | 3.12e-06 | 6.37e-33 |
| CD34+ | reactome | L1 | R-HSA-2408557 | Selenocysteine synthesis | 3.49e-07 | 1.99e-28 |
| CD34+ | reactome | L1 | R-HSA-72706 | GTP hydrolysis and joining of the 60S ribosomal subunit | 2.51e-07 | 1.79e-35 |
| CD34+ | reactome | L1 | R-HSA-156827 | L13a-mediated translational silencing of Ceruloplasmin expression | 2.39e-07 | 4.23e-35 |
| CD34+ | reactome | L1 | R-HSA-72613 | Eukaryotic Translation Initiation | 4.7e-10 | 8.82e-34 |
| CD34+ | reactome | L2 | R-HSA-6798695 | Neutrophil degranulation | 0.986 | 1.52e-75 |
| CD34+ | reactome | L2 | R-HSA-168249 | Innate Immune System | 0.0137 | 6.47e-123 |
| CD34+ | reactome | L2 | R-HSA-168256 | Immune System | 1.27e-05 | 8.36e-210 |
| CD34+ | reactome | L2 | R-HSA-109582 | Hemostasis | 9.23e-10 | 1.39e-62 |
| CD34+ | reactome | L2 | R-HSA-5357801 | Programmed Cell Death | 1.96e-10 | 1.09e-26 |
| CD34+ | reactome | L2 | R-HSA-76002 | Platelet activation, signaling and aggregation | 1.46e-10 | 1.02e-31 |
| CD34+ | reactome | L2 | R-HSA-109581 | Apoptosis | 1.33e-10 | 8.98e-26 |
| CD34+ | reactome | L2 | R-HSA-76005 | Response to elevated platelet cytosolic Ca2+ | 1.28e-10 | 7.78e-20 |
| CD34+ | reactome | L2 | R-HSA-381676 | Glucagon-like Peptide-1 (GLP1) regulates insulin secretion | 1.23e-10 | 1.68e-11 |
| CD34+ | reactome | L2 | R-HSA-3781865 | Diseases of glycosylation | 9.01e-11 | 0.0404 |
| CD34+ | reactome | L3 | R-HSA-163200 | Respiratory electron transport, ATP synthesis by chemiosmotic coupling, and heat production by uncoupling proteins. | 0.998 | 8.43e-32 |
| CD34+ | reactome | L3 | R-HSA-611105 | Respiratory electron transport | 0.0022 | 2.83e-25 |
| CD34+ | reactome | L3 | R-HSA-1428517 | The citric acid (TCA) cycle and respiratory electron transport | 7.2e-05 | 3.97e-32 |
| CD34+ | reactome | L3 | R-HSA-6799198 | Complex I biogenesis | 2.49e-07 | 1.44e-14 |
| CD34+ | reactome | L3 | R-HSA-163210 | Formation of ATP by chemiosmotic coupling | 2.56e-09 | 1.2e-07 |
| CD34+ | reactome | L3 | R-HSA-2453902 | The canonical retinoid cycle in rods (twilight vision) | 1.04e-09 | 0.975 |
| CD34+ | reactome | L3 | R-HSA-3781865 | Diseases of glycosylation | 5.12e-10 | 0.0404 |
| CD34+ | reactome | L3 | R-HSA-381676 | Glucagon-like Peptide-1 (GLP1) regulates insulin secretion | 4.54e-10 | 1.68e-11 |
| CD34+ | reactome | L3 | R-HSA-2214320 | Anchoring fibril formation | 4.34e-10 | 0.976 |
| CD34+ | reactome | L3 | R-HSA-8949613 | Cristae formation | 3.57e-10 | 1.66e-08 |
| CD34+ | reactome | L4 | R-HSA-198933 | Immunoregulatory interactions between a Lymphoid and a non-Lymphoid cell | 1 | 1.15e-26 |
| CD34+ | reactome | L4 | R-HSA-2453902 | The canonical retinoid cycle in rods (twilight vision) | 1.62e-06 | 0.975 |
| CD34+ | reactome | L4 | R-HSA-3781865 | Diseases of glycosylation | 9.02e-07 | 0.0404 |
| CD34+ | reactome | L4 | R-HSA-168256 | Immune System | 8.13e-07 | 8.36e-210 |
| CD34+ | reactome | L4 | R-HSA-381676 | Glucagon-like Peptide-1 (GLP1) regulates insulin secretion | 7.71e-07 | 1.68e-11 |
| CD34+ | reactome | L4 | R-HSA-109582 | Hemostasis | 7.47e-07 | 1.39e-62 |
| CD34+ | reactome | L4 | R-HSA-2214320 | Anchoring fibril formation | 4.09e-07 | 0.976 |
| CD34+ | reactome | L4 | R-HSA-211935 | Fatty acids | 4.02e-07 | 0.976 |
| CD34+ | reactome | L4 | R-HSA-8862803 | Deregulated CDK5 triggers multiple neurodegenerative pathways in Alzheimer’s disease models | 3.78e-07 | 8.38e-09 |
| CD34+ | reactome | L4 | R-HSA-8863678 | Neurodegenerative Diseases | 3.78e-07 | 8.38e-09 |
wikipathway_cancer
Adding missing grouping variables: `celltype`, `db`, `component`
`mutate_if()` ignored the following grouping variables:
Warning in ensure_len_html(color, nrows, "color"): The number of provided values
in color does not equal to the number of rows.[1] “nothing to report…”
wikipathway
Adding missing grouping variables: `celltype`, `db`, `component`
`mutate_if()` ignored the following grouping variables:| celltype | db | component | geneSet | description | alpha | pValueHypergeometric |
|---|---|---|---|---|---|---|
| CD34+ | wikipathway | L1 | WP477 | Cytoplasmic Ribosomal Proteins | 1 | 1.33e-30 |
| CD34+ | wikipathway | L1 | WP4661 | Amino Acid Metabolism Pathway Excerpt (Histidine catabolism extension) | 1.4e-20 | 1 |
| CD34+ | wikipathway | L1 | WP4545 | Oxysterols derived from cholesterol | 2.34e-21 | 0.778 |
| CD34+ | wikipathway | L1 | WP3945 | TYROBP Causal Network | 1.95e-21 | 2.01e-15 |
| CD34+ | wikipathway | L1 | WP2272 | Pathogenic Escherichia coli infection | 1.57e-21 | 2.45e-13 |
| CD34+ | wikipathway | L1 | WP400 | p38 MAPK Signaling Pathway | 1.13e-21 | 0.232 |
| CD34+ | wikipathway | L1 | WP229 | Irinotecan Pathway | 9.94e-22 | 0.87 |
| CD34+ | wikipathway | L1 | WP2645 | Heroin metabolism | 7.31e-22 | 1 |
| CD34+ | wikipathway | L1 | WP2826 | Cocaine metabolism | 7.31e-22 | 1 |
| CD34+ | wikipathway | L1 | WP43 | Oxidation by Cytochrome P450 | 6.27e-22 | 0.263 |
| CD34+ | wikipathway | L2 | WP111 | Electron Transport Chain (OXPHOS system in mitochondria) | 1 | 1.52e-31 |
| CD34+ | wikipathway | L2 | WP623 | Oxidative phosphorylation | 2.91e-06 | 2.63e-21 |
| CD34+ | wikipathway | L2 | WP4396 | Nonalcoholic fatty liver disease | 3.88e-12 | 2.78e-24 |
| CD34+ | wikipathway | L2 | WP4324 | Mitochondrial complex I assembly model OXPHOS system | 1.21e-12 | 2.47e-12 |
| CD34+ | wikipathway | L2 | WP4661 | Amino Acid Metabolism Pathway Excerpt (Histidine catabolism extension) | 5.8e-13 | 1 |
| CD34+ | wikipathway | L2 | WP4545 | Oxysterols derived from cholesterol | 1.38e-13 | 0.778 |
| CD34+ | wikipathway | L2 | WP2272 | Pathogenic Escherichia coli infection | 1.03e-13 | 2.45e-13 |
| CD34+ | wikipathway | L2 | WP3945 | TYROBP Causal Network | 9.66e-14 | 2.01e-15 |
| CD34+ | wikipathway | L2 | WP400 | p38 MAPK Signaling Pathway | 7.36e-14 | 0.232 |
| CD34+ | wikipathway | L2 | WP229 | Irinotecan Pathway | 5.54e-14 | 0.87 |
Designing visualizations
There are a lot of facets of the enrichment results we might want to communicate.
Its common to plot against the proportion of the genes in the list, but this obscures the sensitivity of the analysis to gene set size. Recreating a standard enrichment plot.
ct = celltypes[1]
gs = 'gobp'

cs.summary %>%
  filter(celltype == ct, db == gs, active_cs, row_number() <= 10) %>%
  mutate(geneSet=factor(geneSet, levels=geneSet[order((propInList))])) %>%
  arrange(component, desc(propInList)) %>%
  ggplot(aes(x=propInList, y=geneSet, size=geneSetSize, color=-log10(pValueHypergeometric))) +
  geom_point() + facet_wrap(vars(component), scale='free_y', ncol = 1)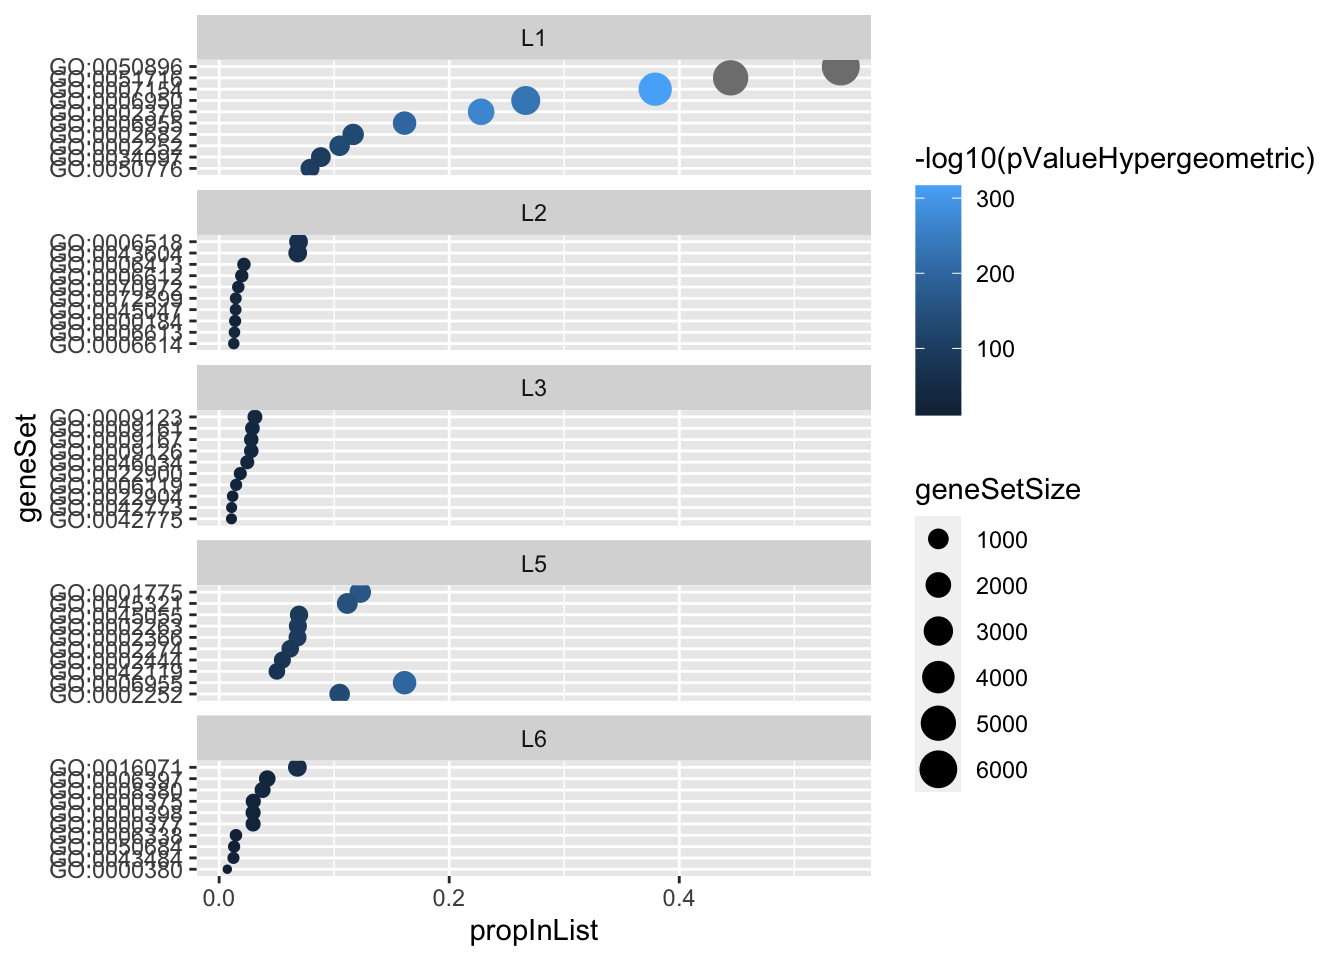
| Version | Author | Date |
|---|---|---|
| e572f0a | karltayeb | 2022-03-30 |
The strongest marginal enticements come from the largest gene sets. But SuSiE is able to prioritizing smaller gene sets. The right ones? Who knows.
cs.summary %>%
  ggplot(aes(x=-log10(pValueHypergeometric), y=geneSetSize)) +
  geom_point() + geom_smooth()
`geom_smooth()` using method = 'gam' and formula 'y ~ s(x, bs = "cs")'Warning: Removed 198 rows containing non-finite values (stat_smooth).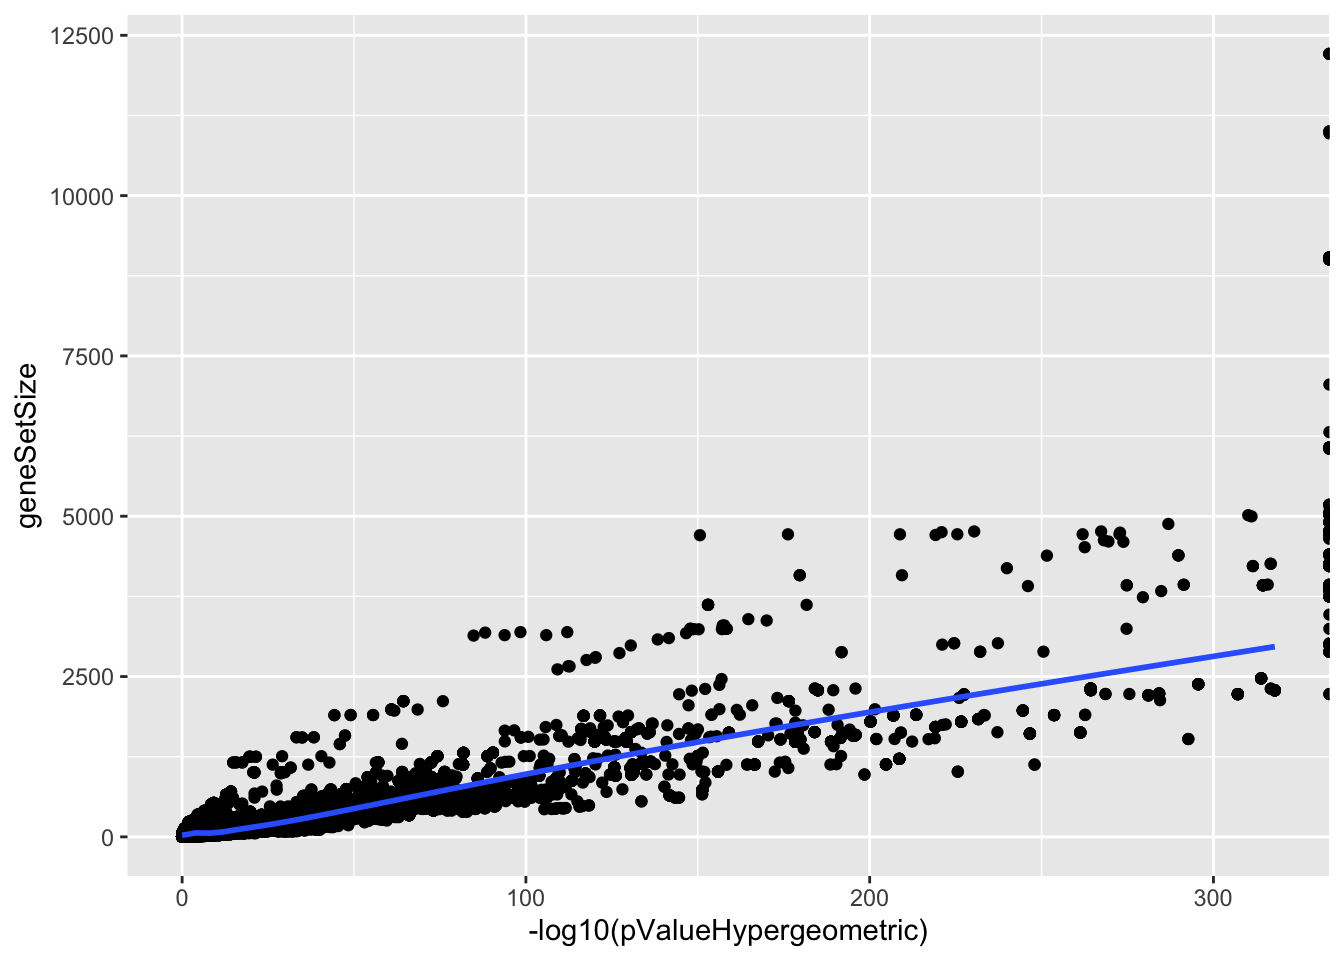
| Version | Author | Date |
|---|---|---|
| e572f0a | karltayeb | 2022-03-30 |
Here, for the gene sets assigned to SuSiE components, we plot the proportion of the gene set observed. The bubble size is given by the gene set size, and the color indicates alpha, the posterior probability that the gene set is selected by the component.
I’m surprised to see gene sets with large alpha, but only modest proportion
cs.summary %>%
  filter(celltype == ct, db == 'gobp', active_cs, row_number() <= 10) %>%
  mutate(geneSet=factor(geneSet, levels=geneSet[order((propInList))])) %>%
  arrange(component, desc(propInList)) %>%
  ggplot(aes(x=propInList, y=geneSet, color=alpha, size=geneSetSize)) +
  geom_point() + facet_wrap(vars(component), scale='free_y', ncol = 1)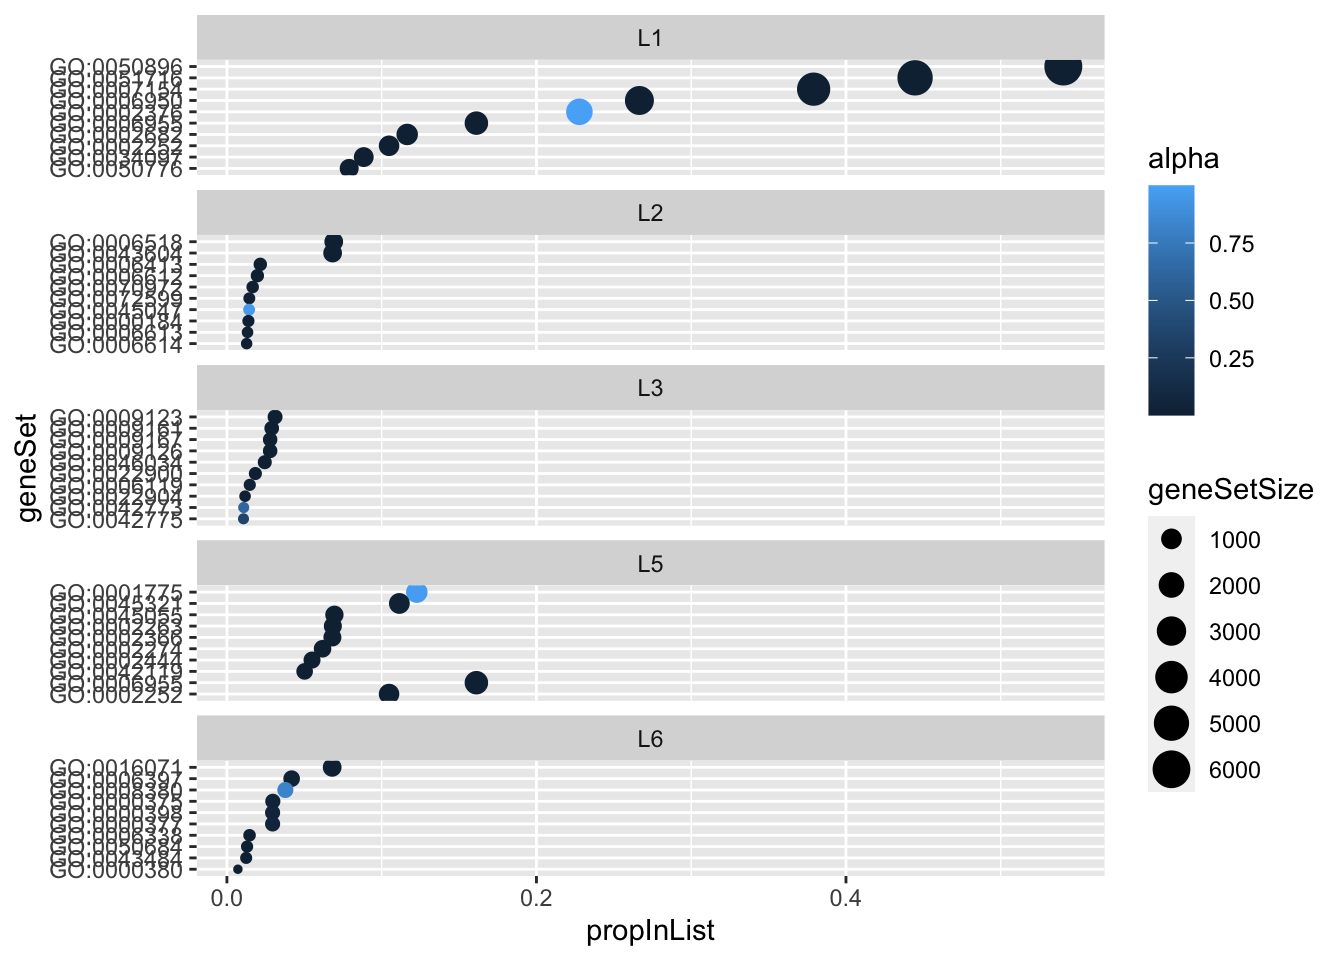
| Version | Author | Date |
|---|---|---|
| e572f0a | karltayeb | 2022-03-30 |
cs.summary %>%
  filter(celltype == ct, db == 'gobp', active_cs, row_number() <= 10) %>%
  mutate(geneSet=factor(geneSet, levels=geneSet[order((propInList))])) %>%
  arrange(component, desc(propInList)) %>%
  ggplot(aes(x=propInList, y=geneSet, color=in_cs, size=geneSetSize)) +
  geom_point() + facet_wrap(vars(component), scale='free_y', ncol = 1)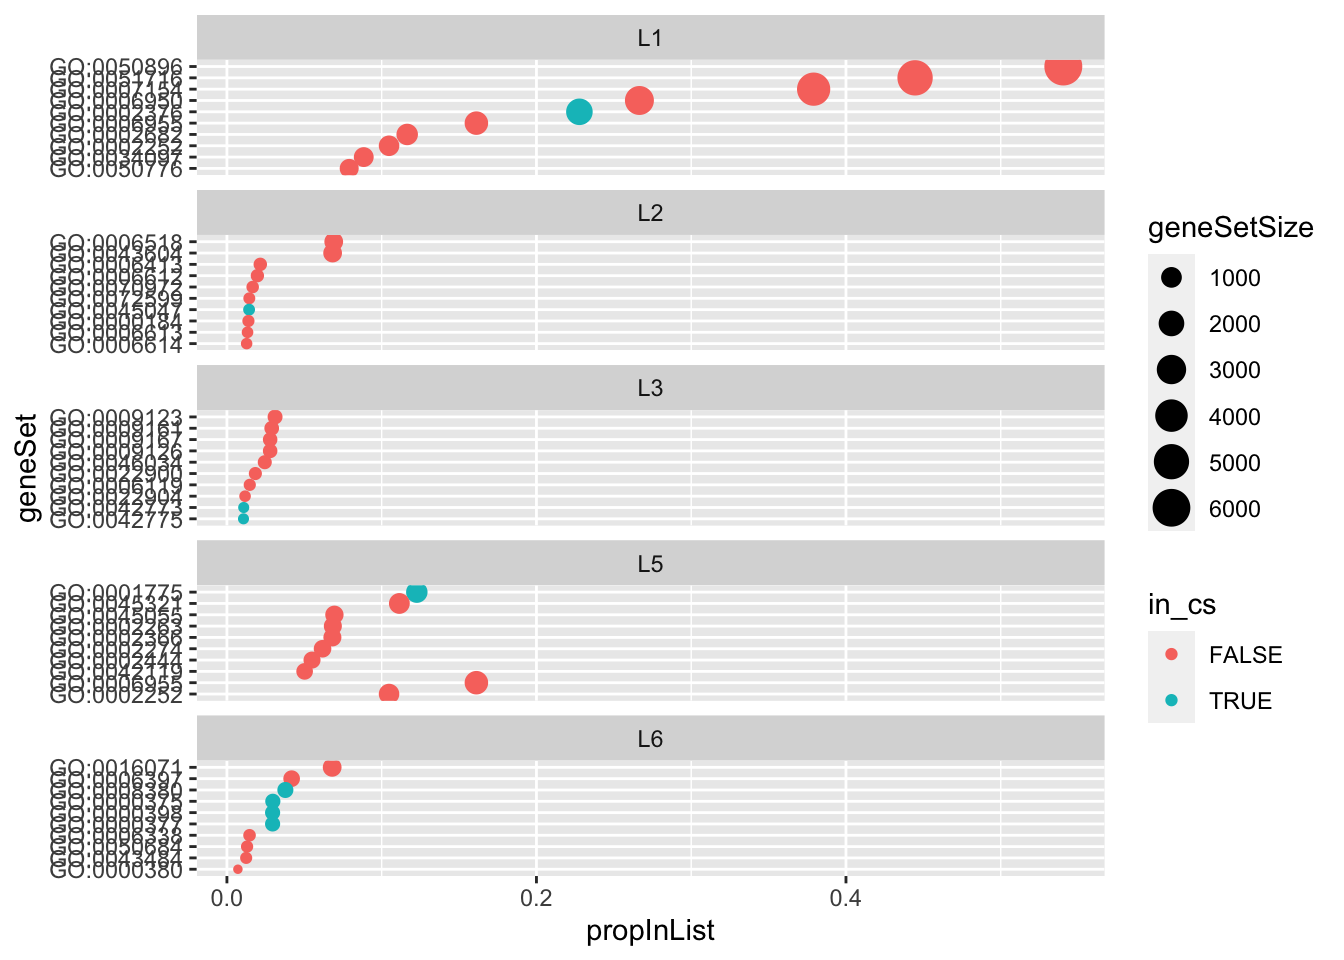
| Version | Author | Date |
|---|---|---|
| e572f0a | karltayeb | 2022-03-30 |
Credible set distributions
cs.summary %>%
  group_by(celltype, db, component) %>%
  summarise(entropy = -sum(alpha * log(alpha)), n = n()) %>%
  ggplot(aes(x=entropy)) + geom_histogram() + labs(title='component entropy')
`summarise()` has grouped output by 'celltype', 'db'. You can override using
the `.groups` argument.
`stat_bin()` using `bins = 30`. Pick better value with `binwidth`.
cs.summary %>%
  filter(active_cs, in_cs) %>%
  group_by(celltype, db, component) %>%
  summarise( n = n()) %>%
  ggplot(aes(x=n)) + geom_histogram() + labs(title='95% Credible set size')
`summarise()` has grouped output by 'celltype', 'db'. You can override using
the `.groups` argument.
`stat_bin()` using `bins = 30`. Pick better value with `binwidth`.
knitr::knit_exit()