Recovery RNAseq DOX Data
Emma M Pfortmiller
2025-02-10
Last updated: 2025-04-22
Checks: 6 1
Knit directory: Recovery_5FU/
This reproducible R Markdown analysis was created with workflowr (version 1.7.1). The Checks tab describes the reproducibility checks that were applied when the results were created. The Past versions tab lists the development history.
Great! Since the R Markdown file has been committed to the Git repository, you know the exact version of the code that produced these results.
Great job! The global environment was empty. Objects defined in the global environment can affect the analysis in your R Markdown file in unknown ways. For reproduciblity it’s best to always run the code in an empty environment.
The command set.seed(20250217) was run prior to running
the code in the R Markdown file. Setting a seed ensures that any results
that rely on randomness, e.g. subsampling or permutations, are
reproducible.
Great job! Recording the operating system, R version, and package versions is critical for reproducibility.
Nice! There were no cached chunks for this analysis, so you can be confident that you successfully produced the results during this run.
Using absolute paths to the files within your workflowr project makes it difficult for you and others to run your code on a different machine. Change the absolute path(s) below to the suggested relative path(s) to make your code more reproducible.
| absolute | relative |
|---|---|
| C:/Users/emmap/RDirectory/Recovery_RNAseq/Recovery_5FU/data/ensembl_backup_dox.RDS | data/ensembl_backup_dox.RDS |
| C:/Users/emmap/RDirectory/Recovery_RNAseq/Recovery_5FU/data/ind_num_dox.RDS | data/ind_num_dox.RDS |
| C:/Users/emmap/RDirectory/Recovery_RNAseq/Recovery_5FU/data/annot_dox.RDS | data/annot_dox.RDS |
Great! You are using Git for version control. Tracking code development and connecting the code version to the results is critical for reproducibility.
The results in this page were generated with repository version 4ffd5ad. See the Past versions tab to see a history of the changes made to the R Markdown and HTML files.
Note that you need to be careful to ensure that all relevant files for
the analysis have been committed to Git prior to generating the results
(you can use wflow_publish or
wflow_git_commit). workflowr only checks the R Markdown
file, but you know if there are other scripts or data files that it
depends on. Below is the status of the Git repository when the results
were generated:
Ignored files:
    Ignored:    .Rhistory
    Ignored:    .Rproj.user/
    Ignored:    analysis/figure/
    Ignored:    data/CDKN1A_geneplot_Dox.RDS
    Ignored:    data/Cormotif_prob_gene_list.RDS
    Ignored:    data/Cormotif_prob_gene_list_doxonly.RDS
    Ignored:    data/DMSO_TNN13_plot.RDS
    Ignored:    data/DOX_TNN13_plot.RDS
    Ignored:    data/DOXgeneplots.RDS
    Ignored:    data/MDM2_geneplot_Dox.RDS
    Ignored:    data/SIRT1_geneplot_Dox.RDS
    Ignored:    data/annot_dox.RDS
    Ignored:    data/cormotifARclust_pp.RDS
    Ignored:    data/counts_DE_df_dox.RDS
    Ignored:    data/ensembl_backup_dox.RDS
    Ignored:    data/filt_gene_list_dox.RDS
    Ignored:    data/gene_clustlike_motif.RDS
    Ignored:    data/gene_postprob_motif.RDS
    Ignored:    data/genematrix_dox.RDS
    Ignored:    data/heartgenes.csv
    Ignored:    data/heartgenes_dox.csv
    Ignored:    data/ind_num_dox.RDS
    Ignored:    data/initial_cormotif.RDS
    Ignored:    data/initial_cormotif_dox.RDS
    Ignored:    data/plot_leg_d.RDS
    Ignored:    data/plot_leg_d_horizontal.RDS
    Ignored:    data/plot_leg_d_vertical.RDS
    Ignored:    data/tableED_GOBP.RDS
    Ignored:    data/tableESR_GOBP_postprob.RDS
    Ignored:    data/tableLD_GOBP.RDS
    Ignored:    data/tableLR_GOBP_postprob.RDS
    Ignored:    data/tableNR_GOBP.RDS
    Ignored:    data/tableNR_GOBP_postprob.RDS
    Ignored:    data/top.table_V.D144r_dox.RDS
    Ignored:    data/top.table_V.D24_dox.RDS
    Ignored:    data/top.table_V.D24r_dox.RDS

Untracked files:
    Untracked:  000037.png
    Untracked:  BCL2A1
    Untracked:  BCL2A1.png
    Untracked:  NBL1.png
    Untracked:  NR1I2.png
    Untracked:  SRMS.png
    Untracked:  logFC_Abs_Motif1_EMP_250422.png
    Untracked:  logFC_Abs_Motif3_EMP_250422.png
    Untracked:  logFC_Abs_Motif4_EMP_250422.png
    Untracked:  logFC_Motif1_EMP_250422.png
    Untracked:  logFC_Motif3_EMP_250422.png
    Untracked:  logFC_Motif4_EMP_250422.png
    Untracked:  top5DE_geneplot_log2cpm_DOX24_EMP_250422.png

Unstaged changes:
    Modified:   analysis/Recovery_DE.Rmd
Note that any generated files, e.g. HTML, png, CSS, etc., are not included in this status report because it is ok for generated content to have uncommitted changes.
These are the previous versions of the repository in which changes were
made to the R Markdown (analysis/Recovery_DOX.Rmd) and HTML
(docs/Recovery_DOX.html) files. If you’ve configured a
remote Git repository (see ?wflow_git_remote), click on the
hyperlinks in the table below to view the files as they were in that
past version.
| File | Version | Author | Date | Message |
|---|---|---|---|---|
| Rmd | 4ffd5ad | emmapfort | 2025-04-22 | Update 04/22/25 logFC motifs |
| html | ff644ec | emmapfort | 2025-04-18 | Build site. |
| Rmd | 62c3340 | emmapfort | 2025-04-18 | Updated analysis 25/04/18 |
| Rmd | 2f815d2 | emmapfort | 2025-04-18 | Updated analysis 25/04/18 |
| Rmd | 424626d | emmapfort | 2025-04-15 | Add In DOX only set |
| html | be23fa9 | emmapfort | 2025-04-15 | Build site. |
| Rmd | ff22325 | emmapfort | 2025-04-15 | workflowr::wflow_publish(files = c("analysis/Recovery_DOX.Rmd")) |
| Rmd | 82840fa | emmapfort | 2025-04-15 | Updating website |
| html | 84d5599 | emmapfort | 2025-04-14 | Build site. |
| Rmd | 3db2eb6 | emmapfort | 2025-04-14 | DOX only page |
I want to separate out my dataset for this to only include the DOX and DMSO vehicle samples
fC_Matrix_Full_cpm_filter <- readRDS("data/fC_Matrix_Full_cpm_filter.RDS")

fC_Matrix_Full_cpm_filter_dox <- as.data.frame(fC_Matrix_Full_cpm_filter) %>% dplyr::select(-(contains("FLUO")))
#this dataset is the original log2cpm transformed and rowMeans filtered dataset which I need for heatmaps

counts_DE_df <- readRDS("data/counts_DE_df.RDS")
#this dataframe is pre-filtered and only contains genes (rows) that were present after log2cpm transformation and filtering by rowMeans > 0

DOX_counts_DE_df <- counts_DE_df %>% dplyr::select(-(contains("FLUO")))
dim(DOX_counts_DE_df)
[1] 14170 42#this should have 42 variables if we remove the 21 variables from 5FUcol_tx_large <- rep(c("#499FBD" , "#63666D"), 21)
col_tx_large_2 <- c(rep("#499FBD" , 3), rep("#63666D", 3), 21)
ind_col <- c("#003F5C", "#45AE91", "#58508D", "#BC4099", "#8B3E9B", "#FF6361", "#FF2362")
tx_col <- c("#499FBD","#63666D")
time_col <- c("#fbb4b9", "#f768a1", "#ae017e")
##Add columns with more information to each gene I pull out##
ind_names <- c(rep("Ind1", 6), rep("Ind2", 6), rep("Ind3", 6), rep("Ind4", 6), rep("Ind5", 6), rep("Ind6", 6), rep("Ind6REP", 6))
time_names <- c(rep("24", 2), rep("24rec", 2), rep("144rec", 2))
time_names2 <- c("24", "24rec", "144rec")
time_names <- c(rep(time_names, 7))
time_names2 <- c(rep(time_names2, 7))
tx_names <- c("DOX", "DMSO")
tx_names <- c(rep(tx_names, 21))
tx_names2 <- c(rep("DOX", 3), rep("DMSO", 3))
tx_names2 <- c(rep(tx_names2, 21))
txtime_names <- c("DOX_24", "DMSO_24", "DOX_24rec", "DMSO_24rec", "DOX_144rec", "DMSO_144rec")
txtime_names <- c(rep(txtime_names, 7))
txtime_names2 <- c("DOX_24", "DOX_24rec", "DOX_144rec", "DMSO_24", "DMSO_24rec", "DMSO_144rec")
txtime_names2 <- c(rep(txtime_names2, 7))
genematrix_dox <- fC_Matrix_Full_cpm_filter_dox %>% rownames_to_column(var = "entrezgene_id")
#saveRDS(genematrix_dox, "data/genematrix_dox.RDS")
###CDKN1A - 1026###
CDKN1A_d <- genematrix_dox %>% filter(entrezgene_id=="1026")
CDKN1A_new_d <- as.data.frame(CDKN1A_d) %>% dplyr::select("entrezgene_id", "DOX_24_Ind1", "DOX_24rec_Ind1", "DOX_144rec_Ind1", "DMSO_24_Ind1", "DMSO_24rec_Ind1", "DMSO_144rec_Ind1","DOX_24_Ind2", "DOX_24rec_Ind2", "DOX_144rec_Ind2", "DMSO_24_Ind2", "DMSO_24rec_Ind2", "DMSO_144rec_Ind2", "DOX_24_Ind3", "DOX_24rec_Ind3", "DOX_144rec_Ind3", "DMSO_24_Ind3", "DMSO_24rec_Ind3", "DMSO_144rec_Ind3", "DOX_24_Ind4", "DOX_24rec_Ind4", "DOX_144rec_Ind4", "DMSO_24_Ind4", "DMSO_24rec_Ind4", "DMSO_144rec_Ind4", "DOX_24_Ind5", "DOX_24rec_Ind5", "DOX_144rec_Ind5", "DMSO_24_Ind5", "DMSO_24rec_Ind5", "DMSO_144rec_Ind5", "DOX_24_Ind6", "DOX_24rec_Ind6", "DOX_144rec_Ind6", "DMSO_24_Ind6", "DMSO_24rec_Ind6", "DMSO_144rec_Ind6", "DOX_24_Ind6REP", "DOX_24rec_Ind6REP", "DOX_144rec_Ind6REP", "DMSO_24_Ind6REP", "DMSO_24rec_Ind6REP", "DMSO_144rec_Ind6REP")
CDKN1A_melt_d <- melt(CDKN1A_d, variable.name = "sample")Using entrezgene_id as id variablesCDKN1A_melt_new_d <- melt(CDKN1A_new_d, variable.name = "sample")Using entrezgene_id as id variablesCDKN1A_melt_df_d <- data.frame(tx = factor(tx_names, levels = unique(tx_names)),
ind = factor(ind_names, levels = unique(ind_names)),
txtime = factor(txtime_names, levels = unique(txtime_names)),
time = factor(time_names, levels = unique(time_names)))
CDKN1A_melt_df2_d <- data.frame(tx = factor(tx_names2, levels = unique(tx_names2)),
ind = factor(ind_names, levels = unique(ind_names)),
txtime = factor(txtime_names2, levels = unique(txtime_names2)),
time = factor(time_names2, levels = unique(time_names2)))
CDKN1A_melt_df_all_d <- cbind(CDKN1A_melt_d, CDKN1A_melt_df_d)
CDKN1A_melt_df_all2_d <- cbind(CDKN1A_melt_new_d, CDKN1A_melt_df2_d)
####CDKN1A####
CDKN1A_melt_df_all2_d %>% ggplot(aes(x = txtime, y = value))+
geom_boxplot(aes(fill = tx))+
geom_point(aes(color = ind)) +
labs(title = "CDKN1A")+
theme_bw(base_size = 16)+
scale_fill_manual(values = c(tx_col))+
scale_color_manual(values = c(ind_col))+
xlab("Conditions")+
ylab("log2cpm")+
theme(plot.title = element_text(face = "italic"))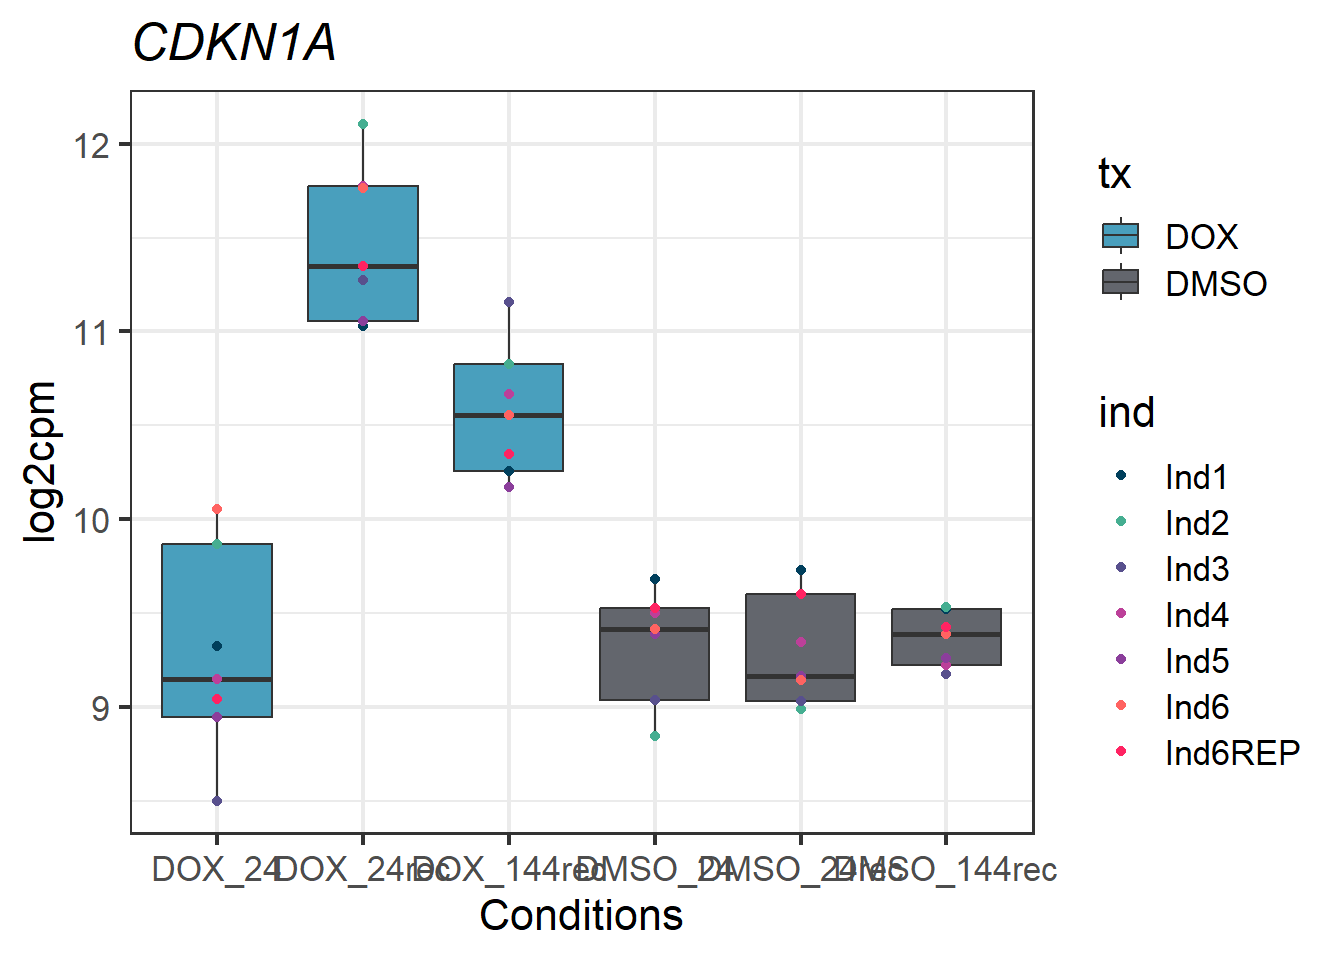
#saveRDS(CDKN1A_geneplot_Dox, "data/CDKN1A_geneplot_Dox.RDS")

###MDM2 - 4193###
MDM2_d <- genematrix_dox %>% filter(entrezgene_id=="4193")
MDM2_new_d <- as.data.frame(MDM2_d) %>% dplyr::select("entrezgene_id", "DOX_24_Ind1", "DOX_24rec_Ind1", "DOX_144rec_Ind1", "DMSO_24_Ind1", "DMSO_24rec_Ind1", "DMSO_144rec_Ind1","DOX_24_Ind2", "DOX_24rec_Ind2", "DOX_144rec_Ind2", "DMSO_24_Ind2", "DMSO_24rec_Ind2", "DMSO_144rec_Ind2", "DOX_24_Ind3", "DOX_24rec_Ind3", "DOX_144rec_Ind3",  "DMSO_24_Ind3", "DMSO_24rec_Ind3", "DMSO_144rec_Ind3", "DOX_24_Ind4", "DOX_24rec_Ind4", "DOX_144rec_Ind4", "DMSO_24_Ind4", "DMSO_24rec_Ind4", "DMSO_144rec_Ind4", "DOX_24_Ind5", "DOX_24rec_Ind5", "DOX_144rec_Ind5", "DMSO_24_Ind5", "DMSO_24rec_Ind5", "DMSO_144rec_Ind5", "DOX_24_Ind6", "DOX_24rec_Ind6", "DOX_144rec_Ind6", "DMSO_24_Ind6", "DMSO_24rec_Ind6", "DMSO_144rec_Ind6", "DOX_24_Ind6REP", "DOX_24rec_Ind6REP", "DOX_144rec_Ind6REP", "DMSO_24_Ind6REP", "DMSO_24rec_Ind6REP", "DMSO_144rec_Ind6REP")
MDM2_melt_d <- melt(MDM2_d, variable.name = "sample")
Using entrezgene_id as id variablesMDM2_melt_new_d <- melt(MDM2_new_d, variable.name = "sample")Using entrezgene_id as id variablesMDM2_melt_df_d <- data.frame(tx = factor(tx_names, levels = unique(tx_names)),
ind = factor(ind_names, levels = unique(ind_names)),
txtime = factor(txtime_names, levels = unique(txtime_names)),
time = factor(time_names, levels = unique(time_names)))
MDM2_melt_df2_d <- data.frame(tx = factor(tx_names2, levels = unique(tx_names2)),
ind = factor(ind_names, levels = unique(ind_names)),
txtime = factor(txtime_names2, levels = unique(txtime_names2)),
time = factor(time_names2, levels = unique(time_names2)))
MDM2_melt_df_all_d <- cbind(MDM2_melt_d, MDM2_melt_df_d)
MDM2_melt_df_all2_d <- cbind(MDM2_melt_new_d, MDM2_melt_df2_d)
####MDM2####
MDM2_melt_df_all2_d %>% ggplot(aes(x = txtime, y = value))+
geom_boxplot(aes(fill = tx))+
geom_point(aes(color = ind)) +
labs(title = "MDM2")+
theme_bw(base_size = 16)+
scale_fill_manual(values = c(tx_col))+
scale_color_manual(values = c(ind_col))+
xlab("Conditions")+
ylab("log2cpm")+
theme(plot.title = element_text(face = "italic"))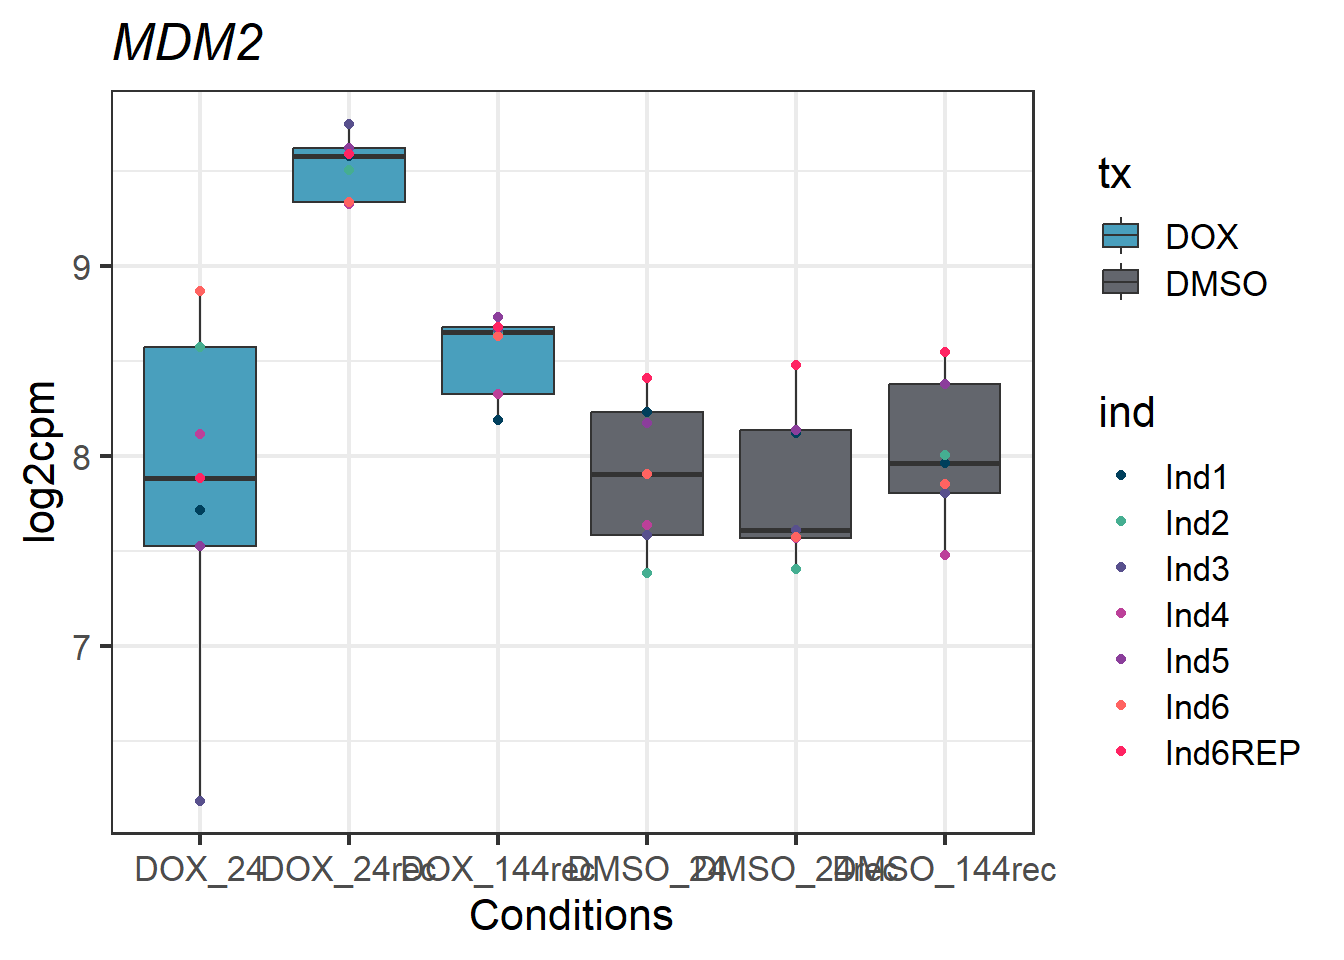
#saveRDS(MDM2_geneplot_Dox, "data/MDM2_geneplot_Dox.RDS")


###SIRT1 - 23411###
SIRT1_d <- genematrix_dox %>% filter(entrezgene_id=="23411")
SIRT1_new_d <- as.data.frame(SIRT1_d) %>% dplyr::select("entrezgene_id", "DOX_24_Ind1", "DOX_24rec_Ind1", "DOX_144rec_Ind1", "DMSO_24_Ind1", "DMSO_24rec_Ind1", "DMSO_144rec_Ind1","DOX_24_Ind2", "DOX_24rec_Ind2", "DOX_144rec_Ind2", "DMSO_24_Ind2", "DMSO_24rec_Ind2", "DMSO_144rec_Ind2", "DOX_24_Ind3", "DOX_24rec_Ind3", "DOX_144rec_Ind3",  "DMSO_24_Ind3", "DMSO_24rec_Ind3", "DMSO_144rec_Ind3", "DOX_24_Ind4", "DOX_24rec_Ind4", "DOX_144rec_Ind4", "DMSO_24_Ind4", "DMSO_24rec_Ind4", "DMSO_144rec_Ind4", "DOX_24_Ind5", "DOX_24rec_Ind5", "DOX_144rec_Ind5", "DMSO_24_Ind5", "DMSO_24rec_Ind5", "DMSO_144rec_Ind5", "DOX_24_Ind6", "DOX_24rec_Ind6", "DOX_144rec_Ind6", "DMSO_24_Ind6", "DMSO_24rec_Ind6", "DMSO_144rec_Ind6", "DOX_24_Ind6REP", "DOX_24rec_Ind6REP", "DOX_144rec_Ind6REP", "DMSO_24_Ind6REP", "DMSO_24rec_Ind6REP", "DMSO_144rec_Ind6REP")
SIRT1_melt_d <- melt(SIRT1_d, variable.name = "sample")
Using entrezgene_id as id variablesSIRT1_melt_new_d <- melt(SIRT1_new_d, variable.name = "sample")Using entrezgene_id as id variablesSIRT1_melt_df_d <- data.frame(tx = factor(tx_names, levels = unique(tx_names)),
ind = factor(ind_names, levels = unique(ind_names)),
txtime = factor(txtime_names, levels = unique(txtime_names)),
time = factor(time_names, levels = unique(time_names)))
SIRT1_melt_df2_d <- data.frame(tx = factor(tx_names2, levels = unique(tx_names2)),
ind = factor(ind_names, levels = unique(ind_names)),
txtime = factor(txtime_names2, levels = unique(txtime_names2)),
time = factor(time_names2, levels = unique(time_names2)))
SIRT1_melt_df_all_d <- cbind(SIRT1_melt_d, SIRT1_melt_df_d)
SIRT1_melt_df_all2_d <- cbind(SIRT1_melt_new_d, SIRT1_melt_df2_d)
####SIRT1####
SIRT1_vertplot <- SIRT1_melt_df_all2_d %>% ggplot(aes(x = txtime, y = value))+
geom_boxplot(aes(fill = tx))+
geom_point(aes(color = ind)) +
labs(title = "SIRT1")+
theme_bw(base_size = 16)+
scale_fill_manual(values = c(tx_col))+
scale_color_manual(values = c(ind_col))+
xlab("Conditions")+
ylab("log2cpm")+
theme(plot.title = element_text(face = "italic"))
# get_legend_func <- function(plot) {
# legends <- cowplot::get_plot_component(plot, "guide-box", return_all = TRUE)
# nonzero <- vapply(plot_legend_d, \(x) !inherits(x, "zeroGrob"), TRUE)
# idx <- which(nonzero)
# #this will return the first nonzero legend since it's not in the standard spot
# if (length(idx) >0) {
# return(legends[[idx[1]]])
# } else {
# return(legends[[1]])
# }
# }
# plot_leg_d_hor <- get_legend_func(plot = SIRT1_vertplot + guides(color = guide_legend(nrow=1))+
# theme(legend.position = "bottom")
# )
plot_leg_d_ver <- cowplot::get_legend(SIRT1_vertplot)Warning in get_plot_component(plot, "guide-box"): Multiple components found;
returning the first one. To return all, use `return_all = TRUE`.# ggdraw(plot_leg_d_hor)
ggdraw(plot_leg_d_ver)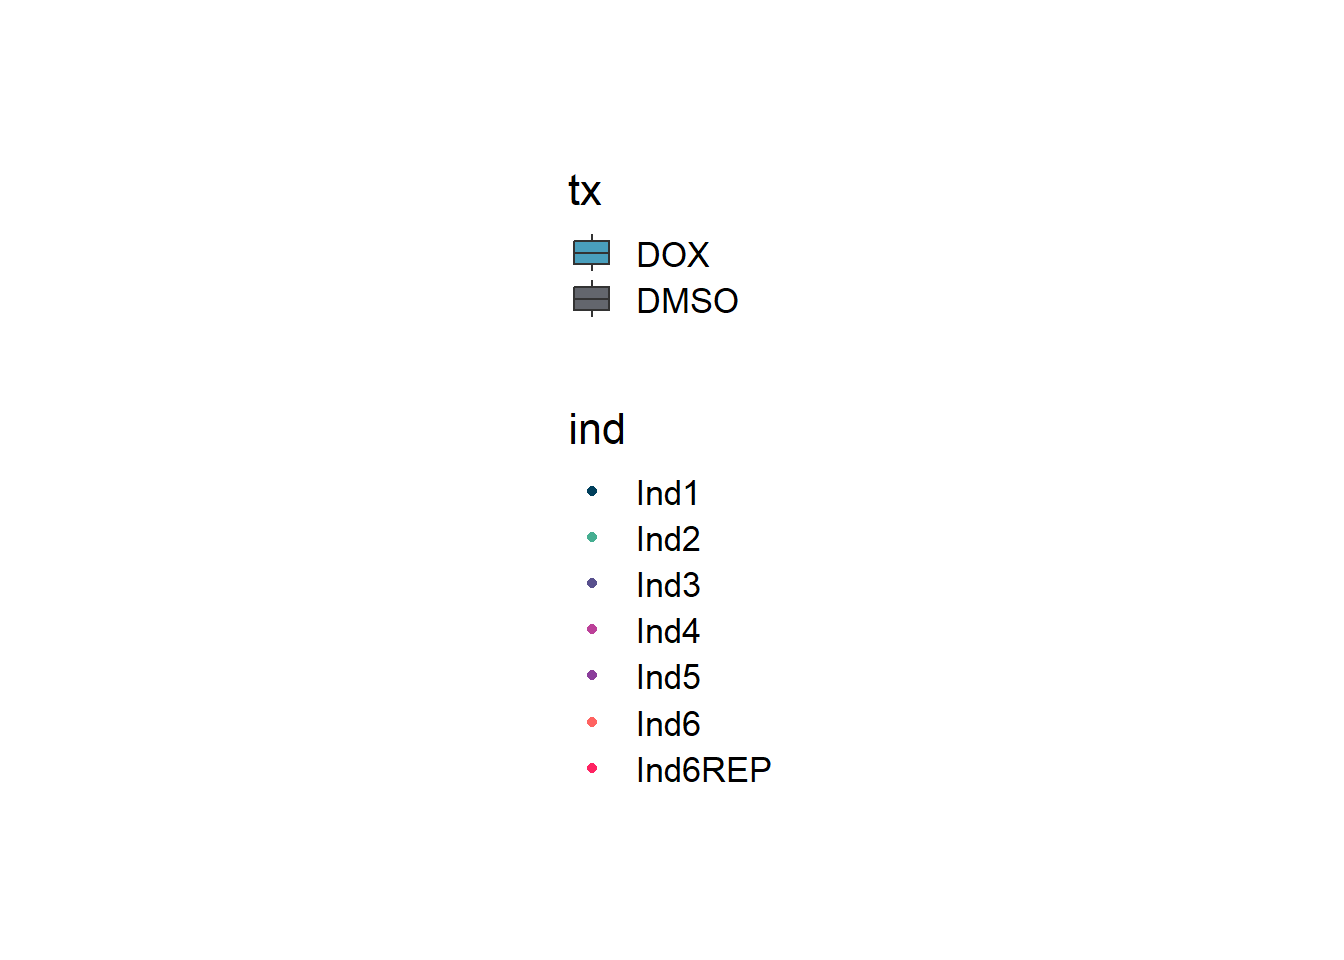
#saveRDS(plot_leg_d_hor, "data/plot_leg_d_horizontal.RDS")
#saveRDS(plot_leg_d_ver, "data/plot_leg_d_vertical.RDS")

#saveRDS(SIRT1_geneplot_Dox, "data/SIRT1_geneplot_Dox.RDS")
#I saved these with no legend

#plot all of these genes together in one set

CDKN1A_geneplot_Dox <- readRDS("data/CDKN1A_geneplot_Dox.RDS")
MDM2_geneplot_Dox <- readRDS("data/MDM2_geneplot_Dox.RDS")
SIRT1_geneplot_Dox <- readRDS("data/SIRT1_geneplot_Dox.RDS")
plot_legend_d_ver <- readRDS("data/plot_leg_d_vertical.RDS")
plot_legend_d_hor <- readRDS("data/plot_leg_d_horizontal.RDS")

DOXgeneplots <- plot_grid(CDKN1A_geneplot_Dox,
                          MDM2_geneplot_Dox,
                          SIRT1_geneplot_Dox, nrow = 1, ncol = 3)
DOXgeneplots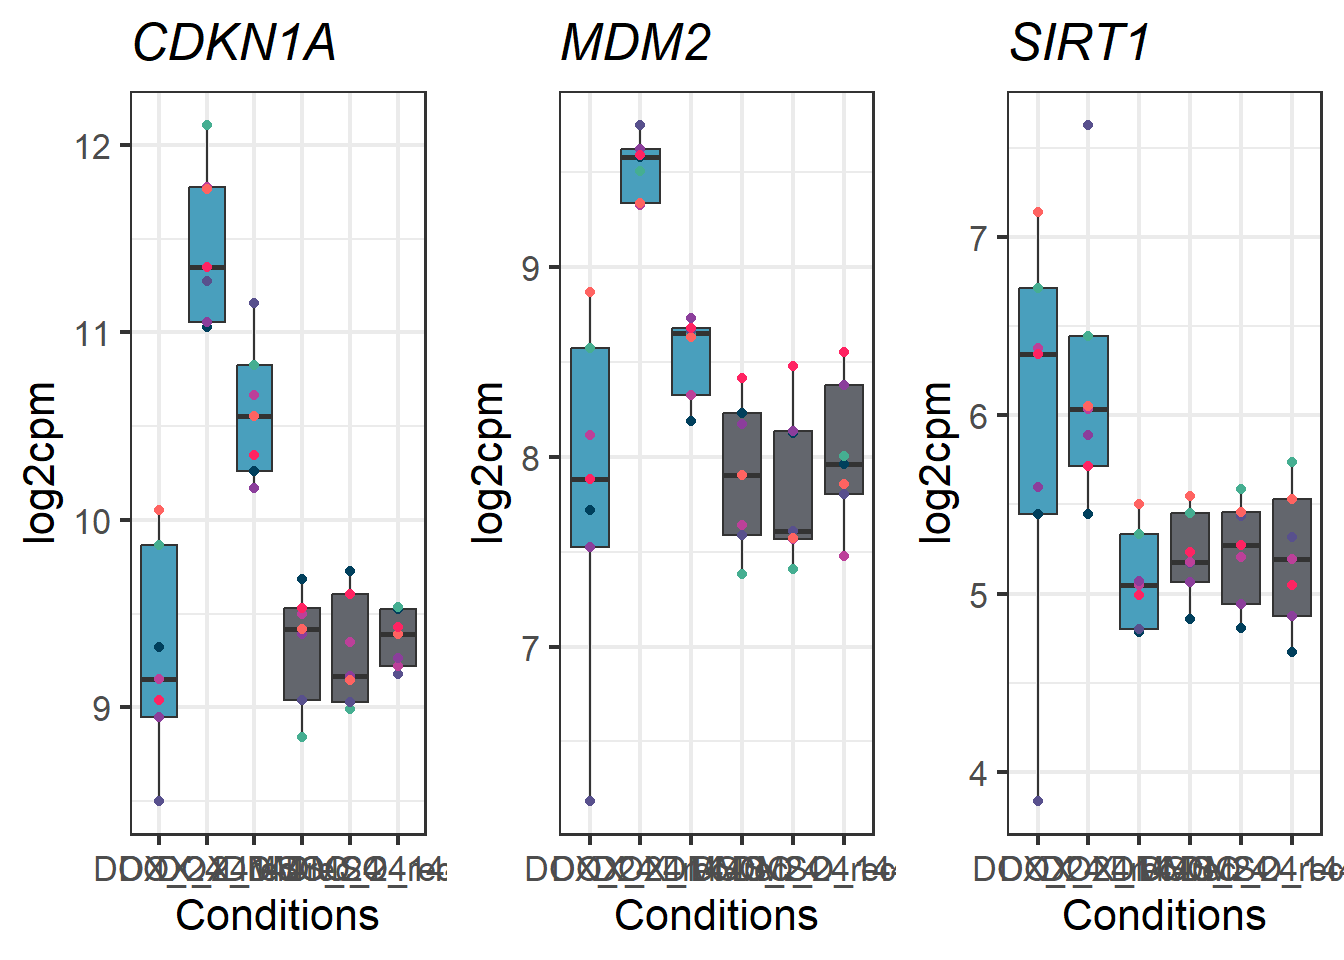
#saveRDS(DOXgeneplots, "data/DOXgeneplots.RDS")genes_dox <- as.data.frame(fC_Matrix_Full_cpm_filter_dox)
genes_dox_df <- rownames_to_column(fC_Matrix_Full_cpm_filter_dox, var = "entrezgene_id")
###now let's pull some classic cardiac genes expressed in iPSC-CMs###
genecardiccheck_dox <- c("MYH7", "TNNT2","MYH6","ACTN2","BMP3","TNNI3","RYR2","CACNA1C","KCNQ1", "HCN1", "ADRB1", "ADRB2")
#ensembl_dox <- useMart("ensembl", dataset="hsapiens_gene_ensembl")
#saveRDS(ensembl_dox, "data/ensembl_backup_dox.RDS")
ensembl_dox <- readRDS("C:/Users/emmap/RDirectory/Recovery_RNAseq/Recovery_5FU/data/ensembl_backup_dox.RDS")
my_chr_dox <- c(1:22, 'M', 'X', 'Y') ## creates a filter for each database
my_attributes_dox <- c('entrezgene_id', 'ensembl_gene_id', 'hgnc_symbol')
heartgenes_dox <- getBM(attributes=my_attributes_dox,filters ='hgnc_symbol',
values = genecardiccheck_dox, mart = ensembl_dox)
write.csv(heartgenes_dox, "data/heartgenes_dox.csv")
heartgenes_dox <-read.csv("data/heartgenes_dox.csv")
fungraph_dox <- as.data.frame(fC_Matrix_Full_cpm_filter_dox[rownames(fC_Matrix_Full_cpm_filter_dox) %in% heartgenes_dox$entrezgene_id,])
fungraph_dox %>%
rownames_to_column("entrezgene_id") %>%
pivot_longer(-entrezgene_id, names_to = "samples",values_to = "counts") %>%
mutate(gene = case_match(entrezgene_id,"88"~"ACTN2","153"~"ADRB1",
"154"~"ADRB2","651"~"BMP3","775"~"CACNA1C", "100874369"~"CACNA1C","348980"~"HCN1",
"3784"~"KCNQ1", "4624"~"MYH6","4625"~"MYH7","6262"~"RYR2",
"7137"~"TNNI3","7139"~"TNNT2",.default = entrezgene_id)) %>%
ggplot(., aes(x=reorder(gene,counts,decreasing=TRUE), y=counts))+
geom_boxplot()+
ggtitle(expression("Expression of typical cardiac tissue genes"))+
xlab("")+
ylim(c(0,20))+
ylab(expression("log"[2]~"cpm"))+
theme_bw()+
theme(plot.title = element_text(size = rel(2), hjust = 0.5),
axis.title = element_text(size = 15, color = "black"),
axis.ticks = element_line(linewidth = 1.5),
axis.line = element_line(linewidth = 1.5),
axis.text = element_text(size =10, color = "black", angle = 0),
strip.text.y = element_text(color = "white"))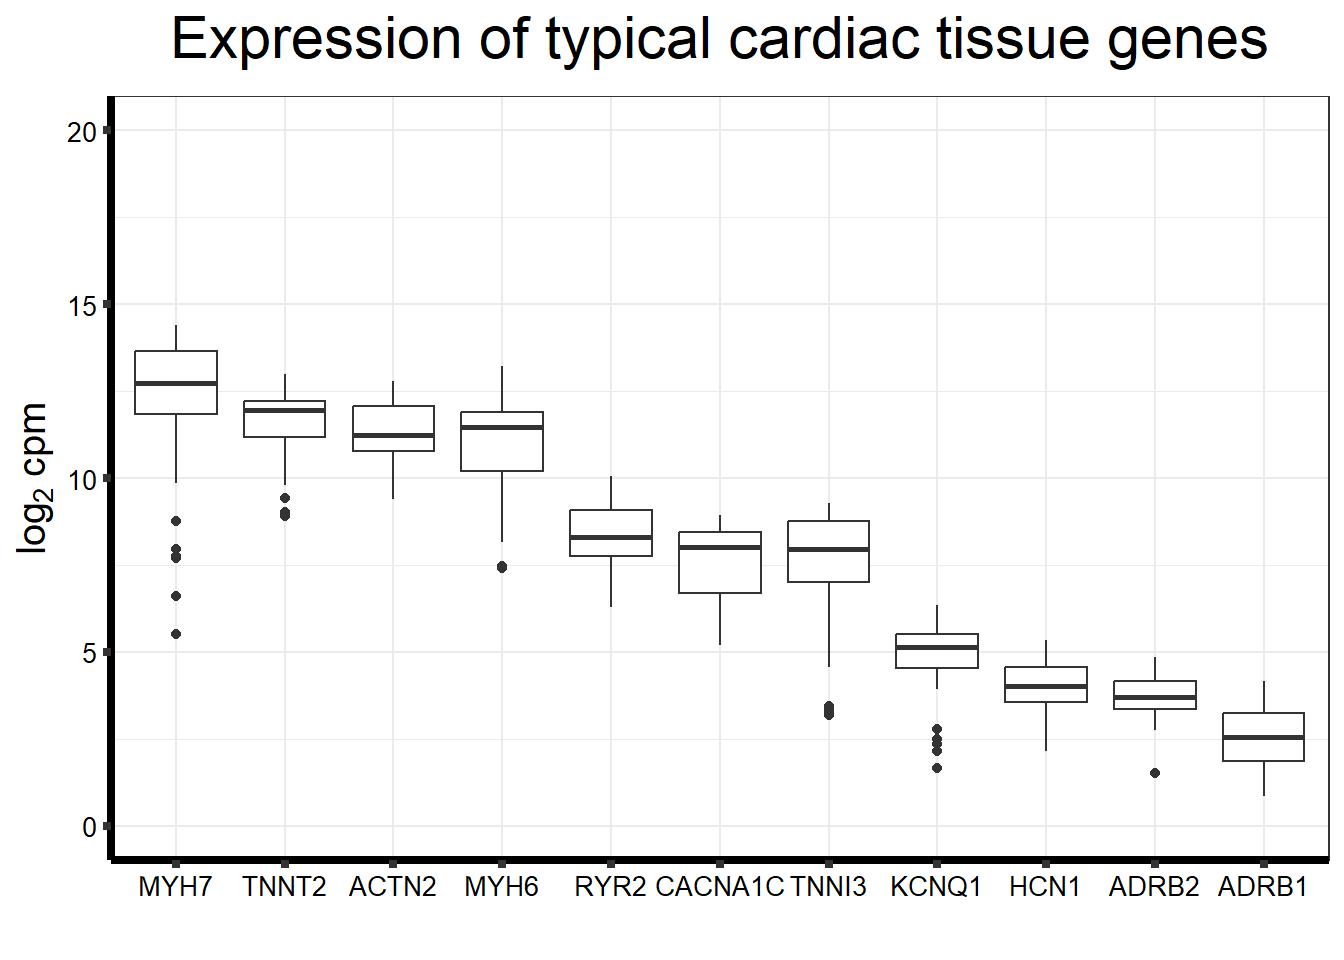
#Now I want to plot these with DOX vs Veh to see if there are any changes

#I'll choose a subset of these genes - TNN13, TNNT2, NPPB, MYH7, ACTN2

fungraph_dox_only <- fungraph_dox %>% dplyr::select("DOX_24_Ind1", "DOX_24rec_Ind1", "DOX_144rec_Ind1", "DOX_24_Ind2", "DOX_24rec_Ind2", "DOX_144rec_Ind2", "DOX_24_Ind3", "DOX_24rec_Ind3", "DOX_144rec_Ind3", "DOX_24_Ind4", "DOX_24rec_Ind4", "DOX_144rec_Ind4", "DOX_24_Ind5", "DOX_24rec_Ind5", "DOX_144rec_Ind5", "DOX_24_Ind6", "DOX_24rec_Ind6", "DOX_144rec_Ind6", "DOX_24_Ind6REP", "DOX_24rec_Ind6REP", "DOX_144rec_Ind6REP")

fungraph_dmso_only <- fungraph_dox %>% dplyr::select("DMSO_24_Ind1", "DMSO_24rec_Ind1", "DMSO_144rec_Ind1", "DMSO_24_Ind2", "DMSO_24rec_Ind2", "DMSO_144rec_Ind2", "DMSO_24_Ind3", "DMSO_24rec_Ind3", "DMSO_144rec_Ind3", "DMSO_24_Ind4", "DMSO_24rec_Ind4", "DMSO_144rec_Ind4", "DMSO_24_Ind5", "DMSO_24rec_Ind5", "DMSO_144rec_Ind5", "DMSO_24_Ind6", "DMSO_24rec_Ind6", "DMSO_144rec_Ind6", "DMSO_24_Ind6REP", "DMSO_24rec_Ind6REP", "DMSO_144rec_Ind6REP")

fungraph_dox_only %>%
  rownames_to_column("entrezgene_id") %>%
  pivot_longer(-entrezgene_id, names_to = "samples",values_to = "counts") %>%
  mutate(gene = case_match(entrezgene_id,"88"~"ACTN2","153"~"ADRB1",
  "154"~"ADRB2","651"~"BMP3","775"~"CACNA1C", "100874369"~"CACNA1C","348980"~"HCN1",
                           "3784"~"KCNQ1", "4624"~"MYH6","4625"~"MYH7","6262"~"RYR2",
                           "7137"~"TNNI3","7139"~"TNNT2",.default = entrezgene_id)) %>%
  ggplot(., aes(x=reorder(gene,counts,decreasing=TRUE), y=counts))+
  geom_boxplot()+
  ggtitle(expression("Expression Cardiac Genes DOX Only"))+
  xlab("")+
  ylim(c(0,20))+
  ylab(expression("log"[2]~"cpm"))+
  theme_bw()+
  theme(plot.title = element_text(size = rel(2), hjust = 0.5),
        axis.title = element_text(size = 15, color = "black"),
        axis.ticks = element_line(linewidth = 1.5),
        axis.line = element_line(linewidth = 1.5),
        axis.text = element_text(size =10, color = "black", angle = 0),
        strip.text.y = element_text(color = "white"))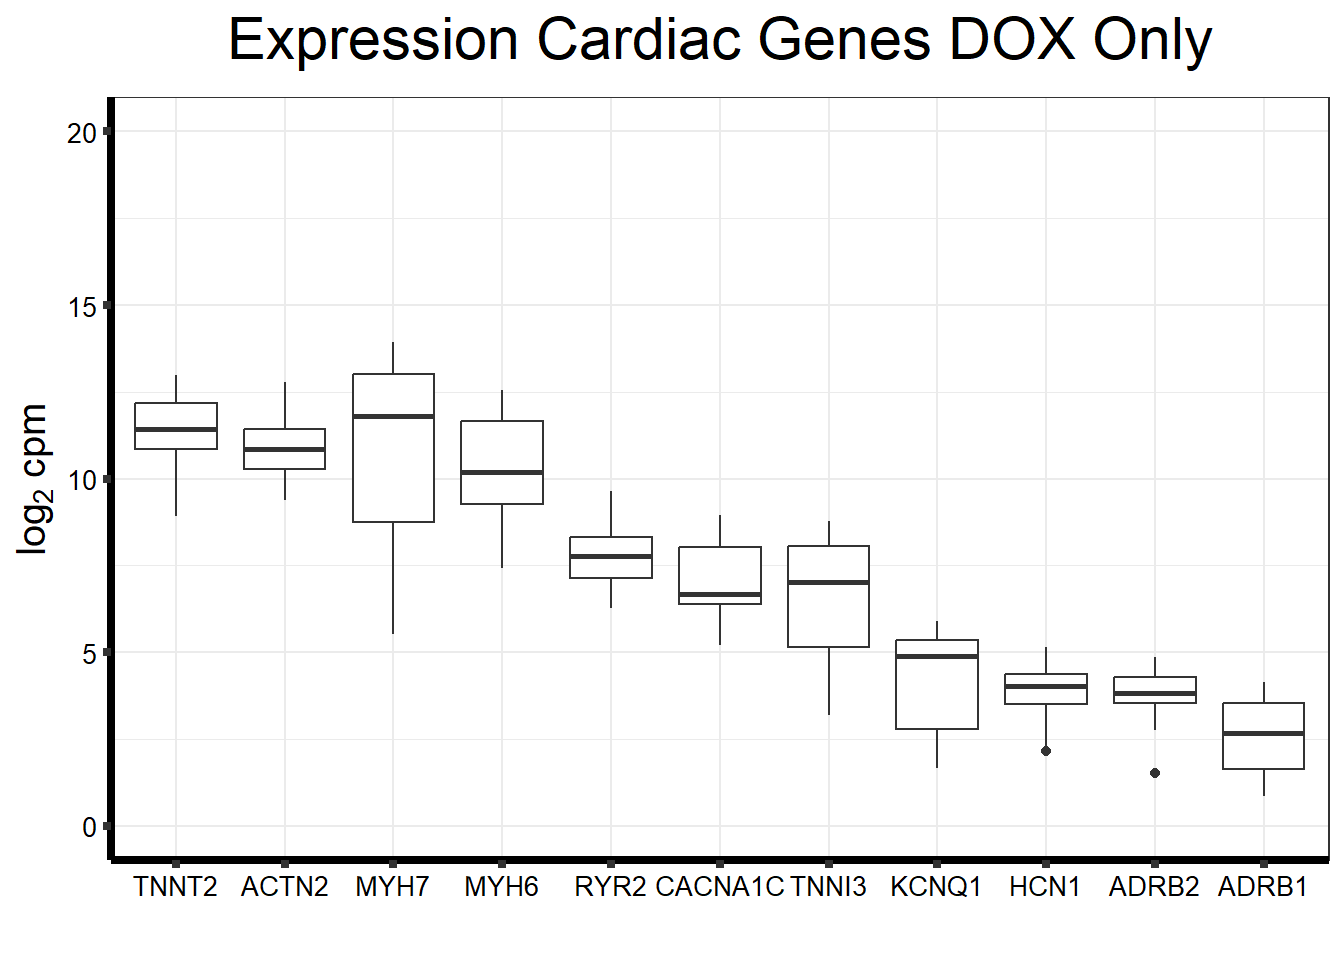
fungraph_dmso_only %>%
  rownames_to_column("entrezgene_id") %>%
  pivot_longer(-entrezgene_id, names_to = "samples",values_to = "counts") %>%
  mutate(gene = case_match(entrezgene_id,"88"~"ACTN2","153"~"ADRB1",
  "154"~"ADRB2","651"~"BMP3","775"~"CACNA1C", "100874369"~"CACNA1C","348980"~"HCN1",
                           "3784"~"KCNQ1", "4624"~"MYH6","4625"~"MYH7","6262"~"RYR2",
                           "7137"~"TNNI3","7139"~"TNNT2",.default = entrezgene_id)) %>%
  ggplot(., aes(x=reorder(gene,counts,decreasing=TRUE), y=counts))+
  geom_boxplot()+
  ggtitle(expression("Expression Cardiac Genes Vehicle Only"))+
  xlab("")+
  ylim(c(0,20))+
  ylab(expression("log"[2]~"cpm"))+
  theme_bw()+
  theme(plot.title = element_text(size = rel(2), hjust = 0.5),
        axis.title = element_text(size = 15, color = "black"),
        axis.ticks = element_line(linewidth = 1.5),
        axis.line = element_line(linewidth = 1.5),
        axis.text = element_text(size =10, color = "black", angle = 0),
        strip.text.y = element_text(color = "white"))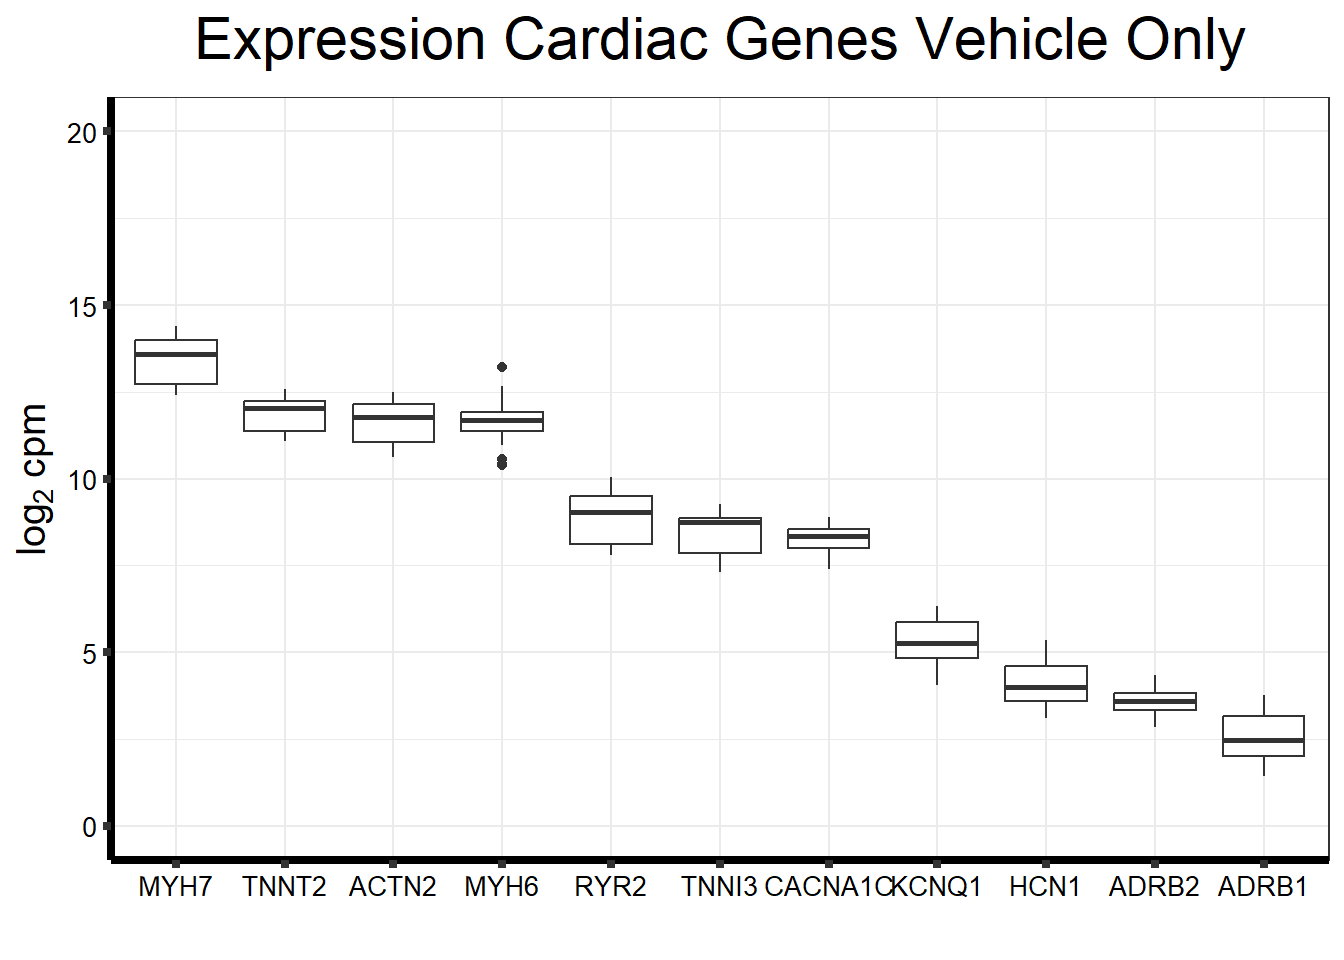
#I want to just plot TNNI3 now

fungraph_dox_only_TNNI3 <- fungraph_dox_only %>%
  rownames_to_column("entrezgene_id") %>%
  pivot_longer(-entrezgene_id, names_to = "samples",values_to = "counts") %>%
  filter(entrezgene_id == "7137") %>%
  mutate(gene = case_match(entrezgene_id,"7137"~"TNNI3",.default = entrezgene_id)) %>%
  ggplot(., aes(x=reorder(gene,counts,decreasing=TRUE), y=counts))+
  geom_boxplot()+
  ggtitle(expression("TNNI3 DOX"))+
  xlab("")+
  ylim(c(0,10))+
  ylab(expression("log"[2]~"cpm"))+
  theme_bw()+
  theme(plot.title = element_text(size = rel(2), hjust = 0.5),
        axis.title = element_text(size = 15, color = "black"),
        axis.ticks = element_line(linewidth = 1.5),
        axis.line = element_line(linewidth = 1.5),
        axis.text = element_text(size =10, color = "black", angle = 0),
        strip.text.y = element_text(color = "white"))

#saveRDS(fungraph_dox_only_TNNI3, "data/DOX_TNN13_plot.RDS")

fungraph_dmso_only_TNNI3 <- fungraph_dmso_only %>%
  rownames_to_column("entrezgene_id") %>%
  pivot_longer(-entrezgene_id, names_to = "samples",values_to = "counts") %>%
  filter(entrezgene_id == "7137") %>%
  mutate(gene = case_match(entrezgene_id,"7137"~"TNNI3",.default = entrezgene_id)) %>%
  ggplot(., aes(x=reorder(gene,counts,decreasing=TRUE), y=counts))+
  geom_boxplot()+
  ggtitle(expression("TNNI3 VEH"))+
  xlab("")+
  ylim(c(0,10))+
  ylab(expression("log"[2]~"cpm"))+
  theme_bw()+
  theme(plot.title = element_text(size = rel(2), hjust = 0.5),
        axis.title = element_text(size = 15, color = "black"),
        axis.ticks = element_line(linewidth = 1.5),
        axis.line = element_line(linewidth = 1.5),
        axis.text = element_text(size =10, color = "black", angle = 0),
        strip.text.y = element_text(color = "white"))

#saveRDS(fungraph_dmso_only_TNNI3, "data/DMSO_TNN13_plot.RDS")

fungraph_dox_only_TNNI3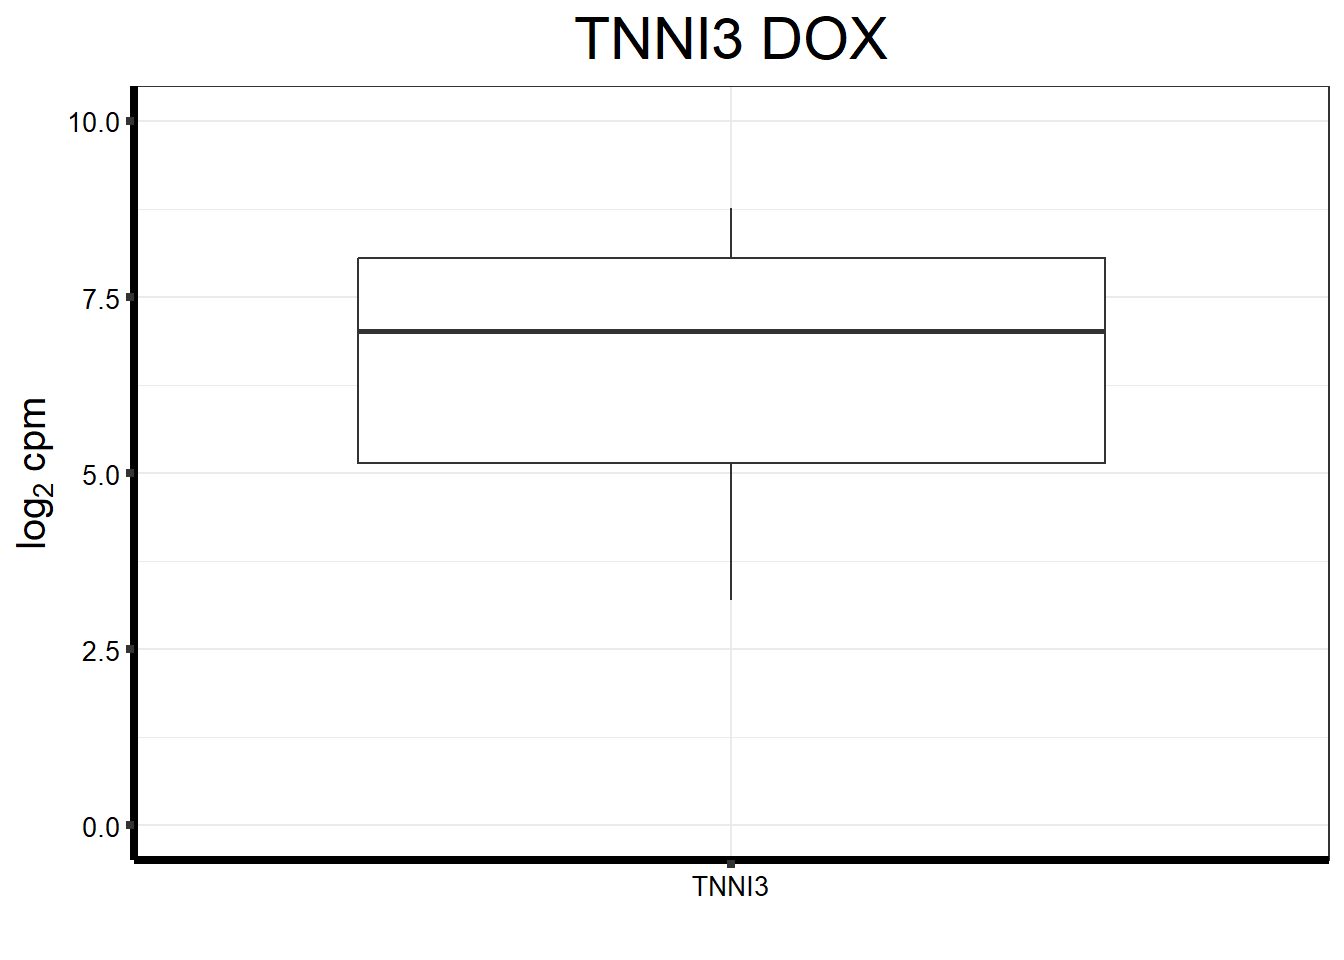
fungraph_dmso_only_TNNI3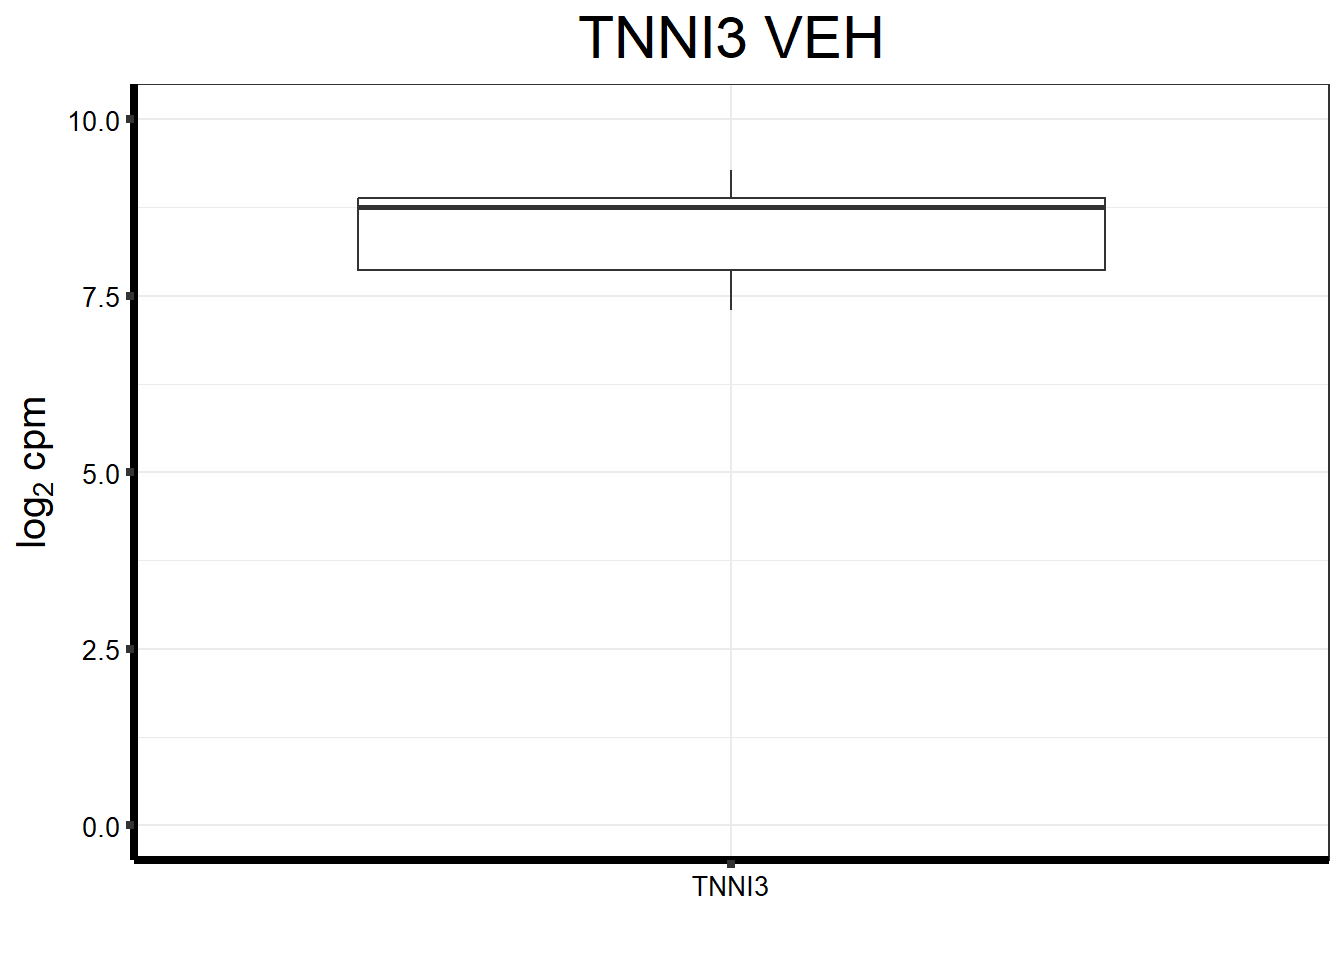
plot_grid(fungraph_dox_only_TNNI3,
                          fungraph_dmso_only_TNNI3,
                          nrow = 1, ncol = 2)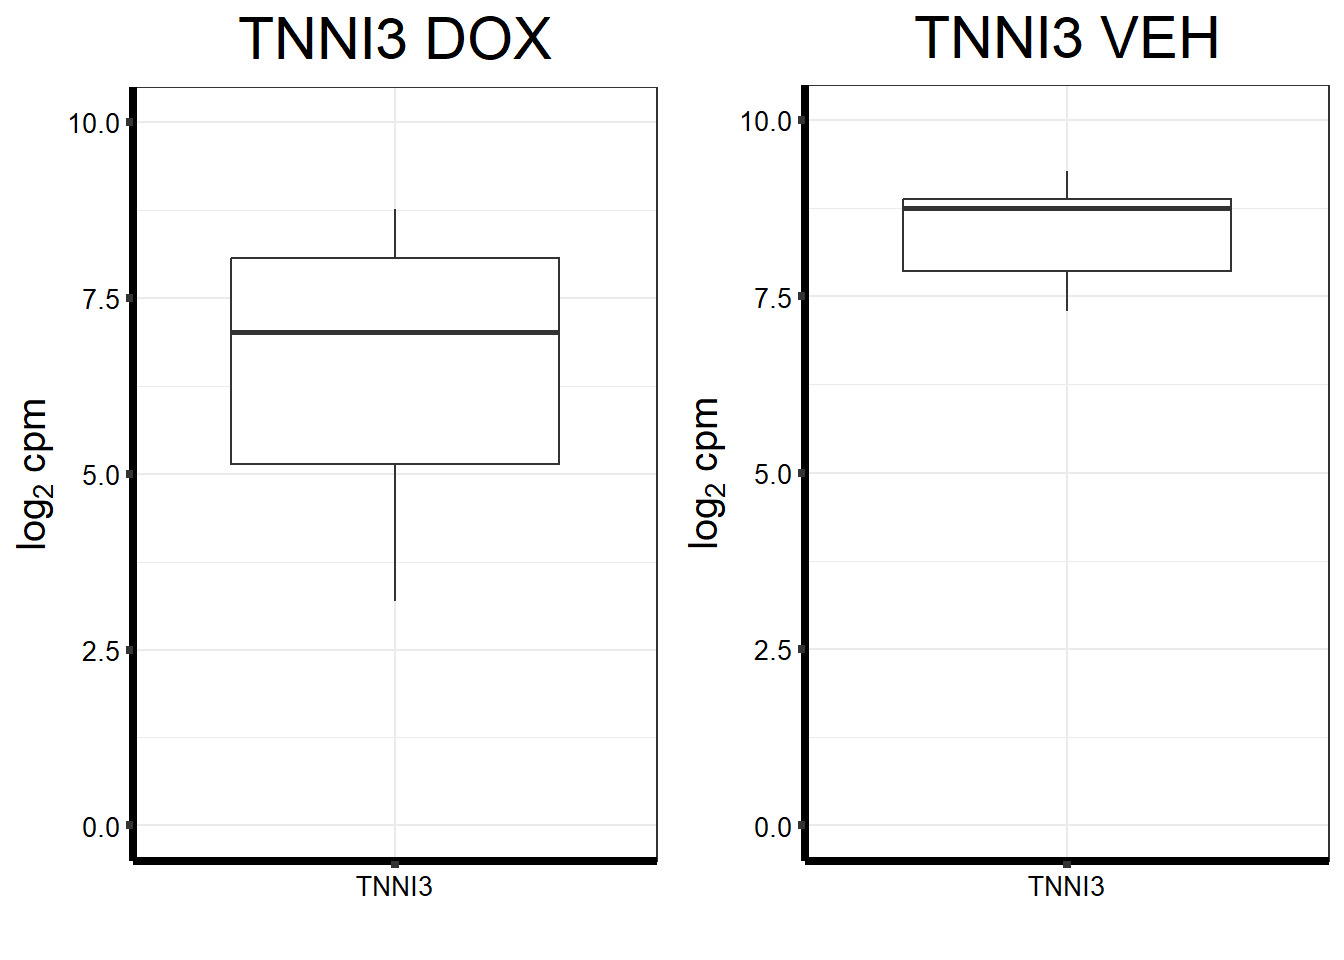
####SPEARMAN FILTERED####
fC_Matrix_Full_cpm_filter_spearmancor_dox <-
  cor(
    fC_Matrix_Full_cpm_filter_dox,
    y = NULL,
    use = "everything",
    method = "spearman"
  )


Individual <- as.factor(c(rep("Ind1", 6), rep("Ind2", 6), rep("Ind3", 6), rep("Ind4", 6), rep("Ind5", 6), rep("Ind6", 6), rep("Ind6REP", 6)))

#Factor 2 - Treatment
tx_factor <- c("DOX", "DMSO")
Tx <- as.factor(c(rep(tx_factor, 21)))
#view(Treatment)

#Factor 3 - Timepoint
time_factor <- c(rep("24", 2), rep("24rec", 2), rep("144rec", 2))
Time <- as.factor(c(rep(time_factor, 7)))

####annotation for colors####
annot_col_hm = list(Tx = c(DOX = "blue", DMSO = "black"),
                             Ind = c(Ind1 = "#66E2A5", Ind2 = "#FC8D62", Ind3 = "#1F78B4", Ind4 = "#EFEDA3", Ind5 = "#A6D854", Ind6 = "#FFD92A", Ind6REP = "#8B3E9B"),
                             Time = c("24" = "#096F38", "24rec" = "#0050B5", "144rec" = "#B725AD"))

####annotation for values####
annot_list_hm <- data.frame(Individual = as.factor(c(rep("Ind1", 6), rep("Ind2", 6), rep("Ind3", 6), rep("Ind4", 6), rep("Ind5", 6), rep("Ind6", 6), rep("Ind6REP", 6))),
                                               Tx = as.factor(c(rep(tx_factor, 21))),
                                               Time = as.factor(c(rep(time_factor, 7))))


##add in the annotations from above into the dataframe
row.names(annot_list_hm) <- colnames(fC_Matrix_Full_cpm_filter_spearmancor_dox)

####ANNOTATED HEATMAPS####

pheatmap(fC_Matrix_Full_cpm_filter_spearmancor_dox, border_color = "black", legend = TRUE, angle_col = 90, display_numbers = FALSE, number_color = "black", fontsize = 10, fontsize_number = 5, annotation_col = annot_list_hm, annotation_colors = annot_col_hm)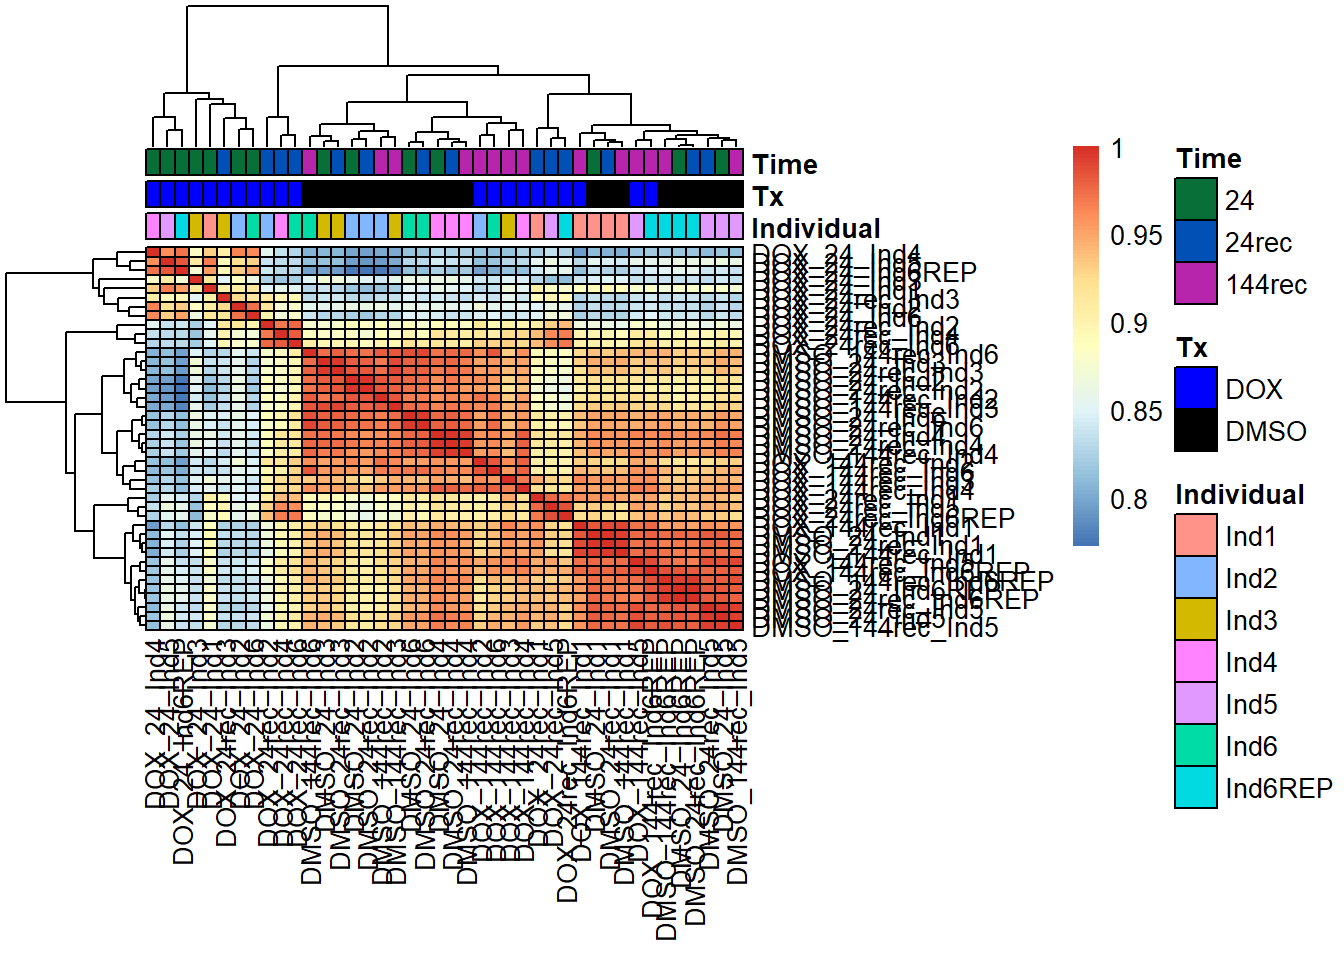
#look at the correlation between samples with boxplots using my Spearman dataset
#set1 - all samples
All_Spearman <- as.data.frame(fC_Matrix_Full_cpm_filter_spearmancor_dox) %>%
  rownames_to_column(var = "Sample")


#set2 - exact matches with Ind 6 + Ind 6 REP DOX24
Ind6_Spearman <- as.data.frame(fC_Matrix_Full_cpm_filter_spearmancor_dox) %>%
  dplyr::select(contains("Ind6")) %>%
  rownames_to_column(var = "Sample")


#set 3 - all samples from rep ind
Now that I’ve put together my data, let’s begin DE!
group_1d <- rep(c("DOX_24",
                  "DMSO_24",
                  "DOX_24rec",
                  "DMSO_24rec",
                  "DOX_144rec",
                  "DMSO_144rec"), 6)

group_2d <- rep(c("DOX_24",
                  "DMSO_24",
                  "DOX_24rec",
                  "DMSO_24rec",
                  "DOX_144rec",
                  "DMSO_144rec"), 7)

dge_d <- DGEList.data.frame(counts = DOX_counts_DE_df, group = group_2d, genes = row.names(DOX_counts_DE_df))


#calculate the normalization factors with method TMM
dged_calc <- calcNormFactors(dge_d, method = "TMM")


#Pull out factors
snames_d <- data.frame("samples" = colnames(dged_calc)) %>% separate_wider_delim(., cols = samples, names = c("Treatment", "Time", "Individual"), delim = "_", cols_remove = FALSE)

snames_time_d <- snames_d$Time
snames_tx_d <- snames_d$Treatment
snames_ind_d <- snames_d$Individual

#Create my model matrix
mm_r_d <- model.matrix(~0 + group_2d)

p_d <- voom(dged_calc$counts, mm_r_d, plot = TRUE)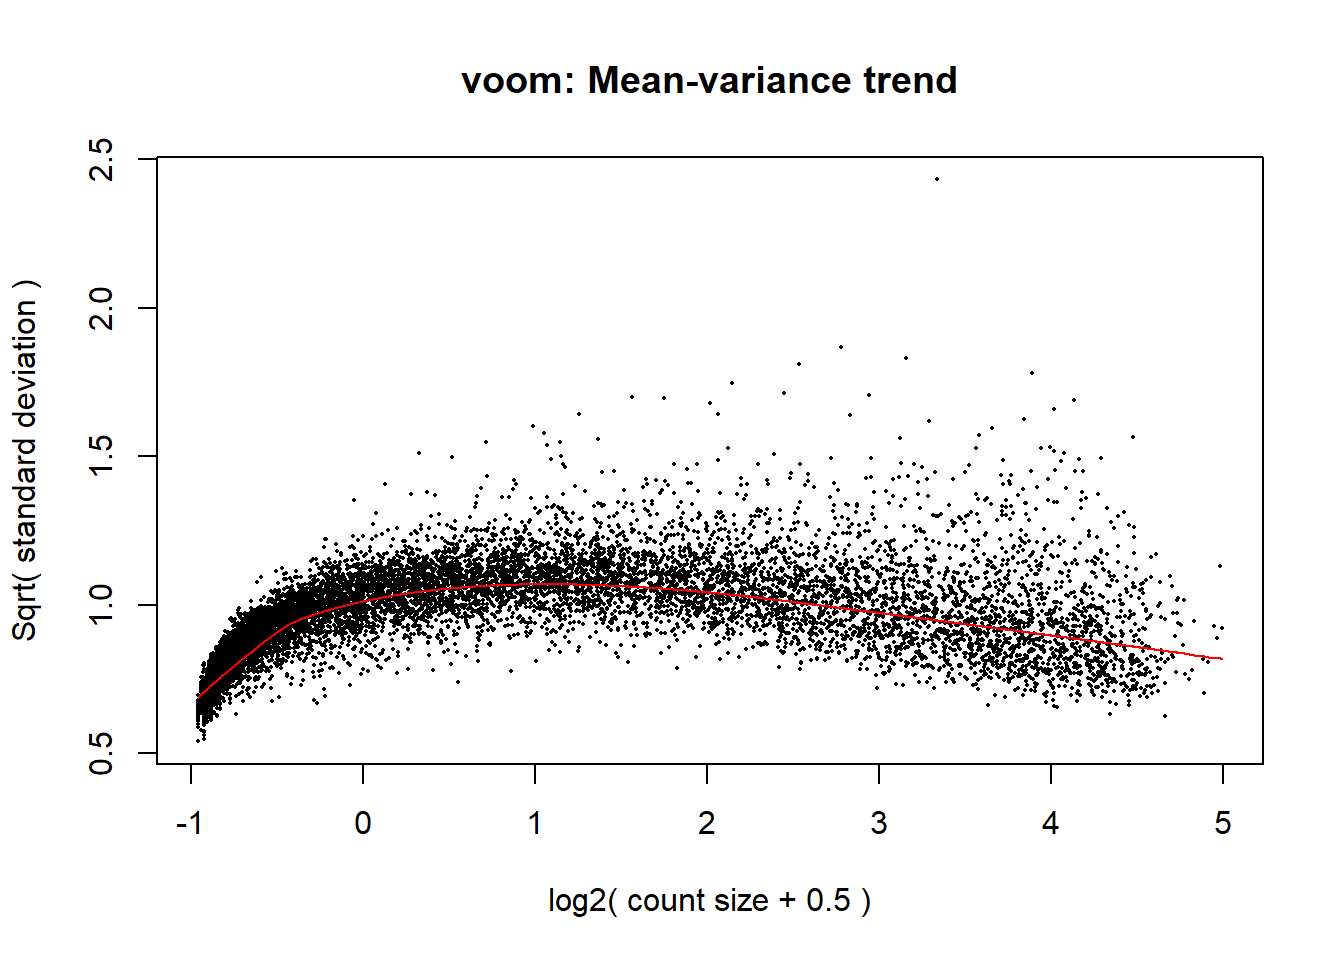
corfit_d <- duplicateCorrelation(p_d, mm_r_d, block = snames_ind_d)
v_d <- voom(dged_calc$counts, mm_r_d, block = snames_ind_d, correlation = corfit_d$consensus)
fit_d <- lmFit(v_d, mm_r_d, block = snames_ind_d, correlation = corfit_d$consensus)
#make sure to check which order the columns are in - otherwise they won't match right (it was moved into alphabetical and number order)
colnames(mm_r_d) <- c("DMSO_144rec","DMSO_24","DMSO_24rec","DOX_144rec","DOX_24","DOX_24rec")
cm_r_d <- makeContrasts(
V.D24 = DOX_24 - DMSO_24,
V.D24r = DOX_24rec - DMSO_24rec,
V.D144r = DOX_144rec - DMSO_144rec,
levels = mm_r_d
)
vfit_r_d <- lmFit(p_d, mm_r_d)
vfit_r_d <- contrasts.fit(vfit_r_d, contrasts = cm_r_d)
efit2_d <- eBayes(vfit_r_d)
results_d = decideTests(efit2_d)
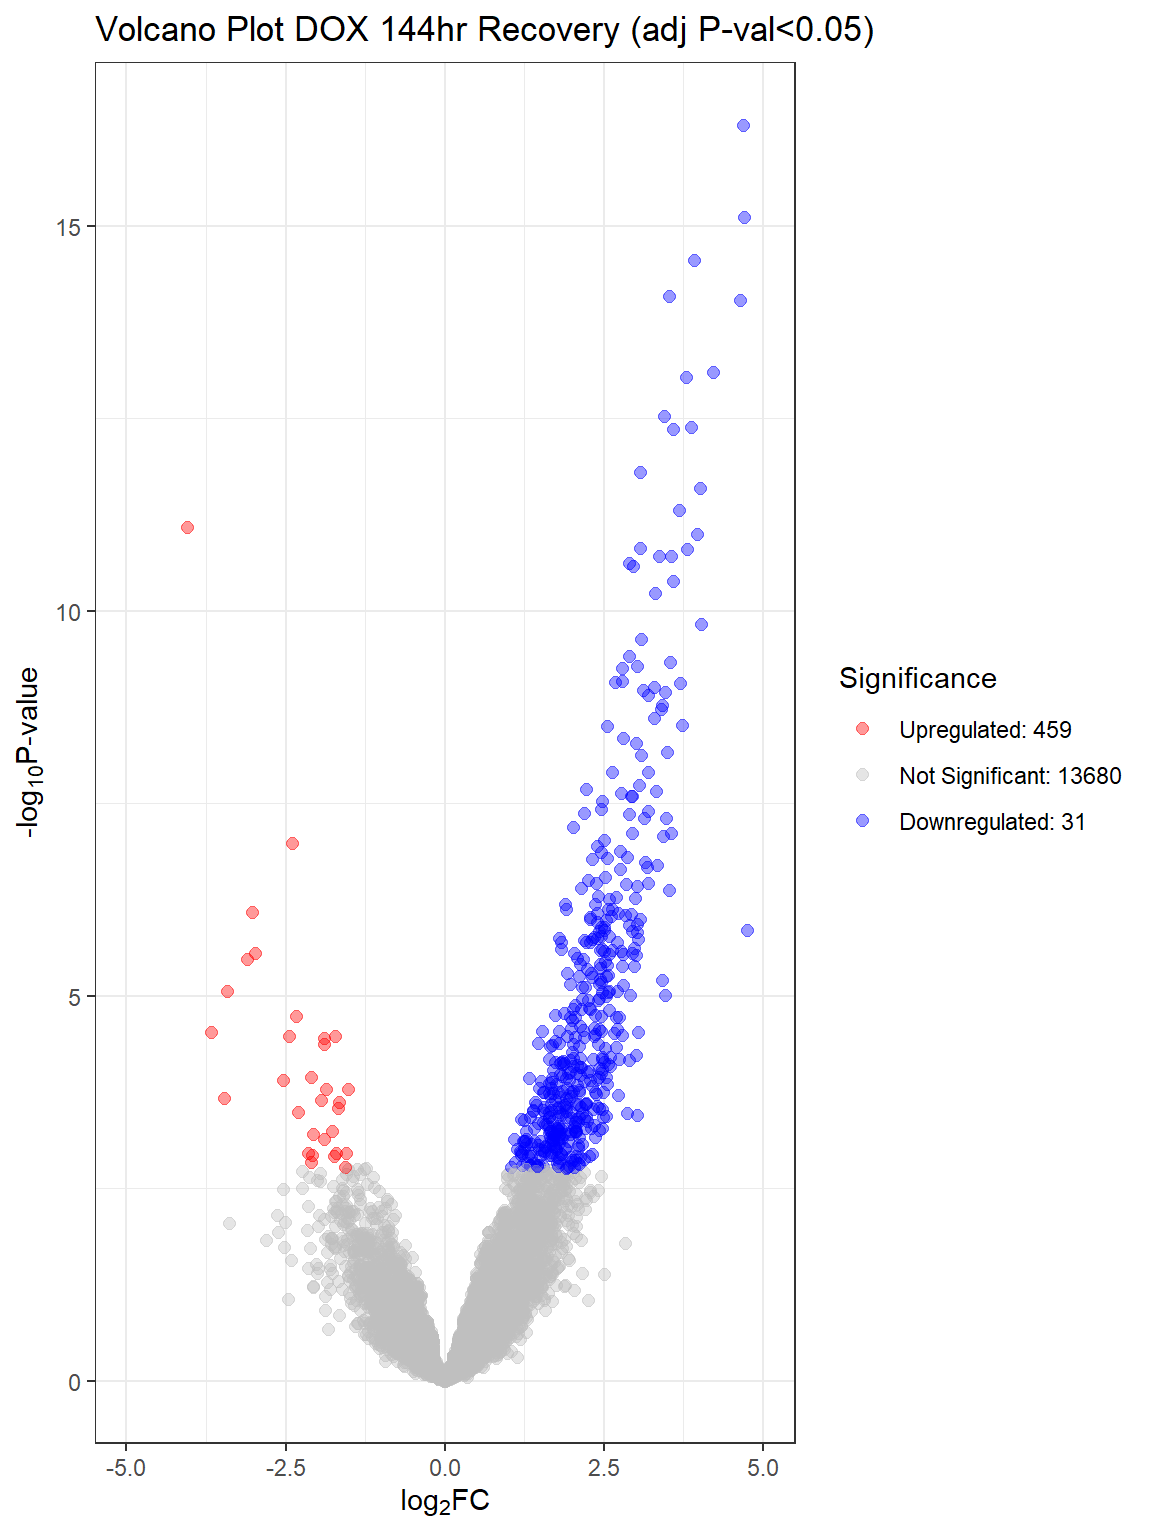
summary(results_d)
V.D24 V.D24r V.D144r
Down 9709 6869 31
NotSig 3276 6379 13680
Up 1185 922 459
# # V.D24 V.D24r V.D144r
# Down 9709 6869 31
# NotSig 3276 6379 13680
# Up 1185 922 459
####plot your voom####
voom_plot_d <- voom(dged_calc, mm_r_d, plot = TRUE)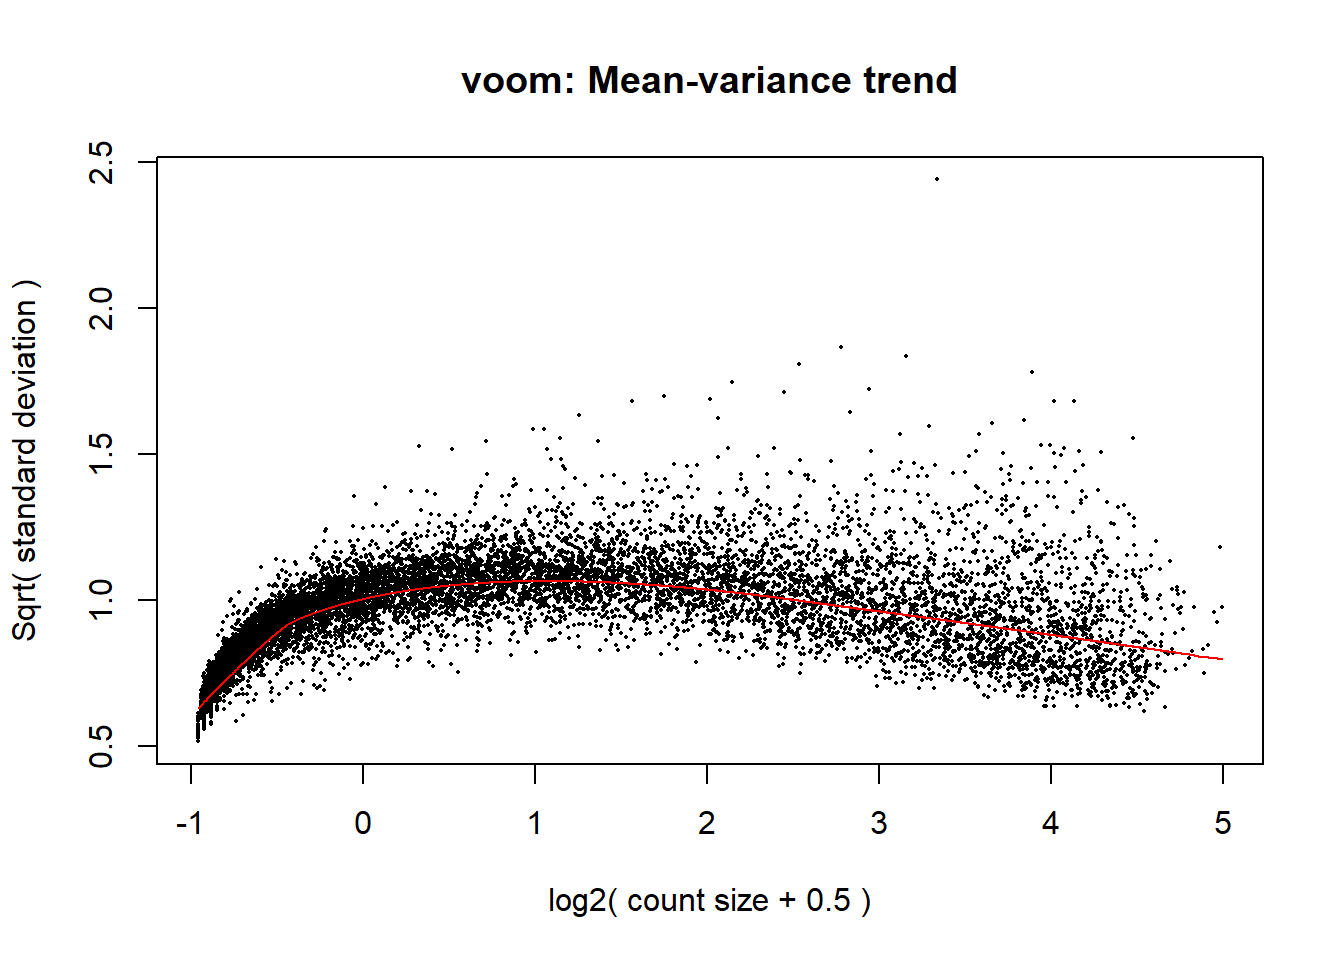
top.table_V.D24_dox <- topTable(fit = efit2_d, coef = "V.D24", number = nrow(dged_calc), adjust.method = "BH", p.value = 1, sort.by = "none")
head(top.table_V.D24_dox)
logFC AveExpr t P.Value adj.P.Val B
100287102 -1.804419 5.673476 -1.741845 8.886085e-02 1.088296e-01 -4.985757
102466751 -1.386392 6.598993 -2.215141 3.223163e-02 4.236756e-02 -4.208131
100302278 2.117211 4.110796 5.136780 6.832114e-06 1.543790e-05 3.484472
645520 -1.060785 3.557889 -2.870907 6.387858e-03 9.406209e-03 -3.056843
79501 -1.851133 3.191793 -7.289085 5.649161e-09 1.915955e-08 10.231400
102725121 -2.392951 5.717312 -2.447792 1.863753e-02 2.550153e-02 -3.658644#saveRDS(top.table_V.D24_dox, "data/top.table_V.D24_dox.RDS")
top.table_V.D24r_dox <- topTable(fit = efit2_d, coef = "V.D24r", number = nrow(dged_calc), adjust.method = "BH", p.value = 1, sort.by = "none")
head(top.table_V.D24r_dox) logFC AveExpr t P.Value adj.P.Val B
100287102 0.2141767 5.673476 0.2255907 0.82261472 0.86440123 -6.218826
102466751 -0.8094950 6.598993 -1.3328291 0.18977853 0.26317888 -5.413117
100302278 -0.8734257 4.110796 -1.7817528 0.08202618 0.12937566 -4.863398
645520 -0.1192432 3.557889 -0.2881042 0.77468499 0.82587957 -6.419091
79501 -0.6825584 3.191793 -2.3475219 0.02368945 0.04379952 -4.150543
102725121 0.3419483 5.717312 0.3858246 0.70157538 0.76548265 -6.184783#saveRDS(top.table_V.D24r_dox, "data/top.table_V.D24r_dox.RDS")
top.table_V.D144r_dox <- topTable(fit = efit2_d, coef = "V.D144r", number = nrow(dged_calc), adjust.method = "BH", p.value = 1, sort.by = "none")
head(top.table_V.D144r_dox) logFC AveExpr t P.Value adj.P.Val B
100287102 -0.42467259 5.673476 -0.4139649 0.68100778 0.9656919 -6.176321
102466751 -0.04911403 6.598993 -0.0842465 0.93326102 0.9658168 -6.400185
100302278 0.32459251 4.110796 1.0815817 0.28561401 0.8618346 -6.375234
645520 -0.46815849 3.557889 -1.2874535 0.20499081 0.7713611 -5.861459
79501 0.56678196 3.191793 1.9032026 0.06388777 0.4666442 -5.076972
102725121 0.18759316 5.717312 0.1938705 0.84721256 0.9656919 -6.246426#saveRDS(top.table_V.D144r_dox, "data/top.table_V.D144r_dox.RDS")
#plot the top 5 most DE genes for each condition
#i sorted the toptable by the top 5 most DE genes for each + found the corresponding gene name
#####24hr Tx####
topDEG_dox24 <- top.table_V.D24_dox %>%
dplyr::slice_min(., n=5, order_by=P.Value) %>%
rownames_to_column(var = "GeneID")
Gene_Name <- c("FAM163A","SLC26A8","THBS-AS1","FOXD3-AS1","GRIK3")
topDEG_dox24 %>% mutate(GeneID = factor(GeneID, levels = c("148753", "116369", "101929523", "100996301", "2899"))) %>%
cbind(Gene_Name) GeneID logFC AveExpr t P.Value adj.P.Val B
1 148753 6.274101 5.578715 22.98007 2.128816e-25 3.016533e-21 47.14980
2 116369 5.789178 6.348094 20.56787 1.542184e-23 1.092637e-19 43.01677
3 101929523 -6.034510 6.305356 -19.08546 2.647316e-22 1.004705e-18 39.91738
4 100996301 5.149384 5.289969 18.98930 3.202808e-22 1.004705e-18 40.23872
5 2899 5.508418 5.862853 18.93819 3.545183e-22 1.004705e-18 40.05644
Gene_Name
1 FAM163A
2 SLC26A8
3 THBS-AS1
4 FOXD3-AS1
5 GRIK3#top 5 DE genes based on p-value and adj p value
ggplot(topDEG_dox24, aes(x=Gene_Name, y=logFC))+
geom_boxplot(aes(colour = adj.P.Val))+
ggtitle(expression("Top 5 DE Genes DOX 24"))+
xlab("")+
ylim(c(-10, 10))+
ylab(expression("logFC"))+
theme_bw()+
theme(plot.title = element_text(size = rel(1.5)),
axis.title = element_text(size = 15, color = "black"),
axis.ticks = element_line(linewidth = 1.5),
axis.line = element_line(linewidth = 1.5),
axis.text = element_text(size =10, color = "black", angle = 0),
strip.text.y = element_text(color = "white"))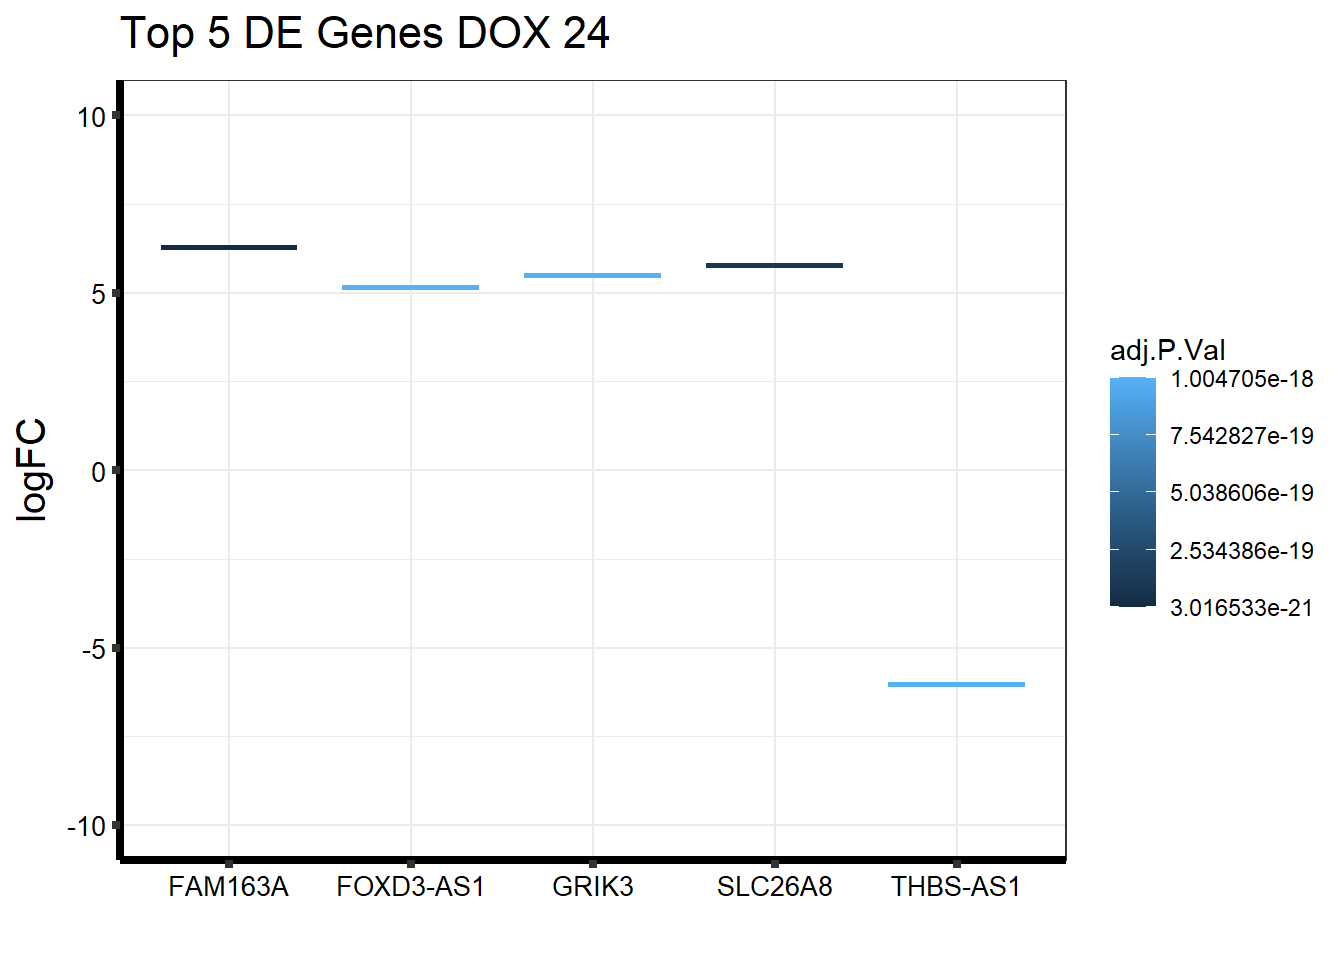
| Version | Author | Date |
|---|---|---|
| ff644ec | emmapfort | 2025-04-18 |
####24hr Recovery####
topDEG_dox24R <- top.table_V.D24r_dox %>%
  dplyr::slice_min(., n=5, order_by=P.Value) %>%
  rownames_to_column(var = "GeneID")

Gene_Name1 <- c("KCNK10", "CSTA", "LCE1B", "OTP", "KRTAP19-1")

topDEG_dox24R %>% mutate(GeneID = factor(GeneID, levels = c("54207", "1475", "353132", "23440", "337882"))) %>%
  cbind(Gene_Name1)
GeneID logFC AveExpr t P.Value adj.P.Val B
1 54207 4.949406 6.530192 15.82299 2.695651e-19 2.698663e-15 33.02274
2 1475 5.603936 5.360183 15.67190 3.808981e-19 2.698663e-15 32.95920
3 353132 4.839166 4.461296 14.34492 8.816170e-18 4.164171e-14 30.06752
4 23440 5.863845 6.216741 13.53171 6.670038e-17 2.362861e-13 27.67891
5 337882 6.367767 5.675415 13.17894 1.644191e-16 4.659637e-13 27.24446
Gene_Name1
1 KCNK10
2 CSTA
3 LCE1B
4 OTP
5 KRTAP19-1ggplot(topDEG_dox24R, aes(x=Gene_Name1, y=logFC))+
geom_boxplot(aes(colour = adj.P.Val))+
ggtitle(expression("Top 5 DE Genes DOX 24 Recovery"))+
xlab("")+
ylim(c(-10,10))+
ylab(expression("logFC"))+
theme_bw()+
theme(plot.title = element_text(size = rel(1.5)),
axis.title = element_text(size = 15, color = "black"),
axis.ticks = element_line(linewidth = 1.5),
axis.line = element_line(linewidth = 1.5),
axis.text = element_text(size =10, color = "black", angle = 0),
strip.text.y = element_text(color = "white"))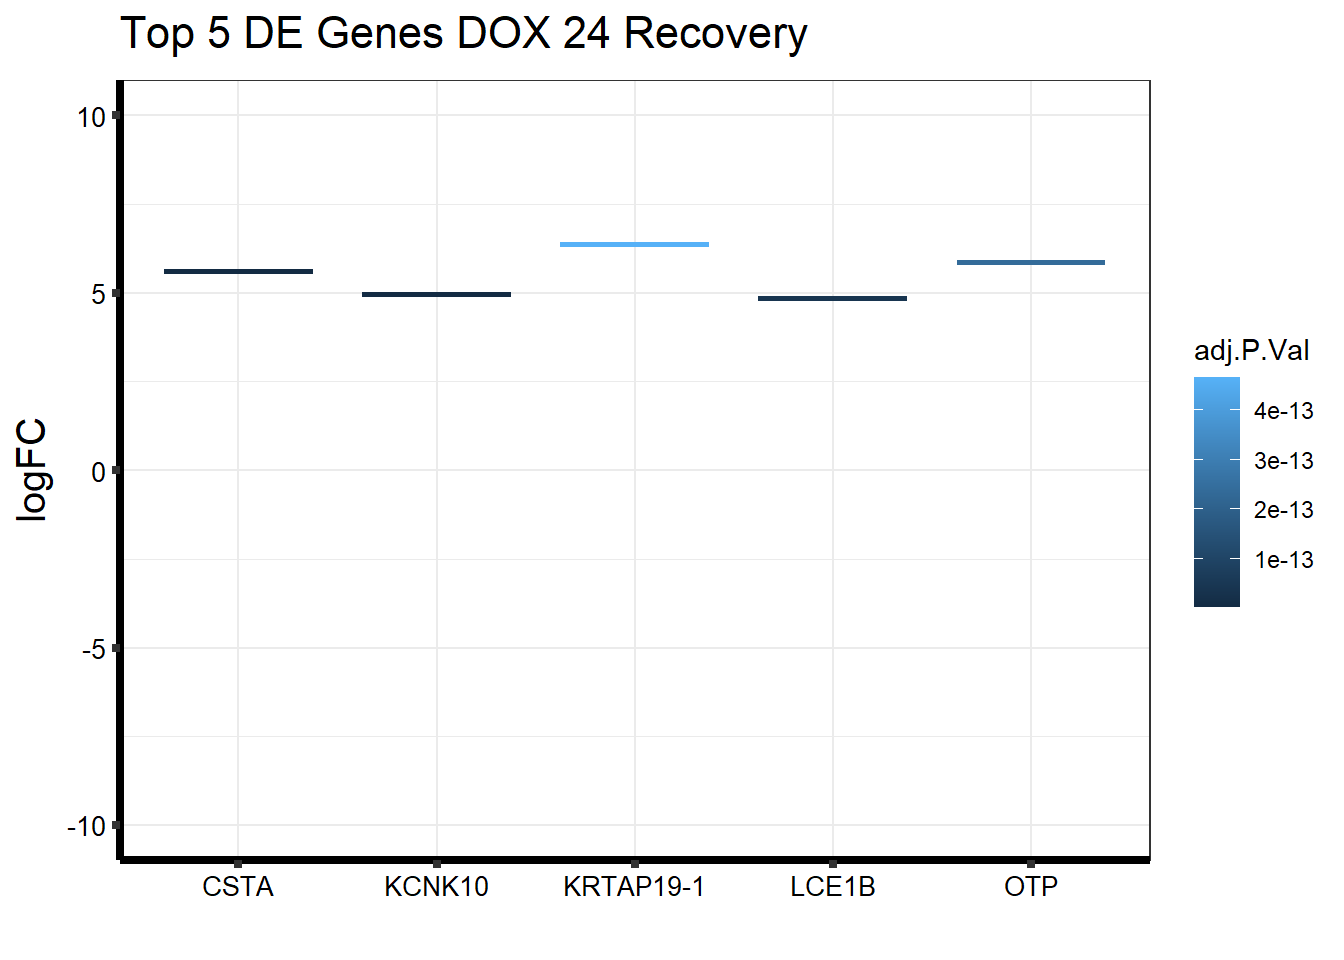
| Version | Author | Date |
|---|---|---|
| ff644ec | emmapfort | 2025-04-18 |
####144R####
topDEG_dox144R <- top.table_V.D144r_dox %>%
  dplyr::slice_min(., n=5, order_by=P.Value) %>%
  rownames_to_column(var = "GeneID")

Gene_Name2 <- c("LINC03025", "SLC4A10", "VIT", "PSMA8", "MYO3B")

topDEG_dox144R %>% mutate(GeneID = factor(GeneID, levels = c("440896", "57282", "5212", "143471", "140469"))) %>%
  cbind(Gene_Name2)
GeneID logFC AveExpr t P.Value adj.P.Val B
1 440896 4.681589 4.937852 13.65775 4.849711e-17 6.872040e-13 28.36219
2 57282 4.710121 5.295198 12.59160 7.637380e-16 5.411084e-12 25.77519
3 5212 3.923330 4.773412 12.10946 2.782463e-15 1.314250e-11 24.40702
4 143471 3.521809 4.241896 11.71091 8.284121e-15 2.643174e-11 23.33360
5 140469 4.647516 6.057544 11.66805 9.326656e-15 2.643174e-11 23.23254
Gene_Name2
1 LINC03025
2 SLC4A10
3 VIT
4 PSMA8
5 MYO3Bggplot(topDEG_dox144R, aes(x=Gene_Name2, y=logFC))+
geom_boxplot(aes(colour = adj.P.Val))+
ggtitle(expression("Top 5 DE Genes DOX 144 Recovery"))+
xlab("")+
ylim(c(-10,10))+
ylab(expression("logFC"))+
theme_bw()+
theme(plot.title = element_text(size = rel(1.5)),
axis.title = element_text(size = 15, color = "black"),
axis.ticks = element_line(linewidth = 1.5),
axis.line = element_line(linewidth = 1.5),
axis.text = element_text(size =10, color = "black", angle = 0),
strip.text.y = element_text(color = "white"))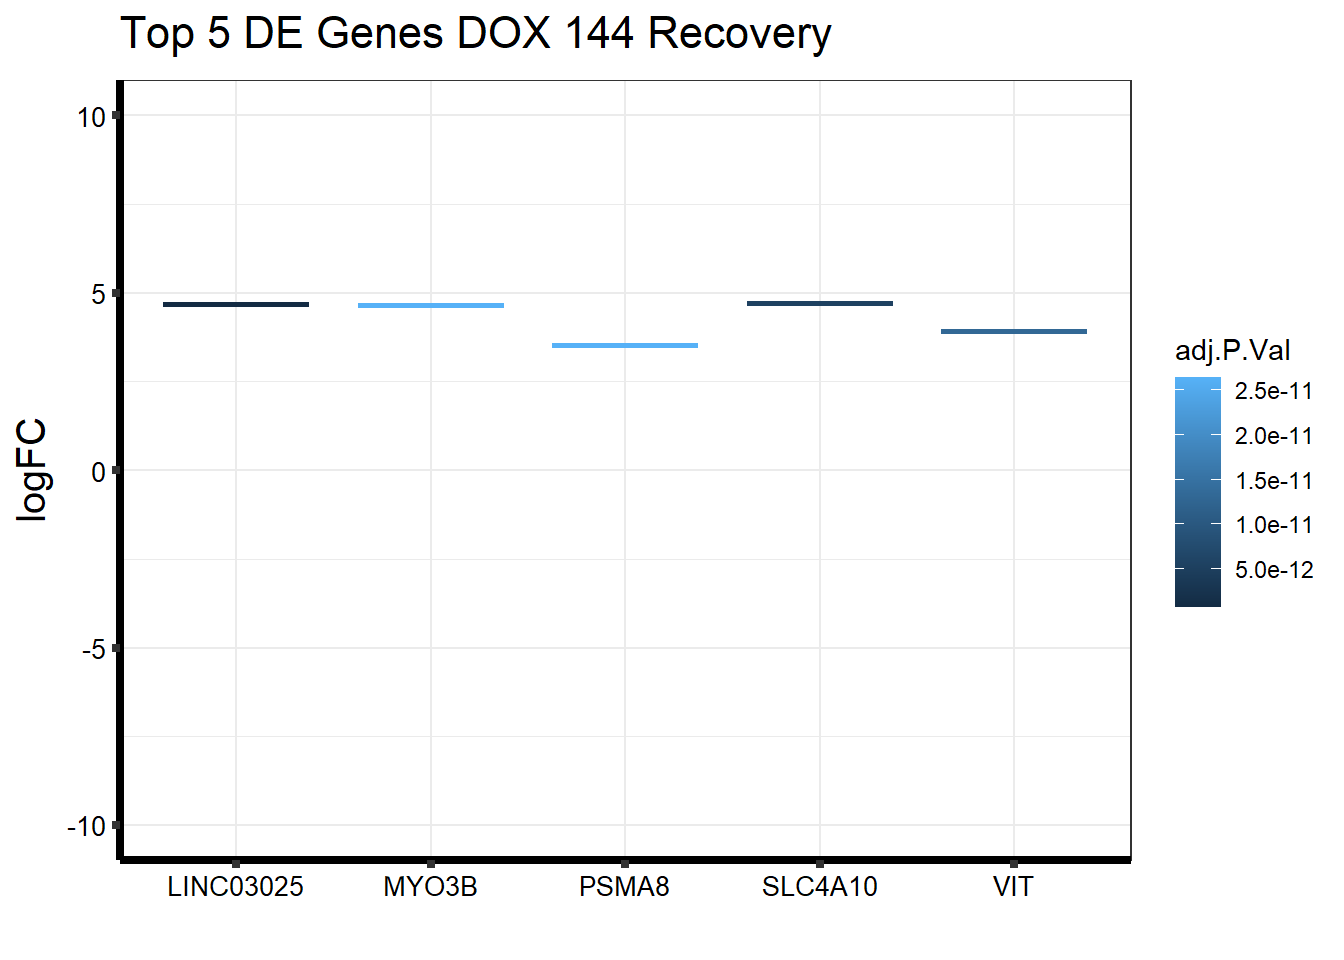
| Version | Author | Date |
|---|---|---|
| ff644ec | emmapfort | 2025-04-18 |
generate_volcano_plot <- function(toptable, title) {

  #make significance labels
  toptable$Significance <- "Not Significant"
  toptable$Significance[toptable$logFC > 0 & toptable$adj.P.Val < 0.05] <- "Upregulated"
  toptable$Significance[toptable$logFC < 0 & toptable$adj.P.Val < 0.05] <- "Downregulated"

  #add number of genes for each significance label
  upgenes <- toptable %>% filter(Significance == "Upregulated") %>% nrow()
  downgenes <- toptable %>% filter(Significance == "Downregulated") %>% nrow()
  nsgenes <- toptable %>% filter(Significance == "Not Significant") %>% nrow()

  #make legend labels for no of genes
  legend_lab <- c(
    str_c('Upregulated: ', upgenes),
    str_c('Not Significant: ', nsgenes),
    str_c('Downregulated: ', downgenes)
  )

  #generate volcano plot w/ legend
  ggplot(toptable, aes(x = logFC, y = -log10(P.Value), color = Significance)) +
    geom_point(alpha = 0.4, size = 2) +
    scale_color_manual(values = c("Upregulated" = "blue", "Downregulated" = "red", "Not Significant" = "gray"), labels = legend_lab) +
    xlim(-5, 5) +
    labs(title = title, x = expression(x = "log"[2]*"FC"), y = expression(y = "-log"[10]*"P-value")) +
    theme(legend.position = "none",
          plot.title = element_text(size = rel(1.5), hjust = 0.5),
          axis.title = element_text(size = rel(1.25))) +
    theme_bw()
}

#now that I've made a function, I can make volcano plots for each of my comparisons (6 total)

volcano_plots <- list(
  "V.D24" = generate_volcano_plot(top.table_V.D24_dox, "Volcano Plot DOX 24hr (adj P-val<0.05)"),
  "V.D24r" = generate_volcano_plot(top.table_V.D24r_dox, "Volcano Plot DOX 24hr Recovery (adj P-val<0.05)"),
  "V.D144r" = generate_volcano_plot(top.table_V.D144r_dox, "Volcano Plot DOX 144hr Recovery (adj P-val<0.05)")
)

# Display each volcano plot
for (plot_name in names(volcano_plots)) {
  print(volcano_plots[[plot_name]])
}
Warning: Removed 90 rows containing missing values or values outside the scale range
(`geom_point()`).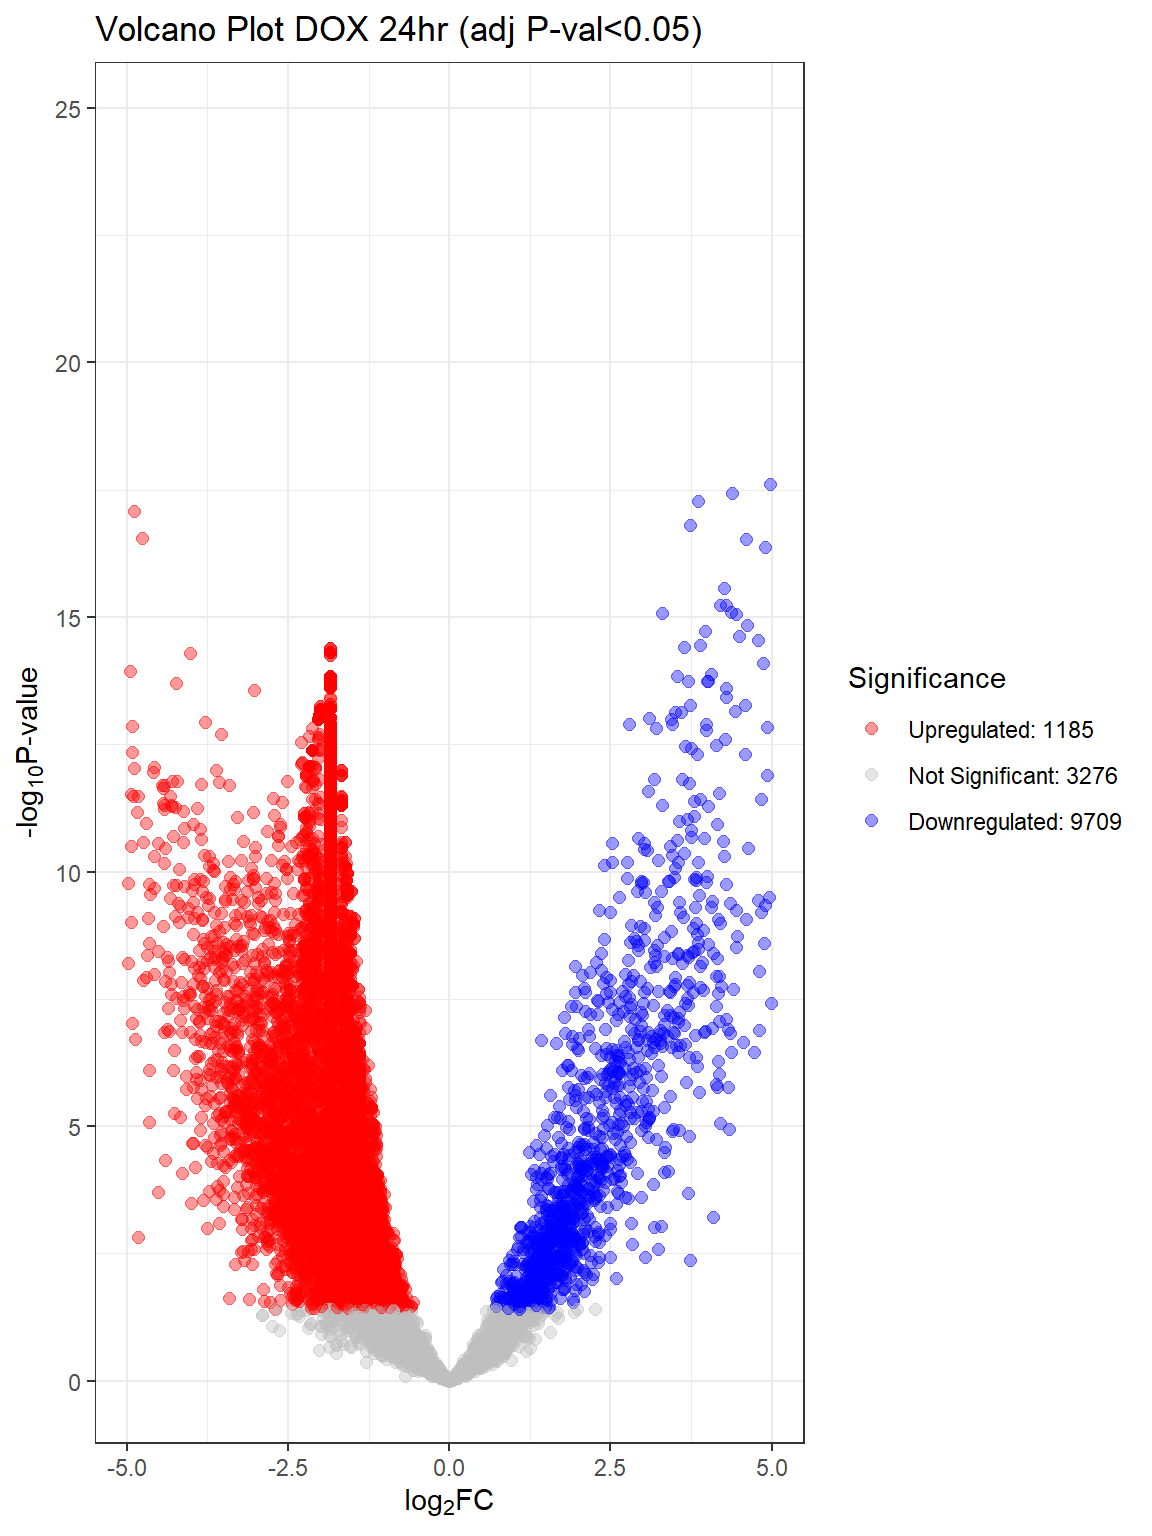
Warning: Removed 11 rows containing missing values or values outside the scale range
(`geom_point()`).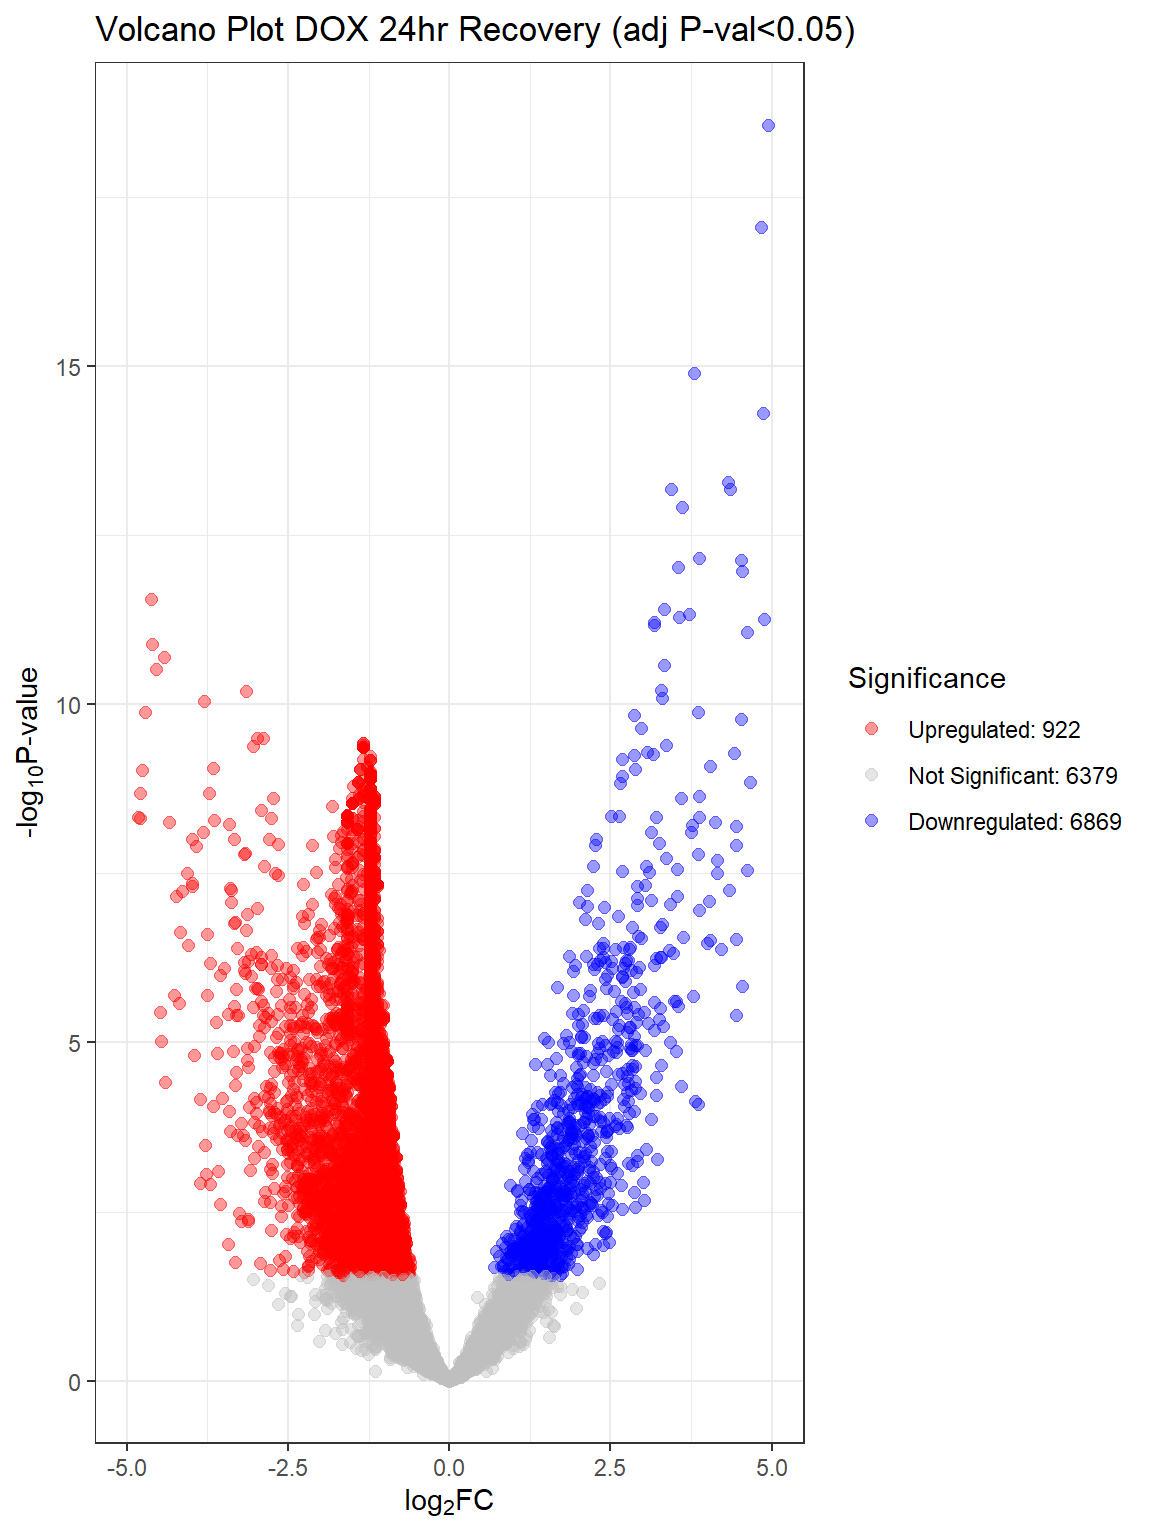
#I want to add the number of DEG onto this for each
#make each volcano plot into an object so I can see how many rows it has

# Alternative function from Renee to combine them all into one image
# volcanosig <- function(df, psig.lvl,topg) {
#     df <- df %>%
#     mutate(threshold = ifelse(adj.P.Val > psig.lvl, "A", ifelse(adj.P.Val <= psig.lvl & logFC<=0,"B","C")))
#
#   ggplot(df, aes(x=logFC, y=-log10(adj.P.Val))) +
#     geom_point(aes(color=threshold))+
#     xlab(expression("Log"[2]*" FC"))+
#     ylim(0,30)+
#     ylab(expression("-log"[10]*"P Value"))+
#     scale_color_manual(values = c("black", "red","blue"))+
#     theme_cowplot()+
#     theme(legend.position = "none",
#           plot.title = element_text(size = rel(0.8), hjust = 0.5),
#           axis.title = element_text(size = rel(0.8)))
# }
#
# vol1 <- volcanosig(top.table_V.D24_dox, 0.01,0)+ ggtitle("Doxorubicin \n 24 hour")
# vol2 <- volcanosig(top.table_V.D24r_dox, 0.01,0)+ ggtitle("Doxorubicin \n 24 hour Recovery")
# vol3 <- volcanosig(top.table_V.D144r_dox, 0.01,0)+ ggtitle("Doxorubicin\n 144 hour Recovery")+ylab("")
#
#
# Volcanoplots <- plot_grid(vol1,vol2,vol3, nrow = 1, ncol = 3)
# Volcanoplots
#now like the hypoxia paper, I'd like to put together comparisons between samples and conditions to check if they are more similar than othersPCA_data_d <- fC_Matrix_Full_cpm_filter_dox %>%
prcomp(.) %>%
t()
PCA_data_test_d <- (prcomp(t(fC_Matrix_Full_cpm_filter_dox), scale. = TRUE))
#ind_num_dox <- c("1", "1", "1", "1", "1", "1", "2", "2", "2", "2", "2", "2", "3", "3", "3", "3", "3", "3", "4", "4", "4", "4", "4", "4","5", "5", "5", "5", "5", "5", "6", "6", "6", "6", "6", "6", "6R", "6R", "6R", "6R", "6R", "6R")
#saveRDS(ind_num_dox, "data/ind_num_dox.RDS")
ind_num_dox <- readRDS("C:/Users/emmap/RDirectory/Recovery_RNAseq/Recovery_5FU/data/ind_num_dox.RDS")
####now make an annotation for my PCA####
annot_d <- data.frame("samples" = colnames(fC_Matrix_Full_cpm_filter_dox)) %>% separate_wider_delim(., cols = samples, names = c("Tx", "Time", "Ind"), delim = "_", cols_remove = FALSE) %>% unite(., col = "Tx_Time", Tx, Time, sep = "_", remove = FALSE) %>% cbind(., ind_num_dox)
#saveRDS(annot_d, "C:/Users/emmap/RDirectory/Recovery_RNAseq/Recovery_5FU/data/annot_dox.RDS")
#combine the prcomp matrix and annotation
annot_PCA_matrix_d <- PCA_data_test_d$x %>% cbind(., annot_d)
#now I can make a graph where I have filled values for individual! I have seven colors for seven individuals
# I have three fill values for three timepoints
#using annotation matrix above as well as annotated PCA matrix #(annot_PCA_matrix)
#extra info for colors in the graph (fill parameter)
fill_col_ind <- c("#66C2A5", "#FC8D62", "#1F78B4", "#E78AC3", "#A6D854", "#FFD92A", "#8B3E9B")
fill_col_ind_dark <- c("#003F5C", "#45AE91", "#58508D", "#BC4099", "#8B3E9B", "#FF6361", "#FF2362")
fill_col_tx_dox <- c("#63666D", "#499FBD")
fill_col_txtime_d <- c("#45AE91", "#58508D", "#BC4099", "#FF2362", "#A6D854", "#FC8D62")
#I want the color parameter to be treatment, the shape as time, and individual as number
####PC1/PC2####
annot_PCA_matrix_d %>% ggplot(., aes(x=PC1, y=PC2, size=10)) +
geom_point(aes(color = Tx, shape = Time)) +
scale_color_manual(values = c(fill_col_tx_dox))+
scale_shape_manual(values = c(15, 19, 17))+
geom_text_repel(aes(label = ind_num_dox))+
theme_bw(base_size = 10)+
ggtitle(expression("PCA of filtered log"[2]*"cpm"))+
guides(size="none")Warning: ggrepel: 27 unlabeled data points (too many overlaps). Consider
increasing max.overlaps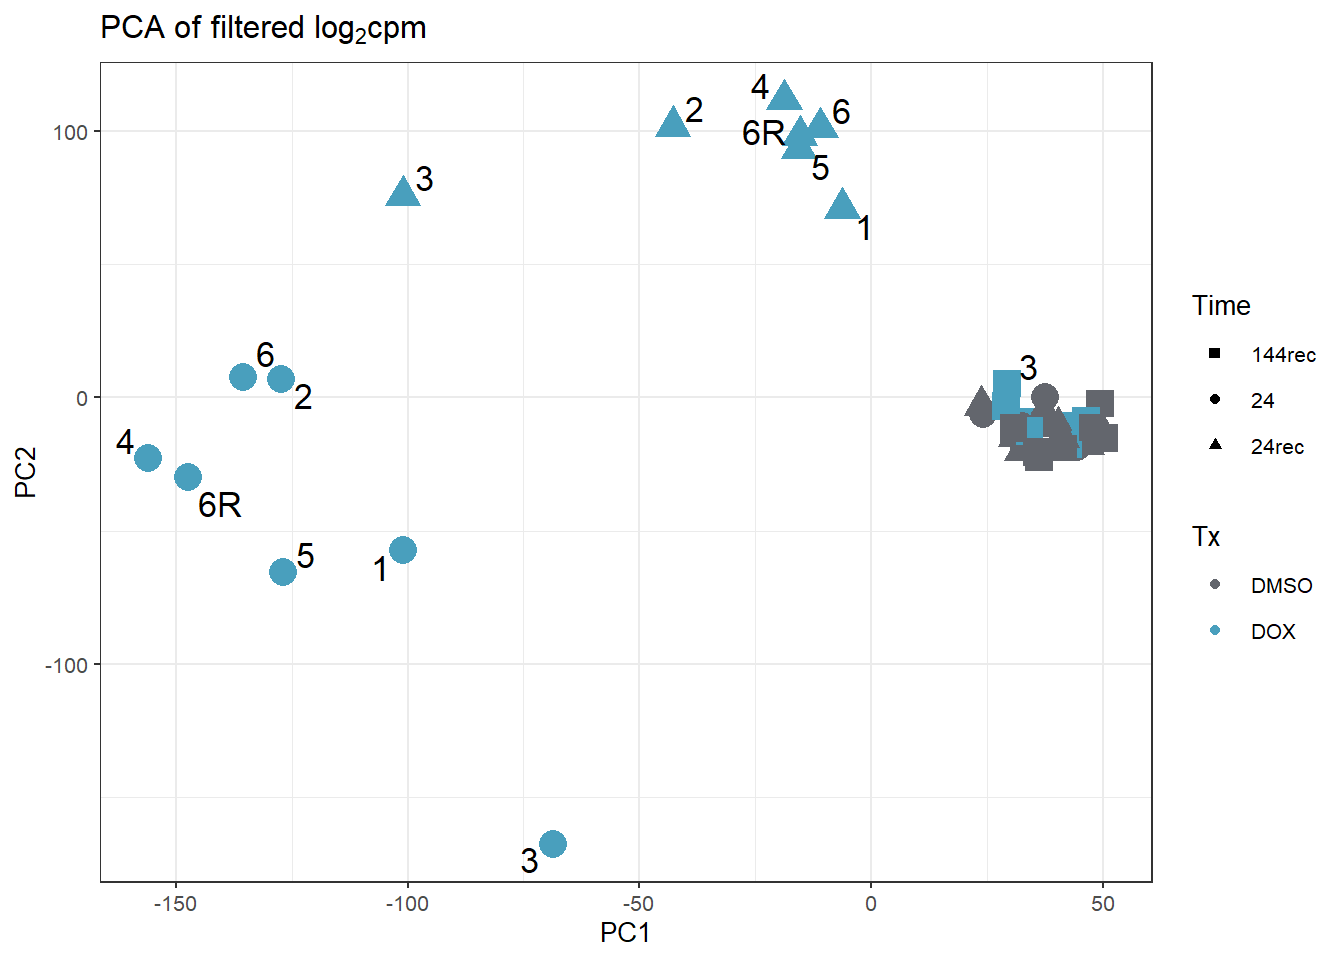
####PC1/PC2 autoplot####
prcomp_res_d <- prcomp(t(fC_Matrix_Full_cpm_filter_dox), scale. = FALSE, center = TRUE)
annot_prcomp_res_d <- prcomp_res_d$x %>% cbind(., annot_d)

ggplot2::autoplot(prcomp_res_d, data = annot_d, colour = "Tx_Time", size =4)+
  theme_bw()+
  scale_color_manual(values = c(fill_col_txtime_d))+
  ggrepel::geom_text_repel(label= ind_num_dox)+
  ggtitle("PCA of DOX filtered log2cpm")
Warning: ggrepel: 8 unlabeled data points (too many overlaps). Consider
increasing max.overlaps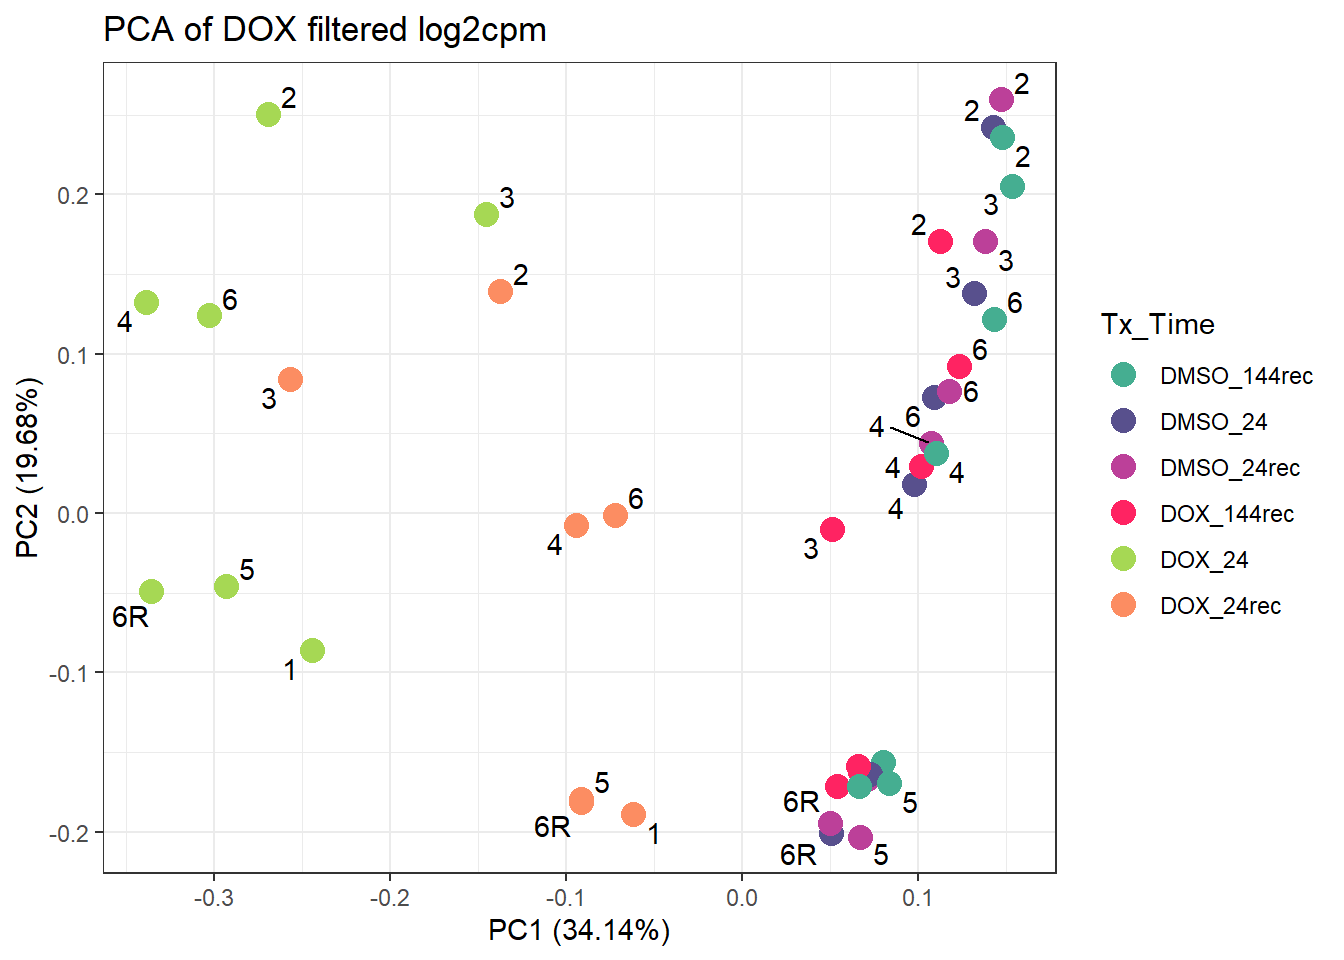
####PC2/PC3####
annot_PCA_matrix_d %>% ggplot(., aes(x=PC2, y=PC3, size=10)) +
  geom_point(aes(color = Tx, shape = Time)) +
  scale_color_manual(values = c(fill_col_tx_dox))+
  scale_shape_manual(values = c(15, 19, 17))+
  geom_text_repel(aes(label = ind_num_dox))+
  theme_bw(base_size = 10)+
  ggtitle(expression("PCA of filtered log"[2]*"cpm"))+
  guides(size="none")
Warning: ggrepel: 7 unlabeled data points (too many overlaps). Consider
increasing max.overlaps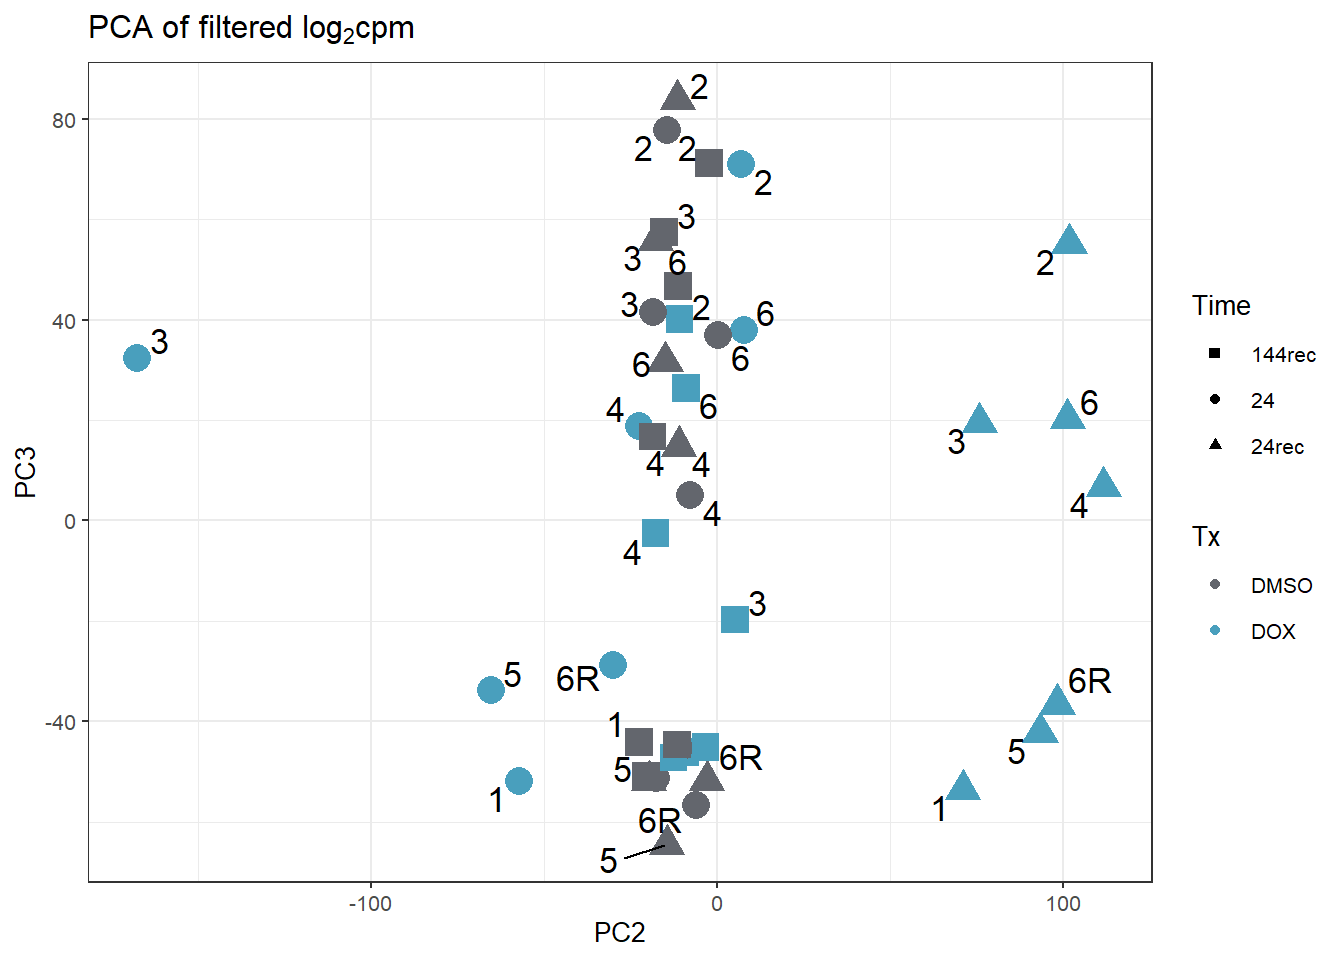
####PC3/PC4####
annot_PCA_matrix_d %>% ggplot(., aes(x=PC3, y=PC4, size=10)) +
  geom_point(aes(color = Tx, shape = Time)) +
  scale_color_manual(values = c(fill_col_tx_dox))+
  scale_shape_manual(values = c(15, 19, 17))+
  geom_text_repel(aes(label = ind_num_dox))+
  theme_bw(base_size = 10)+
  ggtitle(expression("PCA of filtered log"[2]*"cpm"))+
  guides(size="none")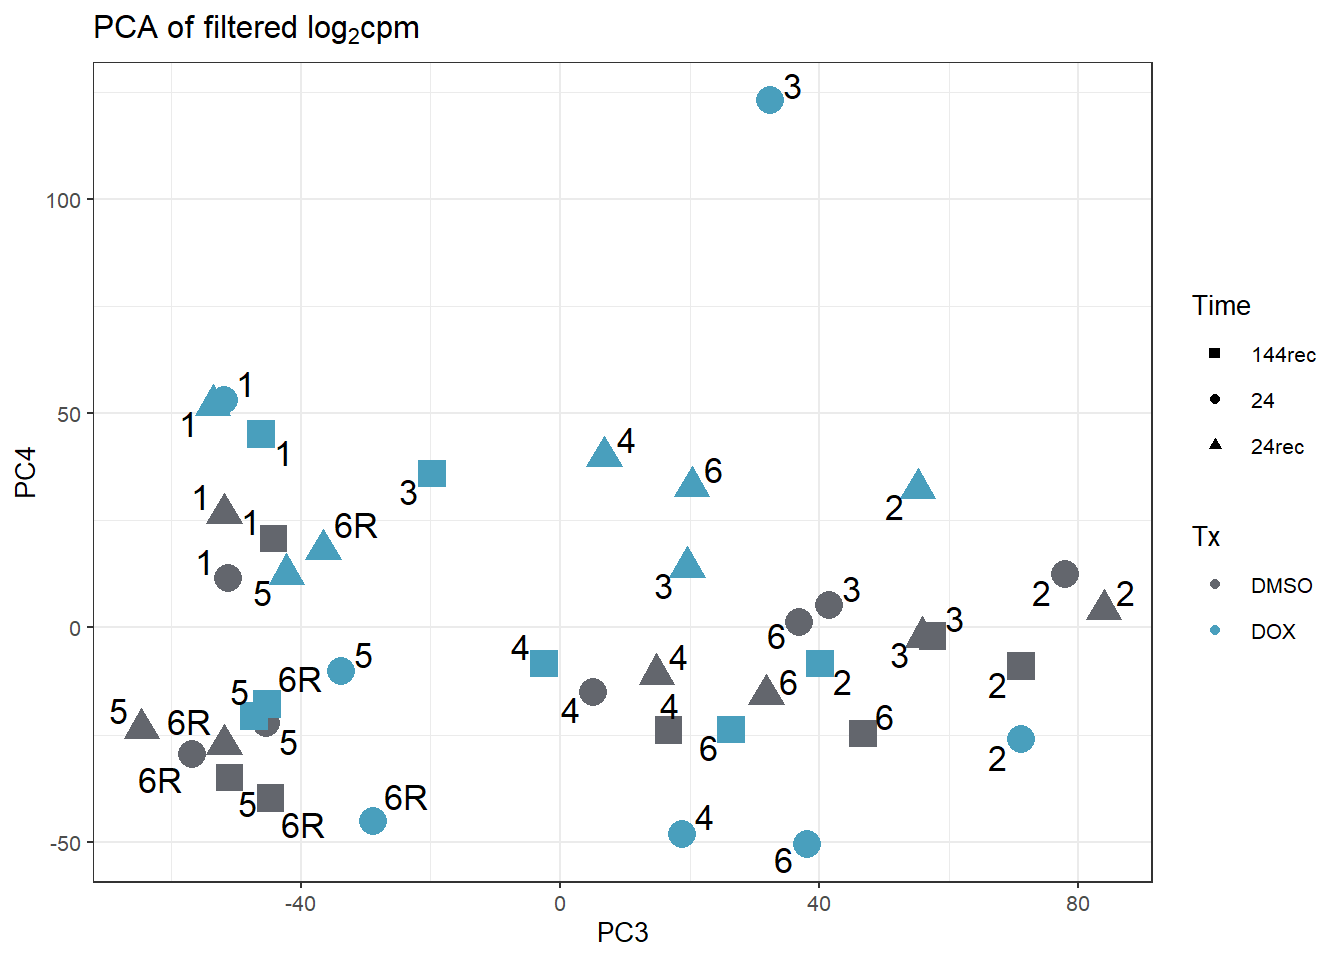
fC_Matrix_Full <- readRDS("data/fC_Matrix_Full.RDS")

fC_Matrix_Full_dox <- as.data.frame(fC_Matrix_Full) %>% dplyr::select(-(contains("FLUO")))

Counts_Full_df_dox <- data.frame(fC_Matrix_Full_dox)

#filter this dataframe by the filtered gene list I have
filt_gene_list_dox <- row.names(fC_Matrix_Full_cpm_filter_dox)
#saveRDS(filt_gene_list_dox, "data/filt_gene_list_dox.RDS")

counts_DE_df_dox <- Counts_Full_df_dox[! (rownames(Counts_Full_df_dox) %in% filt_gene_list_dox), ]

#saveRDS(counts_DE_df_dox, "data/counts_DE_df_dox.RDS")

RUV_filt_counts_dox <- fC_Matrix_Full_dox %>%
  as.data.frame() %>%
  dplyr::filter(., row.names(.)%in% filt_gene_list_dox)

#add in the annotation files
ind_num_dox <- readRDS("C:/Users/emmap/RDirectory/Recovery_RNAseq/Recovery_5FU/data/ind_num_dox.RDS")
annot_d <- readRDS("C:/Users/emmap/RDirectory/Recovery_RNAseq/Recovery_5FU/data/annot_dox.RDS")


#  counts need to be integer values and in a numeric matrix
# note: the log transformation needs to be accounted for in the isLog argument in RUVs function.
counts_d <- as.matrix(RUV_filt_counts_dox)
dim(counts_d)
[1] 14225 42#14225 genes
# Create a DataFrame for the phenoData
phenoData_d <- DataFrame(annot_d)
# Now create the RangedSummarizedExperiment necessary for RUVs input
# looks like it did need both the phenodata and the counts.
set_dox <- SummarizedExperiment(assays = counts_d, metadata = phenoData_d)
# Generate a background matrix
# The column "Cond" holds the comparisons that you actually want to make. DOX_24, DMSO_24,5FU_24, DOX_3,etc.
scIdx_d <-RUVSeq::makeGroups(phenoData_d$Tx_Time)
scIdx_d [,1] [,2] [,3] [,4] [,5] [,6] [,7]
[1,] 6 12 18 24 30 36 42
[2,] 2 8 14 20 26 32 38
[3,] 4 10 16 22 28 34 40
[4,] 5 11 17 23 29 35 41
[5,] 1 7 13 19 25 31 37
[6,] 3 9 15 21 27 33 39#now I've made all of the data I need for this - they are located in each section for k values
#DO NOT USE THESE COUNTS FOR LINEAR MODELING
#colors for all of the plots
fill_col_ind <- c("#66C2A5", "#FC8D62", "#1F78B4", "#E78AC3", "#A6D854", "#FFD92A", "#8B3E9B")
fill_col_ind_dark <- c("#003F5C", "#45AE91", "#58508D", "#BC4099", "#8B3E9B", "#FF6361", "#FF2362")
fill_col_tx_dox <- c("#63666D", "#499FBD")
fill_col_txtime_dox <- c("#45AE91", "#58508D", "#BC4099", "#FF2362", "#A6D854", "#FC8D62")
# before ruv
prcomp_res_d <- prcomp(t(counts_d), scale. = FALSE, center = TRUE)
ggplot2::autoplot(prcomp_res_d, data = annot_d, colour = "Tx_Time", size =4)+
theme_bw()+
scale_color_manual(values = c(fill_col_txtime_dox))+
ggrepel::geom_text_repel(label= ind_num_dox)+
ggtitle("No RUV")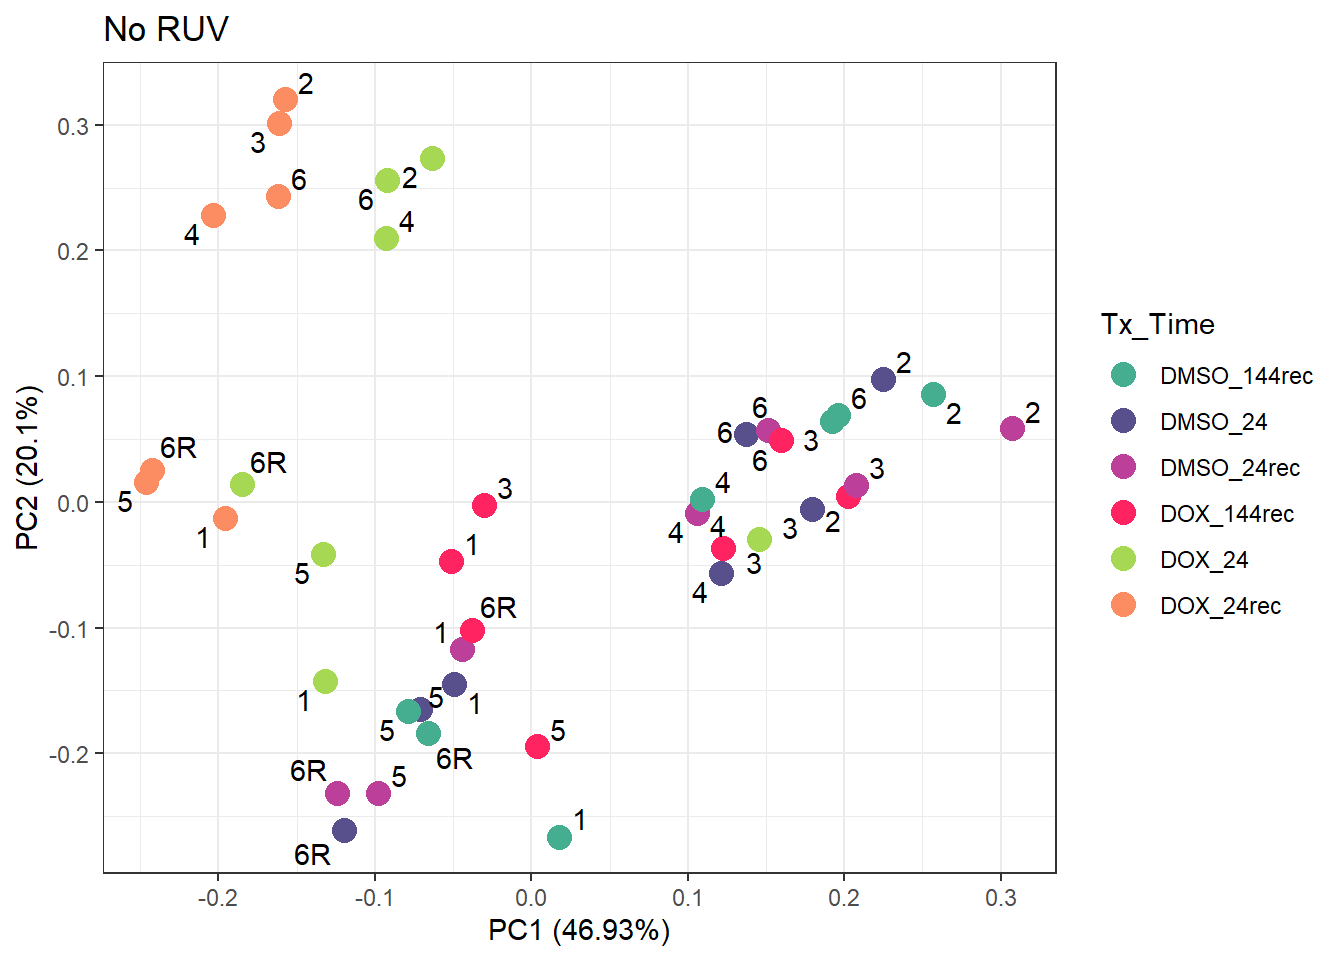
####new PCA plots no correction####
#PCA plots for each value of k attached in each section
prcomp_res_d <- prcomp(t(counts_d), scale. = FALSE, center = TRUE)
annot_prcomp_res_d <- prcomp_res_d$x %>% cbind(., annot_d)

group_2d <- rep(c("DOX_24",
                  "DMSO_24",
                  "DOX_24rec",
                  "DMSO_24rec",
                  "DOX_144rec",
                  "DMSO_144rec"), 7)


dge1_d <- DGEList.data.frame(counts = fC_Matrix_Full_dox, group = group_2d, genes = row.names(fC_Matrix_Full_dox))

#calculate the normalization factors with method TMM
dge1_calc_d <- calcNormFactors(dge1_d, method = "TMM")

#Pull out factors
snames1_d <- data.frame("samples" = colnames(dge1_calc_d)) %>% separate_wider_delim(., cols = samples, names = c("Treatment", "Time", "Individual"), delim = "_", cols_remove = FALSE)

snames1_ind_d <- snames1_d$Individual
#Apply RUVs function from RUVSeq
#"k" will be iteratively adjusted over time depending on your PCA.
set_d <- RUVSeq::RUVs(x = counts_d, k =1, scIdx = scIdx_d, isLog = FALSE)
#get the ruv weights to put into the linear model. n weights = k.
#k=1
RUV_df_d <- set_d$W %>% as.data.frame()
RUV_df_d$Names <- rownames(RUV_df_d)
#Check that the names match
#k=1
RUV_df_rm_d <- RUV_df_d[RUV_df_d$Names %in% annot_d$samples, ]
RUV_1_d <- RUV_df_rm_d$W_1
# after ruv k=1
#PCA checks
#k=1
prcomp_res_1_d <- prcomp(t(set_d$normalizedCounts), scale. = FALSE, center = TRUE)
annot_prcomp_res_1_d <- prcomp_res_1_d$x %>% cbind(., annot_d)
ggplot2::autoplot(prcomp_res_1_d, data = annot_d, colour = "Tx_Time", size =4)+
theme_bw()+
scale_color_manual(values = c(fill_col_txtime_dox))+
ggrepel::geom_text_repel(label= ind_num_dox)+
ggtitle("RUVs Correction k=1")Warning: ggrepel: 5 unlabeled data points (too many overlaps). Consider
increasing max.overlaps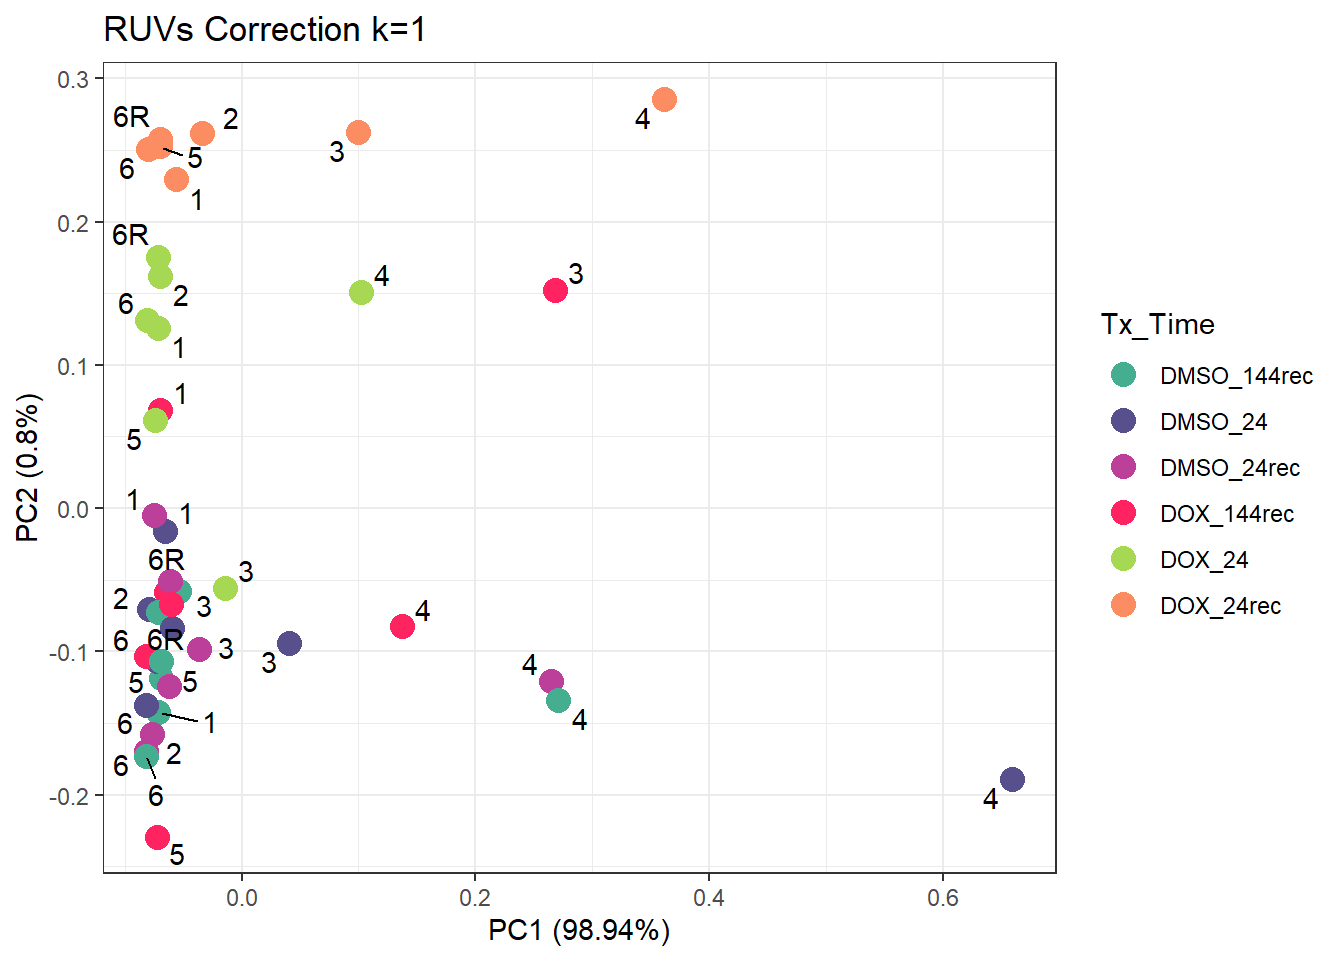
#k=1
annot_d$samples == RUV_df_rm_d$Names
[1] TRUE TRUE TRUE TRUE TRUE TRUE TRUE TRUE TRUE TRUE TRUE TRUE TRUE TRUE TRUE
[16] TRUE TRUE TRUE TRUE TRUE TRUE TRUE TRUE TRUE TRUE TRUE TRUE TRUE TRUE TRUE
[31] TRUE TRUE TRUE TRUE TRUE TRUE TRUE TRUE TRUE TRUE TRUE TRUEannot_d$RUV_1_d <- RUV_df_rm_d$W_1
#Create my model matrix
#k=1
mm_r1_d <- model.matrix(~0 + group_2d + RUV_1_d, data = annot_d)
p1_d <- voom(dge1_calc_d$counts, mm_r1_d, plot = TRUE)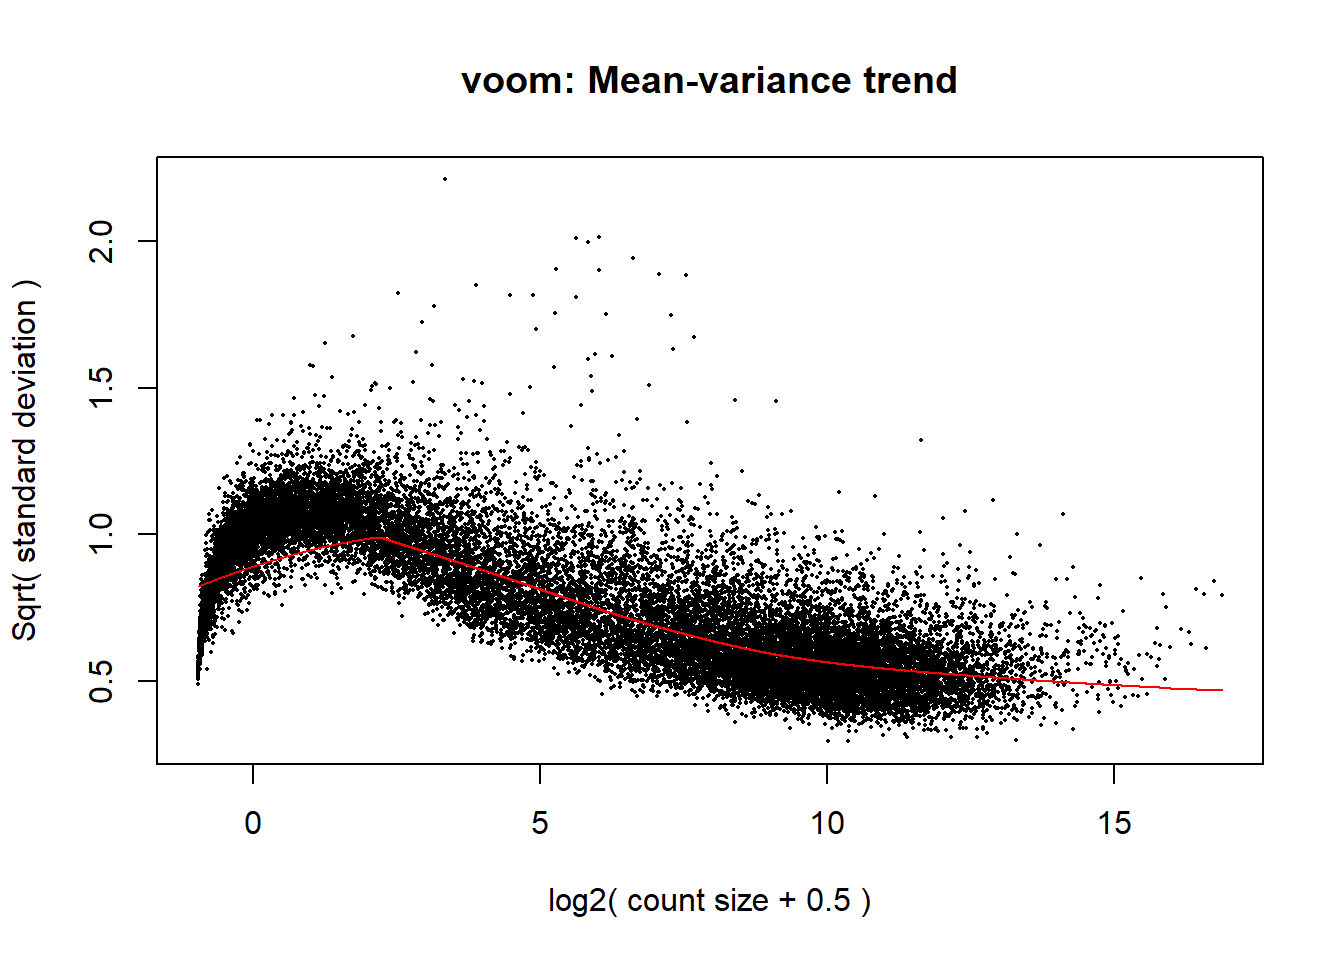
corfit1_d <- duplicateCorrelation(p1_d, mm_r1_d, block = snames1_ind_d)

v1_d <- voom(dge1_calc_d$counts, mm_r1_d, block = snames1_ind_d, correlation = corfit1_d$consensus)

fit1_d <- lmFit(v1_d, mm_r1_d, block = snames1_ind_d, correlation = corfit1_d$consensus)

#k=1
mm_r1_names_d <- str_replace(string = colnames(mm_r1_d), pattern = "group_2d", replacement = "")
design_d <- model.matrix(~ group_2d + RUV_1_d , annot_d)
colnames(mm_r1_d) <- mm_r1_names_d

#k=1
cm_r1_d <- makeContrasts(
        V.D24 = DOX_24 - DMSO_24,
        V.D24r = DOX_24rec - DMSO_24rec,
        V.D144r = DOX_144rec - DMSO_144rec,
        RUV_1_24 = RUV_1_d - DMSO_24,
        RUV_1_24r= RUV_1_d - DMSO_24rec,
        RUV_1_144r = RUV_1_d - DMSO_144rec,
        levels = mm_r1_d
)

#k=1
vfit_r1_d <- lmFit(p1_d, mm_r1_d)
vfit_r1_d <- contrasts.fit(vfit_r1_d, contrasts = cm_r1_d)

#k=1
efit1_d <- eBayes(vfit_r1_d)

#k=1
results1_d = decideTests(efit1_d)
summary(results1_d)
V.D24 V.D24r V.D144r RUV_1_24 RUV_1_24r RUV_1_144r
Down 5222 2650 486 13532 13539 13491
NotSig 14886 16841 26921 1645 1641 1721
Up 8287 8904 988 13218 13215 13183# V.D24 V.D24r V.D144r RUV_1_24 RUV_1_24r RUV_1_144r
# Down 5222 2650 486 13532 13539 13491
# NotSig 14886 16841 26921 1645 1641 1721
# Up 8287 8904 988 13218 13215 13183
#k=1
toptable_Dupcor_DOX_d <- topTable(efit1_d, coef = "V.D24", number = nrow(dge1_calc_d$counts), p.value = 1)
toptable_Dupcor_DOXrec_d <- topTable(efit1_d, coef = "V.D24r", number = nrow(dge1_calc_d$counts), p.value = 1)
toptable_Dupcor_DOX144_d <- topTable(efit1_d, coef = "V.D144r", number = nrow(dge1_calc_d$counts), p.value = 1)
#k=1 plots
toptable_Dupcor_DOX_d$logFC %>% hist(, main= "RUVs k=1 DOX 24hr Toptable")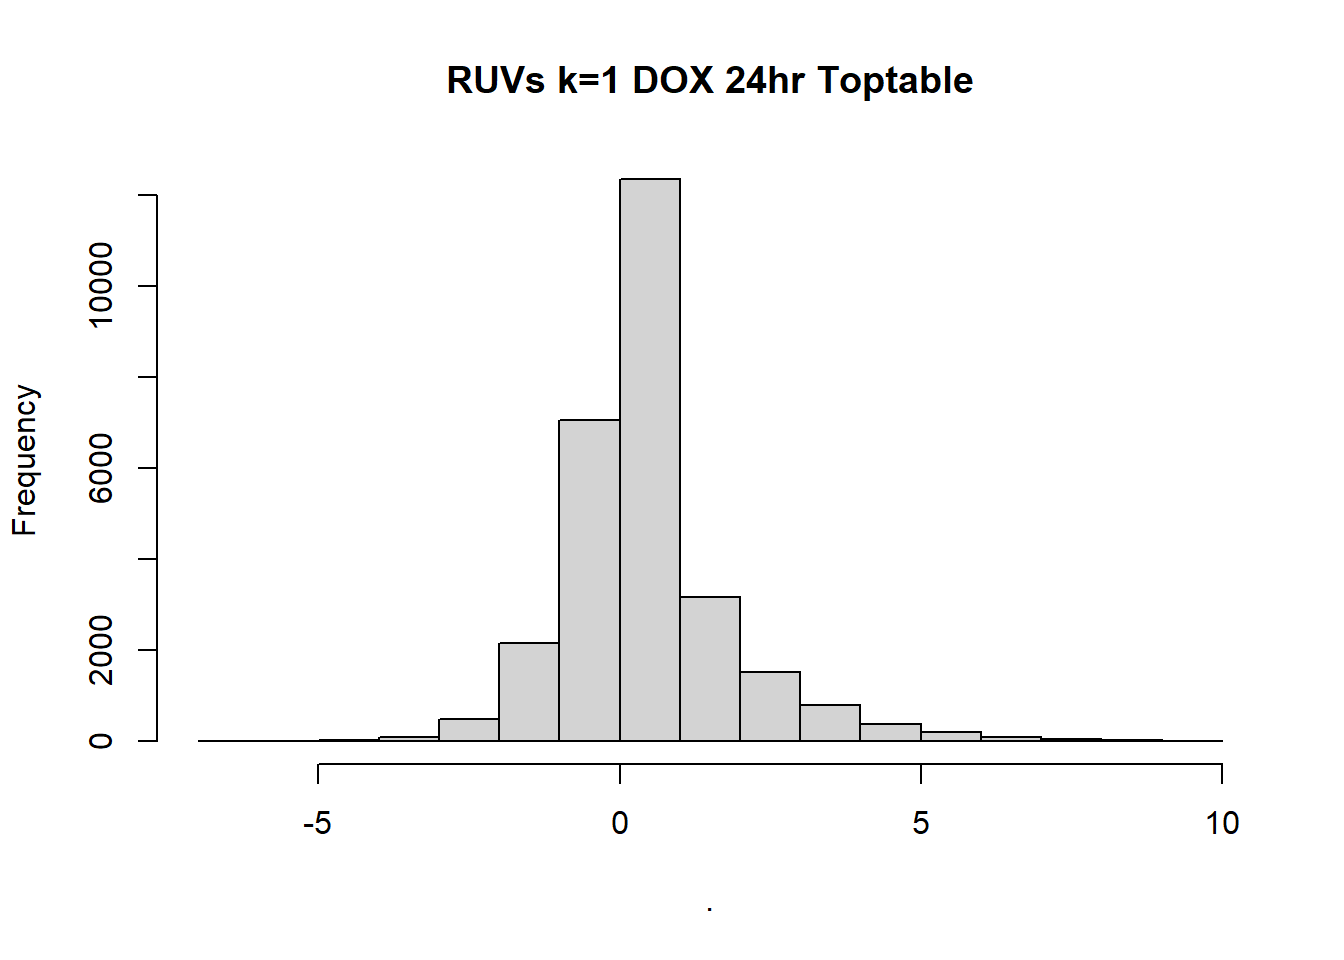
toptable_Dupcor_DOXrec_d$logFC %>% hist(, main = "RUVs k=1 DOX 24Rec Toptable")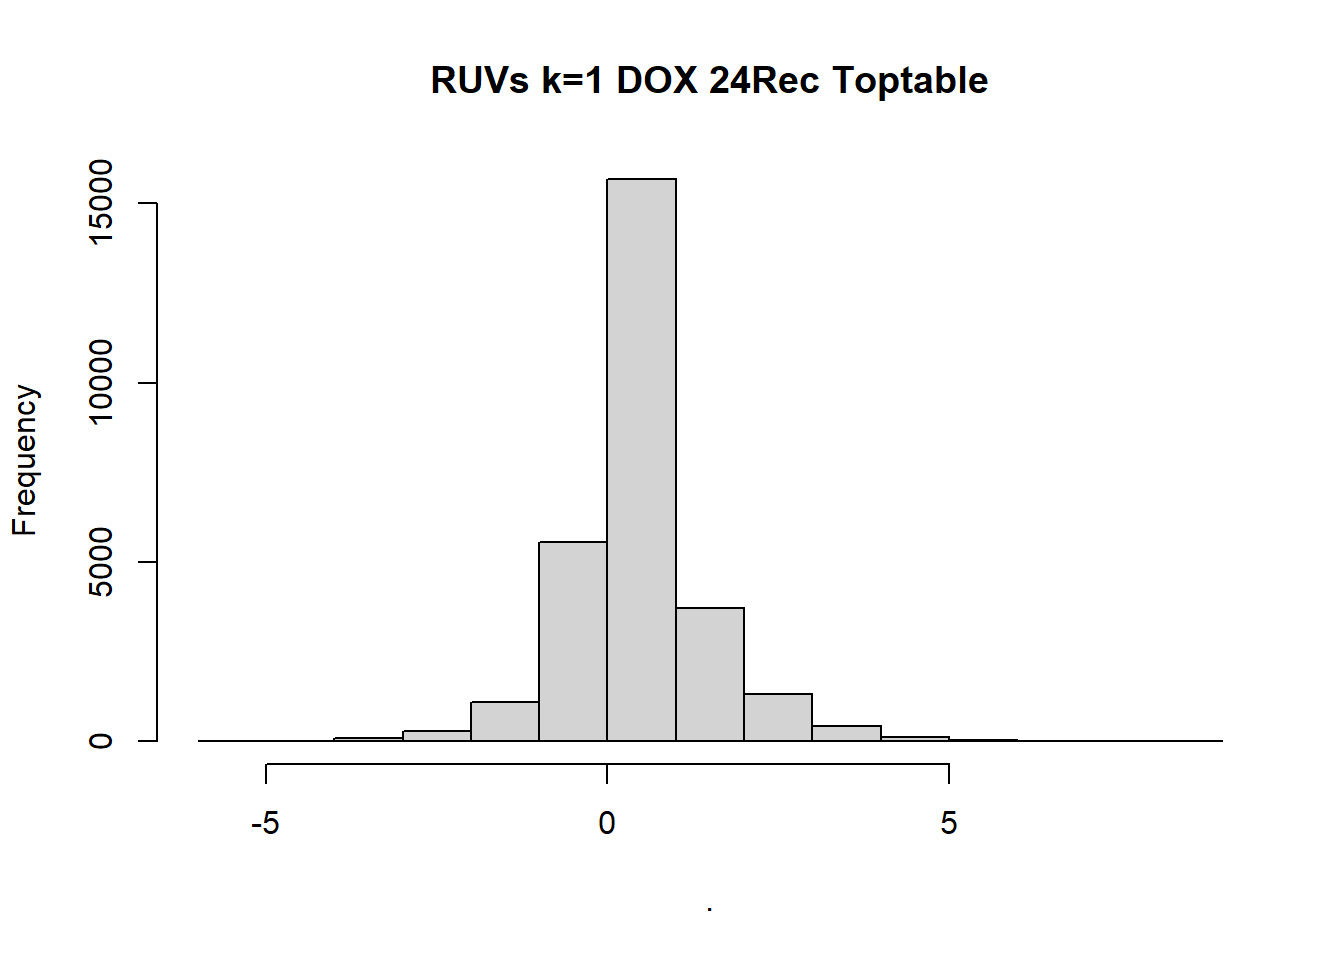
toptable_Dupcor_DOX144_d$logFC %>% hist(, main = "RUVs k=1 DOX 144Rec Toptable")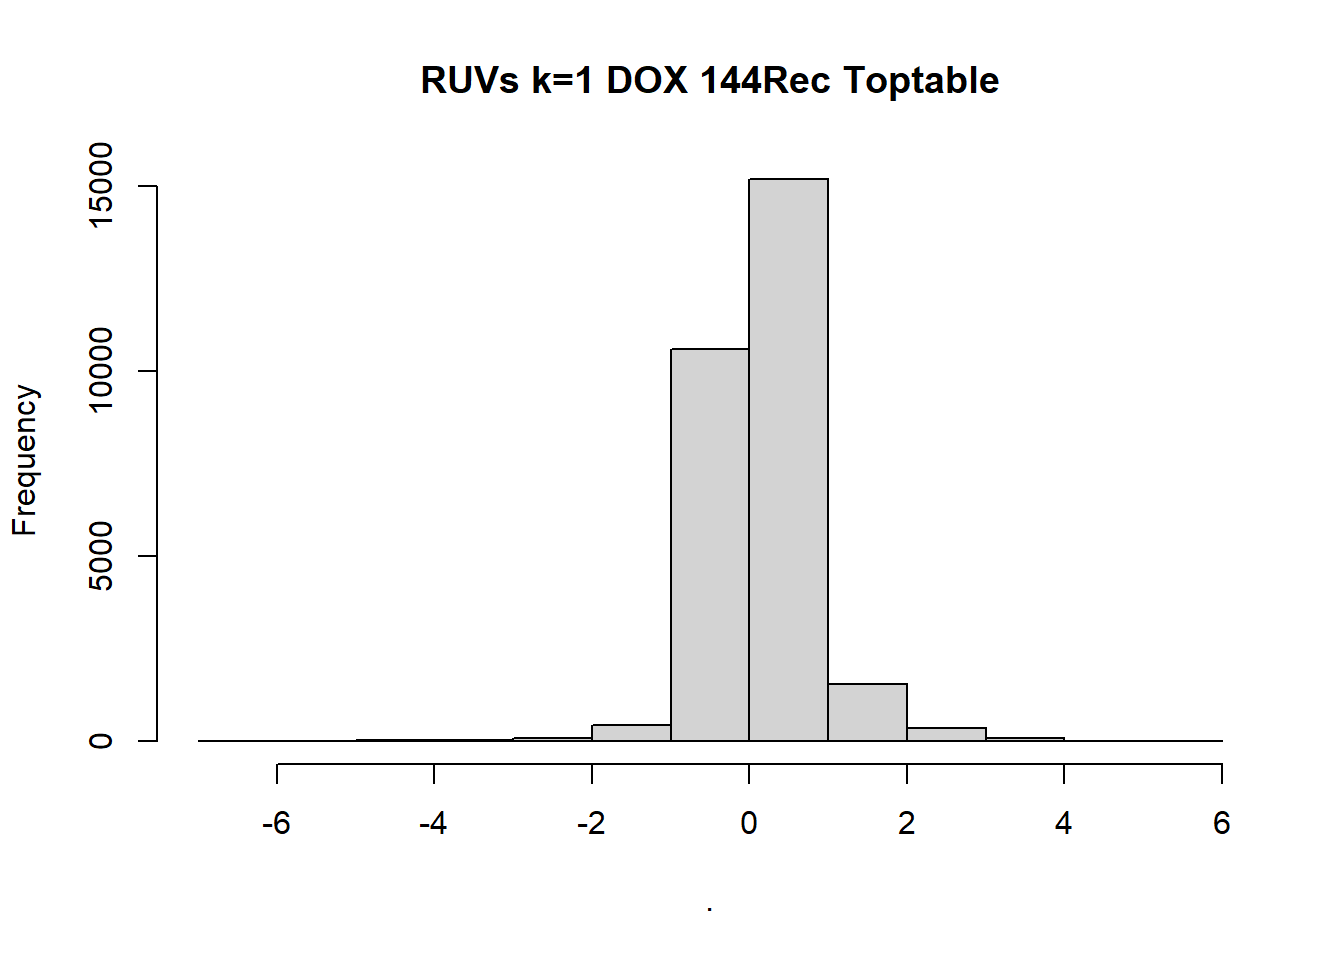
#function is on the previous
annot_data_d <- annot_d %>% dplyr::select("Tx_Time", "Time", "Tx", "Ind", "samples")

Cormotif_d <- counts_DE_df_dox %>% cpm(., log = TRUE)
Cormotif_df_d <- as.data.frame(Cormotif_d)

groupid_d <- rep(c(1, 2, 3, 4, 5, 6), 7)

compid_d <- data.frame(c1 = c(1, 3, 5), c2 = c(2, 4, 6))
#set.seed(12345)
# initial_cormotif_dox <- cormotiffit(exprs = Cormotif_d,
# groupid = groupid_d,
# compid = compid_d,
# K=1:8 , max.iter = 500, runtype = "logCPM")
#only need to run this once!
#save this to an object so I can retrieve it as needed
#saveRDS(initial_cormotif_dox, "data/initial_cormotif_dox.RDS")
initial_cormotif_dox <- readRDS("data/initial_cormotif_dox.RDS")plotIC(initial_cormotif_dox)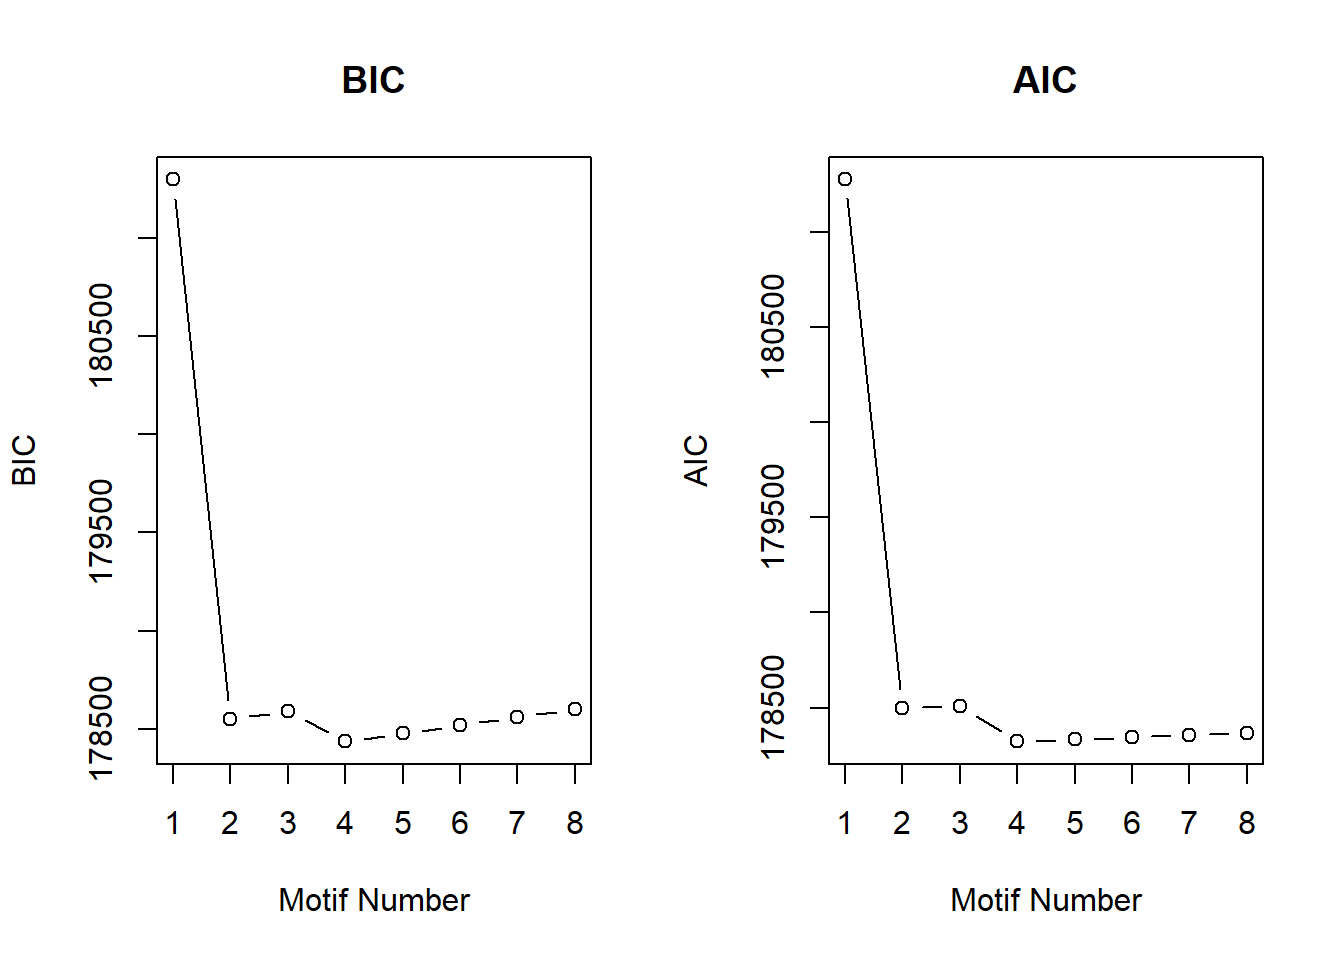
plotMotif(initial_cormotif_dox)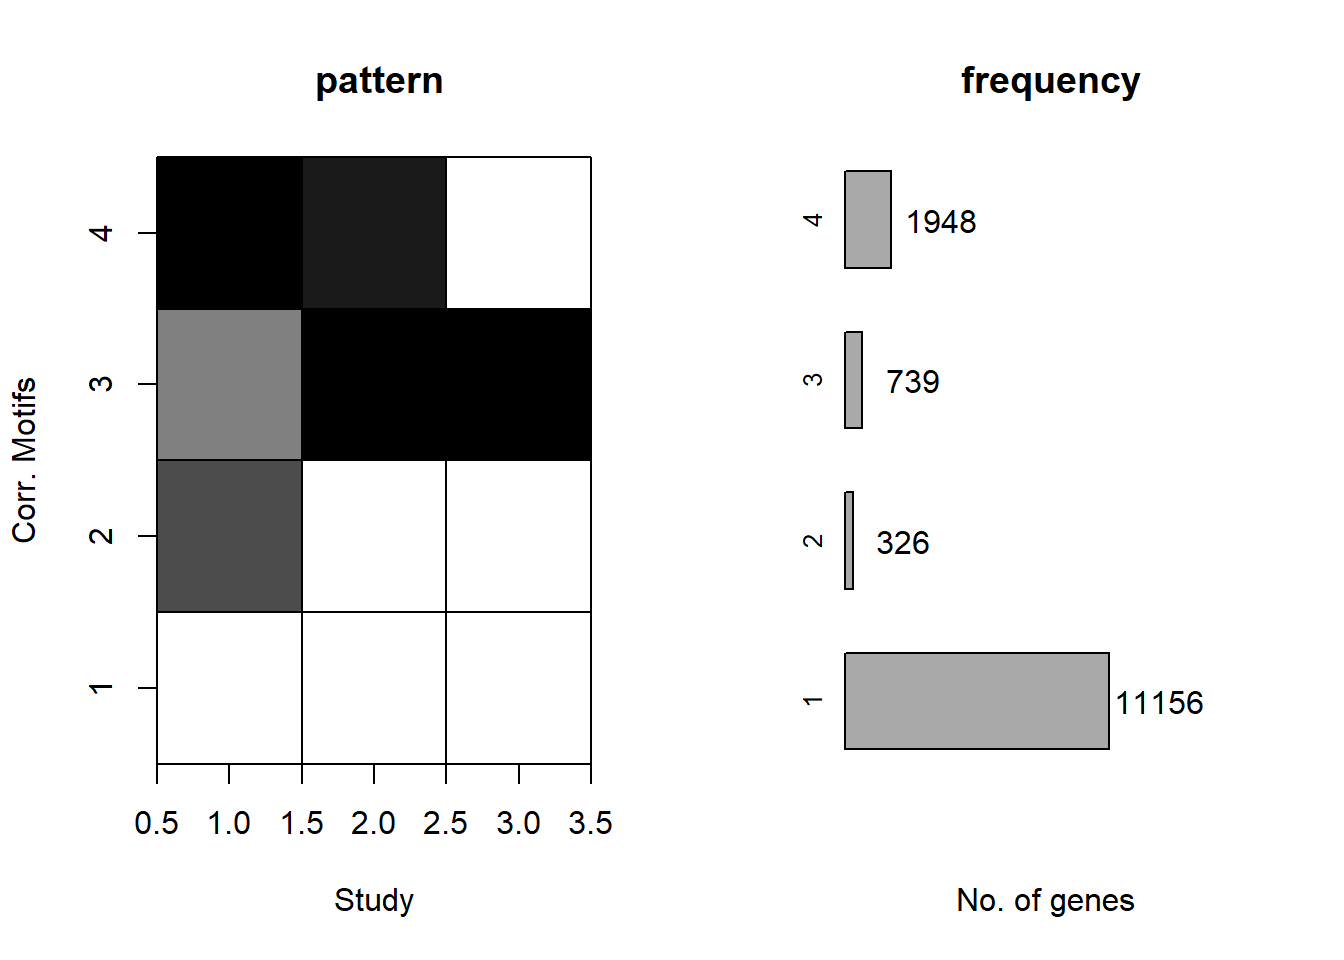
myColors <-  rev(c("#FFFFFF", "#E6E6E6" ,"#CCCCCC", "#B3B3B3", "#999999", "#808080", "#666666","#4C4C4C", "#333333", "#191919","#000000"))

plot.new()
legend('bottomleft',fill=myColors, legend =rev(c("0", "0.1", "0.2", "0.3", "0.4",  "0.5", "0.6", "0.7", "0.8","0.9", "1")), box.col="white",title = "Probability\nlegend", horiz=FALSE,title.cex=.8)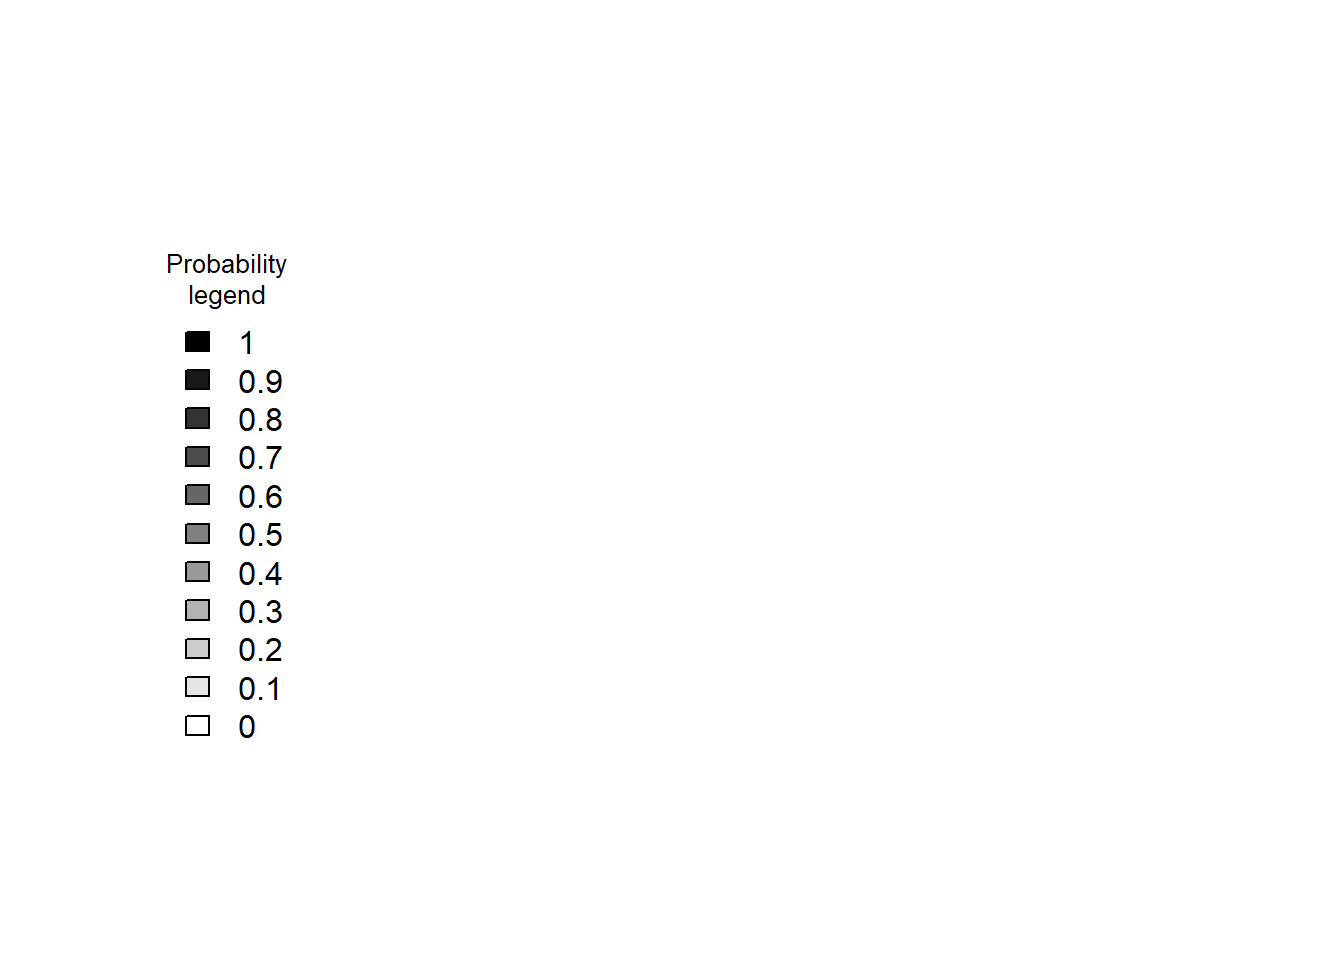
topgenelist_d <- generank(initial_cormotif_dox$bestmotif$p.post)
rownames(topgenelist_d) <- rownames(Cormotif_df_d)


motif_prob_d <- initial_cormotif_dox$bestmotif$clustlike
rownames(motif_prob_d) <- rownames(topgenelist_d)
#saveRDS(motif_prob_d, "data/Cormotif_prob_gene_list_doxonly.RDS")


#Define the gene probability groups - I have 4
clust1_d <- motif_prob_d %>%
  as.data.frame() %>%
  filter(V1>0.5) %>%
  rownames

#using a filter of >0.57 I get 11130 genes compared to 11156 above

length(clust1_d)
[1] 11482#11482 > 0.5
#11130 > 0.57
#is this clust1 a non-response?
clust1_d_df <- as.data.frame(clust1_d)
#example gene - UID 4681 - NBL1
NBL1_motif1 <- Cormotif_df_d %>%
rownames_to_column(var = "entrezgene_id") %>%
dplyr::filter(entrezgene_id == "4681")
NBL1_motif1_long <- melt(NBL1_motif1,
id.vars = c("entrezgene_id"),
variable.name = "Sample",
value.name = "log2cpm")
#now add in my factors like time, tx, tx_time, and ind by breaking up the Sample column
NBL1_motif1_long_df <- data.frame(tx = factor(tx_names2, levels = unique(tx_names2)),
ind = factor(ind_names, levels = unique(ind_names)),
txtime = factor(txtime_names2, levels = unique(txtime_names2)),
time = factor(time_names2, levels = unique(time_names2)))
NBL1_motif1_long_factors <- cbind(NBL1_motif1_long_df, NBL1_motif1_long)
NBL1_motif1_long_factors %>% ggplot(aes(x = txtime, y = log2cpm))+
geom_boxplot(aes(fill = tx))+
geom_point(aes(color = ind)) +
labs(title = "NBL1")+
theme_bw(base_size = 16)+
scale_fill_manual(values = c(tx_col))+
scale_color_manual(values = c(ind_col))+
xlab("Conditions")+
ylab("log2cpm")+
ylim(0,10)+
theme(plot.title = element_text(face = "italic"))
#saveRDS(CDKN1A_geneplot_Dox, "data/CDKN1A_geneplot_Dox.RDS")

clust2_d <- motif_prob_d %>%
  as.data.frame() %>%
  filter(V2>0.5) %>%
  rownames

#using a filter of >0.132 I get the closest - 326 original vs 327 genes here

length(clust2_d)
[1] 0#0 > 0.5
#326 > 0.132
#is clust2 a dox early response?
clust2_d_df <- as.data.frame(clust2_d)
#example gene - 597 - BCL2A1
BCL2A1_motif1 <- Cormotif_df_d %>%
rownames_to_column(var = "entrezgene_id") %>%
dplyr::filter(entrezgene_id == "597")
BCL2A1_motif1_long <- melt(BCL2A1_motif1,
id.vars = c("entrezgene_id"),
variable.name = "Sample",
value.name = "log2cpm")
#now add in my factors like time, tx, tx_time, and ind by breaking up the Sample column
BCL2A1_motif1_long_df <- data.frame(tx = factor(tx_names2, levels = unique(tx_names2)),
ind = factor(ind_names, levels = unique(ind_names)),
txtime = factor(txtime_names2, levels = unique(txtime_names2)),
time = factor(time_names2, levels = unique(time_names2)))
BCL2A1_motif1_long_factors <- cbind(BCL2A1_motif1_long_df, BCL2A1_motif1_long)
BCL2A1_motif1_long_factors %>% ggplot(aes(x = txtime, y = log2cpm))+
geom_boxplot(aes(fill = tx))+
geom_point(aes(color = ind)) +
labs(title = "BCL2A1")+
theme_bw(base_size = 16)+
scale_fill_manual(values = c(tx_col))+
scale_color_manual(values = c(ind_col))+
xlab("Conditions")+
ylab("log2cpm")+
ylim(0,10)+
theme(plot.title = element_text(face = "italic"))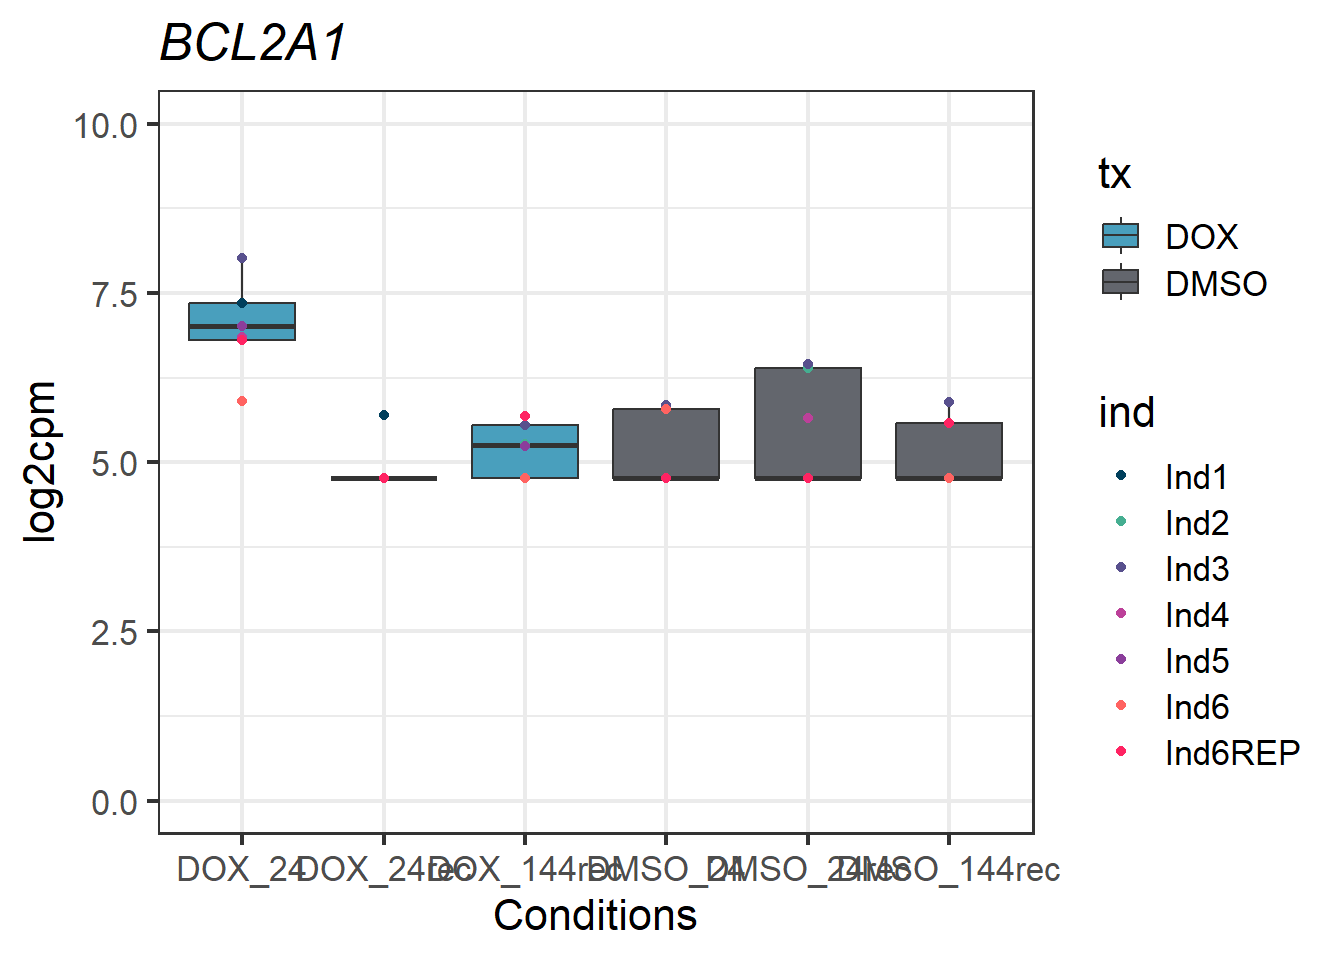
| Version | Author | Date |
|---|---|---|
| ff644ec | emmapfort | 2025-04-18 |
clust3_d <- motif_prob_d %>%
  as.data.frame() %>%
  filter(V3>0.5) %>%
  rownames

#using a filter of >0.3 I get 740 genes vs original 739 genes

length(clust3_d)
[1] 538#538 > 0.5
#740 > 0.3
#is clust 3 a late response?
clust3_d_df <- as.data.frame(clust3_d)
#example gene - 8856 - NR1I2
NR1I2_motif1 <- Cormotif_df_d %>%
rownames_to_column(var = "entrezgene_id") %>%
dplyr::filter(entrezgene_id == "8856")
NR1I2_motif1_long <- melt(NR1I2_motif1,
id.vars = c("entrezgene_id"),
variable.name = "Sample",
value.name = "log2cpm")
#now add in my factors like time, tx, tx_time, and ind by breaking up the Sample column
NR1I2_motif1_long_df <- data.frame(tx = factor(tx_names2, levels = unique(tx_names2)),
ind = factor(ind_names, levels = unique(ind_names)),
txtime = factor(txtime_names2, levels = unique(txtime_names2)),
time = factor(time_names2, levels = unique(time_names2)))
NR1I2_motif1_long_factors <- cbind(NR1I2_motif1_long_df, NR1I2_motif1_long)
NR1I2_motif1_long_factors %>% ggplot(aes(x = txtime, y = log2cpm))+
geom_boxplot(aes(fill = tx))+
geom_point(aes(color = ind)) +
labs(title = "NR1I2")+
theme_bw(base_size = 16)+
scale_fill_manual(values = c(tx_col))+
scale_color_manual(values = c(ind_col))+
xlab("Conditions")+
ylab("log2cpm")+
ylim(0,10)+
theme(plot.title = element_text(face = "italic"))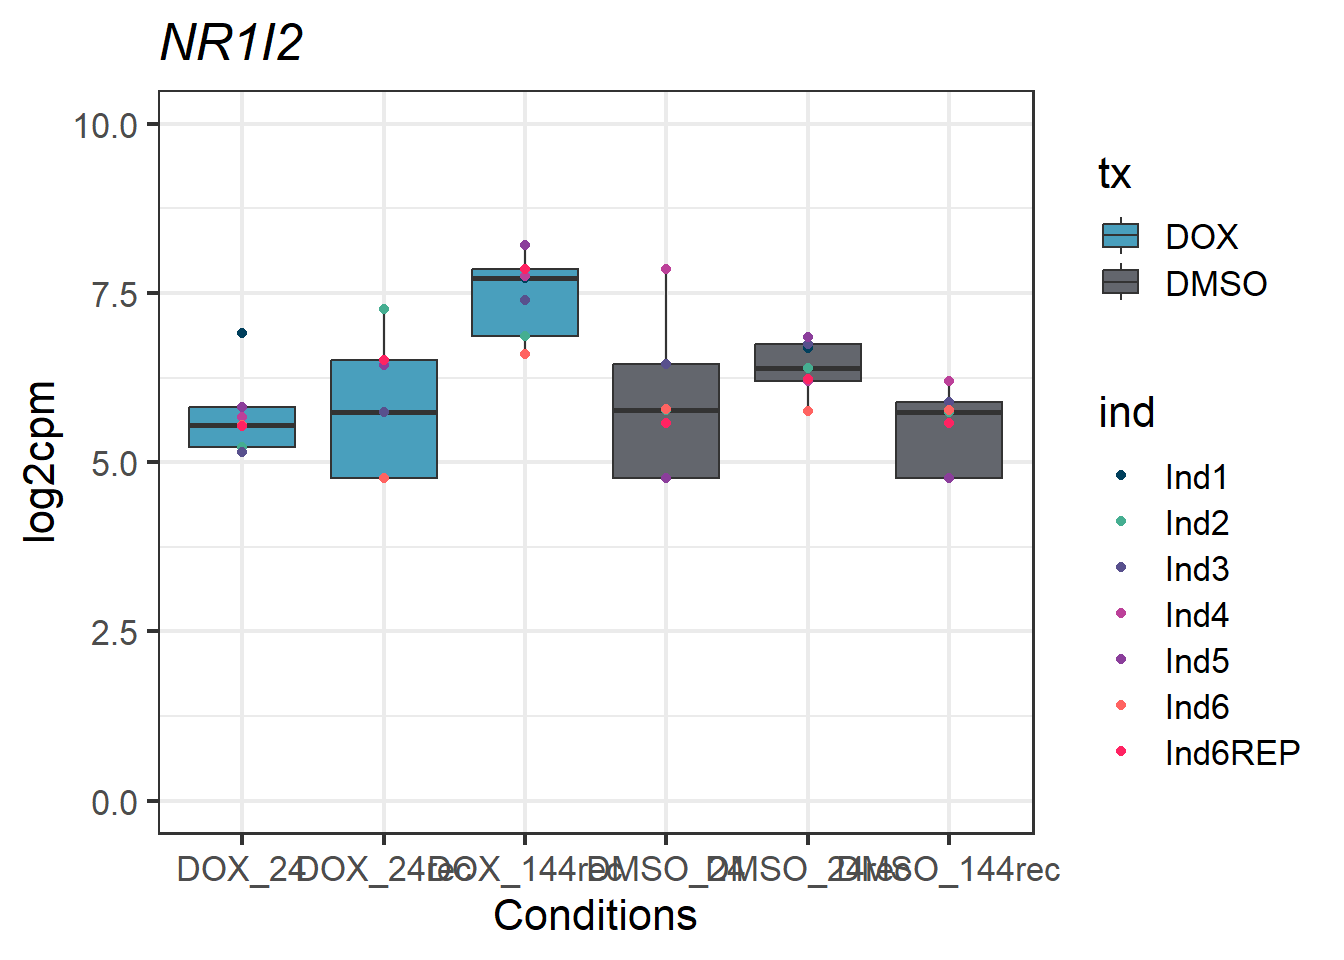
| Version | Author | Date |
|---|---|---|
| ff644ec | emmapfort | 2025-04-18 |
#cluster 4
clust4_d <- motif_prob_d %>%
  as.data.frame() %>%
  filter(V4>0.5) %>%
  rownames

#using >0.4 as my cutoff, I get 1938 genes as compared to original 1948 genes

length(clust4_d)
[1] 1576#1576 > 0.5
#1938 > 0.4
#is clust4 a DOX late response?
clust4_d_df <- as.data.frame(clust4_d)
#example gene - 6725 - SRMS
SRMS_motif1 <- Cormotif_df_d %>%
rownames_to_column(var = "entrezgene_id") %>%
dplyr::filter(entrezgene_id == "6725")
SRMS_motif1_long <- melt(SRMS_motif1,
id.vars = c("entrezgene_id"),
variable.name = "Sample",
value.name = "log2cpm")
#now add in my factors like time, tx, tx_time, and ind by breaking up the Sample column
SRMS_motif1_long_df <- data.frame(tx = factor(tx_names2, levels = unique(tx_names2)),
ind = factor(ind_names, levels = unique(ind_names)),
txtime = factor(txtime_names2, levels = unique(txtime_names2)),
time = factor(time_names2, levels = unique(time_names2)))
SRMS_motif1_long_factors <- cbind(SRMS_motif1_long_df, SRMS_motif1_long)
SRMS_motif1_long_factors %>% ggplot(aes(x = txtime, y = log2cpm))+
geom_boxplot(aes(fill = tx))+
geom_point(aes(color = ind)) +
labs(title = "SRMS")+
theme_bw(base_size = 16)+
scale_fill_manual(values = c(tx_col))+
scale_color_manual(values = c(ind_col))+
xlab("Conditions")+
ylab("log2cpm")+
ylim(0,10)+
theme(plot.title = element_text(face = "italic"))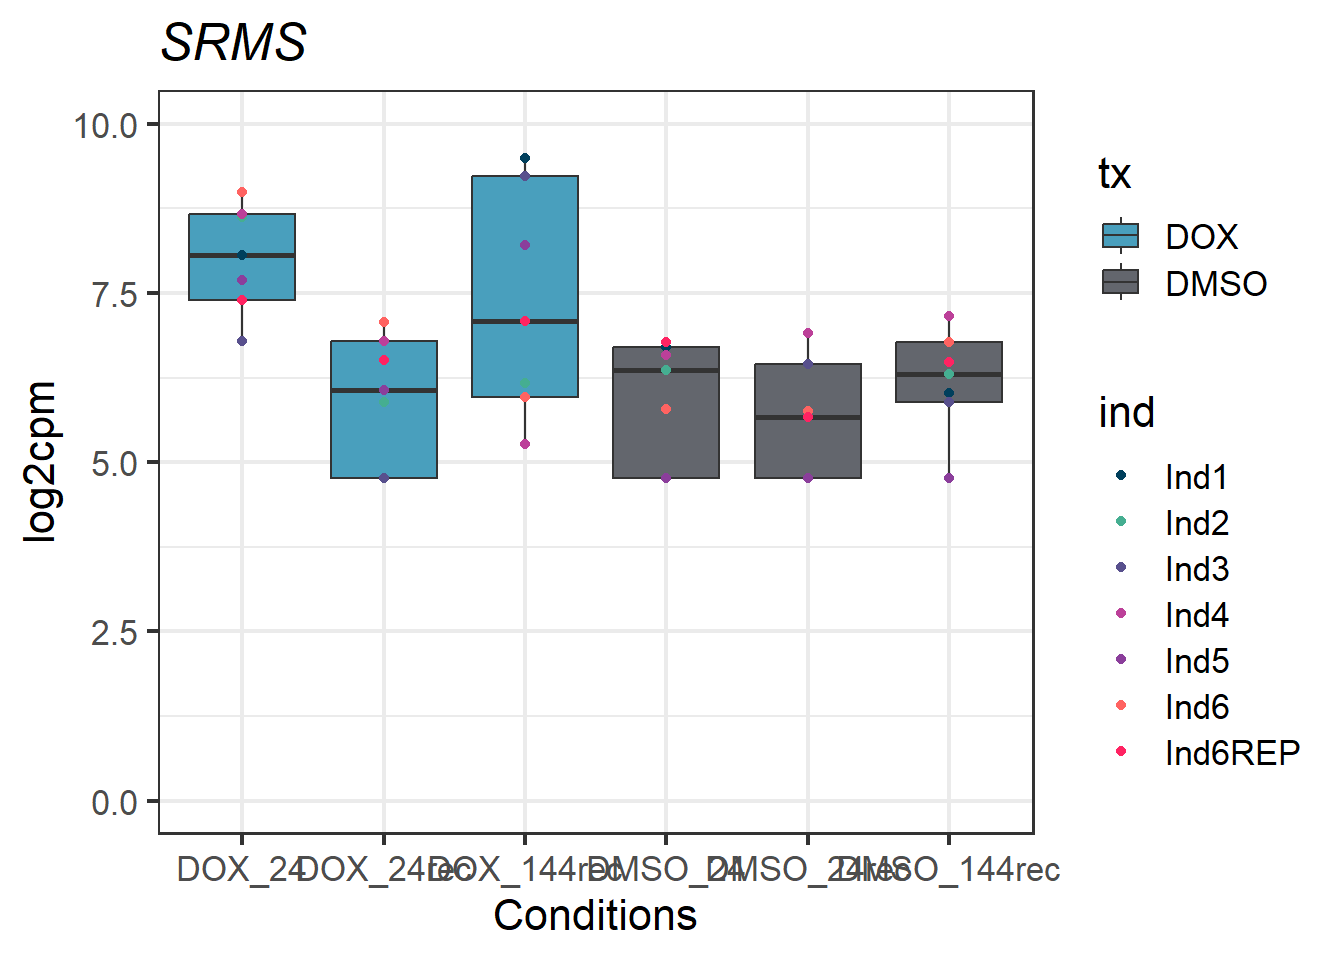
| Version | Author | Date |
|---|---|---|
| ff644ec | emmapfort | 2025-04-18 |
#now let's make a pie chart with the above number of genes for each motif
clusterdata_d_adj <- data.frame(
  Category = c("No Response","Acute Response", "Late Response", "Early Sustained Response"),
  Value = c(11130, 327, 740, 1938)
)

piecolors <- c("No Response" = "#007896",
               "Acute Response" = "#079255",
               "Late Response" = "#58508D",
               "Early Sustained Response" = "#BC5090")

#make a piechart of these distributions
clusterdata_d_adj %>% ggplot(aes(x = "", y = Value, fill = Category))+
  geom_bar(width = 1, stat = "identity")+
  coord_polar("y", start = 0)+
  geom_text(aes(label = Value),
            position = position_stack(vjust = 0.5),
            size = 4, color = "black")+
  labs(title = "Distribution of Gene Clusters Identified By Cormotif", x = NULL, y = NULL)+
  theme_void()+
  scale_fill_manual(values = piecolors)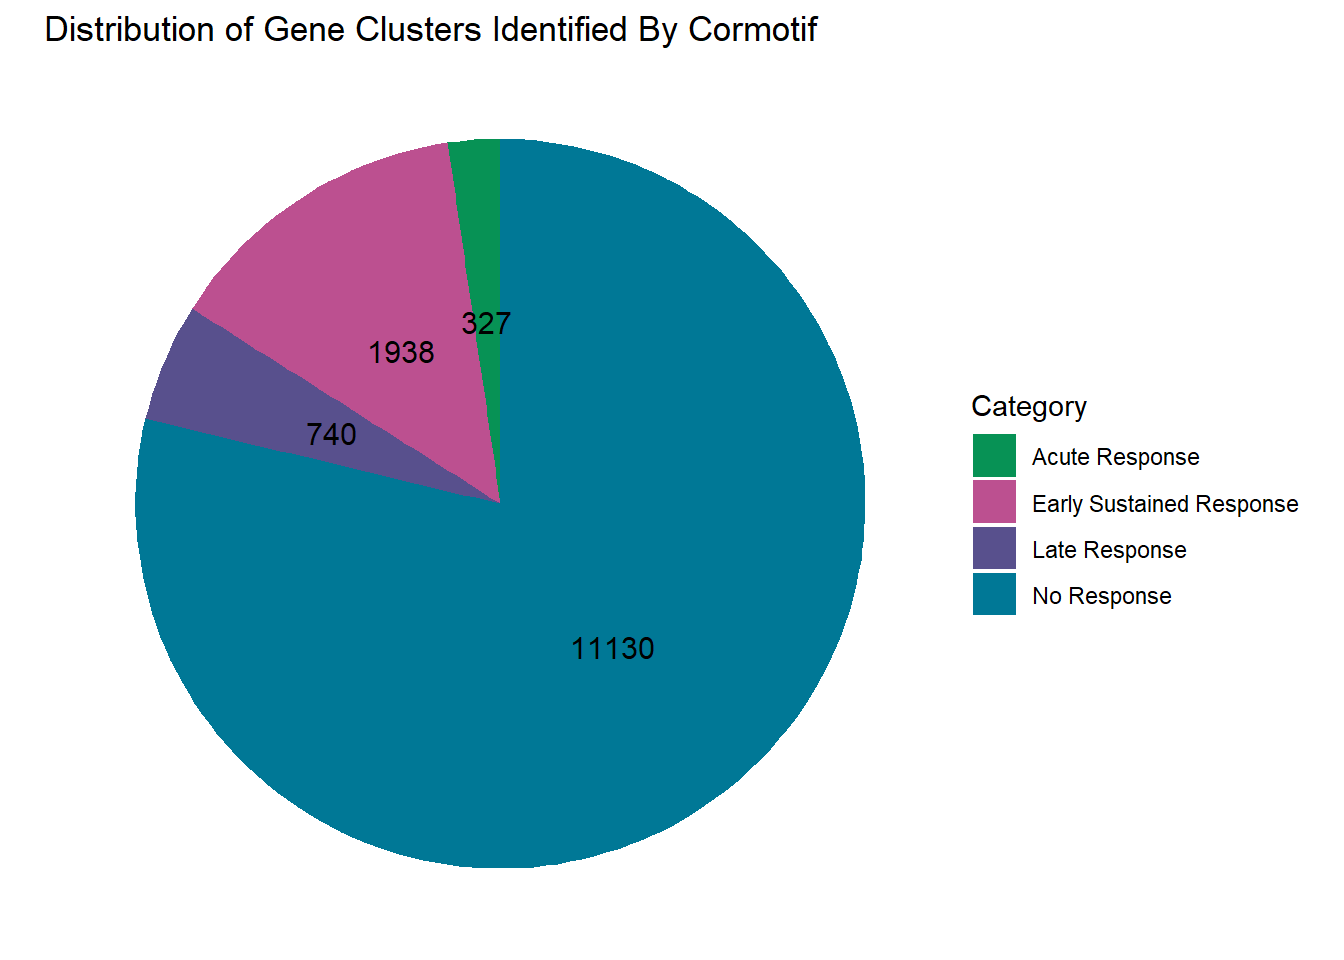
| Version | Author | Date |
|---|---|---|
| ff644ec | emmapfort | 2025-04-18 |
#now let's look at each of these motifs by study with the posterior probability
#changing the cutoffs based on the look of each motif - if it's very dark = > 0.5
#if white < 0.5
#if grey try a less stringent cutoff > 0.1
#ideally each of these are similar to the number of genes in the above plot

#gene_postprob_motif <- initial_cormotif_dox$bestmotif$p.post
#rownames(gene_postprob_motif) <- rownames(Cormotif_df_d)

#saveRDS(gene_postprob_motif, "data/gene_postprob_motif.RDS")


gene_postprob_motif <- readRDS("data/gene_postprob_motif.RDS")

gene_postprob_motif_df <- as.data.frame(gene_postprob_motif)


#motif 1 no response p.prob
prob_motif_1 <- rownames(gene_postprob_motif_df[(gene_postprob_motif_df[,1] < 0.62
                                              & gene_postprob_motif_df[,2] < 0.62
                                              & gene_postprob_motif_df[,3] < 0.62),])
length(prob_motif_1)
[1] 11157#10903 genes post prob
#gene example: 943 - TNFRSF8
TNFRF8_gene <-
#10903 genes post prob - close to value of 11156 on cormotif pattern graph
#gene example: 11009 - IL24
IL24_gene_motif1 <-
#motif 2 acute response
prob_motif_2 <- rownames(gene_postprob_motif_df[(gene_postprob_motif_df[,1] > 0.99
& gene_postprob_motif_df[,2] < 0.5
& gene_postprob_motif_df[,3] < 0.5),])
length(prob_motif_2)[1] 277#2586 genes post prob
#motif 3 late response
prob_motif_3 <- rownames(gene_postprob_motif_df[(gene_postprob_motif_df[,1] > 0.1
& gene_postprob_motif_df[,2] > 0.5
& gene_postprob_motif_df[,3] > 0.5),])
length(prob_motif_3)[1] 451#451 genes post prob
#motif 4 early sustained response
prob_motif_4 <- rownames(gene_postprob_motif_df[(gene_postprob_motif_df[,1] > 0.5
& gene_postprob_motif_df[,2] > 0.1
& gene_postprob_motif_df[,3] < 0.5),])
length(prob_motif_4)[1] 2600#2600 genes post prob
#this totals 16540#Extract the gene IDs from each motif
##motif 1
motif1_genes <- clust1_d_df
##motif 2
motif2_genes <- clust2_d_df
##motif 3
motif3_genes <- clust3_d_df
##motif 4
motif4_genes <- clust4_d_df
#Combine the toptables I have from pairwise analysis into a single dataframe
d24_toptable <- top.table_V.D24_dox %>%
rownames_to_column(var = "entrezgene_ID") %>%
mutate(Drug = "DOX", Time = "24")
d24r_toptable <- top.table_V.D24r_dox %>%
rownames_to_column(var = "entrezgene_ID") %>%
mutate(Drug = "DOX", Time = "24R")
d144r_toptable <- top.table_V.D144r_dox %>%
rownames_to_column(var = "entrezgene_ID") %>%
mutate(Drug = "DOX", Time = "144R")
combined_toptables_dox <- bind_rows(
d24_toptable,
d24r_toptable,
d144r_toptable)
#Filter the data based on each motif
filt_toptable <- combined_toptables_dox %>%
dplyr::filter(entrezgene_ID %in% clust1_d) %>%
mutate(absFC = abs(logFC)) %>%
mutate(time = factor(Time, levels = c("24", "24R", "144R"), labels = c("24hr", "24hr Recovery", "144hr Recovery"))) %>%
ggplot(., aes(x = time, y = logFC))+
geom_boxplot(aes(fill = time))+
scale_fill_manual(values = time_col)+
guides(fill = guide_legend(title = "Time"))+
facet_wrap(~Drug)+
theme_bw()+
xlab(" ")+
ylab("logFC")+
theme_bw()+
ggtitle("LogFC for all genes in Motif 1")+
theme(plot.title = element_text(size = rel(1.5), hjust = 0.5),
axis.title = element_text(size = 15, colour = "black"),
strip.background = element_rect(fill = "#CAD899"),
axis.text.x = element_text(size = 8, colour = "white", angle = 15),
strip.text.x = element_text(size = 12, colour = "black", face = "bold"))
#motif 2
filt_toptable_2 <- combined_toptables_dox %>%
dplyr::filter(entrezgene_ID %in% clust2_d) %>%
mutate(absFC = abs(logFC)) %>%
mutate(time = factor(Time, levels = c("24", "24R", "144R"), labels = c("24hr", "24hr Recovery", "144hr Recovery"))) %>%
ggplot(., aes(x = time, y = logFC))+
geom_boxplot(aes(fill = time))+
scale_fill_manual(values = time_col)+
guides(fill = guide_legend(title = "Time"))+
facet_wrap(~Drug)+
theme_bw()+
xlab(" ")+
ylab("logFC")+
theme_bw()+
ggtitle("LogFC for all genes in Motif 2")+
theme(plot.title = element_text(size = rel(1.5), hjust = 0.5),
axis.title = element_text(size = 15, colour = "black"),
strip.background = element_rect(fill = "#CAD899"),
axis.text.x = element_text(size = 8, colour = "white", angle = 15),
strip.text.x = element_text(size = 12, colour = "black", face = "bold"))
#motif 3
filt_toptable_3 <- combined_toptables_dox %>%
dplyr::filter(entrezgene_ID %in% clust3_d) %>%
mutate(absFC = abs(logFC)) %>%
mutate(time = factor(Time, levels = c("24", "24R", "144R"), labels = c("24hr", "24hr Recovery", "144hr Recovery"))) %>%
ggplot(., aes(x = time, y = logFC))+
geom_boxplot(aes(fill = time))+
scale_fill_manual(values = time_col)+
guides(fill = guide_legend(title = "Time"))+
facet_wrap(~Drug)+
theme_bw()+
xlab(" ")+
ylab("logFC")+
theme_bw()+
ggtitle("LogFC for all genes in Motif 3")+
theme(plot.title = element_text(size = rel(1.5), hjust = 0.5),
axis.title = element_text(size = 15, colour = "black"),
strip.background = element_rect(fill = "#CAD899"),
axis.text.x = element_text(size = 8, colour = "white", angle = 15),
strip.text.x = element_text(size = 12, colour = "black", face = "bold"))
#motif 4
filt_toptable_4 <- combined_toptables_dox %>%
dplyr::filter(entrezgene_ID %in% clust4_d) %>%
mutate(absFC = abs(logFC)) %>%
mutate(time = factor(Time, levels = c("24", "24R", "144R"), labels = c("24hr", "24hr Recovery", "144hr Recovery"))) %>%
ggplot(., aes(x = time, y = logFC))+
geom_boxplot(aes(fill = time))+
scale_fill_manual(values = time_col)+
guides(fill = guide_legend(title = "Time"))+
facet_wrap(~Drug)+
theme_bw()+
xlab(" ")+
ylab("logFC")+
theme_bw()+
ggtitle("LogFC for all genes in Motif 4")+
theme(plot.title = element_text(size = rel(1.5), hjust = 0.5),
axis.title = element_text(size = 15, colour = "black"),
strip.background = element_rect(fill = "#CAD899"),
axis.text.x = element_text(size = 8, colour = "white", angle = 15),
strip.text.x = element_text(size = 12, colour = "black", face = "bold"))
#plots
filt_toptable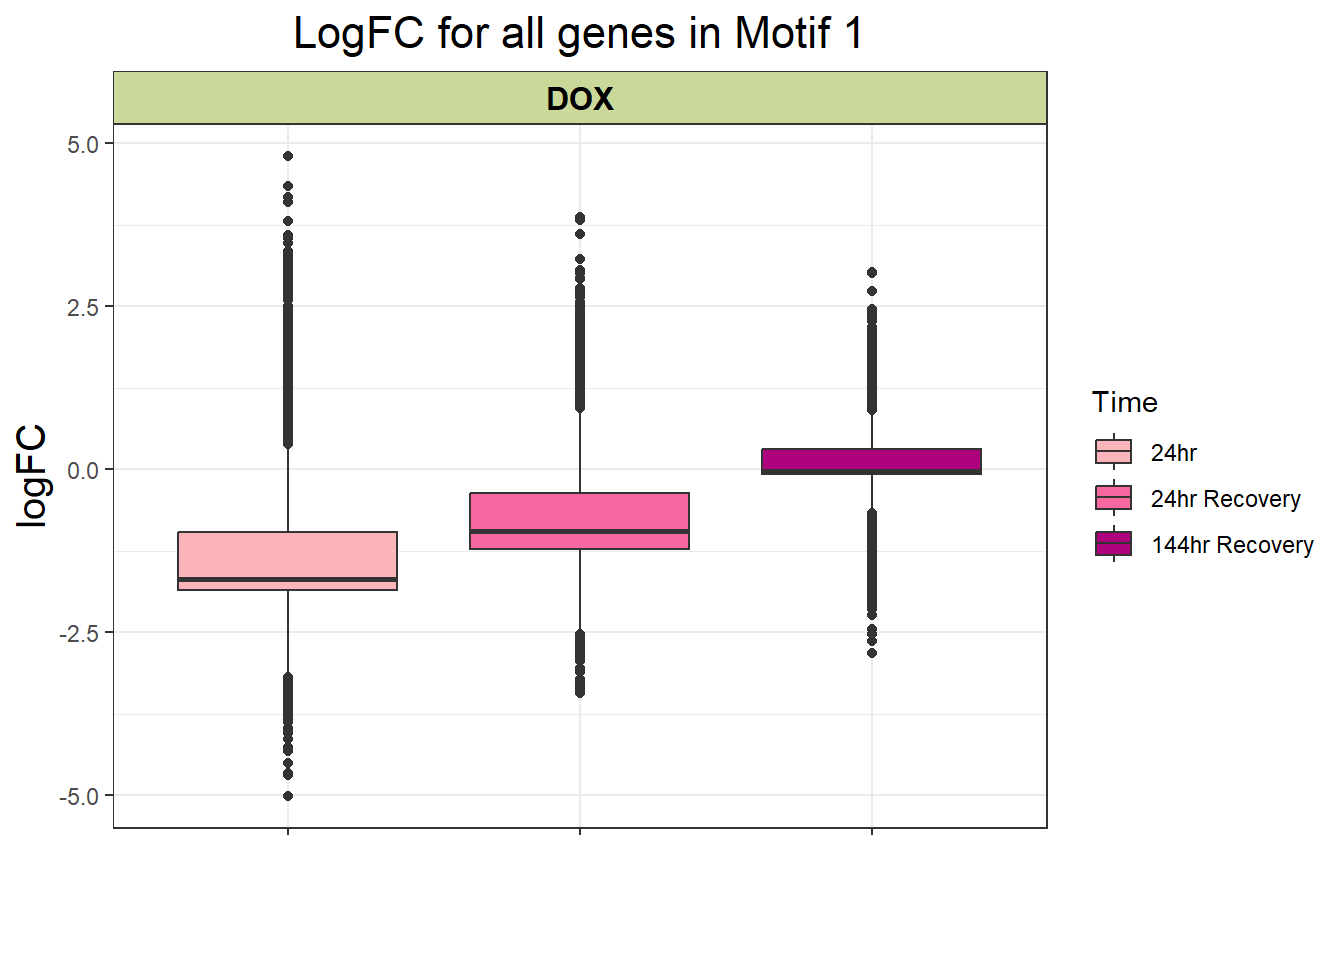
#filt_toptable_2
filt_toptable_3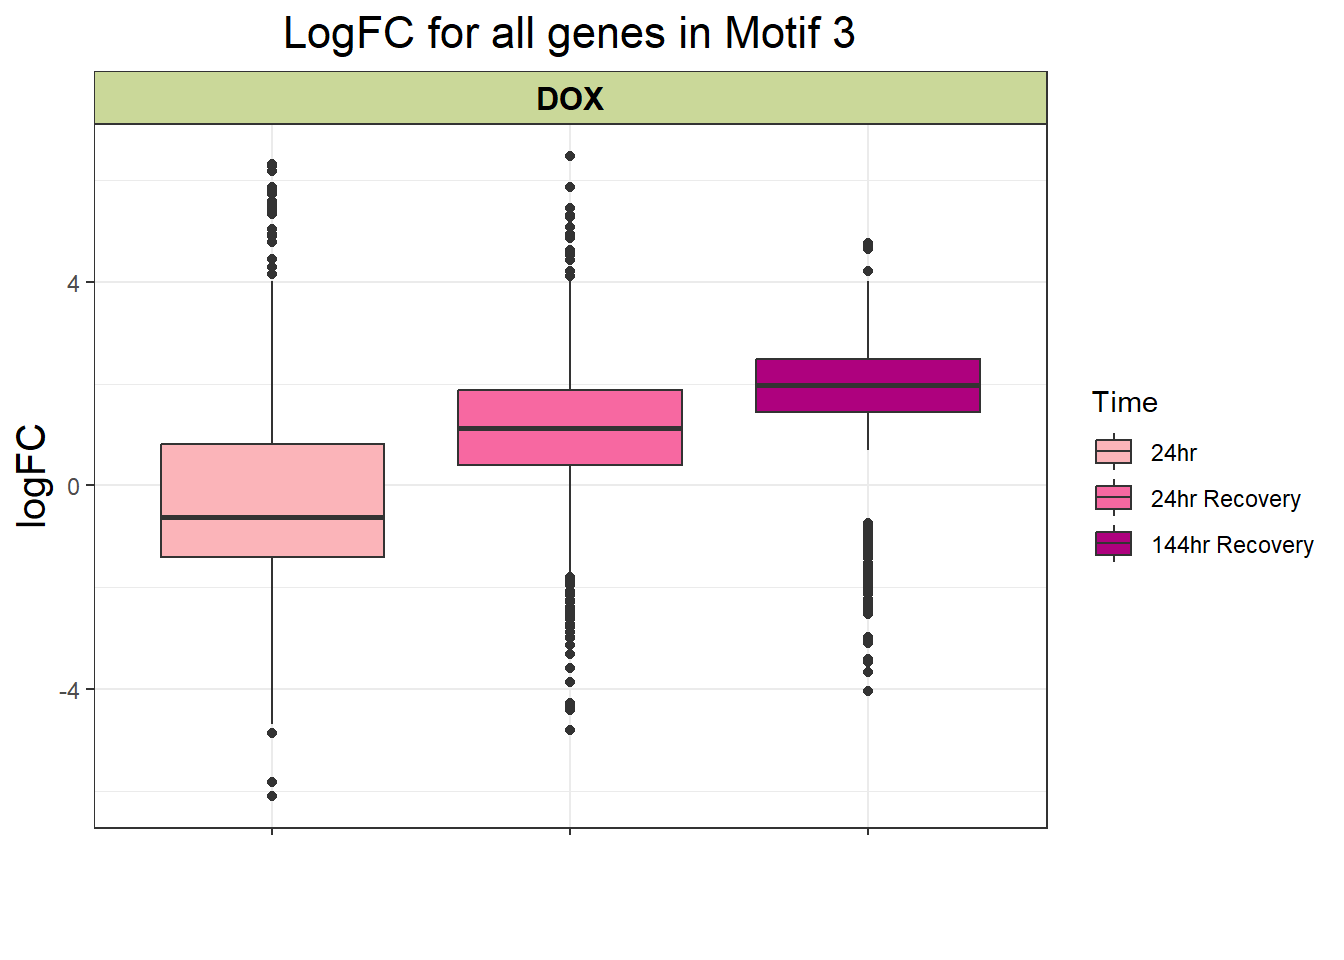
filt_toptable_4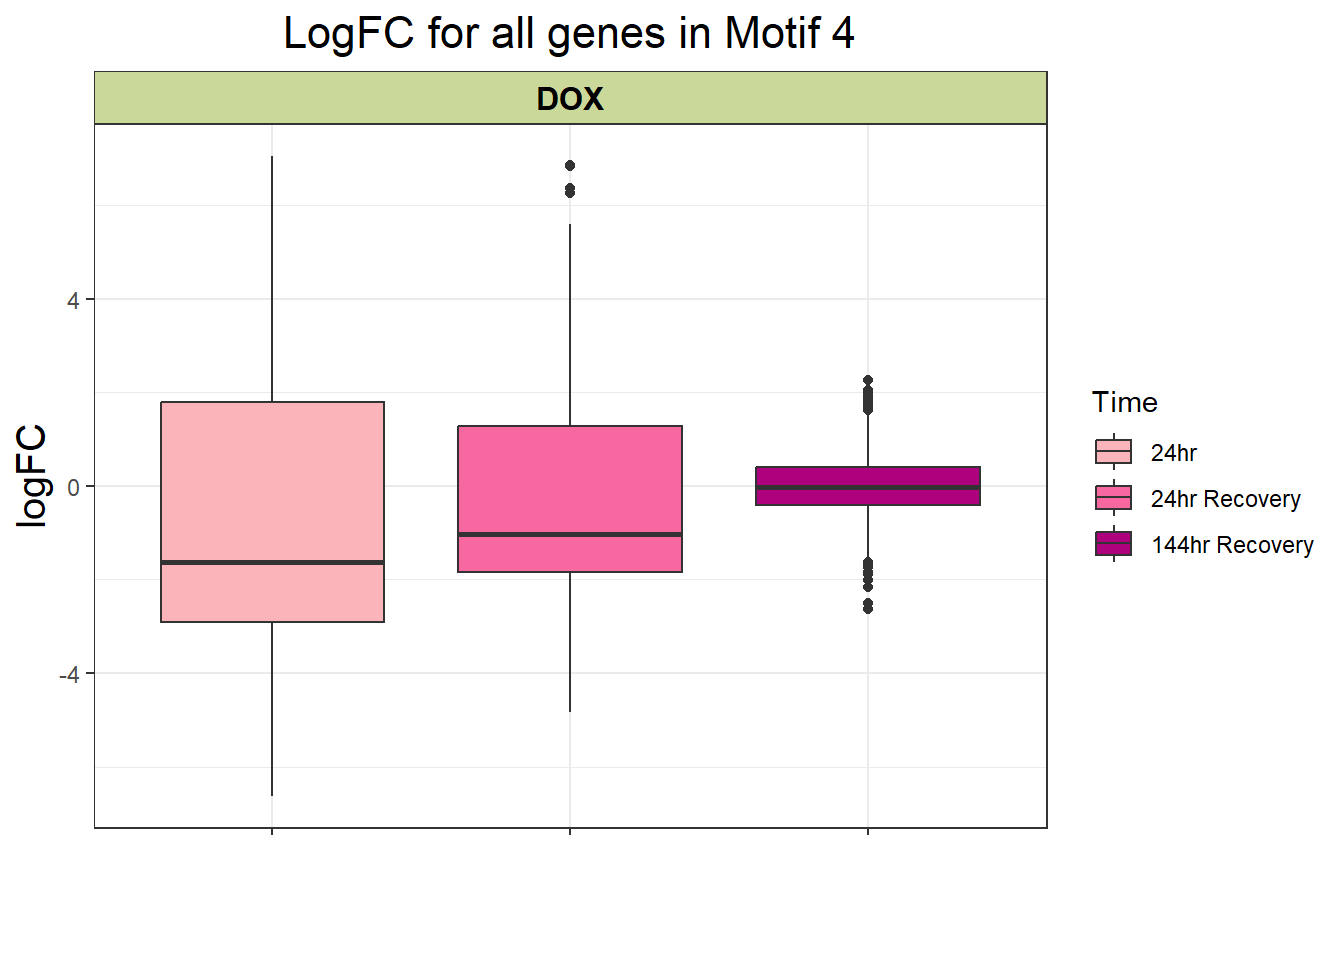
#now plot the abs logFC for each of these too
filt_toptable_abs <- combined_toptables_dox %>%
  dplyr::filter(entrezgene_ID  %in% clust1_d) %>%
  mutate(absFC = abs(logFC)) %>%
  mutate(time = factor(Time, levels = c("24", "24R", "144R"), labels = c("24hr", "24hr Recovery", "144hr Recovery"))) %>%
  ggplot(., aes(x = time, y = absFC))+
  geom_boxplot(aes(fill = time))+
  scale_fill_manual(values = time_col)+
  guides(fill = guide_legend(title = "Time"))+
  facet_wrap(~Drug)+
  theme_bw()+
  xlab(" ")+
  ylab("|logFC|")+
  theme_bw()+
  ggtitle("Abs LogFC for all genes in Motif 1")+
  theme(plot.title = element_text(size = rel(1.5), hjust = 0.5),
        axis.title = element_text(size = 15, colour = "black"),
        strip.background = element_rect(fill = "#CAD899"),
        axis.text.x = element_text(size = 8, colour = "white", angle = 15),
        strip.text.x = element_text(size = 12, colour = "black", face = "bold"))

#motif 2
filt_toptable_2_abs <- combined_toptables_dox %>%
  dplyr::filter(entrezgene_ID  %in% clust2_d) %>%
  mutate(absFC = abs(logFC)) %>%
  mutate(time = factor(Time, levels = c("24", "24R", "144R"), labels = c("24hr", "24hr Recovery", "144hr Recovery"))) %>%
  ggplot(., aes(x = time, y = absFC))+
  geom_boxplot(aes(fill = time))+
  scale_fill_manual(values = time_col)+
  guides(fill = guide_legend(title = "Time"))+
  facet_wrap(~Drug)+
  theme_bw()+
  xlab(" ")+
  ylab("|logFC|")+
  theme_bw()+
  ggtitle("Abs LogFC for all genes in Motif 2")+
  theme(plot.title = element_text(size = rel(1.5), hjust = 0.5),
        axis.title = element_text(size = 15, colour = "black"),
        strip.background = element_rect(fill = "#CAD899"),
        axis.text.x = element_text(size = 8, colour = "white", angle = 15),
        strip.text.x = element_text(size = 12, colour = "black", face = "bold"))


#motif 3
filt_toptable_3_abs <- combined_toptables_dox %>%
  dplyr::filter(entrezgene_ID  %in% clust3_d) %>%
  mutate(absFC = abs(logFC)) %>%
  mutate(time = factor(Time, levels = c("24", "24R", "144R"), labels = c("24hr", "24hr Recovery", "144hr Recovery"))) %>%
  ggplot(., aes(x = time, y = absFC))+
  geom_boxplot(aes(fill = time))+
  scale_fill_manual(values = time_col)+
  guides(fill = guide_legend(title = "Time"))+
  facet_wrap(~Drug)+
  theme_bw()+
  xlab(" ")+
  ylab("|logFC|")+
  theme_bw()+
  ggtitle("Abs LogFC for all genes in Motif 3")+
  theme(plot.title = element_text(size = rel(1.5), hjust = 0.5),
        axis.title = element_text(size = 15, colour = "black"),
        strip.background = element_rect(fill = "#CAD899"),
        axis.text.x = element_text(size = 8, colour = "white", angle = 15),
        strip.text.x = element_text(size = 12, colour = "black", face = "bold"))


#motif 4
filt_toptable_4_abs <- combined_toptables_dox %>%
  dplyr::filter(entrezgene_ID  %in% clust4_d) %>%
  mutate(absFC = abs(logFC)) %>%
  mutate(time = factor(Time, levels = c("24", "24R", "144R"), labels = c("24hr", "24hr Recovery", "144hr Recovery"))) %>%
  ggplot(., aes(x = time, y = absFC))+
  geom_boxplot(aes(fill = time))+
  scale_fill_manual(values = time_col)+
  guides(fill = guide_legend(title = "Time"))+
  facet_wrap(~Drug)+
  theme_bw()+
  xlab(" ")+
  ylab("|logFC|")+
  theme_bw()+
  ggtitle("Abs LogFC for all genes in Motif 4")+
  theme(plot.title = element_text(size = rel(1.5), hjust = 0.5),
        axis.title = element_text(size = 15, colour = "black"),
        strip.background = element_rect(fill = "#CAD899"),
        axis.text.x = element_text(size = 8, colour = "white", angle = 15),
        strip.text.x = element_text(size = 12, colour = "black", face = "bold"))


#plots
filt_toptable_abs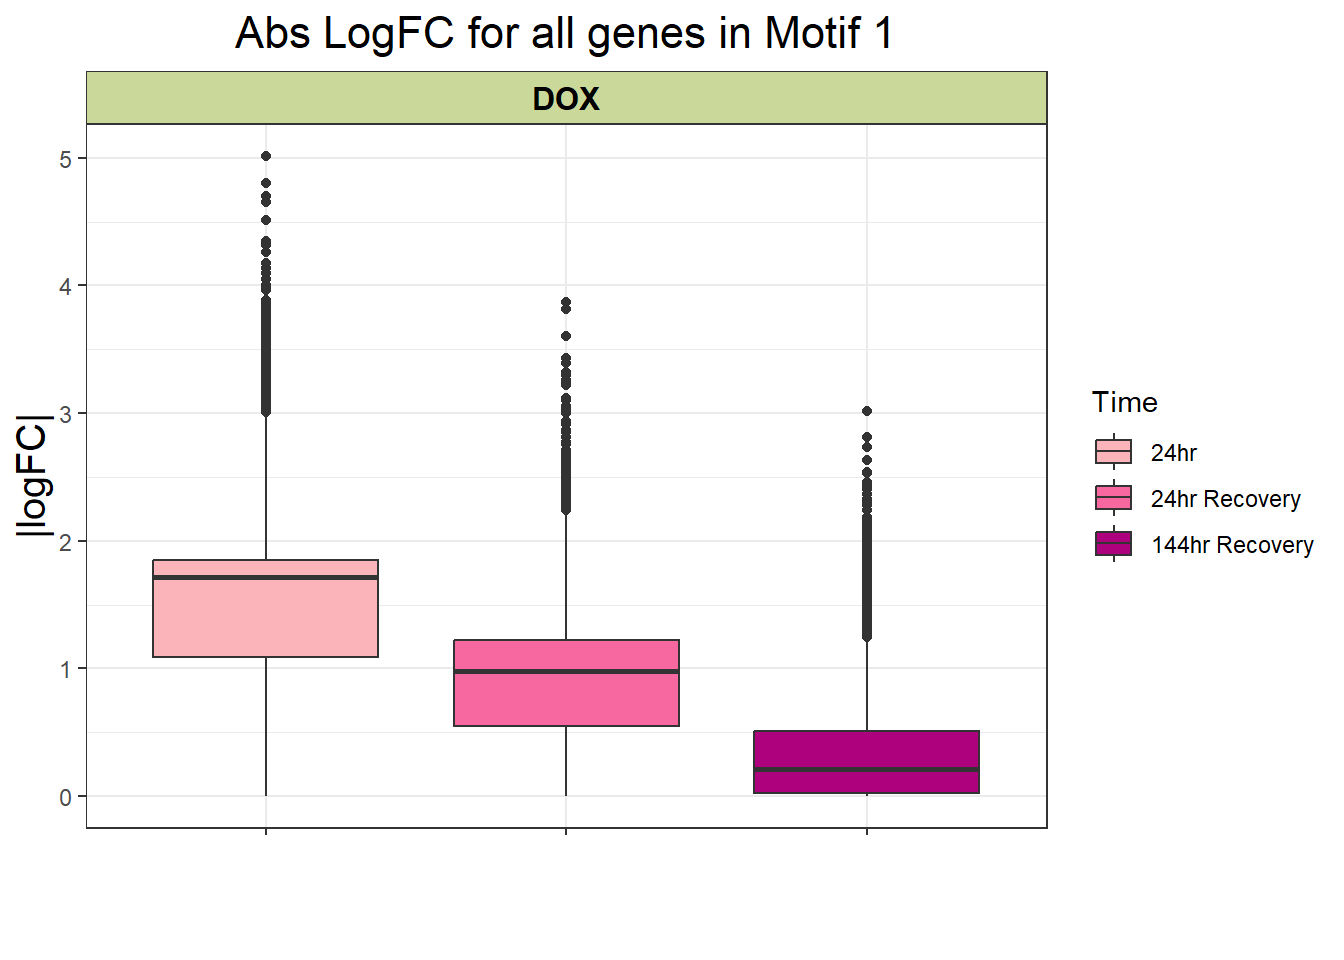
#filt_toptable_2_abs
filt_toptable_3_abs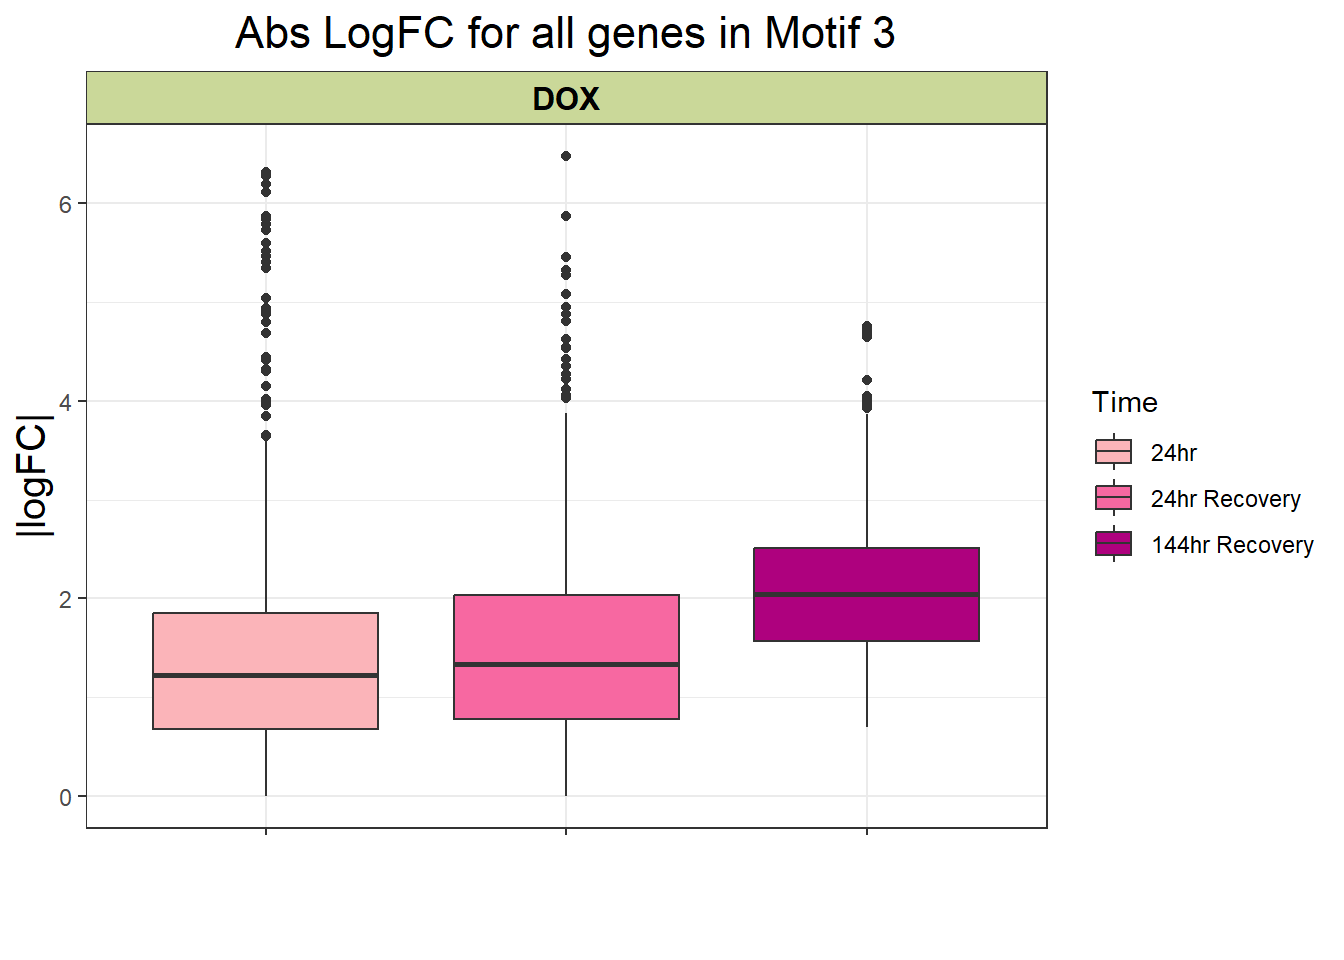
filt_toptable_4_abs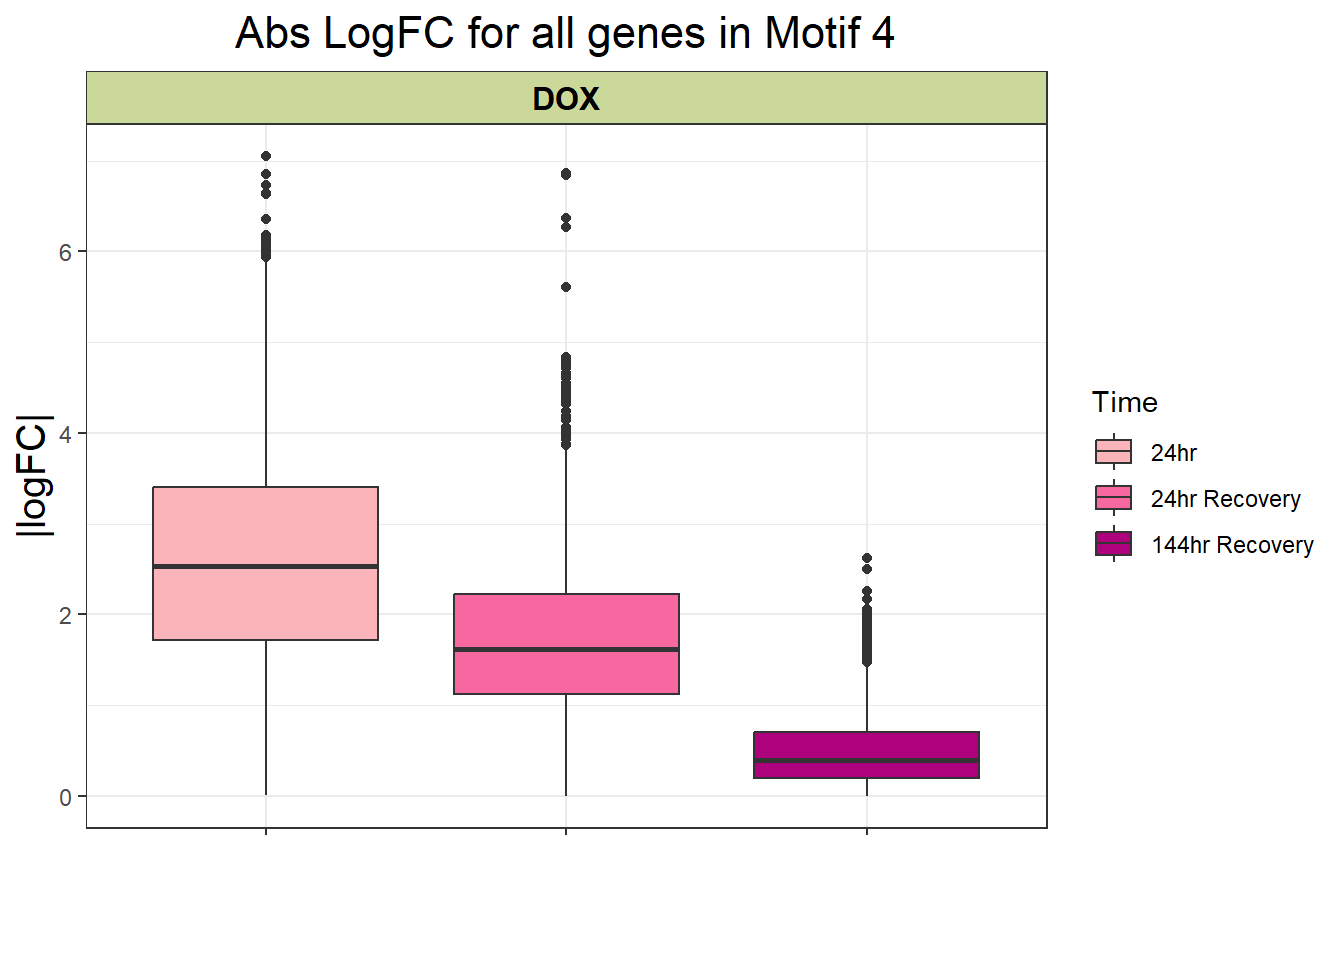
clusterdata_postprob <- data.frame(
  Category = c("No Response", "Acute Response", "Late Response", "Early Sustained Response"),
  Value = c(10903, 2586, 451, 2600)
)

piecolors_2 <- c("No Response" = "#007896",
               "Acute Response" = "#58508D",
               "Late Response" = "#ABCC59",
               "Early Sustained Response" = "#BC5090")

#make a piechart of these distributions
clusterdata_postprob %>% ggplot(aes(x = "", y = Value, fill = Category))+
  geom_bar(width = 1, stat = "identity")+
  coord_polar("y", start = 0)+
  geom_text(aes(label = Value),
            position = position_stack(vjust = 0.5),
            size = 4, color = "black")+
  labs(title = "Distribution of Gene Clusters Identified By Cormotif", x = NULL, y = NULL)+
  theme_void()+
  scale_fill_manual(values = piecolors_2)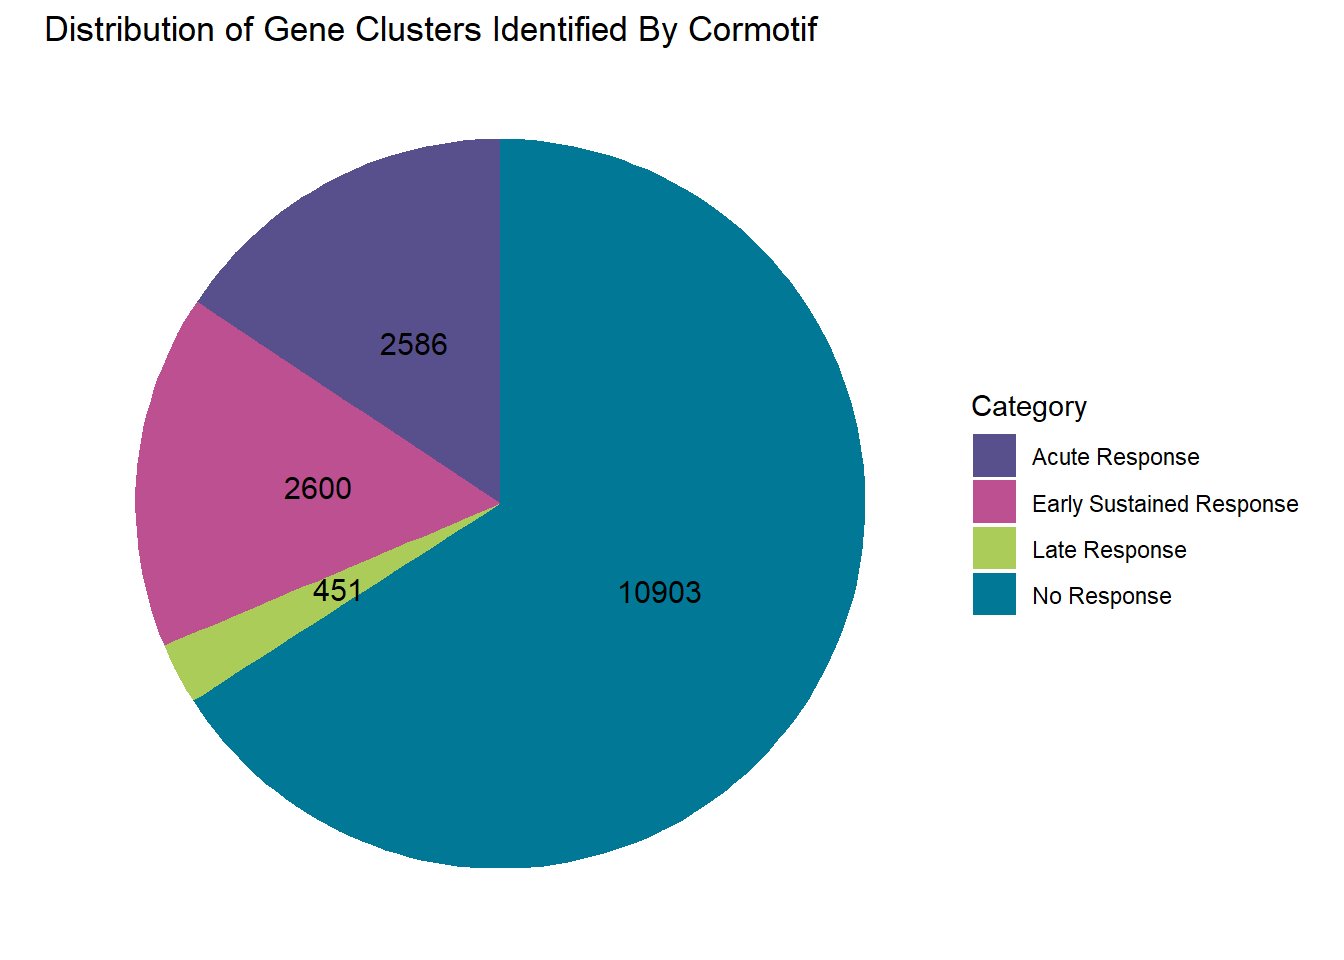
Now we will use Gene Ontology analysis to discover biological relevance to the genes that are assigned to this cluster This set is for the No Response motif (motif 1) with clustlike
motif_NR_d <- clust1_d

NRmotif_genes_d <- gost(query = motif_NR_d,
                      organism = "hsapiens",
                      ordered_query = FALSE,
                      measure_underrepresentation = FALSE,
                      evcodes = FALSE,
                      user_threshold = 0.05,
                      correction_method = c("fdr"),
                      sources = c("GO:BP", "KEGG"))

cormotifNFclust_d <- gostplot(NRmotif_genes_d, capped = FALSE, interactive = TRUE)
cormotifNFclust_d
tableNR_d <- NRmotif_genes_d$result %>%
dplyr::select(c(source, term_id, term_name, intersection_size, term_size, p_value))
tableNR_d %>%
mutate_at(.vars = 6, .funs = scales::label_scientific(digits=4)) %>%
kableExtra::kable(.,) %>%
kableExtra::kable_paper("striped", full_width = FALSE) %>%
kableExtra::kable_styling(full_width = FALSE, position = "left", bootstrap_options = c("striped", "hover")) %>%
kableExtra::scroll_box(width = "100%", height = "400px")| source | term_id | term_name | intersection_size | term_size | p_value |
|---|---|---|---|---|---|
| GO:BP | GO:0050907 | detection of chemical stimulus involved in sensory perception | 394 | 443 | 2.099e-211 |
| GO:BP | GO:0035195 | miRNA-mediated post-transcriptional gene silencing | 477 | 612 | 4.095e-206 |
| GO:BP | GO:0007606 | sensory perception of chemical stimulus | 418 | 497 | 2.501e-204 |
| GO:BP | GO:0050911 | detection of chemical stimulus involved in sensory perception of smell | 362 | 397 | 2.924e-203 |
| GO:BP | GO:0035194 | regulatory ncRNA-mediated post-transcriptional gene silencing | 478 | 624 | 4.629e-201 |
| GO:BP | GO:0016441 | post-transcriptional gene silencing | 479 | 630 | 4.448e-199 |
| GO:BP | GO:0009593 | detection of chemical stimulus | 404 | 480 | 7.960e-198 |
| GO:BP | GO:0050906 | detection of stimulus involved in sensory perception | 419 | 515 | 5.041e-194 |
| GO:BP | GO:0007608 | sensory perception of smell | 369 | 423 | 1.005e-191 |
| GO:BP | GO:0031047 | regulatory ncRNA-mediated gene silencing | 485 | 686 | 1.000e-178 |
| GO:BP | GO:0051606 | detection of stimulus | 460 | 643 | 1.638e-172 |
| GO:BP | GO:0007186 | G protein-coupled receptor signaling pathway | 702 | 1275 | 1.993e-169 |
| GO:BP | GO:0007600 | sensory perception | 561 | 955 | 1.695e-150 |
| GO:BP | GO:0050877 | nervous system process | 654 | 1489 | 1.255e-95 |
| GO:BP | GO:0010608 | post-transcriptional regulation of gene expression | 516 | 1087 | 6.436e-89 |
| GO:BP | GO:0003008 | system process | 814 | 2266 | 2.014e-68 |
| GO:BP | GO:0010629 | negative regulation of gene expression | 637 | 1640 | 1.677e-66 |
| GO:BP | GO:0042221 | response to chemical | 1122 | 3867 | 5.099e-40 |
| GO:BP | GO:0065007 | biological regulation | 2992 | 12671 | 6.636e-36 |
| GO:BP | GO:0042742 | defense response to bacterium | 170 | 326 | 6.062e-34 |
| GO:BP | GO:0006959 | humoral immune response | 142 | 254 | 1.701e-32 |
| GO:BP | GO:0050789 | regulation of biological process | 2896 | 12278 | 1.784e-32 |
| GO:BP | GO:0006952 | defense response | 588 | 1809 | 2.171e-32 |
| GO:BP | GO:0032501 | multicellular organismal process | 1842 | 7234 | 8.240e-32 |
| GO:BP | GO:0050794 | regulation of cellular process | 2800 | 11876 | 1.068e-29 |
| GO:BP | GO:0009617 | response to bacterium | 284 | 721 | 5.585e-29 |
| GO:BP | GO:0010558 | negative regulation of macromolecule biosynthetic process | 808 | 2772 | 1.486e-27 |
| GO:BP | GO:0098542 | defense response to other organism | 418 | 1228 | 8.345e-27 |
| GO:BP | GO:0009890 | negative regulation of biosynthetic process | 816 | 2838 | 8.551e-26 |
| GO:BP | GO:0031424 | keratinization | 62 | 82 | 5.996e-24 |
| GO:BP | GO:0019730 | antimicrobial humoral response | 83 | 131 | 9.733e-24 |
| GO:BP | GO:0043207 | response to external biotic stimulus | 491 | 1558 | 3.572e-23 |
| GO:BP | GO:0051707 | response to other organism | 489 | 1555 | 7.492e-23 |
| GO:BP | GO:0009607 | response to biotic stimulus | 498 | 1593 | 1.062e-22 |
| GO:BP | GO:0140546 | defense response to symbiont | 376 | 1125 | 2.767e-22 |
| GO:BP | GO:0009605 | response to external stimulus | 672 | 2367 | 4.718e-19 |
| GO:BP | GO:0007165 | signal transduction | 1490 | 5979 | 9.766e-19 |
| GO:BP | GO:0001906 | cell killing | 107 | 219 | 2.841e-18 |
| GO:BP | GO:0141060 | disruption of anatomical structure in another organism | 62 | 98 | 1.639e-17 |
| GO:BP | GO:0006954 | inflammatory response | 286 | 847 | 2.720e-17 |
| GO:BP | GO:0061844 | antimicrobial humoral immune response mediated by antimicrobial peptide | 55 | 83 | 7.921e-17 |
| GO:BP | GO:0044419 | biological process involved in interspecies interaction between organisms | 506 | 1724 | 8.800e-17 |
| GO:BP | GO:0006955 | immune response | 574 | 2008 | 1.288e-16 |
| GO:BP | GO:0031640 | killing of cells of another organism | 58 | 91 | 1.309e-16 |
| GO:BP | GO:0141061 | disruption of cell in another organism | 58 | 91 | 1.309e-16 |
| GO:BP | GO:0010605 | negative regulation of macromolecule metabolic process | 852 | 3197 | 1.946e-16 |
| GO:BP | GO:0045087 | innate immune response | 317 | 977 | 1.946e-16 |
| GO:BP | GO:0007154 | cell communication | 1578 | 6496 | 2.330e-15 |
| GO:BP | GO:0023052 | signaling | 1571 | 6471 | 3.737e-15 |
| GO:BP | GO:0045109 | intermediate filament organization | 48 | 73 | 1.917e-14 |
| GO:BP | GO:0050830 | defense response to Gram-positive bacterium | 66 | 120 | 2.533e-14 |
| GO:BP | GO:0009892 | negative regulation of metabolic process | 887 | 3418 | 6.520e-14 |
| GO:BP | GO:0002252 | immune effector process | 236 | 703 | 7.908e-14 |
| GO:BP | GO:0050896 | response to stimulus | 2093 | 8993 | 2.383e-13 |
| GO:BP | GO:0050909 | sensory perception of taste | 44 | 67 | 3.535e-13 |
| GO:BP | GO:0030216 | keratinocyte differentiation | 83 | 176 | 5.400e-13 |
| GO:BP | GO:0097530 | granulocyte migration | 76 | 156 | 8.440e-13 |
| GO:BP | GO:0050829 | defense response to Gram-negative bacterium | 53 | 91 | 8.440e-13 |
| GO:BP | GO:0002697 | regulation of immune effector process | 144 | 381 | 1.380e-12 |
| GO:BP | GO:1990266 | neutrophil migration | 66 | 129 | 2.468e-12 |
| GO:BP | GO:0030593 | neutrophil chemotaxis | 57 | 106 | 9.133e-12 |
| GO:BP | GO:0007586 | digestion | 67 | 136 | 1.612e-11 |
| GO:BP | GO:0050913 | sensory perception of bitter taste | 31 | 42 | 3.164e-11 |
| GO:BP | GO:0071621 | granulocyte chemotaxis | 64 | 129 | 3.650e-11 |
| GO:BP | GO:0050912 | detection of chemical stimulus involved in sensory perception of taste | 31 | 43 | 8.803e-11 |
| GO:BP | GO:0009913 | epidermal cell differentiation | 101 | 250 | 1.169e-10 |
| GO:BP | GO:0002237 | response to molecule of bacterial origin | 131 | 355 | 1.496e-10 |
| GO:BP | GO:0001580 | detection of chemical stimulus involved in sensory perception of bitter taste | 28 | 37 | 1.530e-10 |
| GO:BP | GO:0002323 | natural killer cell activation involved in immune response | 27 | 35 | 1.731e-10 |
| GO:BP | GO:0030595 | leukocyte chemotaxis | 96 | 237 | 3.354e-10 |
| GO:BP | GO:0002376 | immune system process | 720 | 2796 | 3.674e-10 |
| GO:BP | GO:0050900 | leukocyte migration | 140 | 396 | 9.295e-10 |
| GO:BP | GO:0019731 | antibacterial humoral response | 40 | 68 | 9.295e-10 |
| GO:BP | GO:0032496 | response to lipopolysaccharide | 123 | 337 | 1.549e-09 |
| GO:BP | GO:0045104 | intermediate filament cytoskeleton organization | 49 | 94 | 1.915e-09 |
| GO:BP | GO:0097529 | myeloid leukocyte migration | 94 | 237 | 2.134e-09 |
| GO:BP | GO:0071219 | cellular response to molecule of bacterial origin | 90 | 224 | 2.467e-09 |
| GO:BP | GO:0051716 | cellular response to stimulus | 1702 | 7320 | 2.514e-09 |
| GO:BP | GO:0046651 | lymphocyte proliferation | 114 | 308 | 2.958e-09 |
| GO:BP | GO:0045103 | intermediate filament-based process | 49 | 95 | 2.964e-09 |
| GO:BP | GO:0070098 | chemokine-mediated signaling pathway | 47 | 90 | 4.220e-09 |
| GO:BP | GO:0007283 | spermatogenesis | 201 | 637 | 5.143e-09 |
| GO:BP | GO:0019221 | cytokine-mediated signaling pathway | 166 | 503 | 5.685e-09 |
| GO:BP | GO:0070661 | leukocyte proliferation | 125 | 351 | 6.046e-09 |
| GO:BP | GO:0032943 | mononuclear cell proliferation | 115 | 315 | 6.046e-09 |
| GO:BP | GO:0071222 | cellular response to lipopolysaccharide | 86 | 214 | 6.046e-09 |
| GO:BP | GO:0002526 | acute inflammatory response | 53 | 109 | 7.814e-09 |
| GO:BP | GO:0048232 | male gamete generation | 204 | 654 | 1.064e-08 |
| GO:BP | GO:0007218 | neuropeptide signaling pathway | 53 | 110 | 1.179e-08 |
| GO:BP | GO:0002682 | regulation of immune system process | 416 | 1526 | 1.256e-08 |
| GO:BP | GO:0008544 | epidermis development | 135 | 394 | 2.033e-08 |
| GO:BP | GO:0007338 | single fertilization | 71 | 169 | 2.540e-08 |
| GO:BP | GO:0042100 | B cell proliferation | 51 | 106 | 2.685e-08 |
| GO:BP | GO:0060326 | cell chemotaxis | 114 | 319 | 2.989e-08 |
| GO:BP | GO:0052695 | cellular glucuronidation | 18 | 21 | 3.186e-08 |
| GO:BP | GO:0033141 | positive regulation of peptidyl-serine phosphorylation of STAT protein | 18 | 21 | 3.186e-08 |
| GO:BP | GO:0002699 | positive regulation of immune effector process | 95 | 253 | 4.432e-08 |
| GO:BP | GO:0070663 | regulation of leukocyte proliferation | 98 | 265 | 6.144e-08 |
| GO:BP | GO:0002684 | positive regulation of immune system process | 302 | 1066 | 7.008e-08 |
| GO:BP | GO:0045321 | leukocyte activation | 274 | 951 | 7.263e-08 |
| GO:BP | GO:0002548 | monocyte chemotaxis | 37 | 68 | 8.828e-08 |
| GO:BP | GO:0001775 | cell activation | 309 | 1098 | 9.336e-08 |
| GO:BP | GO:0002703 | regulation of leukocyte mediated immunity | 91 | 243 | 1.128e-07 |
| GO:BP | GO:0022414 | reproductive process | 417 | 1556 | 1.138e-07 |
| GO:BP | GO:0009566 | fertilization | 82 | 212 | 1.224e-07 |
| GO:BP | GO:0002922 | positive regulation of humoral immune response | 18 | 22 | 1.277e-07 |
| GO:BP | GO:0002366 | leukocyte activation involved in immune response | 108 | 305 | 1.387e-07 |
| GO:BP | GO:0002263 | cell activation involved in immune response | 109 | 309 | 1.481e-07 |
| GO:BP | GO:0048609 | multicellular organismal reproductive process | 279 | 980 | 1.719e-07 |
| GO:BP | GO:1990868 | response to chemokine | 47 | 99 | 1.942e-07 |
| GO:BP | GO:1990869 | cellular response to chemokine | 47 | 99 | 1.942e-07 |
| GO:BP | GO:0072677 | eosinophil migration | 22 | 31 | 2.001e-07 |
| GO:BP | GO:0050776 | regulation of immune response | 258 | 897 | 2.436e-07 |
| GO:BP | GO:0050832 | defense response to fungus | 33 | 59 | 2.445e-07 |
| GO:BP | GO:0071216 | cellular response to biotic stimulus | 92 | 251 | 2.903e-07 |
| GO:BP | GO:0048245 | eosinophil chemotaxis | 20 | 27 | 3.121e-07 |
| GO:BP | GO:0071715 | icosanoid transport | 35 | 65 | 3.122e-07 |
| GO:BP | GO:0050727 | regulation of inflammatory response | 127 | 381 | 3.701e-07 |
| GO:BP | GO:0032649 | regulation of type II interferon production | 52 | 117 | 4.698e-07 |
| GO:BP | GO:0050670 | regulation of lymphocyte proliferation | 87 | 236 | 5.335e-07 |
| GO:BP | GO:0022600 | digestive system process | 48 | 105 | 5.726e-07 |
| GO:BP | GO:0032944 | regulation of mononuclear cell proliferation | 88 | 240 | 5.813e-07 |
| GO:BP | GO:0060294 | cilium movement involved in cell motility | 67 | 167 | 5.832e-07 |
| GO:BP | GO:0030317 | flagellated sperm motility | 61 | 147 | 5.861e-07 |
| GO:BP | GO:0097722 | sperm motility | 61 | 147 | 5.861e-07 |
| GO:BP | GO:0032609 | type II interferon production | 52 | 118 | 6.345e-07 |
| GO:BP | GO:0031341 | regulation of cell killing | 48 | 106 | 7.977e-07 |
| GO:BP | GO:0002706 | regulation of lymphocyte mediated immunity | 71 | 182 | 8.191e-07 |
| GO:BP | GO:0002443 | leukocyte mediated immunity | 146 | 461 | 1.138e-06 |
| GO:BP | GO:0033139 | regulation of peptidyl-serine phosphorylation of STAT protein | 18 | 24 | 1.242e-06 |
| GO:BP | GO:0006953 | acute-phase response | 28 | 49 | 1.763e-06 |
| GO:BP | GO:0048247 | lymphocyte chemotaxis | 33 | 63 | 1.893e-06 |
| GO:BP | GO:0001539 | cilium or flagellum-dependent cell motility | 67 | 172 | 2.139e-06 |
| GO:BP | GO:0060285 | cilium-dependent cell motility | 67 | 172 | 2.139e-06 |
| GO:BP | GO:0001909 | leukocyte mediated cytotoxicity | 56 | 135 | 2.223e-06 |
| GO:BP | GO:0002274 | myeloid leukocyte activation | 86 | 240 | 2.612e-06 |
| GO:BP | GO:0007188 | adenylate cyclase-modulating G protein-coupled receptor signaling pathway | 88 | 248 | 3.047e-06 |
| GO:BP | GO:0032689 | negative regulation of type II interferon production | 25 | 42 | 3.066e-06 |
| GO:BP | GO:0042501 | serine phosphorylation of STAT protein | 18 | 25 | 3.341e-06 |
| GO:BP | GO:0022412 | cellular process involved in reproduction in multicellular organism | 130 | 408 | 4.288e-06 |
| GO:BP | GO:0007276 | gamete generation | 233 | 822 | 4.345e-06 |
| GO:BP | GO:0050778 | positive regulation of immune response | 211 | 732 | 4.554e-06 |
| GO:BP | GO:0019953 | sexual reproduction | 300 | 1103 | 4.591e-06 |
| GO:BP | GO:0048240 | sperm capacitation | 21 | 33 | 6.936e-06 |
| GO:BP | GO:0001819 | positive regulation of cytokine production | 149 | 486 | 7.167e-06 |
| GO:BP | GO:0006063 | uronic acid metabolic process | 18 | 26 | 8.268e-06 |
| GO:BP | GO:0019585 | glucuronate metabolic process | 18 | 26 | 8.268e-06 |
| GO:BP | GO:0140975 | disruption of cellular anatomical structure in another organism | 10 | 10 | 8.941e-06 |
| GO:BP | GO:0002775 | antimicrobial peptide production | 10 | 10 | 8.941e-06 |
| GO:BP | GO:0007259 | cell surface receptor signaling pathway via JAK-STAT | 64 | 168 | 1.011e-05 |
| GO:BP | GO:0043588 | skin development | 106 | 322 | 1.071e-05 |
| GO:BP | GO:0001817 | regulation of cytokine production | 217 | 765 | 1.076e-05 |
| GO:BP | GO:0009620 | response to fungus | 34 | 70 | 1.121e-05 |
| GO:BP | GO:0050953 | sensory perception of light stimulus | 79 | 222 | 1.129e-05 |
| GO:BP | GO:0030101 | natural killer cell activation | 42 | 95 | 1.209e-05 |
| GO:BP | GO:0097696 | cell surface receptor signaling pathway via STAT | 66 | 176 | 1.246e-05 |
| GO:BP | GO:0007601 | visual perception | 78 | 219 | 1.267e-05 |
| GO:BP | GO:0051873 | killing by host of symbiont cells | 19 | 29 | 1.312e-05 |
| GO:BP | GO:0042129 | regulation of T cell proliferation | 67 | 180 | 1.371e-05 |
| GO:BP | GO:0001816 | cytokine production | 218 | 772 | 1.391e-05 |
| GO:BP | GO:0006690 | icosanoid metabolic process | 50 | 122 | 1.557e-05 |
| GO:BP | GO:0002920 | regulation of humoral immune response | 25 | 45 | 1.684e-05 |
| GO:BP | GO:0007631 | feeding behavior | 45 | 106 | 1.805e-05 |
| GO:BP | GO:0007286 | spermatid development | 76 | 214 | 1.968e-05 |
| GO:BP | GO:0042531 | positive regulation of tyrosine phosphorylation of STAT protein | 31 | 63 | 2.471e-05 |
| GO:BP | GO:0019755 | one-carbon compound transport | 17 | 25 | 2.471e-05 |
| GO:BP | GO:0002251 | organ or tissue specific immune response | 24 | 43 | 2.511e-05 |
| GO:BP | GO:0042330 | taxis | 141 | 465 | 2.686e-05 |
| GO:BP | GO:0072676 | lymphocyte migration | 50 | 124 | 2.686e-05 |
| GO:BP | GO:0007342 | fusion of sperm to egg plasma membrane involved in single fertilization | 19 | 30 | 2.686e-05 |
| GO:BP | GO:0001910 | regulation of leukocyte mediated cytotoxicity | 40 | 92 | 3.619e-05 |
| GO:BP | GO:0010468 | regulation of gene expression | 1268 | 5515 | 3.899e-05 |
| GO:BP | GO:0002285 | lymphocyte activation involved in immune response | 75 | 214 | 4.009e-05 |
| GO:BP | GO:0048515 | spermatid differentiation | 77 | 222 | 4.556e-05 |
| GO:BP | GO:0036230 | granulocyte activation | 26 | 50 | 5.085e-05 |
| GO:BP | GO:0050865 | regulation of cell activation | 177 | 616 | 5.147e-05 |
| GO:BP | GO:0015718 | monocarboxylic acid transport | 65 | 179 | 5.147e-05 |
| GO:BP | GO:0002385 | mucosal immune response | 22 | 39 | 5.559e-05 |
| GO:BP | GO:0006935 | chemotaxis | 139 | 463 | 5.666e-05 |
| GO:BP | GO:0007204 | positive regulation of cytosolic calcium ion concentration | 62 | 169 | 5.956e-05 |
| GO:BP | GO:0042119 | neutrophil activation | 23 | 42 | 6.327e-05 |
| GO:BP | GO:0015670 | carbon dioxide transport | 12 | 15 | 7.547e-05 |
| GO:BP | GO:0070665 | positive regulation of leukocyte proliferation | 60 | 163 | 7.610e-05 |
| GO:BP | GO:0015732 | prostaglandin transport | 18 | 29 | 7.651e-05 |
| GO:BP | GO:0002286 | T cell activation involved in immune response | 49 | 125 | 8.455e-05 |
| GO:BP | GO:0002694 | regulation of leukocyte activation | 162 | 561 | 1.007e-04 |
| GO:BP | GO:0009584 | detection of visible light | 19 | 32 | 1.007e-04 |
| GO:BP | GO:0042102 | positive regulation of T cell proliferation | 42 | 102 | 1.008e-04 |
| GO:BP | GO:0002705 | positive regulation of leukocyte mediated immunity | 55 | 147 | 1.102e-04 |
| GO:BP | GO:0050729 | positive regulation of inflammatory response | 55 | 147 | 1.102e-04 |
| GO:BP | GO:0046649 | lymphocyte activation | 216 | 787 | 1.227e-04 |
| GO:BP | GO:0002698 | negative regulation of immune effector process | 47 | 120 | 1.352e-04 |
| GO:BP | GO:0032612 | interleukin-1 production | 44 | 110 | 1.426e-04 |
| GO:BP | GO:0032652 | regulation of interleukin-1 production | 44 | 110 | 1.426e-04 |
| GO:BP | GO:0042509 | regulation of tyrosine phosphorylation of STAT protein | 33 | 74 | 1.494e-04 |
| GO:BP | GO:0002784 | regulation of antimicrobial peptide production | 8 | 8 | 1.574e-04 |
| GO:BP | GO:0002760 | positive regulation of antimicrobial humoral response | 8 | 8 | 1.574e-04 |
| GO:BP | GO:0002778 | antibacterial peptide production | 8 | 8 | 1.574e-04 |
| GO:BP | GO:0009583 | detection of light stimulus | 31 | 68 | 1.638e-04 |
| GO:BP | GO:0051249 | regulation of lymphocyte activation | 145 | 497 | 1.739e-04 |
| GO:BP | GO:0002673 | regulation of acute inflammatory response | 24 | 47 | 1.755e-04 |
| GO:BP | GO:0032653 | regulation of interleukin-10 production | 28 | 59 | 1.790e-04 |
| GO:BP | GO:0032613 | interleukin-10 production | 28 | 59 | 1.790e-04 |
| GO:BP | GO:0015908 | fatty acid transport | 46 | 118 | 1.873e-04 |
| GO:BP | GO:0003006 | developmental process involved in reproduction | 270 | 1022 | 1.873e-04 |
| GO:BP | GO:0098586 | cellular response to virus | 34 | 78 | 1.884e-04 |
| GO:BP | GO:0071346 | cellular response to type II interferon | 48 | 125 | 1.893e-04 |
| GO:BP | GO:0003341 | cilium movement | 72 | 212 | 2.016e-04 |
| GO:BP | GO:0050671 | positive regulation of lymphocyte proliferation | 53 | 143 | 2.099e-04 |
| GO:BP | GO:0071674 | mononuclear cell migration | 78 | 235 | 2.183e-04 |
| GO:BP | GO:0034341 | response to type II interferon | 54 | 147 | 2.310e-04 |
| GO:BP | GO:0030855 | epithelial cell differentiation | 203 | 741 | 2.510e-04 |
| GO:BP | GO:0042110 | T cell activation | 159 | 558 | 2.519e-04 |
| GO:BP | GO:0060295 | regulation of cilium movement involved in cell motility | 18 | 31 | 2.536e-04 |
| GO:BP | GO:1902019 | regulation of cilium-dependent cell motility | 18 | 31 | 2.536e-04 |
| GO:BP | GO:0007159 | leukocyte cell-cell adhesion | 121 | 404 | 2.574e-04 |
| GO:BP | GO:0032309 | icosanoid secretion | 24 | 48 | 2.602e-04 |
| GO:BP | GO:0007602 | phototransduction | 24 | 48 | 2.602e-04 |
| GO:BP | GO:0042363 | fat-soluble vitamin catabolic process | 10 | 12 | 2.649e-04 |
| GO:BP | GO:0007260 | tyrosine phosphorylation of STAT protein | 33 | 76 | 2.691e-04 |
| GO:BP | GO:0051250 | negative regulation of lymphocyte activation | 57 | 159 | 2.915e-04 |
| GO:BP | GO:0045026 | plasma membrane fusion | 19 | 34 | 2.933e-04 |
| GO:BP | GO:0002822 | regulation of adaptive immune response based on somatic recombination of immune receptors built from immunoglobulin superfamily domains | 65 | 189 | 3.360e-04 |
| GO:BP | GO:0002819 | regulation of adaptive immune response | 69 | 204 | 3.426e-04 |
| GO:BP | GO:0031347 | regulation of defense response | 212 | 783 | 3.438e-04 |
| GO:BP | GO:0032946 | positive regulation of mononuclear cell proliferation | 53 | 146 | 3.899e-04 |
| GO:BP | GO:0006805 | xenobiotic metabolic process | 47 | 125 | 4.184e-04 |
| GO:BP | GO:0006691 | leukotriene metabolic process | 18 | 32 | 4.408e-04 |
| GO:BP | GO:0032945 | negative regulation of mononuclear cell proliferation | 36 | 88 | 5.148e-04 |
| GO:BP | GO:1903037 | regulation of leukocyte cell-cell adhesion | 110 | 366 | 5.277e-04 |
| GO:BP | GO:0007281 | germ cell development | 111 | 370 | 5.277e-04 |
| GO:BP | GO:0002709 | regulation of T cell mediated immunity | 38 | 95 | 5.492e-04 |
| GO:BP | GO:0032722 | positive regulation of chemokine production | 31 | 72 | 5.902e-04 |
| GO:BP | GO:0002685 | regulation of leukocyte migration | 75 | 230 | 5.911e-04 |
| GO:BP | GO:0050863 | regulation of T cell activation | 112 | 375 | 5.911e-04 |
| GO:BP | GO:0007200 | phospholipase C-activating G protein-coupled receptor signaling pathway | 44 | 116 | 5.911e-04 |
| GO:BP | GO:1901317 | regulation of flagellated sperm motility | 14 | 22 | 5.951e-04 |
| GO:BP | GO:0010556 | regulation of macromolecule biosynthetic process | 1276 | 5633 | 6.069e-04 |
| GO:BP | GO:0002695 | negative regulation of leukocyte activation | 63 | 185 | 6.100e-04 |
| GO:BP | GO:0002225 | positive regulation of antimicrobial peptide production | 7 | 7 | 6.253e-04 |
| GO:BP | GO:0052697 | xenobiotic glucuronidation | 7 | 7 | 6.253e-04 |
| GO:BP | GO:0002704 | negative regulation of leukocyte mediated immunity | 29 | 66 | 6.637e-04 |
| GO:BP | GO:0032101 | regulation of response to external stimulus | 277 | 1071 | 6.802e-04 |
| GO:BP | GO:0032602 | chemokine production | 38 | 96 | 6.874e-04 |
| GO:BP | GO:0032642 | regulation of chemokine production | 38 | 96 | 6.874e-04 |
| GO:BP | GO:0070664 | negative regulation of leukocyte proliferation | 38 | 96 | 6.874e-04 |
| GO:BP | GO:0032757 | positive regulation of interleukin-8 production | 28 | 63 | 6.970e-04 |
| GO:BP | GO:0009581 | detection of external stimulus | 51 | 142 | 7.251e-04 |
| GO:BP | GO:0002449 | lymphocyte mediated immunity | 108 | 361 | 7.251e-04 |
| GO:BP | GO:0002687 | positive regulation of leukocyte migration | 54 | 153 | 7.362e-04 |
| GO:BP | GO:0042113 | B cell activation | 88 | 282 | 7.362e-04 |
| GO:BP | GO:0032677 | regulation of interleukin-8 production | 34 | 83 | 7.764e-04 |
| GO:BP | GO:0032637 | interleukin-8 production | 34 | 83 | 7.764e-04 |
| GO:BP | GO:0042098 | T cell proliferation | 70 | 213 | 7.789e-04 |
| GO:BP | GO:0002444 | myeloid leukocyte mediated immunity | 43 | 114 | 7.950e-04 |
| GO:BP | GO:0002544 | chronic inflammatory response | 13 | 20 | 8.066e-04 |
| GO:BP | GO:0050868 | negative regulation of T cell activation | 46 | 125 | 8.673e-04 |
| GO:BP | GO:0070374 | positive regulation of ERK1 and ERK2 cascade | 69 | 210 | 8.811e-04 |
| GO:BP | GO:0002759 | regulation of antimicrobial humoral response | 9 | 11 | 9.070e-04 |
| GO:BP | GO:1903038 | negative regulation of leukocyte cell-cell adhesion | 49 | 136 | 9.078e-04 |
| GO:BP | GO:0050672 | negative regulation of lymphocyte proliferation | 35 | 87 | 9.094e-04 |
| GO:BP | GO:0002227 | innate immune response in mucosa | 16 | 28 | 9.123e-04 |
| GO:BP | GO:0032103 | positive regulation of response to external stimulus | 170 | 619 | 9.807e-04 |
| GO:BP | GO:0015669 | gas transport | 14 | 23 | 1.100e-03 |
| GO:BP | GO:0030277 | maintenance of gastrointestinal epithelium | 14 | 23 | 1.100e-03 |
| GO:BP | GO:0032735 | positive regulation of interleukin-12 production | 21 | 43 | 1.271e-03 |
| GO:BP | GO:0071345 | cellular response to cytokine stimulus | 222 | 843 | 1.273e-03 |
| GO:BP | GO:1904892 | regulation of receptor signaling pathway via STAT | 40 | 106 | 1.418e-03 |
| GO:BP | GO:0046425 | regulation of receptor signaling pathway via JAK-STAT | 38 | 99 | 1.418e-03 |
| GO:BP | GO:0060046 | regulation of acrosome reaction | 11 | 16 | 1.565e-03 |
| GO:BP | GO:0001818 | negative regulation of cytokine production | 88 | 288 | 1.624e-03 |
| GO:BP | GO:0002825 | regulation of T-helper 1 type immune response | 17 | 32 | 1.754e-03 |
| GO:BP | GO:0002715 | regulation of natural killer cell mediated immunity | 23 | 50 | 1.781e-03 |
| GO:BP | GO:0002228 | natural killer cell mediated immunity | 31 | 76 | 1.797e-03 |
| GO:BP | GO:0002700 | regulation of production of molecular mediator of immune response | 62 | 188 | 1.837e-03 |
| GO:BP | GO:0007189 | adenylate cyclase-activating G protein-coupled receptor signaling pathway | 54 | 158 | 1.843e-03 |
| GO:BP | GO:0002701 | negative regulation of production of molecular mediator of immune response | 21 | 44 | 1.881e-03 |
| GO:BP | GO:0001523 | retinoid metabolic process | 33 | 83 | 1.899e-03 |
| GO:BP | GO:0031343 | positive regulation of cell killing | 30 | 73 | 1.961e-03 |
| GO:BP | GO:0009889 | regulation of biosynthetic process | 1302 | 5795 | 1.992e-03 |
| GO:BP | GO:0009111 | vitamin catabolic process | 10 | 14 | 2.062e-03 |
| GO:BP | GO:0070942 | neutrophil mediated cytotoxicity | 10 | 14 | 2.062e-03 |
| GO:BP | GO:0042445 | hormone metabolic process | 76 | 243 | 2.132e-03 |
| GO:BP | GO:0048519 | negative regulation of biological process | 1316 | 5865 | 2.239e-03 |
| GO:BP | GO:0042832 | defense response to protozoan | 15 | 27 | 2.350e-03 |
| GO:BP | GO:0000270 | peptidoglycan metabolic process | 6 | 6 | 2.505e-03 |
| GO:BP | GO:0009253 | peptidoglycan catabolic process | 6 | 6 | 2.505e-03 |
| GO:BP | GO:0051552 | flavone metabolic process | 6 | 6 | 2.505e-03 |
| GO:BP | GO:0051673 | disruption of plasma membrane integrity in another organism | 6 | 6 | 2.505e-03 |
| GO:BP | GO:0002786 | regulation of antibacterial peptide production | 6 | 6 | 2.505e-03 |
| GO:BP | GO:0009582 | detection of abiotic stimulus | 50 | 145 | 2.505e-03 |
| GO:BP | GO:0070943 | neutrophil-mediated killing of symbiont cell | 9 | 12 | 2.622e-03 |
| GO:BP | GO:0032680 | regulation of tumor necrosis factor production | 55 | 164 | 2.649e-03 |
| GO:BP | GO:0032640 | tumor necrosis factor production | 55 | 164 | 2.649e-03 |
| GO:BP | GO:0031349 | positive regulation of defense response | 135 | 484 | 2.649e-03 |
| GO:BP | GO:0016101 | diterpenoid metabolic process | 34 | 88 | 2.739e-03 |
| GO:BP | GO:0030431 | sleep | 13 | 22 | 2.927e-03 |
| GO:BP | GO:0120254 | olefinic compound metabolic process | 54 | 161 | 3.006e-03 |
| GO:BP | GO:0002456 | T cell mediated immunity | 44 | 124 | 3.006e-03 |
| GO:BP | GO:0050866 | negative regulation of cell activation | 66 | 207 | 3.129e-03 |
| GO:BP | GO:0002707 | negative regulation of lymphocyte mediated immunity | 24 | 55 | 3.173e-03 |
| GO:BP | GO:0002768 | immune response-regulating cell surface receptor signaling pathway | 98 | 334 | 3.194e-03 |
| GO:BP | GO:0008228 | opsonization | 11 | 17 | 3.205e-03 |
| GO:BP | GO:0071706 | tumor necrosis factor superfamily cytokine production | 56 | 169 | 3.205e-03 |
| GO:BP | GO:1903555 | regulation of tumor necrosis factor superfamily cytokine production | 56 | 169 | 3.205e-03 |
| GO:BP | GO:0006968 | cellular defense response | 23 | 52 | 3.364e-03 |
| GO:BP | GO:0032615 | interleukin-12 production | 26 | 62 | 3.618e-03 |
| GO:BP | GO:0032655 | regulation of interleukin-12 production | 26 | 62 | 3.618e-03 |
| GO:BP | GO:0051607 | defense response to virus | 92 | 311 | 3.618e-03 |
| GO:BP | GO:0002708 | positive regulation of lymphocyte mediated immunity | 44 | 125 | 3.618e-03 |
| GO:BP | GO:0002710 | negative regulation of T cell mediated immunity | 15 | 28 | 3.752e-03 |
| GO:BP | GO:0002275 | myeloid cell activation involved in immune response | 37 | 100 | 3.763e-03 |
| GO:BP | GO:0032611 | interleukin-1 beta production | 35 | 93 | 3.806e-03 |
| GO:BP | GO:0032651 | regulation of interleukin-1 beta production | 35 | 93 | 3.806e-03 |
| GO:BP | GO:0030183 | B cell differentiation | 53 | 159 | 3.943e-03 |
| GO:BP | GO:0071466 | cellular response to xenobiotic stimulus | 62 | 194 | 4.400e-03 |
| GO:BP | GO:0034097 | response to cytokine | 239 | 937 | 4.901e-03 |
| GO:BP | GO:0060259 | regulation of feeding behavior | 14 | 26 | 5.747e-03 |
| GO:BP | GO:0032760 | positive regulation of tumor necrosis factor production | 37 | 102 | 5.854e-03 |
| GO:BP | GO:0046456 | icosanoid biosynthetic process | 24 | 57 | 5.854e-03 |
| GO:BP | GO:0032733 | positive regulation of interleukin-10 production | 19 | 41 | 5.913e-03 |
| GO:BP | GO:0009072 | aromatic amino acid metabolic process | 19 | 41 | 5.913e-03 |
| GO:BP | GO:0010817 | regulation of hormone levels | 148 | 548 | 5.969e-03 |
| GO:BP | GO:0042755 | eating behavior | 18 | 38 | 6.100e-03 |
| GO:BP | GO:0050482 | arachidonate secretion | 16 | 32 | 6.178e-03 |
| GO:BP | GO:1903963 | arachidonate transport | 16 | 32 | 6.178e-03 |
| GO:BP | GO:1903557 | positive regulation of tumor necrosis factor superfamily cytokine production | 38 | 106 | 6.239e-03 |
| GO:BP | GO:0071347 | cellular response to interleukin-1 | 38 | 106 | 6.239e-03 |
| GO:BP | GO:0002440 | production of molecular mediator of immune response | 68 | 220 | 6.306e-03 |
| GO:BP | GO:1901652 | response to peptide | 241 | 950 | 6.306e-03 |
| GO:BP | GO:0032732 | positive regulation of interleukin-1 production | 28 | 71 | 6.656e-03 |
| GO:BP | GO:0002820 | negative regulation of adaptive immune response | 25 | 61 | 6.970e-03 |
| GO:BP | GO:0050795 | regulation of behavior | 29 | 75 | 7.694e-03 |
| GO:BP | GO:0070944 | neutrophil-mediated killing of bacterium | 8 | 11 | 8.362e-03 |
| GO:BP | GO:1903027 | regulation of opsonization | 8 | 11 | 8.362e-03 |
| GO:BP | GO:0044058 | regulation of digestive system process | 18 | 39 | 8.822e-03 |
| GO:BP | GO:0034374 | low-density lipoprotein particle remodeling | 10 | 16 | 9.089e-03 |
| GO:BP | GO:0002675 | positive regulation of acute inflammatory response | 14 | 27 | 9.089e-03 |
| GO:BP | GO:0015671 | oxygen transport | 10 | 16 | 9.089e-03 |
| GO:BP | GO:0002719 | negative regulation of cytokine production involved in immune response | 16 | 33 | 9.254e-03 |
| GO:BP | GO:0050891 | multicellular organismal-level water homeostasis | 16 | 33 | 9.254e-03 |
| GO:BP | GO:0001562 | response to protozoan | 15 | 30 | 9.254e-03 |
| GO:BP | GO:0050766 | positive regulation of phagocytosis | 27 | 69 | 9.556e-03 |
| GO:BP | GO:0002688 | regulation of leukocyte chemotaxis | 42 | 123 | 9.628e-03 |
| GO:BP | GO:0022407 | regulation of cell-cell adhesion | 130 | 478 | 9.660e-03 |
| GO:BP | GO:0052696 | flavonoid glucuronidation | 5 | 5 | 1.015e-02 |
| GO:BP | GO:0002803 | positive regulation of antibacterial peptide production | 5 | 5 | 1.015e-02 |
| GO:BP | GO:1903028 | positive regulation of opsonization | 7 | 9 | 1.047e-02 |
| GO:BP | GO:0001912 | positive regulation of leukocyte mediated cytotoxicity | 26 | 66 | 1.060e-02 |
| GO:BP | GO:0042267 | natural killer cell mediated cytotoxicity | 28 | 73 | 1.081e-02 |
| GO:BP | GO:0002827 | positive regulation of T-helper 1 type immune response | 11 | 19 | 1.105e-02 |
| GO:BP | GO:0019370 | leukotriene biosynthetic process | 11 | 19 | 1.105e-02 |
| GO:BP | GO:0007187 | G protein-coupled receptor signaling pathway, coupled to cyclic nucleotide second messenger | 23 | 56 | 1.105e-02 |
| GO:BP | GO:0035743 | CD4-positive, alpha-beta T cell cytokine production | 11 | 19 | 1.105e-02 |
| GO:BP | GO:0002823 | negative regulation of adaptive immune response based on somatic recombination of immune receptors built from immunoglobulin superfamily domains | 23 | 56 | 1.105e-02 |
| GO:BP | GO:0007198 | adenylate cyclase-inhibiting serotonin receptor signaling pathway | 6 | 7 | 1.179e-02 |
| GO:BP | GO:0043299 | leukocyte degranulation | 31 | 84 | 1.180e-02 |
| GO:BP | GO:0002683 | negative regulation of immune system process | 135 | 502 | 1.204e-02 |
| GO:BP | GO:0035036 | sperm-egg recognition | 22 | 53 | 1.204e-02 |
| GO:BP | GO:0050867 | positive regulation of cell activation | 104 | 372 | 1.216e-02 |
| GO:BP | GO:0070555 | response to interleukin-1 | 44 | 132 | 1.220e-02 |
| GO:BP | GO:0002446 | neutrophil mediated immunity | 17 | 37 | 1.269e-02 |
| GO:BP | GO:0010273 | detoxification of copper ion | 9 | 14 | 1.269e-02 |
| GO:BP | GO:0002430 | complement receptor mediated signaling pathway | 9 | 14 | 1.269e-02 |
| GO:BP | GO:1990169 | stress response to copper ion | 9 | 14 | 1.269e-02 |
| GO:BP | GO:0072678 | T cell migration | 28 | 74 | 1.338e-02 |
| GO:BP | GO:1902221 | erythrose 4-phosphate/phosphoenolpyruvate family amino acid metabolic process | 14 | 28 | 1.358e-02 |
| GO:BP | GO:0055078 | sodium ion homeostasis | 20 | 47 | 1.432e-02 |
| GO:BP | GO:0009988 | cell-cell recognition | 28 | 75 | 1.695e-02 |
| GO:BP | GO:0008037 | cell recognition | 50 | 157 | 1.695e-02 |
| GO:BP | GO:0044706 | multi-multicellular organism process | 64 | 212 | 1.695e-02 |
| GO:BP | GO:0043330 | response to exogenous dsRNA | 21 | 51 | 1.764e-02 |
| GO:BP | GO:0032621 | interleukin-18 production | 8 | 12 | 1.828e-02 |
| GO:BP | GO:0016056 | G protein-coupled opsin signaling pathway | 8 | 12 | 1.828e-02 |
| GO:BP | GO:0032661 | regulation of interleukin-18 production | 8 | 12 | 1.828e-02 |
| GO:BP | GO:0009812 | flavonoid metabolic process | 8 | 12 | 1.828e-02 |
| GO:BP | GO:0022408 | negative regulation of cell-cell adhesion | 58 | 189 | 1.862e-02 |
| GO:BP | GO:0042130 | negative regulation of T cell proliferation | 27 | 72 | 1.900e-02 |
| GO:BP | GO:0006775 | fat-soluble vitamin metabolic process | 20 | 48 | 1.924e-02 |
| GO:BP | GO:0018149 | peptide cross-linking | 14 | 29 | 2.049e-02 |
| GO:BP | GO:0006910 | phagocytosis, recognition | 14 | 29 | 2.049e-02 |
| GO:BP | GO:0098581 | detection of external biotic stimulus | 13 | 26 | 2.058e-02 |
| GO:BP | GO:0032729 | positive regulation of type II interferon production | 28 | 76 | 2.093e-02 |
| GO:BP | GO:0048523 | negative regulation of cellular process | 1251 | 5646 | 2.251e-02 |
| GO:BP | GO:0030098 | lymphocyte differentiation | 118 | 438 | 2.292e-02 |
| GO:BP | GO:0046006 | regulation of activated T cell proliferation | 18 | 42 | 2.298e-02 |
| GO:BP | GO:0044703 | multi-organism reproductive process | 61 | 203 | 2.426e-02 |
| GO:BP | GO:0141005 | transposable element silencing by heterochromatin formation | 9 | 15 | 2.437e-02 |
| GO:BP | GO:0007340 | acrosome reaction | 17 | 39 | 2.484e-02 |
| GO:BP | GO:0002690 | positive regulation of leukocyte chemotaxis | 33 | 95 | 2.484e-02 |
| GO:BP | GO:0032635 | interleukin-6 production | 48 | 152 | 2.487e-02 |
| GO:BP | GO:0032675 | regulation of interleukin-6 production | 48 | 152 | 2.487e-02 |
| GO:BP | GO:0002361 | CD4-positive, CD25-positive, alpha-beta regulatory T cell differentiation | 7 | 10 | 2.492e-02 |
| GO:BP | GO:0008343 | adult feeding behavior | 7 | 10 | 2.492e-02 |
| GO:BP | GO:0002696 | positive regulation of leukocyte activation | 98 | 355 | 2.492e-02 |
| GO:BP | GO:0002676 | regulation of chronic inflammatory response | 7 | 10 | 2.492e-02 |
| GO:BP | GO:0002765 | immune response-inhibiting signal transduction | 7 | 10 | 2.492e-02 |
| GO:BP | GO:0002821 | positive regulation of adaptive immune response | 42 | 129 | 2.492e-02 |
| GO:BP | GO:0071947 | protein deubiquitination involved in ubiquitin-dependent protein catabolic process | 7 | 10 | 2.492e-02 |
| GO:BP | GO:0035747 | natural killer cell chemotaxis | 7 | 10 | 2.492e-02 |
| GO:BP | GO:0006869 | lipid transport | 116 | 431 | 2.510e-02 |
| GO:BP | GO:0002437 | inflammatory response to antigenic stimulus | 28 | 77 | 2.522e-02 |
| GO:BP | GO:0006721 | terpenoid metabolic process | 34 | 99 | 2.549e-02 |
| GO:BP | GO:0002764 | immune response-regulating signaling pathway | 133 | 504 | 2.619e-02 |
| GO:BP | GO:0042269 | regulation of natural killer cell mediated cytotoxicity | 19 | 46 | 2.740e-02 |
| GO:BP | GO:0034369 | plasma lipoprotein particle remodeling | 15 | 33 | 2.741e-02 |
| GO:BP | GO:0042573 | retinoic acid metabolic process | 15 | 33 | 2.741e-02 |
| GO:BP | GO:0034368 | protein-lipid complex remodeling | 15 | 33 | 2.741e-02 |
| GO:BP | GO:0010669 | epithelial structure maintenance | 15 | 33 | 2.741e-02 |
| GO:BP | GO:0007603 | phototransduction, visible light | 10 | 18 | 2.741e-02 |
| GO:BP | GO:0002523 | leukocyte migration involved in inflammatory response | 11 | 21 | 2.925e-02 |
| GO:BP | GO:0042745 | circadian sleep/wake cycle | 11 | 21 | 2.925e-02 |
| GO:BP | GO:0043950 | positive regulation of cAMP-mediated signaling | 11 | 21 | 2.925e-02 |
| GO:BP | GO:0002577 | regulation of antigen processing and presentation | 11 | 21 | 2.925e-02 |
| GO:BP | GO:0032731 | positive regulation of interleukin-1 beta production | 23 | 60 | 2.925e-02 |
| GO:BP | GO:0003352 | regulation of cilium movement | 18 | 43 | 2.957e-02 |
| GO:BP | GO:0002438 | acute inflammatory response to antigenic stimulus | 13 | 27 | 2.957e-02 |
| GO:BP | GO:0046634 | regulation of alpha-beta T cell activation | 38 | 115 | 2.962e-02 |
| GO:BP | GO:0009074 | aromatic amino acid family catabolic process | 12 | 24 | 2.967e-02 |
| GO:BP | GO:0002367 | cytokine production involved in immune response | 39 | 119 | 3.047e-02 |
| GO:BP | GO:0002718 | regulation of cytokine production involved in immune response | 39 | 119 | 3.047e-02 |
| GO:BP | GO:0002824 | positive regulation of adaptive immune response based on somatic recombination of immune receptors built from immunoglobulin superfamily domains | 40 | 123 | 3.138e-02 |
| GO:BP | GO:0042088 | T-helper 1 type immune response | 20 | 50 | 3.165e-02 |
| GO:BP | GO:2000501 | regulation of natural killer cell chemotaxis | 6 | 8 | 3.222e-02 |
| GO:BP | GO:1903039 | positive regulation of leukocyte cell-cell adhesion | 77 | 271 | 3.222e-02 |
| GO:BP | GO:0019369 | arachidonate metabolic process | 22 | 57 | 3.222e-02 |
| GO:BP | GO:0070268 | cornification | 6 | 8 | 3.222e-02 |
| GO:BP | GO:0032714 | negative regulation of interleukin-5 production | 6 | 8 | 3.222e-02 |
| GO:BP | GO:0032741 | positive regulation of interleukin-18 production | 6 | 8 | 3.222e-02 |
| GO:BP | GO:0014061 | regulation of norepinephrine secretion | 8 | 13 | 3.369e-02 |
| GO:BP | GO:0046541 | saliva secretion | 8 | 13 | 3.369e-02 |
| GO:BP | GO:0035745 | T-helper 2 cell cytokine production | 8 | 13 | 3.369e-02 |
| GO:BP | GO:2000551 | regulation of T-helper 2 cell cytokine production | 8 | 13 | 3.369e-02 |
| GO:BP | GO:0060456 | positive regulation of digestive system process | 8 | 13 | 3.369e-02 |
| GO:BP | GO:0032720 | negative regulation of tumor necrosis factor production | 23 | 61 | 3.613e-02 |
| GO:BP | GO:0032692 | negative regulation of interleukin-1 production | 15 | 34 | 3.738e-02 |
| GO:BP | GO:0002702 | positive regulation of production of molecular mediator of immune response | 43 | 136 | 3.774e-02 |
| GO:BP | GO:0042320 | regulation of circadian sleep/wake cycle, REM sleep | 4 | 4 | 3.774e-02 |
| GO:BP | GO:0036101 | leukotriene B4 catabolic process | 4 | 4 | 3.774e-02 |
| GO:BP | GO:0042376 | phylloquinone catabolic process | 4 | 4 | 3.774e-02 |
| GO:BP | GO:0042377 | vitamin K catabolic process | 4 | 4 | 3.774e-02 |
| GO:BP | GO:0042374 | phylloquinone metabolic process | 4 | 4 | 3.774e-02 |
| GO:BP | GO:2000851 | positive regulation of glucocorticoid secretion | 4 | 4 | 3.774e-02 |
| GO:BP | GO:0042747 | circadian sleep/wake cycle, REM sleep | 4 | 4 | 3.774e-02 |
| GO:BP | GO:0002325 | natural killer cell differentiation involved in immune response | 4 | 4 | 3.774e-02 |
| GO:BP | GO:0045938 | positive regulation of circadian sleep/wake cycle, sleep | 4 | 4 | 3.774e-02 |
| GO:BP | GO:0002429 | immune response-activating cell surface receptor signaling pathway | 85 | 306 | 3.774e-02 |
| GO:BP | GO:0060480 | lung goblet cell differentiation | 4 | 4 | 3.774e-02 |
| GO:BP | GO:0032826 | regulation of natural killer cell differentiation involved in immune response | 4 | 4 | 3.774e-02 |
| GO:BP | GO:0044278 | disruption of cell wall in another organism | 4 | 4 | 3.774e-02 |
| GO:BP | GO:0051464 | positive regulation of cortisol secretion | 4 | 4 | 3.774e-02 |
| GO:BP | GO:0002507 | tolerance induction | 14 | 31 | 3.812e-02 |
| GO:BP | GO:0051969 | regulation of transmission of nerve impulse | 9 | 16 | 3.812e-02 |
| GO:BP | GO:0034382 | chylomicron remnant clearance | 5 | 6 | 3.812e-02 |
| GO:BP | GO:2000503 | positive regulation of natural killer cell chemotaxis | 5 | 6 | 3.812e-02 |
| GO:BP | GO:0036100 | leukotriene catabolic process | 5 | 6 | 3.812e-02 |
| GO:BP | GO:0010901 | regulation of very-low-density lipoprotein particle remodeling | 5 | 6 | 3.812e-02 |
| GO:BP | GO:0035821 | modulation of process of another organism | 9 | 16 | 3.812e-02 |
| GO:BP | GO:0097272 | ammonium homeostasis | 5 | 6 | 3.812e-02 |
| GO:BP | GO:0022409 | positive regulation of cell-cell adhesion | 88 | 319 | 3.812e-02 |
| GO:BP | GO:0072378 | blood coagulation, fibrin clot formation | 9 | 16 | 3.812e-02 |
| GO:BP | GO:0046942 | carboxylic acid transport | 94 | 344 | 3.812e-02 |
| GO:BP | GO:0042744 | hydrogen peroxide catabolic process | 14 | 31 | 3.812e-02 |
| GO:BP | GO:0050731 | positive regulation of peptidyl-tyrosine phosphorylation | 50 | 164 | 3.908e-02 |
| GO:BP | GO:0015849 | organic acid transport | 94 | 345 | 4.079e-02 |
| GO:BP | GO:0032693 | negative regulation of interleukin-10 production | 10 | 19 | 4.083e-02 |
| GO:BP | GO:0072376 | protein activation cascade | 10 | 19 | 4.083e-02 |
| GO:BP | GO:0097501 | stress response to metal ion | 10 | 19 | 4.083e-02 |
| GO:BP | GO:0022410 | circadian sleep/wake cycle process | 10 | 19 | 4.083e-02 |
| GO:BP | GO:0098543 | detection of other organism | 10 | 19 | 4.083e-02 |
| GO:BP | GO:0042749 | regulation of circadian sleep/wake cycle | 10 | 19 | 4.083e-02 |
| GO:BP | GO:0048520 | positive regulation of behavior | 12 | 25 | 4.100e-02 |
| GO:BP | GO:0042430 | indole-containing compound metabolic process | 12 | 25 | 4.100e-02 |
| GO:BP | GO:0002833 | positive regulation of response to biotic stimulus | 102 | 379 | 4.100e-02 |
| GO:BP | GO:1900015 | regulation of cytokine production involved in inflammatory response | 23 | 62 | 4.233e-02 |
| GO:BP | GO:0002534 | cytokine production involved in inflammatory response | 23 | 62 | 4.233e-02 |
| GO:BP | GO:0050878 | regulation of body fluid levels | 100 | 371 | 4.233e-02 |
| GO:BP | GO:2000344 | positive regulation of acrosome reaction | 7 | 11 | 4.646e-02 |
| GO:BP | GO:0034105 | positive regulation of tissue remodeling | 7 | 11 | 4.646e-02 |
| GO:BP | GO:0032375 | negative regulation of cholesterol transport | 7 | 11 | 4.646e-02 |
| GO:BP | GO:0032372 | negative regulation of sterol transport | 7 | 11 | 4.646e-02 |
| GO:BP | GO:0030888 | regulation of B cell proliferation | 24 | 66 | 4.646e-02 |
| GO:BP | GO:0002725 | negative regulation of T cell cytokine production | 7 | 11 | 4.646e-02 |
| GO:BP | GO:0021562 | vestibulocochlear nerve development | 7 | 11 | 4.646e-02 |
| GO:BP | GO:0042116 | macrophage activation | 35 | 107 | 4.681e-02 |
| GO:BP | GO:0046636 | negative regulation of alpha-beta T cell activation | 18 | 45 | 4.681e-02 |
| KEGG | KEGG:04740 | Olfactory transduction | 369 | 428 | 7.883e-179 |
| KEGG | KEGG:04060 | Cytokine-cytokine receptor interaction | 154 | 291 | 2.327e-27 |
| KEGG | KEGG:04080 | Neuroactive ligand-receptor interaction | 178 | 365 | 2.562e-26 |
| KEGG | KEGG:05206 | MicroRNAs in cancer | 149 | 310 | 4.215e-21 |
| KEGG | KEGG:05150 | Staphylococcus aureus infection | 60 | 86 | 1.731e-18 |
| KEGG | KEGG:04061 | Viral protein interaction with cytokine and cytokine receptor | 63 | 98 | 1.101e-16 |
| KEGG | KEGG:04742 | Taste transduction | 49 | 85 | 2.376e-10 |
| KEGG | KEGG:00830 | Retinol metabolism | 41 | 68 | 1.610e-09 |
| KEGG | KEGG:05320 | Autoimmune thyroid disease | 32 | 49 | 1.071e-08 |
| KEGG | KEGG:05310 | Asthma | 21 | 27 | 8.154e-08 |
| KEGG | KEGG:00980 | Metabolism of xenobiotics by cytochrome P450 | 40 | 74 | 1.840e-07 |
| KEGG | KEGG:04640 | Hematopoietic cell lineage | 46 | 92 | 3.330e-07 |
| KEGG | KEGG:05204 | Chemical carcinogenesis - DNA adducts | 36 | 67 | 1.103e-06 |
| KEGG | KEGG:04672 | Intestinal immune network for IgA production | 26 | 44 | 6.383e-06 |
| KEGG | KEGG:00982 | Drug metabolism - cytochrome P450 | 34 | 68 | 2.141e-05 |
| KEGG | KEGG:04630 | JAK-STAT signaling pathway | 64 | 162 | 3.107e-05 |
| KEGG | KEGG:05323 | Rheumatoid arthritis | 40 | 88 | 4.815e-05 |
| KEGG | KEGG:00053 | Ascorbate and aldarate metabolism | 19 | 30 | 4.815e-05 |
| KEGG | KEGG:05322 | Systemic lupus erythematosus | 54 | 132 | 4.823e-05 |
| KEGG | KEGG:00140 | Steroid hormone biosynthesis | 31 | 62 | 4.823e-05 |
| KEGG | KEGG:05332 | Graft-versus-host disease | 21 | 37 | 1.440e-04 |
| KEGG | KEGG:04976 | Bile secretion | 39 | 89 | 1.440e-04 |
| KEGG | KEGG:05321 | Inflammatory bowel disease | 30 | 62 | 1.440e-04 |
| KEGG | KEGG:00590 | Arachidonic acid metabolism | 29 | 61 | 2.912e-04 |
| KEGG | KEGG:05144 | Malaria | 24 | 49 | 7.806e-04 |
| KEGG | KEGG:00591 | Linoleic acid metabolism | 17 | 30 | 8.847e-04 |
| KEGG | KEGG:00040 | Pentose and glucuronate interconversions | 19 | 36 | 1.186e-03 |
| KEGG | KEGG:00592 | alpha-Linolenic acid metabolism | 15 | 26 | 1.624e-03 |
| KEGG | KEGG:05330 | Allograft rejection | 18 | 34 | 1.624e-03 |
| KEGG | KEGG:04610 | Complement and coagulation cascades | 35 | 86 | 1.941e-03 |
| KEGG | KEGG:04650 | Natural killer cell mediated cytotoxicity | 45 | 124 | 5.422e-03 |
| KEGG | KEGG:04940 | Type I diabetes mellitus | 19 | 40 | 5.422e-03 |
| KEGG | KEGG:00860 | Porphyrin metabolism | 20 | 43 | 5.422e-03 |
| KEGG | KEGG:04975 | Fat digestion and absorption | 20 | 43 | 5.422e-03 |
| KEGG | KEGG:05340 | Primary immunodeficiency | 18 | 37 | 5.422e-03 |
| KEGG | KEGG:05164 | Influenza A | 57 | 167 | 5.688e-03 |
| KEGG | KEGG:05152 | Tuberculosis | 59 | 175 | 6.375e-03 |
| KEGG | KEGG:05143 | African trypanosomiasis | 17 | 36 | 1.011e-02 |
| KEGG | KEGG:00350 | Tyrosine metabolism | 17 | 36 | 1.011e-02 |
| KEGG | KEGG:04620 | Toll-like receptor signaling pathway | 38 | 106 | 1.465e-02 |
| KEGG | KEGG:00983 | Drug metabolism - other enzymes | 30 | 79 | 1.527e-02 |
| KEGG | KEGG:04514 | Cell adhesion molecules | 50 | 153 | 2.874e-02 |
| KEGG | KEGG:05133 | Pertussis | 28 | 76 | 3.368e-02 |
| KEGG | KEGG:04613 | Neutrophil extracellular trap formation | 59 | 188 | 3.520e-02 |
| KEGG | KEGG:04972 | Pancreatic secretion | 35 | 102 | 4.363e-02 |
| KEGG | KEGG:04657 | IL-17 signaling pathway | 32 | 92 | 4.766e-02 |
#write.csv(tableNR, "output/table_NRmotif.csv")

#GO:BP
tableNR_GOBP_d <- tableNR_d %>%
  dplyr::filter(source=="GO:BP") %>%
  dplyr::select(p_value, term_name, intersection_size) %>%
  dplyr::slice_min(., n=10, order_by=p_value) %>%
  mutate(log_val = -log10(p_value))

#saveRDS(tableNR_GOBP, "data/tableNR_GOBP.RDS")

tableNR_GOBP_d %>% ggplot(., aes(x = log_val, y = reorder(term_name, p_value), col= intersection_size)) +
  geom_point(aes(size = intersection_size)) +
  ggtitle("No Response Enriched GO:BP Terms")+
  xlab(expression("-log"[10]~"p-value"))+
  guides(col="none", size= guide_legend(title = "# of intersected \n terms"))+
  ylab("GO:BP term")+
  scale_y_discrete(labels = scales::label_wrap(30))+
  theme_bw()+
  theme(plot.title = element_text(size = rel(1.5), hjust = 0.5),
        axis.title = element_text(size = 15, colour = "black"),
        axis.ticks = element_line(linewidth = 1.5),
        axis.line = element_line(linewidth = 1.5),
        axis.text = element_text(size = 10, colour = "black", angle = 0),
        strip.text = element_text(size = 15, colour = "black", face = "bold"))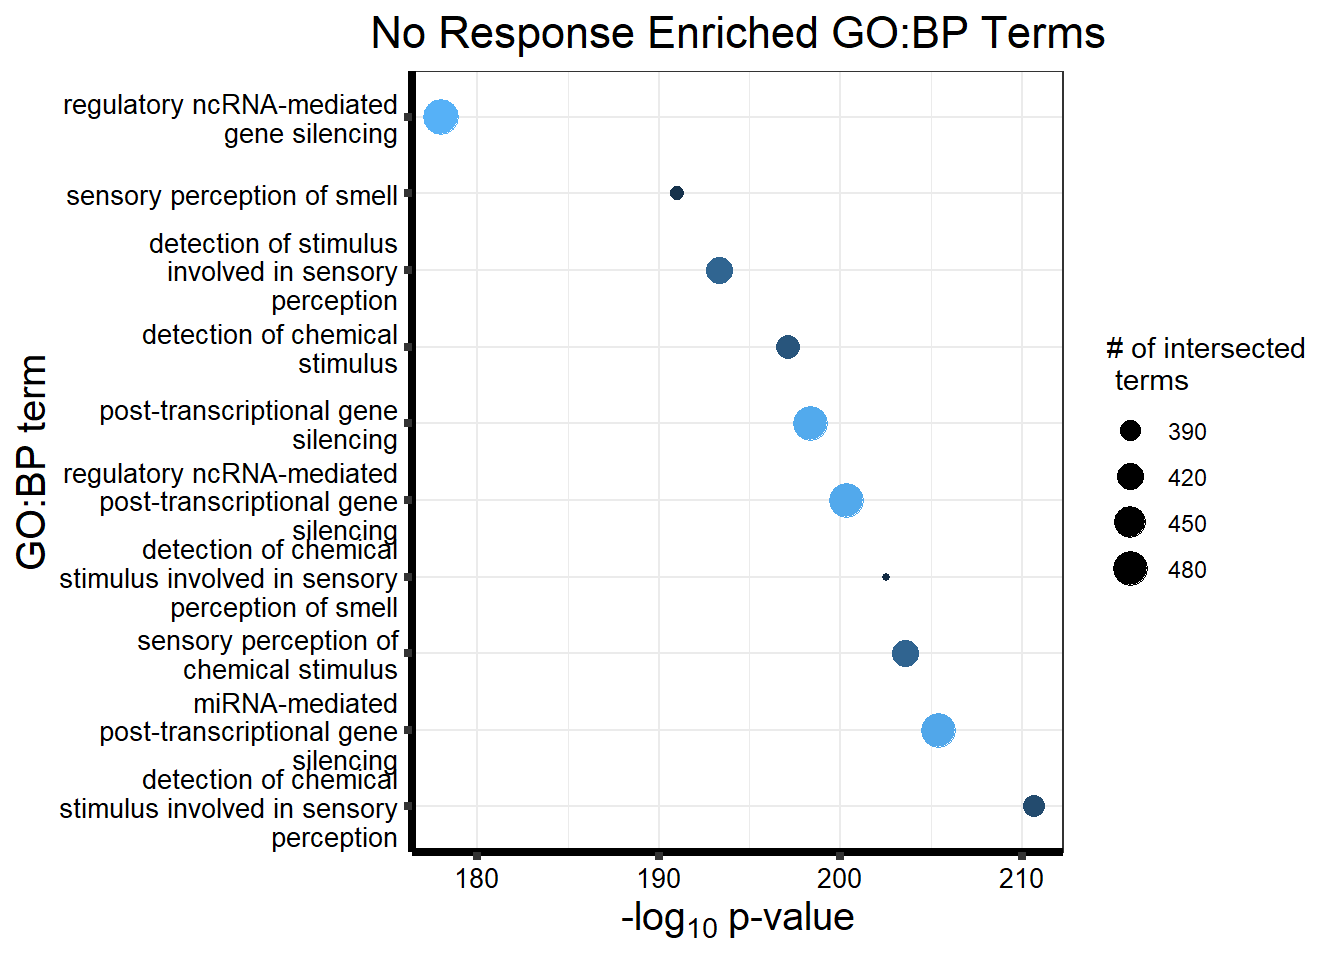
#KEGG
tableNR_KEGG_d <- tableNR_d %>%
  dplyr::filter(source=="KEGG") %>%
  dplyr::select(p_value, term_name, intersection_size) %>%
  dplyr::slice_min(., n=10, order_by=p_value) %>%
  mutate(log_val = -log10(p_value))

tableNR_KEGG_d %>% ggplot(., aes(x = log_val, y = reorder(term_name, p_value), col= intersection_size)) +
  geom_point(aes(size = intersection_size)) +
  ggtitle("No Response Enriched KEGG Terms")+
  xlab(expression("-log"[10]~"p-value"))+
  guides(col="none", size= guide_legend(title = "# of intersected \n terms"))+
  ylab("KEGG term")+
  scale_y_discrete(labels = scales::label_wrap(30))+
  theme_bw()+
  theme(plot.title = element_text(size = rel(1.5), hjust = 0.5),
        axis.title = element_text(size = 15, colour = "black"),
        axis.ticks = element_line(linewidth = 1.5),
        axis.line = element_line(linewidth = 1.5),
        axis.text = element_text(size = 10, colour = "black", angle = 0),
        strip.text = element_text(size = 15, colour = "black", face = "bold"))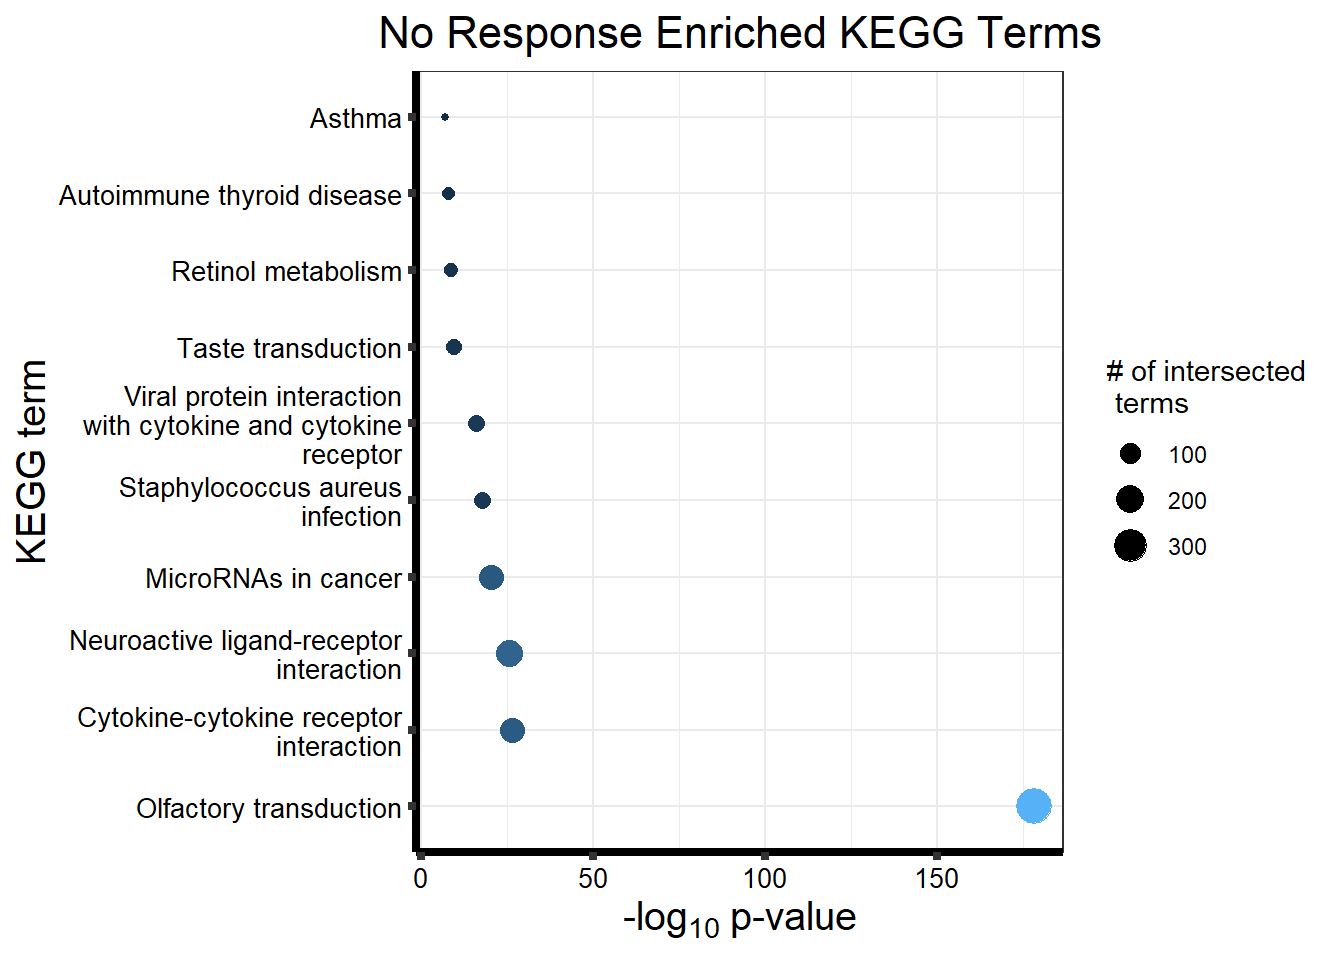
Now let’s do the same thing but with the posterior probability rather than the clustlike
motif_NR_pp <- prob_motif_1

NRmotif_genes_pp <- gost(query = motif_NR_pp,
                      organism = "hsapiens",
                      ordered_query = FALSE,
                      measure_underrepresentation = FALSE,
                      evcodes = FALSE,
                      user_threshold = 0.05,
                      correction_method = c("fdr"),
                      sources = c("GO:BP", "KEGG"))

cormotifNFclust_pp <- gostplot(NRmotif_genes_pp, capped = FALSE, interactive = TRUE)
cormotifNFclust_pp
tableNR_pp <- NRmotif_genes_pp$result %>%
dplyr::select(c(source, term_id, term_name, intersection_size, term_size, p_value))
tableNR_pp %>%
mutate_at(.vars = 6, .funs = scales::label_scientific(digits=4)) %>%
kableExtra::kable(.,) %>%
kableExtra::kable_paper("striped", full_width = FALSE) %>%
kableExtra::kable_styling(full_width = FALSE, position = "left", bootstrap_options = c("striped", "hover")) %>%
kableExtra::scroll_box(width = "100%", height = "400px")| source | term_id | term_name | intersection_size | term_size | p_value |
|---|---|---|---|---|---|
| GO:BP | GO:0050907 | detection of chemical stimulus involved in sensory perception | 390 | 443 | 1.287e-211 |
| GO:BP | GO:0050911 | detection of chemical stimulus involved in sensory perception of smell | 361 | 397 | 3.880e-207 |
| GO:BP | GO:0035195 | miRNA-mediated post-transcriptional gene silencing | 470 | 612 | 1.992e-205 |
| GO:BP | GO:0007606 | sensory perception of chemical stimulus | 413 | 497 | 2.606e-204 |
| GO:BP | GO:0035194 | regulatory ncRNA-mediated post-transcriptional gene silencing | 471 | 624 | 2.134e-200 |
| GO:BP | GO:0016441 | post-transcriptional gene silencing | 472 | 630 | 1.663e-198 |
| GO:BP | GO:0009593 | detection of chemical stimulus | 399 | 480 | 1.882e-197 |
| GO:BP | GO:0007608 | sensory perception of smell | 368 | 423 | 4.525e-196 |
| GO:BP | GO:0050906 | detection of stimulus involved in sensory perception | 412 | 515 | 8.753e-192 |
| GO:BP | GO:0031047 | regulatory ncRNA-mediated gene silencing | 478 | 686 | 7.125e-179 |
| GO:BP | GO:0007186 | G protein-coupled receptor signaling pathway | 691 | 1275 | 6.531e-171 |
| GO:BP | GO:0051606 | detection of stimulus | 450 | 643 | 3.612e-169 |
| GO:BP | GO:0007600 | sensory perception | 550 | 955 | 1.330e-149 |
| GO:BP | GO:0050877 | nervous system process | 640 | 1489 | 7.974e-96 |
| GO:BP | GO:0010608 | post-transcriptional regulation of gene expression | 507 | 1087 | 6.512e-90 |
| GO:BP | GO:0003008 | system process | 792 | 2266 | 7.511e-68 |
| GO:BP | GO:0010629 | negative regulation of gene expression | 623 | 1640 | 4.964e-67 |
| GO:BP | GO:0042221 | response to chemical | 1081 | 3867 | 6.538e-38 |
| GO:BP | GO:0065007 | biological regulation | 2890 | 12671 | 3.299e-35 |
| GO:BP | GO:0050789 | regulation of biological process | 2803 | 12278 | 6.612e-33 |
| GO:BP | GO:0042742 | defense response to bacterium | 163 | 326 | 1.270e-31 |
| GO:BP | GO:0006952 | defense response | 567 | 1809 | 7.997e-31 |
| GO:BP | GO:0032501 | multicellular organismal process | 1775 | 7234 | 4.261e-30 |
| GO:BP | GO:0050794 | regulation of cellular process | 2710 | 11876 | 4.261e-30 |
| GO:BP | GO:0006959 | humoral immune response | 135 | 254 | 1.532e-29 |
| GO:BP | GO:0010558 | negative regulation of macromolecule biosynthetic process | 784 | 2772 | 2.288e-27 |
| GO:BP | GO:0009617 | response to bacterium | 270 | 721 | 5.192e-26 |
| GO:BP | GO:0009890 | negative regulation of biosynthetic process | 792 | 2838 | 1.031e-25 |
| GO:BP | GO:0098542 | defense response to other organism | 401 | 1228 | 7.042e-25 |
| GO:BP | GO:0031424 | keratinization | 62 | 82 | 7.370e-25 |
| GO:BP | GO:0019730 | antimicrobial humoral response | 81 | 131 | 3.323e-23 |
| GO:BP | GO:0043207 | response to external biotic stimulus | 472 | 1558 | 1.127e-21 |
| GO:BP | GO:0051707 | response to other organism | 470 | 1555 | 2.367e-21 |
| GO:BP | GO:0140546 | defense response to symbiont | 363 | 1125 | 2.502e-21 |
| GO:BP | GO:0009607 | response to biotic stimulus | 479 | 1593 | 2.604e-21 |
| GO:BP | GO:0007165 | signal transduction | 1438 | 5979 | 5.050e-18 |
| GO:BP | GO:0009605 | response to external stimulus | 645 | 2367 | 1.527e-17 |
| GO:BP | GO:0141060 | disruption of anatomical structure in another organism | 60 | 98 | 1.074e-16 |
| GO:BP | GO:0001906 | cell killing | 102 | 219 | 1.111e-16 |
| GO:BP | GO:0010605 | negative regulation of macromolecule metabolic process | 826 | 3197 | 2.318e-16 |
| GO:BP | GO:0006954 | inflammatory response | 275 | 847 | 3.167e-16 |
| GO:BP | GO:0044419 | biological process involved in interspecies interaction between organisms | 489 | 1724 | 3.212e-16 |
| GO:BP | GO:0061844 | antimicrobial humoral immune response mediated by antimicrobial peptide | 53 | 83 | 7.347e-16 |
| GO:BP | GO:0031640 | killing of cells of another organism | 56 | 91 | 9.719e-16 |
| GO:BP | GO:0141061 | disruption of cell in another organism | 56 | 91 | 9.719e-16 |
| GO:BP | GO:0045087 | innate immune response | 305 | 977 | 1.891e-15 |
| GO:BP | GO:0045109 | intermediate filament organization | 48 | 73 | 4.381e-15 |
| GO:BP | GO:0006955 | immune response | 549 | 2008 | 5.955e-15 |
| GO:BP | GO:0030216 | keratinocyte differentiation | 84 | 176 | 1.835e-14 |
| GO:BP | GO:0007154 | cell communication | 1520 | 6496 | 1.967e-14 |
| GO:BP | GO:0023052 | signaling | 1513 | 6471 | 3.321e-14 |
| GO:BP | GO:0009892 | negative regulation of metabolic process | 859 | 3418 | 7.863e-14 |
| GO:BP | GO:0097530 | granulocyte migration | 74 | 156 | 1.684e-12 |
| GO:BP | GO:1990266 | neutrophil migration | 65 | 129 | 1.812e-12 |
| GO:BP | GO:0050896 | response to stimulus | 2016 | 8993 | 1.856e-12 |
| GO:BP | GO:0050829 | defense response to Gram-negative bacterium | 51 | 91 | 5.170e-12 |
| GO:BP | GO:0050830 | defense response to Gram-positive bacterium | 61 | 120 | 6.701e-12 |
| GO:BP | GO:0030593 | neutrophil chemotaxis | 56 | 106 | 8.589e-12 |
| GO:BP | GO:0009913 | epidermal cell differentiation | 101 | 250 | 1.235e-11 |
| GO:BP | GO:0002252 | immune effector process | 221 | 703 | 2.576e-11 |
| GO:BP | GO:0071621 | granulocyte chemotaxis | 63 | 129 | 2.607e-11 |
| GO:BP | GO:0007586 | digestion | 65 | 136 | 3.831e-11 |
| GO:BP | GO:0030595 | leukocyte chemotaxis | 95 | 237 | 1.092e-10 |
| GO:BP | GO:0050900 | leukocyte migration | 139 | 396 | 1.402e-10 |
| GO:BP | GO:0050909 | sensory perception of taste | 40 | 67 | 1.572e-10 |
| GO:BP | GO:0002237 | response to molecule of bacterial origin | 127 | 355 | 2.877e-10 |
| GO:BP | GO:0002697 | regulation of immune effector process | 134 | 381 | 2.911e-10 |
| GO:BP | GO:0045104 | intermediate filament cytoskeleton organization | 49 | 94 | 5.229e-10 |
| GO:BP | GO:0002376 | immune system process | 696 | 2796 | 6.460e-10 |
| GO:BP | GO:0097529 | myeloid leukocyte migration | 93 | 237 | 7.182e-10 |
| GO:BP | GO:0002323 | natural killer cell activation involved in immune response | 26 | 35 | 8.175e-10 |
| GO:BP | GO:0045103 | intermediate filament-based process | 49 | 95 | 8.229e-10 |
| GO:BP | GO:0007218 | neuropeptide signaling pathway | 54 | 110 | 8.825e-10 |
| GO:BP | GO:0019731 | antibacterial humoral response | 39 | 68 | 1.527e-09 |
| GO:BP | GO:0071219 | cellular response to molecule of bacterial origin | 88 | 224 | 2.298e-09 |
| GO:BP | GO:0032496 | response to lipopolysaccharide | 119 | 337 | 3.248e-09 |
| GO:BP | GO:0008544 | epidermis development | 134 | 394 | 3.770e-09 |
| GO:BP | GO:0070661 | leukocyte proliferation | 122 | 351 | 5.808e-09 |
| GO:BP | GO:0071222 | cellular response to lipopolysaccharide | 84 | 214 | 6.541e-09 |
| GO:BP | GO:0050913 | sensory perception of bitter taste | 28 | 42 | 7.382e-09 |
| GO:BP | GO:0046651 | lymphocyte proliferation | 110 | 308 | 7.797e-09 |
| GO:BP | GO:0051716 | cellular response to stimulus | 1639 | 7320 | 1.120e-08 |
| GO:BP | GO:0007283 | spermatogenesis | 194 | 637 | 1.246e-08 |
| GO:BP | GO:0007338 | single fertilization | 70 | 169 | 1.462e-08 |
| GO:BP | GO:0032943 | mononuclear cell proliferation | 111 | 315 | 1.544e-08 |
| GO:BP | GO:0050912 | detection of chemical stimulus involved in sensory perception of taste | 28 | 43 | 1.592e-08 |
| GO:BP | GO:0052695 | cellular glucuronidation | 18 | 21 | 1.831e-08 |
| GO:BP | GO:0033141 | positive regulation of peptidyl-serine phosphorylation of STAT protein | 18 | 21 | 1.831e-08 |
| GO:BP | GO:0070098 | chemokine-mediated signaling pathway | 45 | 90 | 1.838e-08 |
| GO:BP | GO:0048232 | male gamete generation | 197 | 654 | 2.315e-08 |
| GO:BP | GO:0042100 | B cell proliferation | 50 | 106 | 2.576e-08 |
| GO:BP | GO:0071715 | icosanoid transport | 36 | 65 | 2.911e-08 |
| GO:BP | GO:0060326 | cell chemotaxis | 111 | 319 | 3.324e-08 |
| GO:BP | GO:0001580 | detection of chemical stimulus involved in sensory perception of bitter taste | 25 | 37 | 4.338e-08 |
| GO:BP | GO:0009566 | fertilization | 81 | 212 | 5.545e-08 |
| GO:BP | GO:0002682 | regulation of immune system process | 399 | 1526 | 7.018e-08 |
| GO:BP | GO:0045321 | leukocyte activation | 265 | 951 | 1.229e-07 |
| GO:BP | GO:0002548 | monocyte chemotaxis | 36 | 68 | 1.442e-07 |
| GO:BP | GO:0001775 | cell activation | 299 | 1098 | 1.442e-07 |
| GO:BP | GO:0019221 | cytokine-mediated signaling pathway | 156 | 503 | 1.723e-07 |
| GO:BP | GO:0048245 | eosinophil chemotaxis | 20 | 27 | 1.818e-07 |
| GO:BP | GO:0070663 | regulation of leukocyte proliferation | 94 | 265 | 2.192e-07 |
| GO:BP | GO:0071216 | cellular response to biotic stimulus | 90 | 251 | 2.555e-07 |
| GO:BP | GO:0002526 | acute inflammatory response | 49 | 109 | 2.614e-07 |
| GO:BP | GO:0022414 | reproductive process | 401 | 1556 | 3.920e-07 |
| GO:BP | GO:0048609 | multicellular organismal reproductive process | 269 | 980 | 4.080e-07 |
| GO:BP | GO:0022600 | digestive system process | 47 | 105 | 6.278e-07 |
| GO:BP | GO:1990869 | cellular response to chemokine | 45 | 99 | 7.116e-07 |
| GO:BP | GO:1990868 | response to chemokine | 45 | 99 | 7.116e-07 |
| GO:BP | GO:0002366 | leukocyte activation involved in immune response | 103 | 305 | 7.469e-07 |
| GO:BP | GO:0002263 | cell activation involved in immune response | 104 | 309 | 7.689e-07 |
| GO:BP | GO:0033139 | regulation of peptidyl-serine phosphorylation of STAT protein | 18 | 24 | 7.793e-07 |
| GO:BP | GO:0002699 | positive regulation of immune effector process | 89 | 253 | 8.236e-07 |
| GO:BP | GO:0072677 | eosinophil migration | 21 | 31 | 8.501e-07 |
| GO:BP | GO:0006953 | acute-phase response | 28 | 49 | 8.612e-07 |
| GO:BP | GO:0002274 | myeloid leukocyte activation | 85 | 240 | 1.193e-06 |
| GO:BP | GO:0050832 | defense response to fungus | 31 | 59 | 2.090e-06 |
| GO:BP | GO:0042501 | serine phosphorylation of STAT protein | 18 | 25 | 2.145e-06 |
| GO:BP | GO:0060294 | cilium movement involved in cell motility | 64 | 167 | 2.377e-06 |
| GO:BP | GO:0050670 | regulation of lymphocyte proliferation | 83 | 236 | 2.430e-06 |
| GO:BP | GO:0032944 | regulation of mononuclear cell proliferation | 84 | 240 | 2.562e-06 |
| GO:BP | GO:0031341 | regulation of cell killing | 46 | 106 | 2.568e-06 |
| GO:BP | GO:0002684 | positive regulation of immune system process | 284 | 1066 | 2.902e-06 |
| GO:BP | GO:0030317 | flagellated sperm motility | 58 | 147 | 2.965e-06 |
| GO:BP | GO:0097722 | sperm motility | 58 | 147 | 2.965e-06 |
| GO:BP | GO:0048247 | lymphocyte chemotaxis | 32 | 63 | 3.354e-06 |
| GO:BP | GO:0032649 | regulation of type II interferon production | 49 | 117 | 3.559e-06 |
| GO:BP | GO:0043588 | skin development | 105 | 322 | 3.654e-06 |
| GO:BP | GO:0032609 | type II interferon production | 49 | 118 | 4.838e-06 |
| GO:BP | GO:0019585 | glucuronate metabolic process | 18 | 26 | 5.102e-06 |
| GO:BP | GO:0006063 | uronic acid metabolic process | 18 | 26 | 5.102e-06 |
| GO:BP | GO:0007188 | adenylate cyclase-modulating G protein-coupled receptor signaling pathway | 85 | 248 | 5.705e-06 |
| GO:BP | GO:0050776 | regulation of immune response | 243 | 897 | 6.122e-06 |
| GO:BP | GO:0002775 | antimicrobial peptide production | 10 | 10 | 6.776e-06 |
| GO:BP | GO:0140975 | disruption of cellular anatomical structure in another organism | 10 | 10 | 6.776e-06 |
| GO:BP | GO:0019953 | sexual reproduction | 290 | 1103 | 7.052e-06 |
| GO:BP | GO:0007631 | feeding behavior | 45 | 106 | 7.082e-06 |
| GO:BP | GO:0001539 | cilium or flagellum-dependent cell motility | 64 | 172 | 7.376e-06 |
| GO:BP | GO:0060285 | cilium-dependent cell motility | 64 | 172 | 7.376e-06 |
| GO:BP | GO:0002922 | positive regulation of humoral immune response | 16 | 22 | 8.801e-06 |
| GO:BP | GO:0002703 | regulation of leukocyte mediated immunity | 83 | 243 | 8.934e-06 |
| GO:BP | GO:0072676 | lymphocyte migration | 50 | 124 | 9.854e-06 |
| GO:BP | GO:0030101 | natural killer cell activation | 41 | 95 | 1.434e-05 |
| GO:BP | GO:0007259 | cell surface receptor signaling pathway via JAK-STAT | 62 | 168 | 1.566e-05 |
| GO:BP | GO:0010468 | regulation of gene expression | 1231 | 5515 | 1.601e-05 |
| GO:BP | GO:0007342 | fusion of sperm to egg plasma membrane involved in single fertilization | 19 | 30 | 1.685e-05 |
| GO:BP | GO:0007276 | gamete generation | 223 | 822 | 1.685e-05 |
| GO:BP | GO:0022412 | cellular process involved in reproduction in multicellular organism | 124 | 408 | 1.784e-05 |
| GO:BP | GO:0097696 | cell surface receptor signaling pathway via STAT | 64 | 176 | 1.813e-05 |
| GO:BP | GO:0050727 | regulation of inflammatory response | 117 | 381 | 2.093e-05 |
| GO:BP | GO:0048240 | sperm capacitation | 20 | 33 | 2.241e-05 |
| GO:BP | GO:0001909 | leukocyte mediated cytotoxicity | 52 | 135 | 2.922e-05 |
| GO:BP | GO:0042330 | taxis | 137 | 465 | 3.037e-05 |
| GO:BP | GO:0001819 | positive regulation of cytokine production | 142 | 486 | 3.187e-05 |
| GO:BP | GO:0015908 | fatty acid transport | 47 | 118 | 3.220e-05 |
| GO:BP | GO:0071674 | mononuclear cell migration | 79 | 235 | 3.327e-05 |
| GO:BP | GO:0015718 | monocarboxylic acid transport | 64 | 179 | 3.440e-05 |
| GO:BP | GO:0006690 | icosanoid metabolic process | 48 | 122 | 3.689e-05 |
| GO:BP | GO:0032309 | icosanoid secretion | 25 | 48 | 4.224e-05 |
| GO:BP | GO:0042129 | regulation of T cell proliferation | 64 | 180 | 4.227e-05 |
| GO:BP | GO:0007286 | spermatid development | 73 | 214 | 4.564e-05 |
| GO:BP | GO:0007200 | phospholipase C-activating G protein-coupled receptor signaling pathway | 46 | 116 | 4.695e-05 |
| GO:BP | GO:0015732 | prostaglandin transport | 18 | 29 | 4.842e-05 |
| GO:BP | GO:0051873 | killing by host of symbiont cells | 18 | 29 | 4.842e-05 |
| GO:BP | GO:0001817 | regulation of cytokine production | 207 | 765 | 4.892e-05 |
| GO:BP | GO:0007159 | leukocyte cell-cell adhesion | 121 | 404 | 5.096e-05 |
| GO:BP | GO:0009620 | response to fungus | 32 | 70 | 5.455e-05 |
| GO:BP | GO:0002251 | organ or tissue specific immune response | 23 | 43 | 5.998e-05 |
| GO:BP | GO:0001816 | cytokine production | 208 | 772 | 6.150e-05 |
| GO:BP | GO:0006935 | chemotaxis | 135 | 463 | 6.150e-05 |
| GO:BP | GO:0002706 | regulation of lymphocyte mediated immunity | 64 | 182 | 6.150e-05 |
| GO:BP | GO:0050865 | regulation of cell activation | 171 | 616 | 7.851e-05 |
| GO:BP | GO:0050778 | positive regulation of immune response | 198 | 732 | 8.254e-05 |
| GO:BP | GO:0034341 | response to type II interferon | 54 | 147 | 8.849e-05 |
| GO:BP | GO:0002285 | lymphocyte activation involved in immune response | 72 | 214 | 8.885e-05 |
| GO:BP | GO:0098586 | cellular response to virus | 34 | 78 | 9.303e-05 |
| GO:BP | GO:0050953 | sensory perception of light stimulus | 74 | 222 | 9.367e-05 |
| GO:BP | GO:0048515 | spermatid differentiation | 74 | 222 | 9.367e-05 |
| GO:BP | GO:0036230 | granulocyte activation | 25 | 50 | 1.007e-04 |
| GO:BP | GO:0007601 | visual perception | 73 | 219 | 1.084e-04 |
| GO:BP | GO:0051250 | negative regulation of lymphocyte activation | 57 | 159 | 1.093e-04 |
| GO:BP | GO:0001910 | regulation of leukocyte mediated cytotoxicity | 38 | 92 | 1.145e-04 |
| GO:BP | GO:0002694 | regulation of leukocyte activation | 157 | 561 | 1.184e-04 |
| GO:BP | GO:0002760 | positive regulation of antimicrobial humoral response | 8 | 8 | 1.237e-04 |
| GO:BP | GO:0002778 | antibacterial peptide production | 8 | 8 | 1.237e-04 |
| GO:BP | GO:0002784 | regulation of antimicrobial peptide production | 8 | 8 | 1.237e-04 |
| GO:BP | GO:0002443 | leukocyte mediated immunity | 133 | 461 | 1.239e-04 |
| GO:BP | GO:0042531 | positive regulation of tyrosine phosphorylation of STAT protein | 29 | 63 | 1.296e-04 |
| GO:BP | GO:0002385 | mucosal immune response | 21 | 39 | 1.355e-04 |
| GO:BP | GO:0042119 | neutrophil activation | 22 | 42 | 1.433e-04 |
| GO:BP | GO:0032689 | negative regulation of type II interferon production | 22 | 42 | 1.433e-04 |
| GO:BP | GO:0002920 | regulation of humoral immune response | 23 | 45 | 1.480e-04 |
| GO:BP | GO:0051249 | regulation of lymphocyte activation | 141 | 497 | 1.646e-04 |
| GO:BP | GO:0071346 | cellular response to type II interferon | 47 | 125 | 1.725e-04 |
| GO:BP | GO:0002286 | T cell activation involved in immune response | 47 | 125 | 1.725e-04 |
| GO:BP | GO:0006805 | xenobiotic metabolic process | 47 | 125 | 1.725e-04 |
| GO:BP | GO:0007204 | positive regulation of cytosolic calcium ion concentration | 59 | 169 | 1.783e-04 |
| GO:BP | GO:0045026 | plasma membrane fusion | 19 | 34 | 1.852e-04 |
| GO:BP | GO:1903037 | regulation of leukocyte cell-cell adhesion | 109 | 366 | 1.921e-04 |
| GO:BP | GO:0042363 | fat-soluble vitamin catabolic process | 10 | 12 | 2.025e-04 |
| GO:BP | GO:0046649 | lymphocyte activation | 208 | 787 | 2.146e-04 |
| GO:BP | GO:0070665 | positive regulation of leukocyte proliferation | 57 | 163 | 2.373e-04 |
| GO:BP | GO:0009584 | detection of visible light | 18 | 32 | 2.865e-04 |
| GO:BP | GO:0010556 | regulation of macromolecule biosynthetic process | 1238 | 5633 | 2.971e-04 |
| GO:BP | GO:0032722 | positive regulation of chemokine production | 31 | 72 | 3.070e-04 |
| GO:BP | GO:0070374 | positive regulation of ERK1 and ERK2 cascade | 69 | 210 | 3.102e-04 |
| GO:BP | GO:0032642 | regulation of chemokine production | 38 | 96 | 3.356e-04 |
| GO:BP | GO:0032602 | chemokine production | 38 | 96 | 3.356e-04 |
| GO:BP | GO:0002685 | regulation of leukocyte migration | 74 | 230 | 3.391e-04 |
| GO:BP | GO:0050863 | regulation of T cell activation | 110 | 375 | 3.516e-04 |
| GO:BP | GO:0050868 | negative regulation of T cell activation | 46 | 125 | 3.931e-04 |
| GO:BP | GO:1903038 | negative regulation of leukocyte cell-cell adhesion | 49 | 136 | 3.991e-04 |
| GO:BP | GO:0002695 | negative regulation of leukocyte activation | 62 | 185 | 4.263e-04 |
| GO:BP | GO:0003341 | cilium movement | 69 | 212 | 4.284e-04 |
| GO:BP | GO:0042110 | T cell activation | 153 | 558 | 4.571e-04 |
| GO:BP | GO:0015670 | carbon dioxide transport | 11 | 15 | 5.153e-04 |
| GO:BP | GO:0030855 | epithelial cell differentiation | 195 | 741 | 5.213e-04 |
| GO:BP | GO:0002225 | positive regulation of antimicrobial peptide production | 7 | 7 | 5.269e-04 |
| GO:BP | GO:0052697 | xenobiotic glucuronidation | 7 | 7 | 5.269e-04 |
| GO:BP | GO:0019755 | one-carbon compound transport | 15 | 25 | 5.456e-04 |
| GO:BP | GO:0042509 | regulation of tyrosine phosphorylation of STAT protein | 31 | 74 | 5.586e-04 |
| GO:BP | GO:0032945 | negative regulation of mononuclear cell proliferation | 35 | 88 | 6.260e-04 |
| GO:BP | GO:0042102 | positive regulation of T cell proliferation | 39 | 102 | 6.260e-04 |
| GO:BP | GO:1904892 | regulation of receptor signaling pathway via STAT | 40 | 106 | 7.014e-04 |
| GO:BP | GO:0046425 | regulation of receptor signaling pathway via JAK-STAT | 38 | 99 | 7.157e-04 |
| GO:BP | GO:0002759 | regulation of antimicrobial humoral response | 9 | 11 | 7.523e-04 |
| GO:BP | GO:0007189 | adenylate cyclase-activating G protein-coupled receptor signaling pathway | 54 | 158 | 7.761e-04 |
| GO:BP | GO:0050671 | positive regulation of lymphocyte proliferation | 50 | 143 | 7.761e-04 |
| GO:BP | GO:0070664 | negative regulation of leukocyte proliferation | 37 | 96 | 8.104e-04 |
| GO:BP | GO:0030277 | maintenance of gastrointestinal epithelium | 14 | 23 | 8.118e-04 |
| GO:BP | GO:0003006 | developmental process involved in reproduction | 257 | 1022 | 8.286e-04 |
| GO:BP | GO:0032613 | interleukin-10 production | 26 | 59 | 8.894e-04 |
| GO:BP | GO:0032653 | regulation of interleukin-10 production | 26 | 59 | 8.894e-04 |
| GO:BP | GO:0007260 | tyrosine phosphorylation of STAT protein | 31 | 76 | 9.966e-04 |
| GO:BP | GO:0032637 | interleukin-8 production | 33 | 83 | 1.030e-03 |
| GO:BP | GO:0032677 | regulation of interleukin-8 production | 33 | 83 | 1.030e-03 |
| GO:BP | GO:0032757 | positive regulation of interleukin-8 production | 27 | 63 | 1.130e-03 |
| GO:BP | GO:0002673 | regulation of acute inflammatory response | 22 | 47 | 1.171e-03 |
| GO:BP | GO:0050672 | negative regulation of lymphocyte proliferation | 34 | 87 | 1.182e-03 |
| GO:BP | GO:0050482 | arachidonate secretion | 17 | 32 | 1.192e-03 |
| GO:BP | GO:0006691 | leukotriene metabolic process | 17 | 32 | 1.192e-03 |
| GO:BP | GO:1903963 | arachidonate transport | 17 | 32 | 1.192e-03 |
| GO:BP | GO:0002687 | positive regulation of leukocyte migration | 52 | 153 | 1.220e-03 |
| GO:BP | GO:0032946 | positive regulation of mononuclear cell proliferation | 50 | 146 | 1.361e-03 |
| GO:BP | GO:0009889 | regulation of biosynthetic process | 1261 | 5795 | 1.384e-03 |
| GO:BP | GO:0002705 | positive regulation of leukocyte mediated immunity | 50 | 147 | 1.653e-03 |
| GO:BP | GO:0042098 | T cell proliferation | 67 | 213 | 1.665e-03 |
| GO:BP | GO:0009111 | vitamin catabolic process | 10 | 14 | 1.665e-03 |
| GO:BP | GO:0007602 | phototransduction | 22 | 48 | 1.679e-03 |
| GO:BP | GO:0009583 | detection of light stimulus | 28 | 68 | 1.847e-03 |
| GO:BP | GO:0071466 | cellular response to xenobiotic stimulus | 62 | 194 | 1.847e-03 |
| GO:BP | GO:0048519 | negative regulation of biological process | 1273 | 5865 | 1.948e-03 |
| GO:BP | GO:0007281 | germ cell development | 105 | 370 | 2.077e-03 |
| GO:BP | GO:0051552 | flavone metabolic process | 6 | 6 | 2.251e-03 |
| GO:BP | GO:1901317 | regulation of flagellated sperm motility | 13 | 22 | 2.251e-03 |
| GO:BP | GO:0002786 | regulation of antibacterial peptide production | 6 | 6 | 2.251e-03 |
| GO:BP | GO:0051673 | disruption of plasma membrane integrity in another organism | 6 | 6 | 2.251e-03 |
| GO:BP | GO:0032655 | regulation of interleukin-12 production | 26 | 62 | 2.262e-03 |
| GO:BP | GO:0032615 | interleukin-12 production | 26 | 62 | 2.262e-03 |
| GO:BP | GO:0032735 | positive regulation of interleukin-12 production | 20 | 43 | 2.735e-03 |
| GO:BP | GO:0002227 | innate immune response in mucosa | 15 | 28 | 2.833e-03 |
| GO:BP | GO:0031343 | positive regulation of cell killing | 29 | 73 | 2.833e-03 |
| GO:BP | GO:1902221 | erythrose 4-phosphate/phosphoenolpyruvate family amino acid metabolic process | 15 | 28 | 2.833e-03 |
| GO:BP | GO:0060295 | regulation of cilium movement involved in cell motility | 16 | 31 | 2.946e-03 |
| GO:BP | GO:1902019 | regulation of cilium-dependent cell motility | 16 | 31 | 2.946e-03 |
| GO:BP | GO:0042113 | B cell activation | 83 | 282 | 2.979e-03 |
| GO:BP | GO:0035036 | sperm-egg recognition | 23 | 53 | 3.039e-03 |
| GO:BP | GO:0032760 | positive regulation of tumor necrosis factor production | 37 | 102 | 3.171e-03 |
| GO:BP | GO:0031347 | regulation of defense response | 199 | 783 | 3.171e-03 |
| GO:BP | GO:0050729 | positive regulation of inflammatory response | 49 | 147 | 3.178e-03 |
| GO:BP | GO:0032101 | regulation of response to external stimulus | 263 | 1071 | 3.242e-03 |
| GO:BP | GO:0002715 | regulation of natural killer cell mediated immunity | 22 | 50 | 3.287e-03 |
| GO:BP | GO:0002544 | chronic inflammatory response | 12 | 20 | 3.327e-03 |
| GO:BP | GO:0071347 | cellular response to interleukin-1 | 38 | 106 | 3.346e-03 |
| GO:BP | GO:1903557 | positive regulation of tumor necrosis factor superfamily cytokine production | 38 | 106 | 3.346e-03 |
| GO:BP | GO:0032652 | regulation of interleukin-1 production | 39 | 110 | 3.566e-03 |
| GO:BP | GO:0032612 | interleukin-1 production | 39 | 110 | 3.566e-03 |
| GO:BP | GO:0001818 | negative regulation of cytokine production | 84 | 288 | 3.652e-03 |
| GO:BP | GO:0050866 | negative regulation of cell activation | 64 | 207 | 3.794e-03 |
| GO:BP | GO:0015669 | gas transport | 13 | 23 | 3.873e-03 |
| GO:BP | GO:0032680 | regulation of tumor necrosis factor production | 53 | 164 | 4.006e-03 |
| GO:BP | GO:0032733 | positive regulation of interleukin-10 production | 19 | 41 | 4.006e-03 |
| GO:BP | GO:0032640 | tumor necrosis factor production | 53 | 164 | 4.006e-03 |
| GO:BP | GO:0009072 | aromatic amino acid metabolic process | 19 | 41 | 4.006e-03 |
| GO:BP | GO:0060259 | regulation of feeding behavior | 14 | 26 | 4.204e-03 |
| GO:BP | GO:0042755 | eating behavior | 18 | 38 | 4.204e-03 |
| GO:BP | GO:0002825 | regulation of T-helper 1 type immune response | 16 | 32 | 4.434e-03 |
| GO:BP | GO:0009988 | cell-cell recognition | 29 | 75 | 4.561e-03 |
| GO:BP | GO:0071345 | cellular response to cytokine stimulus | 211 | 843 | 4.722e-03 |
| GO:BP | GO:0071706 | tumor necrosis factor superfamily cytokine production | 54 | 169 | 4.722e-03 |
| GO:BP | GO:1903555 | regulation of tumor necrosis factor superfamily cytokine production | 54 | 169 | 4.722e-03 |
| GO:BP | GO:0002698 | negative regulation of immune effector process | 41 | 120 | 5.800e-03 |
| GO:BP | GO:0032103 | positive regulation of response to external stimulus | 160 | 619 | 5.831e-03 |
| GO:BP | GO:0002228 | natural killer cell mediated immunity | 29 | 76 | 5.859e-03 |
| GO:BP | GO:0006968 | cellular defense response | 22 | 52 | 6.103e-03 |
| GO:BP | GO:0044058 | regulation of digestive system process | 18 | 39 | 6.143e-03 |
| GO:BP | GO:0030183 | B cell differentiation | 51 | 159 | 6.256e-03 |
| GO:BP | GO:0070555 | response to interleukin-1 | 44 | 132 | 6.378e-03 |
| GO:BP | GO:0050891 | multicellular organismal-level water homeostasis | 16 | 33 | 6.736e-03 |
| GO:BP | GO:0042832 | defense response to protozoan | 14 | 27 | 6.782e-03 |
| GO:BP | GO:0015671 | oxygen transport | 10 | 16 | 7.332e-03 |
| GO:BP | GO:0007187 | G protein-coupled receptor signaling pathway, coupled to cyclic nucleotide second messenger | 23 | 56 | 7.332e-03 |
| GO:BP | GO:0034374 | low-density lipoprotein particle remodeling | 10 | 16 | 7.332e-03 |
| GO:BP | GO:0022407 | regulation of cell-cell adhesion | 127 | 478 | 7.559e-03 |
| GO:BP | GO:0002444 | myeloid leukocyte mediated immunity | 39 | 114 | 7.636e-03 |
| GO:BP | GO:0008037 | cell recognition | 50 | 157 | 8.438e-03 |
| GO:BP | GO:0072678 | T cell migration | 28 | 74 | 8.473e-03 |
| GO:BP | GO:0120254 | olefinic compound metabolic process | 51 | 161 | 8.473e-03 |
| GO:BP | GO:0042436 | indole-containing compound catabolic process | 7 | 9 | 9.139e-03 |
| GO:BP | GO:0006569 | tryptophan catabolic process | 7 | 9 | 9.139e-03 |
| GO:BP | GO:0002275 | myeloid cell activation involved in immune response | 35 | 100 | 9.235e-03 |
| GO:BP | GO:0002803 | positive regulation of antibacterial peptide production | 5 | 5 | 9.235e-03 |
| GO:BP | GO:0009581 | detection of external stimulus | 46 | 142 | 9.235e-03 |
| GO:BP | GO:0052696 | flavonoid glucuronidation | 5 | 5 | 9.235e-03 |
| GO:BP | GO:0019369 | arachidonate metabolic process | 23 | 57 | 9.561e-03 |
| GO:BP | GO:0002688 | regulation of leukocyte chemotaxis | 41 | 123 | 9.712e-03 |
| GO:BP | GO:0030431 | sleep | 12 | 22 | 9.851e-03 |
| GO:BP | GO:0032651 | regulation of interleukin-1 beta production | 33 | 93 | 9.917e-03 |
| GO:BP | GO:0055078 | sodium ion homeostasis | 20 | 47 | 9.917e-03 |
| GO:BP | GO:0032611 | interleukin-1 beta production | 33 | 93 | 9.917e-03 |
| GO:BP | GO:0007198 | adenylate cyclase-inhibiting serotonin receptor signaling pathway | 6 | 7 | 1.046e-02 |
| GO:BP | GO:0050795 | regulation of behavior | 28 | 75 | 1.046e-02 |
| GO:BP | GO:0010273 | detoxification of copper ion | 9 | 14 | 1.054e-02 |
| GO:BP | GO:0070942 | neutrophil mediated cytotoxicity | 9 | 14 | 1.054e-02 |
| GO:BP | GO:0034116 | positive regulation of heterotypic cell-cell adhesion | 9 | 14 | 1.054e-02 |
| GO:BP | GO:1990169 | stress response to copper ion | 9 | 14 | 1.054e-02 |
| GO:BP | GO:0043330 | response to exogenous dsRNA | 21 | 51 | 1.193e-02 |
| GO:BP | GO:0044706 | multi-multicellular organism process | 63 | 212 | 1.215e-02 |
| GO:BP | GO:0001523 | retinoid metabolic process | 30 | 83 | 1.228e-02 |
| GO:BP | GO:0032729 | positive regulation of type II interferon production | 28 | 76 | 1.312e-02 |
| GO:BP | GO:0034097 | response to cytokine | 228 | 937 | 1.314e-02 |
| GO:BP | GO:0006775 | fat-soluble vitamin metabolic process | 20 | 48 | 1.330e-02 |
| GO:BP | GO:0008228 | opsonization | 10 | 17 | 1.330e-02 |
| GO:BP | GO:0050766 | positive regulation of phagocytosis | 26 | 69 | 1.364e-02 |
| GO:BP | GO:0002709 | regulation of T cell mediated immunity | 33 | 95 | 1.470e-02 |
| GO:BP | GO:0002449 | lymphocyte mediated immunity | 98 | 361 | 1.513e-02 |
| GO:BP | GO:0032661 | regulation of interleukin-18 production | 8 | 12 | 1.545e-02 |
| GO:BP | GO:0018149 | peptide cross-linking | 14 | 29 | 1.545e-02 |
| GO:BP | GO:0070943 | neutrophil-mediated killing of symbiont cell | 8 | 12 | 1.545e-02 |
| GO:BP | GO:0032621 | interleukin-18 production | 8 | 12 | 1.545e-02 |
| GO:BP | GO:0001912 | positive regulation of leukocyte mediated cytotoxicity | 25 | 66 | 1.549e-02 |
| GO:BP | GO:0042445 | hormone metabolic process | 70 | 243 | 1.549e-02 |
| GO:BP | GO:0098581 | detection of external biotic stimulus | 13 | 26 | 1.571e-02 |
| GO:BP | GO:0016101 | diterpenoid metabolic process | 31 | 88 | 1.584e-02 |
| GO:BP | GO:1901652 | response to peptide | 230 | 950 | 1.603e-02 |
| GO:BP | GO:0042116 | macrophage activation | 36 | 107 | 1.629e-02 |
| GO:BP | GO:0051607 | defense response to virus | 86 | 311 | 1.666e-02 |
| GO:BP | GO:0031349 | positive regulation of defense response | 126 | 484 | 1.670e-02 |
| GO:BP | GO:0044703 | multi-organism reproductive process | 60 | 203 | 1.791e-02 |
| GO:BP | GO:0050867 | positive regulation of cell activation | 100 | 372 | 1.845e-02 |
| GO:BP | GO:0042269 | regulation of natural killer cell mediated cytotoxicity | 19 | 46 | 1.967e-02 |
| GO:BP | GO:0141005 | transposable element silencing by heterochromatin formation | 9 | 15 | 2.007e-02 |
| GO:BP | GO:0002819 | regulation of adaptive immune response | 60 | 204 | 2.027e-02 |
| GO:BP | GO:0010669 | epithelial structure maintenance | 15 | 33 | 2.106e-02 |
| GO:BP | GO:0042573 | retinoic acid metabolic process | 15 | 33 | 2.106e-02 |
| GO:BP | GO:0002700 | regulation of production of molecular mediator of immune response | 56 | 188 | 2.117e-02 |
| GO:BP | GO:0008343 | adult feeding behavior | 7 | 10 | 2.169e-02 |
| GO:BP | GO:0071947 | protein deubiquitination involved in ubiquitin-dependent protein catabolic process | 7 | 10 | 2.169e-02 |
| GO:BP | GO:0035747 | natural killer cell chemotaxis | 7 | 10 | 2.169e-02 |
| GO:BP | GO:0048523 | negative regulation of cellular process | 1209 | 5646 | 2.169e-02 |
| GO:BP | GO:0001562 | response to protozoan | 14 | 30 | 2.230e-02 |
| GO:BP | GO:0006869 | lipid transport | 113 | 431 | 2.256e-02 |
| GO:BP | GO:0019373 | epoxygenase P450 pathway | 10 | 18 | 2.256e-02 |
| GO:BP | GO:0046456 | icosanoid biosynthetic process | 22 | 57 | 2.269e-02 |
| GO:BP | GO:0002675 | positive regulation of acute inflammatory response | 13 | 27 | 2.330e-02 |
| GO:BP | GO:0002577 | regulation of antigen processing and presentation | 11 | 21 | 2.357e-02 |
| GO:BP | GO:0002822 | regulation of adaptive immune response based on somatic recombination of immune receptors built from immunoglobulin superfamily domains | 56 | 189 | 2.357e-02 |
| GO:BP | GO:0002523 | leukocyte migration involved in inflammatory response | 11 | 21 | 2.357e-02 |
| GO:BP | GO:0022408 | negative regulation of cell-cell adhesion | 56 | 189 | 2.357e-02 |
| GO:BP | GO:0009074 | aromatic amino acid family catabolic process | 12 | 24 | 2.367e-02 |
| GO:BP | GO:0002708 | positive regulation of lymphocyte mediated immunity | 40 | 125 | 2.419e-02 |
| GO:BP | GO:0009582 | detection of abiotic stimulus | 45 | 145 | 2.498e-02 |
| GO:BP | GO:0042130 | negative regulation of T cell proliferation | 26 | 72 | 2.572e-02 |
| GO:BP | GO:0010817 | regulation of hormone levels | 139 | 548 | 2.650e-02 |
| GO:BP | GO:0002768 | immune response-regulating cell surface receptor signaling pathway | 90 | 334 | 2.845e-02 |
| GO:BP | GO:0002690 | positive regulation of leukocyte chemotaxis | 32 | 95 | 2.859e-02 |
| GO:BP | GO:0002701 | negative regulation of production of molecular mediator of immune response | 18 | 44 | 2.861e-02 |
| GO:BP | GO:0032741 | positive regulation of interleukin-18 production | 6 | 8 | 2.932e-02 |
| GO:BP | GO:0070268 | cornification | 6 | 8 | 2.932e-02 |
| GO:BP | GO:2000501 | regulation of natural killer cell chemotaxis | 6 | 8 | 2.932e-02 |
| GO:BP | GO:0060456 | positive regulation of digestive system process | 8 | 13 | 2.948e-02 |
| GO:BP | GO:1900015 | regulation of cytokine production involved in inflammatory response | 23 | 62 | 3.141e-02 |
| GO:BP | GO:0002534 | cytokine production involved in inflammatory response | 23 | 62 | 3.141e-02 |
| GO:BP | GO:0042267 | natural killer cell mediated cytotoxicity | 26 | 73 | 3.153e-02 |
| GO:BP | GO:0002683 | negative regulation of immune system process | 128 | 502 | 3.217e-02 |
| GO:BP | GO:0060046 | regulation of acrosome reaction | 9 | 16 | 3.408e-02 |
| GO:BP | GO:0002704 | negative regulation of leukocyte mediated immunity | 24 | 66 | 3.408e-02 |
| GO:BP | GO:0035821 | modulation of process of another organism | 9 | 16 | 3.408e-02 |
| GO:BP | GO:0072378 | blood coagulation, fibrin clot formation | 9 | 16 | 3.408e-02 |
| GO:BP | GO:0051969 | regulation of transmission of nerve impulse | 9 | 16 | 3.408e-02 |
| GO:BP | GO:0050878 | regulation of body fluid levels | 98 | 371 | 3.419e-02 |
| GO:BP | GO:0042320 | regulation of circadian sleep/wake cycle, REM sleep | 4 | 4 | 3.485e-02 |
| GO:BP | GO:0002325 | natural killer cell differentiation involved in immune response | 4 | 4 | 3.485e-02 |
| GO:BP | GO:0048520 | positive regulation of behavior | 12 | 25 | 3.485e-02 |
| GO:BP | GO:0042747 | circadian sleep/wake cycle, REM sleep | 4 | 4 | 3.485e-02 |
| GO:BP | GO:0036101 | leukotriene B4 catabolic process | 4 | 4 | 3.485e-02 |
| GO:BP | GO:0042430 | indole-containing compound metabolic process | 12 | 25 | 3.485e-02 |
| GO:BP | GO:0042377 | vitamin K catabolic process | 4 | 4 | 3.485e-02 |
| GO:BP | GO:0042376 | phylloquinone catabolic process | 4 | 4 | 3.485e-02 |
| GO:BP | GO:0045938 | positive regulation of circadian sleep/wake cycle, sleep | 4 | 4 | 3.485e-02 |
| GO:BP | GO:0042374 | phylloquinone metabolic process | 4 | 4 | 3.485e-02 |
| GO:BP | GO:0036100 | leukotriene catabolic process | 5 | 6 | 3.485e-02 |
| GO:BP | GO:0044278 | disruption of cell wall in another organism | 4 | 4 | 3.485e-02 |
| GO:BP | GO:0097272 | ammonium homeostasis | 5 | 6 | 3.485e-02 |
| GO:BP | GO:0034382 | chylomicron remnant clearance | 5 | 6 | 3.485e-02 |
| GO:BP | GO:0097501 | stress response to metal ion | 10 | 19 | 3.485e-02 |
| GO:BP | GO:0072376 | protein activation cascade | 10 | 19 | 3.485e-02 |
| GO:BP | GO:0019370 | leukotriene biosynthetic process | 10 | 19 | 3.485e-02 |
| GO:BP | GO:0098543 | detection of other organism | 10 | 19 | 3.485e-02 |
| GO:BP | GO:0019805 | quinolinate biosynthetic process | 4 | 4 | 3.485e-02 |
| GO:BP | GO:0035743 | CD4-positive, alpha-beta T cell cytokine production | 10 | 19 | 3.485e-02 |
| GO:BP | GO:0060480 | lung goblet cell differentiation | 4 | 4 | 3.485e-02 |
| GO:BP | GO:0032826 | regulation of natural killer cell differentiation involved in immune response | 4 | 4 | 3.485e-02 |
| GO:BP | GO:0051464 | positive regulation of cortisol secretion | 4 | 4 | 3.485e-02 |
| GO:BP | GO:0002827 | positive regulation of T-helper 1 type immune response | 10 | 19 | 3.485e-02 |
| GO:BP | GO:2000851 | positive regulation of glucocorticoid secretion | 4 | 4 | 3.485e-02 |
| GO:BP | GO:2000503 | positive regulation of natural killer cell chemotaxis | 5 | 6 | 3.485e-02 |
| GO:BP | GO:0002456 | T cell mediated immunity | 39 | 124 | 3.533e-02 |
| GO:BP | GO:0030098 | lymphocyte differentiation | 113 | 438 | 3.570e-02 |
| GO:BP | GO:0140962 | multicellular organismal-level chemical homeostasis | 26 | 74 | 3.612e-02 |
| GO:BP | GO:0002696 | positive regulation of leukocyte activation | 94 | 355 | 3.613e-02 |
| GO:BP | GO:0034105 | positive regulation of tissue remodeling | 7 | 11 | 4.159e-02 |
| GO:BP | GO:0021562 | vestibulocochlear nerve development | 7 | 11 | 4.159e-02 |
| GO:BP | GO:0032372 | negative regulation of sterol transport | 7 | 11 | 4.159e-02 |
| GO:BP | GO:0032375 | negative regulation of cholesterol transport | 7 | 11 | 4.159e-02 |
| GO:BP | GO:1903027 | regulation of opsonization | 7 | 11 | 4.159e-02 |
| GO:BP | GO:0070944 | neutrophil-mediated killing of bacterium | 7 | 11 | 4.159e-02 |
| GO:BP | GO:0032732 | positive regulation of interleukin-1 production | 25 | 71 | 4.166e-02 |
| GO:BP | GO:0032731 | positive regulation of interleukin-1 beta production | 22 | 60 | 4.209e-02 |
| GO:BP | GO:0046942 | carboxylic acid transport | 91 | 344 | 4.277e-02 |
| GO:BP | GO:0002440 | production of molecular mediator of immune response | 62 | 220 | 4.368e-02 |
| GO:BP | GO:1903039 | positive regulation of leukocyte cell-cell adhesion | 74 | 271 | 4.404e-02 |
| GO:BP | GO:0032814 | regulation of natural killer cell activation | 16 | 39 | 4.443e-02 |
| GO:BP | GO:0006910 | phagocytosis, recognition | 13 | 29 | 4.443e-02 |
| GO:BP | GO:0015849 | organic acid transport | 91 | 345 | 4.636e-02 |
| GO:BP | GO:0022409 | positive regulation of cell-cell adhesion | 85 | 319 | 4.654e-02 |
| GO:BP | GO:0002430 | complement receptor mediated signaling pathway | 8 | 14 | 4.950e-02 |
| KEGG | KEGG:04740 | Olfactory transduction | 368 | 428 | 7.954e-184 |
| KEGG | KEGG:04060 | Cytokine-cytokine receptor interaction | 148 | 291 | 9.354e-26 |
| KEGG | KEGG:04080 | Neuroactive ligand-receptor interaction | 173 | 365 | 9.354e-26 |
| KEGG | KEGG:05206 | MicroRNAs in cancer | 146 | 310 | 2.799e-21 |
| KEGG | KEGG:05150 | Staphylococcus aureus infection | 58 | 86 | 1.424e-17 |
| KEGG | KEGG:04061 | Viral protein interaction with cytokine and cytokine receptor | 59 | 98 | 1.828e-14 |
| KEGG | KEGG:04742 | Taste transduction | 46 | 85 | 4.526e-09 |
| KEGG | KEGG:05320 | Autoimmune thyroid disease | 32 | 49 | 4.526e-09 |
| KEGG | KEGG:00830 | Retinol metabolism | 39 | 68 | 1.056e-08 |
| KEGG | KEGG:00980 | Metabolism of xenobiotics by cytochrome P450 | 38 | 74 | 1.027e-06 |
| KEGG | KEGG:04640 | Hematopoietic cell lineage | 44 | 92 | 1.236e-06 |
| KEGG | KEGG:05204 | Chemical carcinogenesis - DNA adducts | 35 | 67 | 1.708e-06 |
| KEGG | KEGG:05310 | Asthma | 19 | 27 | 2.846e-06 |
| KEGG | KEGG:04672 | Intestinal immune network for IgA production | 26 | 44 | 2.846e-06 |
| KEGG | KEGG:00982 | Drug metabolism - cytochrome P450 | 34 | 68 | 8.326e-06 |
| KEGG | KEGG:05323 | Rheumatoid arthritis | 40 | 88 | 1.881e-05 |
| KEGG | KEGG:00053 | Ascorbate and aldarate metabolism | 19 | 30 | 2.755e-05 |
| KEGG | KEGG:04630 | JAK-STAT signaling pathway | 62 | 162 | 3.659e-05 |
| KEGG | KEGG:05332 | Graft-versus-host disease | 21 | 37 | 8.608e-05 |
| KEGG | KEGG:00591 | Linoleic acid metabolism | 18 | 30 | 1.351e-04 |
| KEGG | KEGG:00590 | Arachidonic acid metabolism | 29 | 61 | 1.530e-04 |
| KEGG | KEGG:04976 | Bile secretion | 38 | 89 | 1.598e-04 |
| KEGG | KEGG:05322 | Systemic lupus erythematosus | 51 | 132 | 1.676e-04 |
| KEGG | KEGG:00140 | Steroid hormone biosynthesis | 29 | 62 | 1.909e-04 |
| KEGG | KEGG:05321 | Inflammatory bowel disease | 29 | 62 | 1.909e-04 |
| KEGG | KEGG:05144 | Malaria | 24 | 49 | 3.872e-04 |
| KEGG | KEGG:00040 | Pentose and glucuronate interconversions | 19 | 36 | 6.806e-04 |
| KEGG | KEGG:05330 | Allograft rejection | 18 | 34 | 9.773e-04 |
| KEGG | KEGG:00592 | alpha-Linolenic acid metabolism | 15 | 26 | 1.019e-03 |
| KEGG | KEGG:04650 | Natural killer cell mediated cytotoxicity | 45 | 124 | 2.337e-03 |
| KEGG | KEGG:04975 | Fat digestion and absorption | 20 | 43 | 3.383e-03 |
| KEGG | KEGG:04940 | Type I diabetes mellitus | 19 | 40 | 3.383e-03 |
| KEGG | KEGG:05340 | Primary immunodeficiency | 18 | 37 | 3.383e-03 |
| KEGG | KEGG:05164 | Influenza A | 56 | 167 | 4.074e-03 |
| KEGG | KEGG:04610 | Complement and coagulation cascades | 33 | 86 | 4.297e-03 |
| KEGG | KEGG:05152 | Tuberculosis | 58 | 175 | 4.297e-03 |
| KEGG | KEGG:05143 | African trypanosomiasis | 17 | 36 | 6.533e-03 |
| KEGG | KEGG:00350 | Tyrosine metabolism | 17 | 36 | 6.533e-03 |
| KEGG | KEGG:04514 | Cell adhesion molecules | 51 | 153 | 7.350e-03 |
| KEGG | KEGG:00983 | Drug metabolism - other enzymes | 30 | 79 | 8.217e-03 |
| KEGG | KEGG:00860 | Porphyrin metabolism | 19 | 43 | 8.340e-03 |
| KEGG | KEGG:04620 | Toll-like receptor signaling pathway | 37 | 106 | 1.339e-02 |
| KEGG | KEGG:04972 | Pancreatic secretion | 35 | 102 | 2.385e-02 |
| KEGG | KEGG:04950 | Maturity onset diabetes of the young | 12 | 26 | 4.247e-02 |
#write.csv(tableNR, "output/table_NRmotif.csv")

#GO:BP
tableNR_GOBP_pp <- tableNR_pp %>%
  dplyr::filter(source=="GO:BP") %>%
  dplyr::select(p_value, term_name, intersection_size) %>%
  dplyr::slice_min(., n=10, order_by=p_value) %>%
  mutate(log_val = -log10(p_value))

#saveRDS(tableNR_GOBP_pp, "data/tableNR_GOBP_postprob.RDS")

tableNR_GOBP_pp %>% ggplot(., aes(x = log_val, y = reorder(term_name, p_value), col= intersection_size)) +
  geom_point(aes(size = intersection_size)) +
  ggtitle("No Response Enriched GO:BP Terms")+
  xlab(expression("-log"[10]~"p-value"))+
  guides(col="none", size= guide_legend(title = "# of intersected \n terms"))+
  ylab("GO:BP term")+
  scale_y_discrete(labels = scales::label_wrap(30))+
  theme_bw()+
  theme(plot.title = element_text(size = rel(1.5), hjust = 0.5),
        axis.title = element_text(size = 15, colour = "black"),
        axis.ticks = element_line(linewidth = 1.5),
        axis.line = element_line(linewidth = 1.5),
        axis.text = element_text(size = 10, colour = "black", angle = 0),
        strip.text = element_text(size = 15, colour = "black", face = "bold"))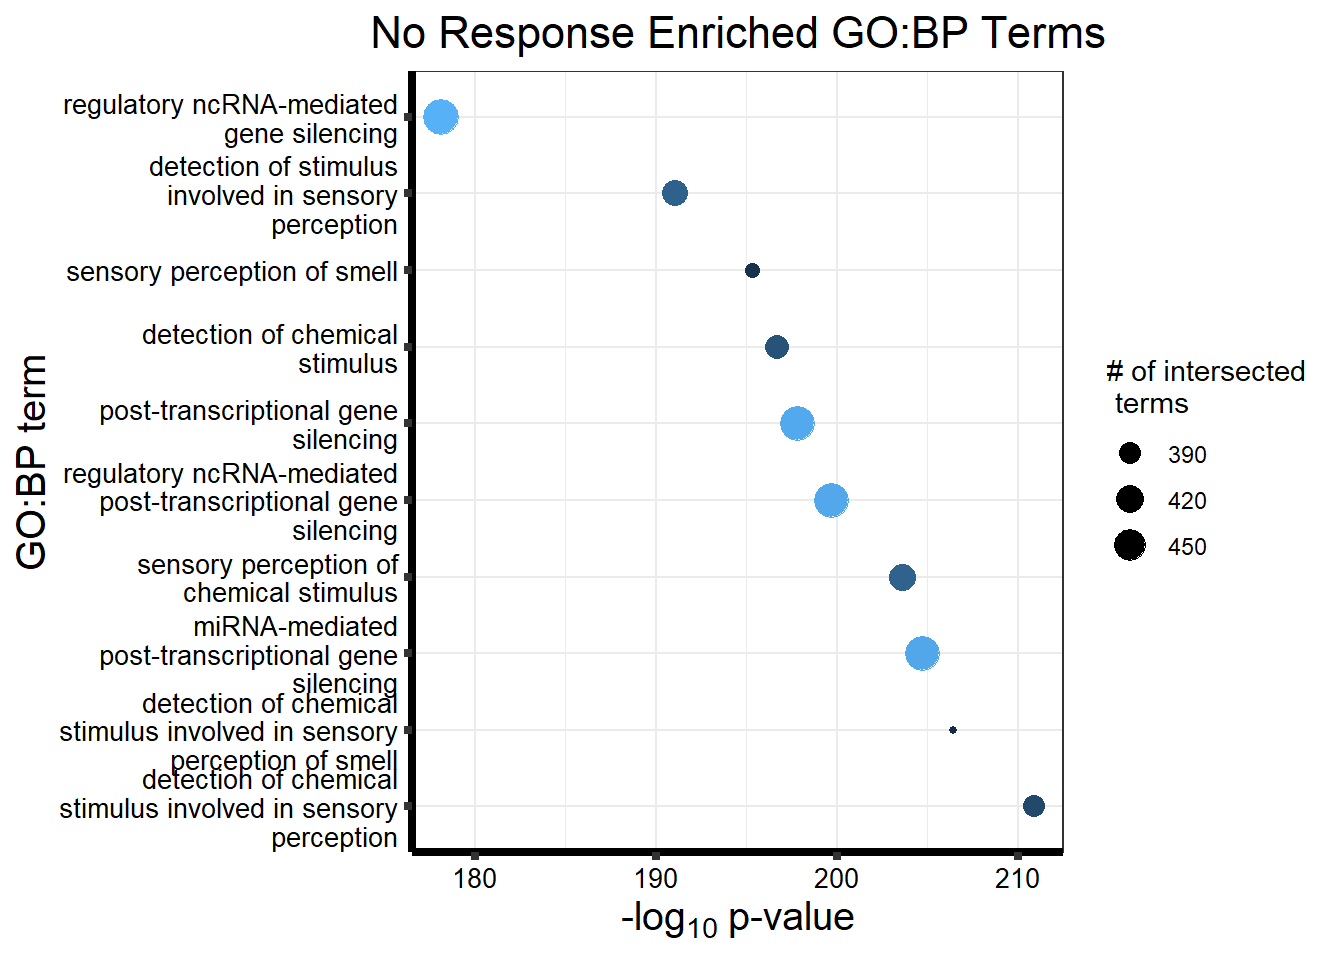
#KEGG
tableNR_KEGG_pp <- tableNR_pp %>%
  dplyr::filter(source=="KEGG") %>%
  dplyr::select(p_value, term_name, intersection_size) %>%
  dplyr::slice_min(., n=10, order_by=p_value) %>%
  mutate(log_val = -log10(p_value))

tableNR_KEGG_pp %>% ggplot(., aes(x = log_val, y = reorder(term_name, p_value), col= intersection_size)) +
  geom_point(aes(size = intersection_size)) +
  ggtitle("No Response Enriched KEGG Terms")+
  xlab(expression("-log"[10]~"p-value"))+
  guides(col="none", size= guide_legend(title = "# of intersected \n terms"))+
  ylab("KEGG term")+
  scale_y_discrete(labels = scales::label_wrap(30))+
  theme_bw()+
  theme(plot.title = element_text(size = rel(1.5), hjust = 0.5),
        axis.title = element_text(size = 15, colour = "black"),
        axis.ticks = element_line(linewidth = 1.5),
        axis.line = element_line(linewidth = 1.5),
        axis.text = element_text(size = 10, colour = "black", angle = 0),
        strip.text = element_text(size = 15, colour = "black", face = "bold"))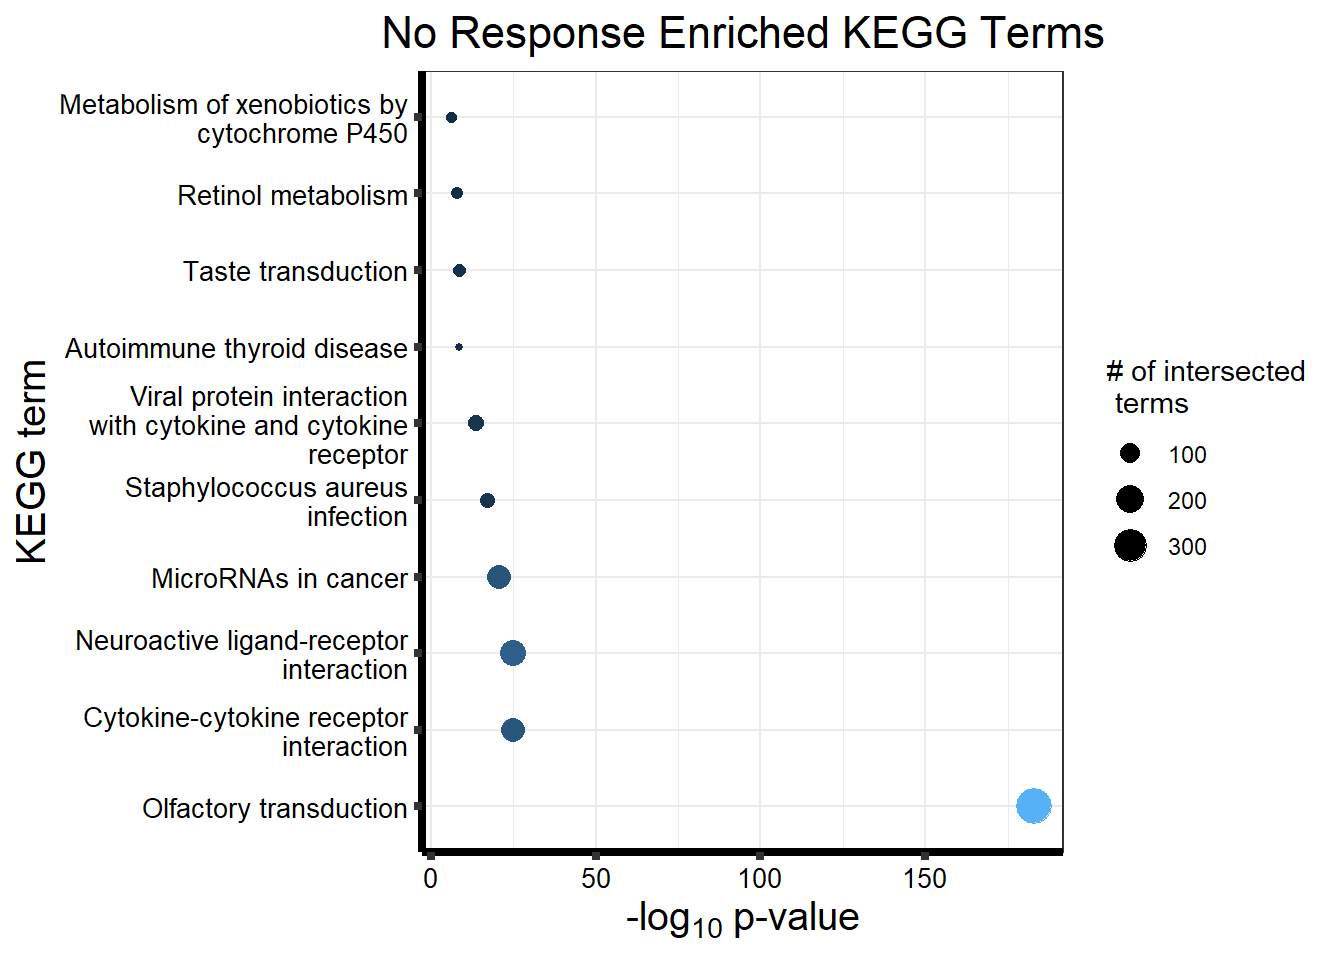
The Acute Response had no genes pop up for clustlike at the cutoff of > 0.5 However, when we changed the cutoff and used post prob we got some genes, so let’s use them for GO analysis This is from motif 2, where there is a light gray box in the first study (DOX 24hr) This one doesn’t seem to work, most likely since it’s not really picking up a motif
Next, we’ll look at the Late Response (motif 3)
motif_LD_d <- clust3_d


LDmotif_genes_d <- gost(query = motif_LD_d,
                      organism = "hsapiens",
                      ordered_query = FALSE,
                      measure_underrepresentation = FALSE,
                      evcodes = FALSE,
                      user_threshold = 0.05,
                      correction_method = c("fdr"),
                      sources = c("GO:BP", "KEGG"))

cormotifLDclust_d <- gostplot(LDmotif_genes_d, capped = FALSE, interactive = TRUE)
cormotifLDclust_d
tableLD_d <- LDmotif_genes_d$result %>%
dplyr::select(c(source, term_id, term_name, intersection_size, term_size, p_value))
tableLD_d %>%
mutate_at(.vars = 6, .funs = scales::label_scientific(digits=4)) %>%
kableExtra::kable(.,) %>%
kableExtra::kable_paper("striped", full_width = FALSE) %>%
kableExtra::kable_styling(full_width = FALSE, position = "left", bootstrap_options = c("striped", "hover")) %>%
kableExtra::scroll_box(width = "100%", height = "400px")| source | term_id | term_name | intersection_size | term_size | p_value |
|---|---|---|---|---|---|
| GO:BP | GO:0006811 | monoatomic ion transport | 76 | 1256 | 1.859e-16 |
| GO:BP | GO:0034220 | monoatomic ion transmembrane transport | 66 | 1017 | 1.150e-15 |
| GO:BP | GO:0055085 | transmembrane transport | 81 | 1538 | 1.275e-14 |
| GO:BP | GO:0098660 | inorganic ion transmembrane transport | 59 | 903 | 4.056e-14 |
| GO:BP | GO:0015698 | inorganic anion transport | 25 | 165 | 6.202e-13 |
| GO:BP | GO:0006820 | monoatomic anion transport | 25 | 167 | 6.916e-13 |
| GO:BP | GO:0006821 | chloride transport | 20 | 122 | 8.036e-11 |
| GO:BP | GO:0098661 | inorganic anion transmembrane transport | 20 | 127 | 1.544e-10 |
| GO:BP | GO:0006812 | monoatomic cation transport | 56 | 1032 | 3.213e-10 |
| GO:BP | GO:0030001 | metal ion transport | 50 | 875 | 8.778e-10 |
| GO:BP | GO:0098656 | monoatomic anion transmembrane transport | 20 | 142 | 9.669e-10 |
| GO:BP | GO:1902476 | chloride transmembrane transport | 17 | 107 | 5.174e-09 |
| GO:BP | GO:0098655 | monoatomic cation transmembrane transport | 47 | 832 | 5.174e-09 |
| GO:BP | GO:0006810 | transport | 137 | 4341 | 8.659e-09 |
| GO:BP | GO:0050896 | response to stimulus | 229 | 8993 | 7.328e-08 |
| GO:BP | GO:0098662 | inorganic cation transmembrane transport | 44 | 811 | 7.328e-08 |
| GO:BP | GO:0048869 | cellular developmental process | 133 | 4382 | 2.366e-07 |
| GO:BP | GO:0030154 | cell differentiation | 133 | 4381 | 2.366e-07 |
| GO:BP | GO:0032502 | developmental process | 177 | 6478 | 3.165e-07 |
| GO:BP | GO:0032501 | multicellular organismal process | 191 | 7234 | 6.618e-07 |
| GO:BP | GO:0051234 | establishment of localization | 140 | 4869 | 2.283e-06 |
| GO:BP | GO:0048468 | cell development | 94 | 2833 | 2.327e-06 |
| GO:BP | GO:0065008 | regulation of biological quality | 94 | 2847 | 2.843e-06 |
| GO:BP | GO:0035725 | sodium ion transmembrane transport | 17 | 169 | 3.857e-06 |
| GO:BP | GO:0007267 | cell-cell signaling | 54 | 1316 | 7.714e-06 |
| GO:BP | GO:0007188 | adenylate cyclase-modulating G protein-coupled receptor signaling pathway | 20 | 248 | 8.700e-06 |
| GO:BP | GO:0006814 | sodium ion transport | 19 | 235 | 1.747e-05 |
| GO:BP | GO:0048856 | anatomical structure development | 158 | 5924 | 2.143e-05 |
| GO:BP | GO:0030003 | intracellular monoatomic cation homeostasis | 29 | 521 | 3.048e-05 |
| GO:BP | GO:0007193 | adenylate cyclase-inhibiting G protein-coupled receptor signaling pathway | 11 | 79 | 3.777e-05 |
| GO:BP | GO:0006873 | intracellular monoatomic ion homeostasis | 29 | 530 | 4.076e-05 |
| GO:BP | GO:0051179 | localization | 148 | 5521 | 4.773e-05 |
| GO:BP | GO:0055080 | monoatomic cation homeostasis | 31 | 598 | 4.781e-05 |
| GO:BP | GO:0002521 | leukocyte differentiation | 32 | 632 | 5.022e-05 |
| GO:BP | GO:0050801 | monoatomic ion homeostasis | 31 | 608 | 6.443e-05 |
| GO:BP | GO:0006813 | potassium ion transport | 18 | 238 | 7.650e-05 |
| GO:BP | GO:0098771 | inorganic ion homeostasis | 28 | 531 | 1.150e-04 |
| GO:BP | GO:0055074 | calcium ion homeostasis | 21 | 326 | 1.192e-04 |
| GO:BP | GO:0015711 | organic anion transport | 25 | 442 | 1.210e-04 |
| GO:BP | GO:0006874 | intracellular calcium ion homeostasis | 20 | 302 | 1.341e-04 |
| GO:BP | GO:0023052 | signaling | 165 | 6471 | 1.385e-04 |
| GO:BP | GO:0065007 | biological regulation | 281 | 12671 | 1.491e-04 |
| GO:BP | GO:0002429 | immune response-activating cell surface receptor signaling pathway | 20 | 306 | 1.529e-04 |
| GO:BP | GO:0007154 | cell communication | 165 | 6496 | 1.673e-04 |
| GO:BP | GO:0099536 | synaptic signaling | 35 | 783 | 1.918e-04 |
| GO:BP | GO:0050877 | nervous system process | 54 | 1489 | 2.051e-04 |
| GO:BP | GO:0055082 | intracellular chemical homeostasis | 33 | 723 | 2.347e-04 |
| GO:BP | GO:0007155 | cell adhesion | 54 | 1511 | 3.030e-04 |
| GO:BP | GO:0042592 | homeostatic process | 59 | 1711 | 3.030e-04 |
| GO:BP | GO:0050851 | antigen receptor-mediated signaling pathway | 15 | 192 | 3.228e-04 |
| GO:BP | GO:0048878 | chemical homeostasis | 41 | 1026 | 3.612e-04 |
| GO:BP | GO:0002768 | immune response-regulating cell surface receptor signaling pathway | 20 | 334 | 4.779e-04 |
| GO:BP | GO:0048232 | male gamete generation | 30 | 654 | 5.513e-04 |
| GO:BP | GO:0099537 | trans-synaptic signaling | 33 | 759 | 5.699e-04 |
| GO:BP | GO:0022414 | reproductive process | 54 | 1556 | 6.223e-04 |
| GO:BP | GO:0050957 | equilibrioception | 4 | 8 | 6.636e-04 |
| GO:BP | GO:0071805 | potassium ion transmembrane transport | 15 | 213 | 9.978e-04 |
| GO:BP | GO:0051480 | regulation of cytosolic calcium ion concentration | 8 | 59 | 1.073e-03 |
| GO:BP | GO:0098916 | anterograde trans-synaptic signaling | 32 | 753 | 1.104e-03 |
| GO:BP | GO:0007186 | G protein-coupled receptor signaling pathway | 46 | 1275 | 1.104e-03 |
| GO:BP | GO:0007268 | chemical synaptic transmission | 32 | 753 | 1.104e-03 |
| GO:BP | GO:0019725 | cellular homeostasis | 34 | 826 | 1.131e-03 |
| GO:BP | GO:0009605 | response to external stimulus | 72 | 2367 | 1.429e-03 |
| GO:BP | GO:0003006 | developmental process involved in reproduction | 39 | 1022 | 1.436e-03 |
| GO:BP | GO:0098609 | cell-cell adhesion | 37 | 948 | 1.439e-03 |
| GO:BP | GO:0010951 | negative regulation of endopeptidase activity | 6 | 31 | 1.439e-03 |
| GO:BP | GO:0051716 | cellular response to stimulus | 176 | 7320 | 1.444e-03 |
| GO:BP | GO:0007275 | multicellular organism development | 122 | 4658 | 1.472e-03 |
| GO:BP | GO:1903131 | mononuclear cell differentiation | 25 | 529 | 1.557e-03 |
| GO:BP | GO:0006816 | calcium ion transport | 22 | 433 | 1.614e-03 |
| GO:BP | GO:0009410 | response to xenobiotic stimulus | 22 | 436 | 1.767e-03 |
| GO:BP | GO:0007283 | spermatogenesis | 28 | 637 | 1.793e-03 |
| GO:BP | GO:0048731 | system development | 107 | 3985 | 1.988e-03 |
| GO:BP | GO:0015747 | urate transport | 4 | 11 | 2.264e-03 |
| GO:BP | GO:0042221 | response to chemical | 104 | 3867 | 2.455e-03 |
| GO:BP | GO:0010817 | regulation of hormone levels | 25 | 548 | 2.522e-03 |
| GO:BP | GO:1902105 | regulation of leukocyte differentiation | 18 | 325 | 2.672e-03 |
| GO:BP | GO:0006968 | cellular defense response | 7 | 52 | 2.928e-03 |
| GO:BP | GO:0050853 | B cell receptor signaling pathway | 8 | 71 | 3.113e-03 |
| GO:BP | GO:1901700 | response to oxygen-containing compound | 53 | 1632 | 3.186e-03 |
| GO:BP | GO:0060004 | reflex | 5 | 23 | 3.275e-03 |
| GO:BP | GO:0007200 | phospholipase C-activating G protein-coupled receptor signaling pathway | 10 | 116 | 3.665e-03 |
| GO:BP | GO:0019722 | calcium-mediated signaling | 14 | 218 | 3.665e-03 |
| GO:BP | GO:0050805 | negative regulation of synaptic transmission | 7 | 55 | 3.931e-03 |
| GO:BP | GO:0060348 | bone development | 14 | 220 | 3.948e-03 |
| GO:BP | GO:0009581 | detection of external stimulus | 11 | 142 | 4.080e-03 |
| GO:BP | GO:0030098 | lymphocyte differentiation | 21 | 438 | 4.545e-03 |
| GO:BP | GO:0030217 | T cell differentiation | 17 | 312 | 4.635e-03 |
| GO:BP | GO:0009582 | detection of abiotic stimulus | 11 | 145 | 4.761e-03 |
| GO:BP | GO:0140013 | meiotic nuclear division | 13 | 198 | 4.891e-03 |
| GO:BP | GO:0002253 | activation of immune response | 24 | 543 | 4.891e-03 |
| GO:BP | GO:0002757 | immune response-activating signaling pathway | 22 | 477 | 5.142e-03 |
| GO:BP | GO:0019953 | sexual reproduction | 39 | 1103 | 5.143e-03 |
| GO:BP | GO:0060078 | regulation of postsynaptic membrane potential | 11 | 148 | 5.417e-03 |
| GO:BP | GO:0007600 | sensory perception | 35 | 955 | 5.823e-03 |
| GO:BP | GO:0007610 | behavior | 27 | 665 | 6.963e-03 |
| GO:BP | GO:0042110 | T cell activation | 24 | 558 | 6.963e-03 |
| GO:BP | GO:0050789 | regulation of biological process | 264 | 12278 | 7.266e-03 |
| GO:BP | GO:0006817 | phosphate ion transport | 5 | 28 | 7.266e-03 |
| GO:BP | GO:0046631 | alpha-beta T cell activation | 12 | 181 | 7.448e-03 |
| GO:BP | GO:0003008 | system process | 66 | 2266 | 7.662e-03 |
| GO:BP | GO:0007276 | gamete generation | 31 | 822 | 8.125e-03 |
| GO:BP | GO:0010466 | negative regulation of peptidase activity | 6 | 45 | 8.188e-03 |
| GO:BP | GO:0006869 | lipid transport | 20 | 431 | 8.627e-03 |
| GO:BP | GO:0048609 | multicellular organismal reproductive process | 35 | 980 | 8.638e-03 |
| GO:BP | GO:0042391 | regulation of membrane potential | 20 | 433 | 8.859e-03 |
| GO:BP | GO:0042445 | hormone metabolic process | 14 | 243 | 8.859e-03 |
| GO:BP | GO:0021879 | forebrain neuron differentiation | 6 | 46 | 8.859e-03 |
| GO:BP | GO:0002366 | leukocyte activation involved in immune response | 16 | 305 | 9.166e-03 |
| GO:BP | GO:0045588 | positive regulation of gamma-delta T cell differentiation | 3 | 7 | 9.166e-03 |
| GO:BP | GO:0002764 | immune response-regulating signaling pathway | 22 | 504 | 9.211e-03 |
| GO:BP | GO:0014070 | response to organic cyclic compound | 33 | 909 | 9.211e-03 |
| GO:BP | GO:1902107 | positive regulation of leukocyte differentiation | 12 | 189 | 9.684e-03 |
| GO:BP | GO:1903708 | positive regulation of hemopoiesis | 12 | 189 | 9.684e-03 |
| GO:BP | GO:0070588 | calcium ion transmembrane transport | 17 | 339 | 9.684e-03 |
| GO:BP | GO:0002263 | cell activation involved in immune response | 16 | 309 | 1.006e-02 |
| GO:BP | GO:0050870 | positive regulation of T cell activation | 14 | 248 | 1.008e-02 |
| GO:BP | GO:0007601 | visual perception | 13 | 219 | 1.008e-02 |
| GO:BP | GO:0035249 | synaptic transmission, glutamatergic | 9 | 112 | 1.008e-02 |
| GO:BP | GO:1903046 | meiotic cell cycle process | 13 | 220 | 1.045e-02 |
| GO:BP | GO:0098657 | import into cell | 33 | 921 | 1.071e-02 |
| GO:BP | GO:0046942 | carboxylic acid transport | 17 | 344 | 1.071e-02 |
| GO:BP | GO:0002923 | regulation of humoral immune response mediated by circulating immunoglobulin | 4 | 18 | 1.086e-02 |
| GO:BP | GO:0050852 | T cell receptor signaling pathway | 10 | 139 | 1.086e-02 |
| GO:BP | GO:0032604 | granulocyte macrophage colony-stimulating factor production | 4 | 18 | 1.086e-02 |
| GO:BP | GO:0032645 | regulation of granulocyte macrophage colony-stimulating factor production | 4 | 18 | 1.086e-02 |
| GO:BP | GO:0050953 | sensory perception of light stimulus | 13 | 222 | 1.086e-02 |
| GO:BP | GO:0015849 | organic acid transport | 17 | 345 | 1.086e-02 |
| GO:BP | GO:0050778 | positive regulation of immune response | 28 | 732 | 1.086e-02 |
| GO:BP | GO:0008283 | cell population proliferation | 59 | 2009 | 1.123e-02 |
| GO:BP | GO:0021630 | olfactory nerve maturation | 2 | 2 | 1.163e-02 |
| GO:BP | GO:0009628 | response to abiotic stimulus | 38 | 1130 | 1.163e-02 |
| GO:BP | GO:0036368 | cone photoresponse recovery | 2 | 2 | 1.163e-02 |
| GO:BP | GO:0015913 | short-chain fatty acid transmembrane transport | 2 | 2 | 1.163e-02 |
| GO:BP | GO:0030573 | bile acid catabolic process | 2 | 2 | 1.163e-02 |
| GO:BP | GO:0046645 | positive regulation of gamma-delta T cell activation | 3 | 8 | 1.163e-02 |
| GO:BP | GO:0048513 | animal organ development | 82 | 3047 | 1.163e-02 |
| GO:BP | GO:0030097 | hemopoiesis | 34 | 971 | 1.163e-02 |
| GO:BP | GO:0015741 | fumarate transport | 2 | 2 | 1.163e-02 |
| GO:BP | GO:2000471 | regulation of hematopoietic stem cell migration | 2 | 2 | 1.163e-02 |
| GO:BP | GO:2000473 | positive regulation of hematopoietic stem cell migration | 2 | 2 | 1.163e-02 |
| GO:BP | GO:0045055 | regulated exocytosis | 13 | 229 | 1.290e-02 |
| GO:BP | GO:0001775 | cell activation | 37 | 1098 | 1.290e-02 |
| GO:BP | GO:0045582 | positive regulation of T cell differentiation | 9 | 119 | 1.295e-02 |
| GO:BP | GO:0042127 | regulation of cell population proliferation | 51 | 1682 | 1.295e-02 |
| GO:BP | GO:0046649 | lymphocyte activation | 29 | 787 | 1.338e-02 |
| GO:BP | GO:0051321 | meiotic cell cycle | 15 | 294 | 1.437e-02 |
| GO:BP | GO:0007165 | signal transduction | 142 | 5979 | 1.448e-02 |
| GO:BP | GO:0070372 | regulation of ERK1 and ERK2 cascade | 15 | 295 | 1.469e-02 |
| GO:BP | GO:0048518 | positive regulation of biological process | 147 | 6235 | 1.486e-02 |
| GO:BP | GO:0006909 | phagocytosis | 13 | 234 | 1.500e-02 |
| GO:BP | GO:0045321 | leukocyte activation | 33 | 951 | 1.511e-02 |
| GO:BP | GO:0030450 | regulation of complement activation, classical pathway | 3 | 9 | 1.527e-02 |
| GO:BP | GO:0045586 | regulation of gamma-delta T cell differentiation | 3 | 9 | 1.527e-02 |
| GO:BP | GO:0040020 | regulation of meiotic nuclear division | 5 | 36 | 1.571e-02 |
| GO:BP | GO:0002683 | negative regulation of immune system process | 21 | 502 | 1.599e-02 |
| GO:BP | GO:0050982 | detection of mechanical stimulus | 6 | 55 | 1.625e-02 |
| GO:BP | GO:0007140 | male meiotic nuclear division | 6 | 55 | 1.625e-02 |
| GO:BP | GO:0009653 | anatomical structure morphogenesis | 73 | 2692 | 1.769e-02 |
| GO:BP | GO:0021872 | forebrain generation of neurons | 6 | 56 | 1.769e-02 |
| GO:BP | GO:1903039 | positive regulation of leukocyte cell-cell adhesion | 14 | 271 | 1.784e-02 |
| GO:BP | GO:0048871 | multicellular organismal-level homeostasis | 29 | 809 | 1.871e-02 |
| GO:BP | GO:0048485 | sympathetic nervous system development | 4 | 22 | 1.902e-02 |
| GO:BP | GO:0046903 | secretion | 33 | 968 | 1.902e-02 |
| GO:BP | GO:0046629 | gamma-delta T cell activation | 4 | 22 | 1.902e-02 |
| GO:BP | GO:0141124 | intracellular signaling cassette | 55 | 1895 | 1.902e-02 |
| GO:BP | GO:0071695 | anatomical structure maturation | 14 | 274 | 1.915e-02 |
| GO:BP | GO:2001204 | regulation of osteoclast development | 3 | 10 | 1.960e-02 |
| GO:BP | GO:0046643 | regulation of gamma-delta T cell activation | 3 | 10 | 1.960e-02 |
| GO:BP | GO:0007166 | cell surface receptor signaling pathway | 75 | 2803 | 2.028e-02 |
| GO:BP | GO:0010876 | lipid localization | 20 | 480 | 2.066e-02 |
| GO:BP | GO:0050776 | regulation of immune response | 31 | 897 | 2.110e-02 |
| GO:BP | GO:0002064 | epithelial cell development | 12 | 217 | 2.226e-02 |
| GO:BP | GO:0098742 | cell-cell adhesion via plasma-membrane adhesion molecules | 14 | 280 | 2.269e-02 |
| GO:BP | GO:0007127 | meiosis I | 9 | 132 | 2.275e-02 |
| GO:BP | GO:0051932 | synaptic transmission, GABAergic | 6 | 60 | 2.330e-02 |
| GO:BP | GO:0010481 | epidermal cell division | 2 | 3 | 2.428e-02 |
| GO:BP | GO:0009888 | tissue development | 57 | 2012 | 2.428e-02 |
| GO:BP | GO:0015850 | organic hydroxy compound transport | 14 | 283 | 2.428e-02 |
| GO:BP | GO:0070543 | response to linoleic acid | 2 | 3 | 2.428e-02 |
| GO:BP | GO:1903706 | regulation of hemopoiesis | 18 | 420 | 2.428e-02 |
| GO:BP | GO:0071486 | cellular response to high light intensity | 2 | 3 | 2.428e-02 |
| GO:BP | GO:1903306 | negative regulation of regulated secretory pathway | 4 | 24 | 2.428e-02 |
| GO:BP | GO:0015912 | short-chain fatty acid transport | 2 | 3 | 2.428e-02 |
| GO:BP | GO:0006959 | humoral immune response | 13 | 254 | 2.428e-02 |
| GO:BP | GO:0070371 | ERK1 and ERK2 cascade | 15 | 318 | 2.428e-02 |
| GO:BP | GO:0010482 | regulation of epidermal cell division | 2 | 3 | 2.428e-02 |
| GO:BP | GO:0050954 | sensory perception of mechanical stimulus | 11 | 190 | 2.428e-02 |
| GO:BP | GO:0021605 | cranial nerve maturation | 2 | 3 | 2.428e-02 |
| GO:BP | GO:0072313 | metanephric glomerular epithelial cell development | 2 | 3 | 2.428e-02 |
| GO:BP | GO:0032663 | regulation of interleukin-2 production | 6 | 62 | 2.428e-02 |
| GO:BP | GO:0032623 | interleukin-2 production | 6 | 62 | 2.428e-02 |
| GO:BP | GO:0045621 | positive regulation of lymphocyte differentiation | 9 | 134 | 2.428e-02 |
| GO:BP | GO:0072312 | metanephric glomerular epithelial cell differentiation | 2 | 3 | 2.428e-02 |
| GO:BP | GO:0072249 | metanephric podocyte development | 2 | 3 | 2.428e-02 |
| GO:BP | GO:0072248 | metanephric podocyte differentiation | 2 | 3 | 2.428e-02 |
| GO:BP | GO:0072244 | metanephric glomerular epithelium development | 2 | 3 | 2.428e-02 |
| GO:BP | GO:0033563 | dorsal/ventral axon guidance | 2 | 3 | 2.428e-02 |
| GO:BP | GO:1903977 | positive regulation of glial cell migration | 3 | 11 | 2.428e-02 |
| GO:BP | GO:0006311 | meiotic gene conversion | 2 | 3 | 2.428e-02 |
| GO:BP | GO:0048522 | positive regulation of cellular process | 138 | 5886 | 2.428e-02 |
| GO:BP | GO:0009887 | animal organ morphogenesis | 34 | 1037 | 2.505e-02 |
| GO:BP | GO:0043408 | regulation of MAPK cascade | 24 | 645 | 2.620e-02 |
| GO:BP | GO:0007605 | sensory perception of sound | 10 | 166 | 2.660e-02 |
| GO:BP | GO:0001501 | skeletal system development | 21 | 536 | 2.785e-02 |
| GO:BP | GO:0044341 | sodium-dependent phosphate transport | 3 | 12 | 2.867e-02 |
| GO:BP | GO:0043410 | positive regulation of MAPK cascade | 19 | 465 | 2.882e-02 |
| GO:BP | GO:0021895 | cerebral cortex neuron differentiation | 4 | 26 | 2.925e-02 |
| GO:BP | GO:0045494 | photoreceptor cell maintenance | 5 | 44 | 2.972e-02 |
| GO:BP | GO:0050794 | regulation of cellular process | 251 | 11876 | 2.996e-02 |
| GO:BP | GO:0061982 | meiosis I cell cycle process | 9 | 141 | 3.006e-02 |
| GO:BP | GO:0009266 | response to temperature stimulus | 10 | 170 | 3.063e-02 |
| GO:BP | GO:0035270 | endocrine system development | 9 | 142 | 3.128e-02 |
| GO:BP | GO:0046634 | regulation of alpha-beta T cell activation | 8 | 115 | 3.144e-02 |
| GO:BP | GO:0002704 | negative regulation of leukocyte mediated immunity | 6 | 66 | 3.152e-02 |
| GO:BP | GO:0001894 | tissue homeostasis | 13 | 264 | 3.164e-02 |
| GO:BP | GO:0060249 | anatomical structure homeostasis | 13 | 264 | 3.164e-02 |
| GO:BP | GO:0007263 | nitric oxide mediated signal transduction | 4 | 27 | 3.228e-02 |
| GO:BP | GO:0021953 | central nervous system neuron differentiation | 11 | 203 | 3.372e-02 |
| GO:BP | GO:0043383 | negative T cell selection | 3 | 13 | 3.411e-02 |
| GO:BP | GO:0043301 | negative regulation of leukocyte degranulation | 3 | 13 | 3.411e-02 |
| GO:BP | GO:0042492 | gamma-delta T cell differentiation | 3 | 13 | 3.411e-02 |
| GO:BP | GO:0051446 | positive regulation of meiotic cell cycle | 4 | 28 | 3.628e-02 |
| GO:BP | GO:0050867 | positive regulation of cell activation | 16 | 372 | 3.730e-02 |
| GO:BP | GO:0046633 | alpha-beta T cell proliferation | 5 | 47 | 3.730e-02 |
| GO:BP | GO:0050848 | regulation of calcium-mediated signaling | 7 | 93 | 3.730e-02 |
| GO:BP | GO:0014074 | response to purine-containing compound | 9 | 147 | 3.730e-02 |
| GO:BP | GO:0051445 | regulation of meiotic cell cycle | 6 | 69 | 3.736e-02 |
| GO:BP | GO:0045597 | positive regulation of cell differentiation | 29 | 866 | 3.736e-02 |
| GO:BP | GO:2001205 | negative regulation of osteoclast development | 2 | 4 | 3.794e-02 |
| GO:BP | GO:0141006 | transposable element silencing by piRNA-mediated heterochromatin formation | 2 | 4 | 3.794e-02 |
| GO:BP | GO:1903942 | positive regulation of respiratory gaseous exchange | 2 | 4 | 3.794e-02 |
| GO:BP | GO:0140966 | piRNA-mediated heterochromatin formation | 2 | 4 | 3.794e-02 |
| GO:BP | GO:0071639 | positive regulation of monocyte chemotactic protein-1 production | 3 | 14 | 3.794e-02 |
| GO:BP | GO:1990834 | response to odorant | 2 | 4 | 3.794e-02 |
| GO:BP | GO:0000165 | MAPK cascade | 26 | 749 | 3.794e-02 |
| GO:BP | GO:0042475 | odontogenesis of dentin-containing tooth | 7 | 95 | 3.794e-02 |
| GO:BP | GO:0042403 | thyroid hormone metabolic process | 4 | 29 | 3.794e-02 |
| GO:BP | GO:0010520 | regulation of reciprocal meiotic recombination | 2 | 4 | 3.794e-02 |
| GO:BP | GO:0035822 | gene conversion | 2 | 4 | 3.794e-02 |
| GO:BP | GO:0035589 | G protein-coupled purinergic nucleotide receptor signaling pathway | 3 | 14 | 3.794e-02 |
| GO:BP | GO:0045728 | respiratory burst after phagocytosis | 2 | 4 | 3.794e-02 |
| GO:BP | GO:0046305 | alkanesulfonate biosynthetic process | 2 | 4 | 3.794e-02 |
| GO:BP | GO:0046352 | disaccharide catabolic process | 2 | 4 | 3.794e-02 |
| GO:BP | GO:0007214 | gamma-aminobutyric acid signaling pathway | 4 | 29 | 3.794e-02 |
| GO:BP | GO:0042412 | taurine biosynthetic process | 2 | 4 | 3.794e-02 |
| GO:BP | GO:0048562 | embryonic organ morphogenesis | 14 | 305 | 3.794e-02 |
| GO:BP | GO:0048806 | genitalia development | 5 | 48 | 3.794e-02 |
| GO:BP | GO:0048870 | cell motility | 49 | 1716 | 3.794e-02 |
| GO:BP | GO:0021682 | nerve maturation | 2 | 4 | 3.794e-02 |
| GO:BP | GO:0010845 | positive regulation of reciprocal meiotic recombination | 2 | 4 | 3.794e-02 |
| GO:BP | GO:0060117 | auditory receptor cell development | 4 | 29 | 3.794e-02 |
| GO:BP | GO:0043266 | regulation of potassium ion transport | 7 | 94 | 3.794e-02 |
| GO:BP | GO:0021700 | developmental maturation | 15 | 343 | 3.902e-02 |
| GO:BP | GO:0002703 | regulation of leukocyte mediated immunity | 12 | 243 | 3.953e-02 |
| GO:BP | GO:0008277 | regulation of G protein-coupled receptor signaling pathway | 9 | 151 | 3.974e-02 |
| GO:BP | GO:0009566 | fertilization | 11 | 212 | 4.027e-02 |
| GO:BP | GO:0003341 | cilium movement | 11 | 212 | 4.027e-02 |
| GO:BP | GO:1904888 | cranial skeletal system development | 6 | 72 | 4.099e-02 |
| GO:BP | GO:0002706 | regulation of lymphocyte mediated immunity | 10 | 182 | 4.121e-02 |
| GO:BP | GO:0050764 | regulation of phagocytosis | 7 | 97 | 4.121e-02 |
| GO:BP | GO:0030900 | forebrain development | 17 | 417 | 4.129e-02 |
| GO:BP | GO:0006911 | phagocytosis, engulfment | 5 | 50 | 4.206e-02 |
| GO:BP | GO:0045580 | regulation of T cell differentiation | 10 | 183 | 4.216e-02 |
| GO:BP | GO:1903530 | regulation of secretion by cell | 21 | 567 | 4.216e-02 |
| GO:BP | GO:0007626 | locomotory behavior | 11 | 214 | 4.216e-02 |
| GO:BP | GO:0070887 | cellular response to chemical stimulus | 59 | 2186 | 4.216e-02 |
| GO:BP | GO:0046635 | positive regulation of alpha-beta T cell activation | 6 | 73 | 4.231e-02 |
| GO:BP | GO:0051239 | regulation of multicellular organismal process | 75 | 2928 | 4.231e-02 |
| GO:BP | GO:0045471 | response to ethanol | 8 | 125 | 4.231e-02 |
| GO:BP | GO:0023061 | signal release | 19 | 493 | 4.260e-02 |
| GO:BP | GO:0045619 | regulation of lymphocyte differentiation | 11 | 215 | 4.260e-02 |
| GO:BP | GO:0006955 | immune response | 55 | 2008 | 4.263e-02 |
| GO:BP | GO:1902358 | sulfate transmembrane transport | 3 | 15 | 4.277e-02 |
| GO:BP | GO:1901698 | response to nitrogen compound | 32 | 1010 | 4.350e-02 |
| GO:BP | GO:0002065 | columnar/cuboidal epithelial cell differentiation | 8 | 126 | 4.350e-02 |
| GO:BP | GO:0051346 | negative regulation of hydrolase activity | 7 | 99 | 4.350e-02 |
| GO:BP | GO:0046632 | alpha-beta T cell differentiation | 8 | 128 | 4.751e-02 |
| GO:BP | GO:0022409 | positive regulation of cell-cell adhesion | 14 | 319 | 4.770e-02 |
| GO:BP | GO:0001906 | cell killing | 11 | 219 | 4.770e-02 |
| GO:BP | GO:0060429 | epithelium development | 37 | 1229 | 4.838e-02 |
| GO:BP | GO:0002696 | positive regulation of leukocyte activation | 15 | 355 | 4.871e-02 |
| GO:BP | GO:0007189 | adenylate cyclase-activating G protein-coupled receptor signaling pathway | 9 | 158 | 4.881e-02 |
| GO:BP | GO:0006957 | complement activation, alternative pathway | 3 | 16 | 4.947e-02 |
| GO:BP | GO:0007194 | negative regulation of adenylate cyclase activity | 3 | 16 | 4.947e-02 |
| GO:BP | GO:0061101 | neuroendocrine cell differentiation | 3 | 16 | 4.947e-02 |
| GO:BP | GO:0043374 | CD8-positive, alpha-beta T cell differentiation | 3 | 16 | 4.947e-02 |
| GO:BP | GO:0042102 | positive regulation of T cell proliferation | 7 | 102 | 4.947e-02 |
| GO:BP | GO:0030183 | B cell differentiation | 9 | 159 | 4.985e-02 |
| KEGG | KEGG:04080 | Neuroactive ligand-receptor interaction | 29 | 365 | 1.040e-06 |
| KEGG | KEGG:00430 | Taurine and hypotaurine metabolism | 5 | 16 | 2.720e-03 |
#write.csv(tableLD, "output/table_LateDOXmotif.csv")

#GO:BP
tableLD_GOBP_d <- tableLD_d %>%
  dplyr::filter(source=="GO:BP") %>%
  dplyr::select(p_value, term_name, intersection_size) %>%
  dplyr::slice_min(., n=10, order_by=p_value) %>%
  mutate(log_val = -log10(p_value))

#saveRDS(tableLD_GOBP, "data/tableLD_GOBP.RDS")

tableLD_GOBP_d %>% ggplot(., aes(x = log_val, y = reorder(term_name, p_value), col= intersection_size)) +
  geom_point(aes(size = intersection_size)) +
  ggtitle("Late Response Enriched GO:BP Terms")+
  xlab(expression("-log"[10]~"p-value"))+
  guides(col="none", size= guide_legend(title = "# of intersected \n terms"))+
  ylab("GO:BP term")+
  scale_y_discrete(labels = scales::label_wrap(30))+
  theme_bw()+
  theme(plot.title = element_text(size = rel(1.5), hjust = 0.5),
        axis.title = element_text(size = 15, colour = "black"),
        axis.ticks = element_line(linewidth = 1.5),
        axis.line = element_line(linewidth = 1.5),
        axis.text = element_text(size = 10, colour = "black", angle = 0),
        strip.text = element_text(size = 15, colour = "black", face = "bold"))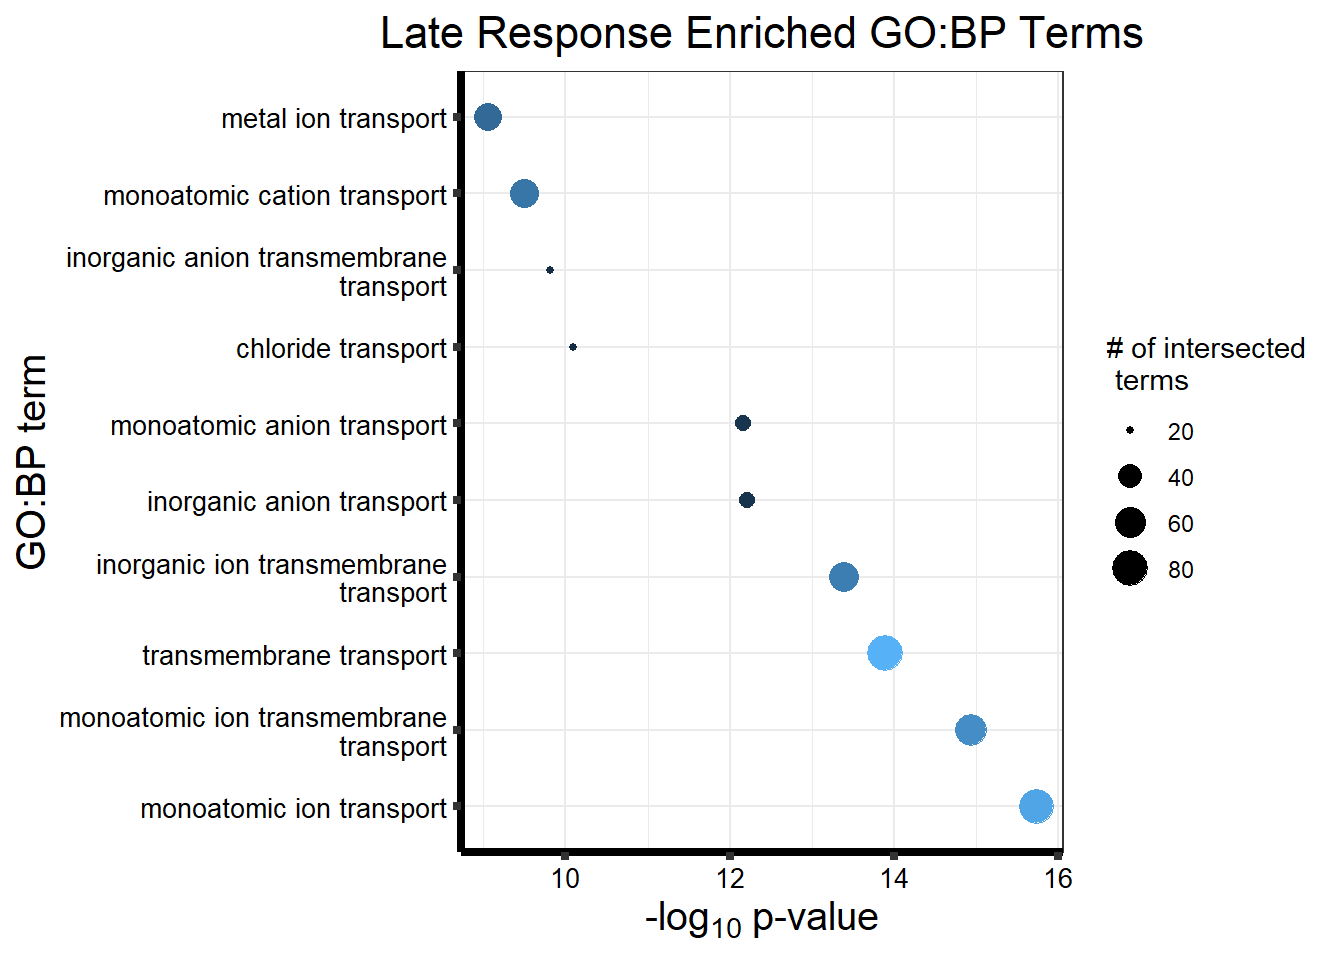
#KEGG
tableLD_KEGG_d <- tableLD_d %>%
  dplyr::filter(source=="KEGG") %>%
  dplyr::select(p_value, term_name, intersection_size) %>%
  dplyr::slice_min(., n=10, order_by=p_value) %>%
  mutate(log_val = -log10(p_value))

tableLD_KEGG_d %>% ggplot(., aes(x = log_val, y = reorder(term_name, p_value), col= intersection_size)) +
  geom_point(aes(size = intersection_size)) +
  ggtitle("Late Response Enriched KEGG Terms")+
  xlab(expression("-log"[10]~"p-value"))+
  guides(col="none", size= guide_legend(title = "# of intersected \n terms"))+
  ylab("KEGG term")+
  scale_y_discrete(labels = scales::label_wrap(30))+
  theme_bw()+
  theme(plot.title = element_text(size = rel(1.5), hjust = 0.5),
        axis.title = element_text(size = 15, colour = "black"),
        axis.ticks = element_line(linewidth = 1.5),
        axis.line = element_line(linewidth = 1.5),
        axis.text = element_text(size = 10, colour = "black", angle = 0),
        strip.text = element_text(size = 15, colour = "black", face = "bold"))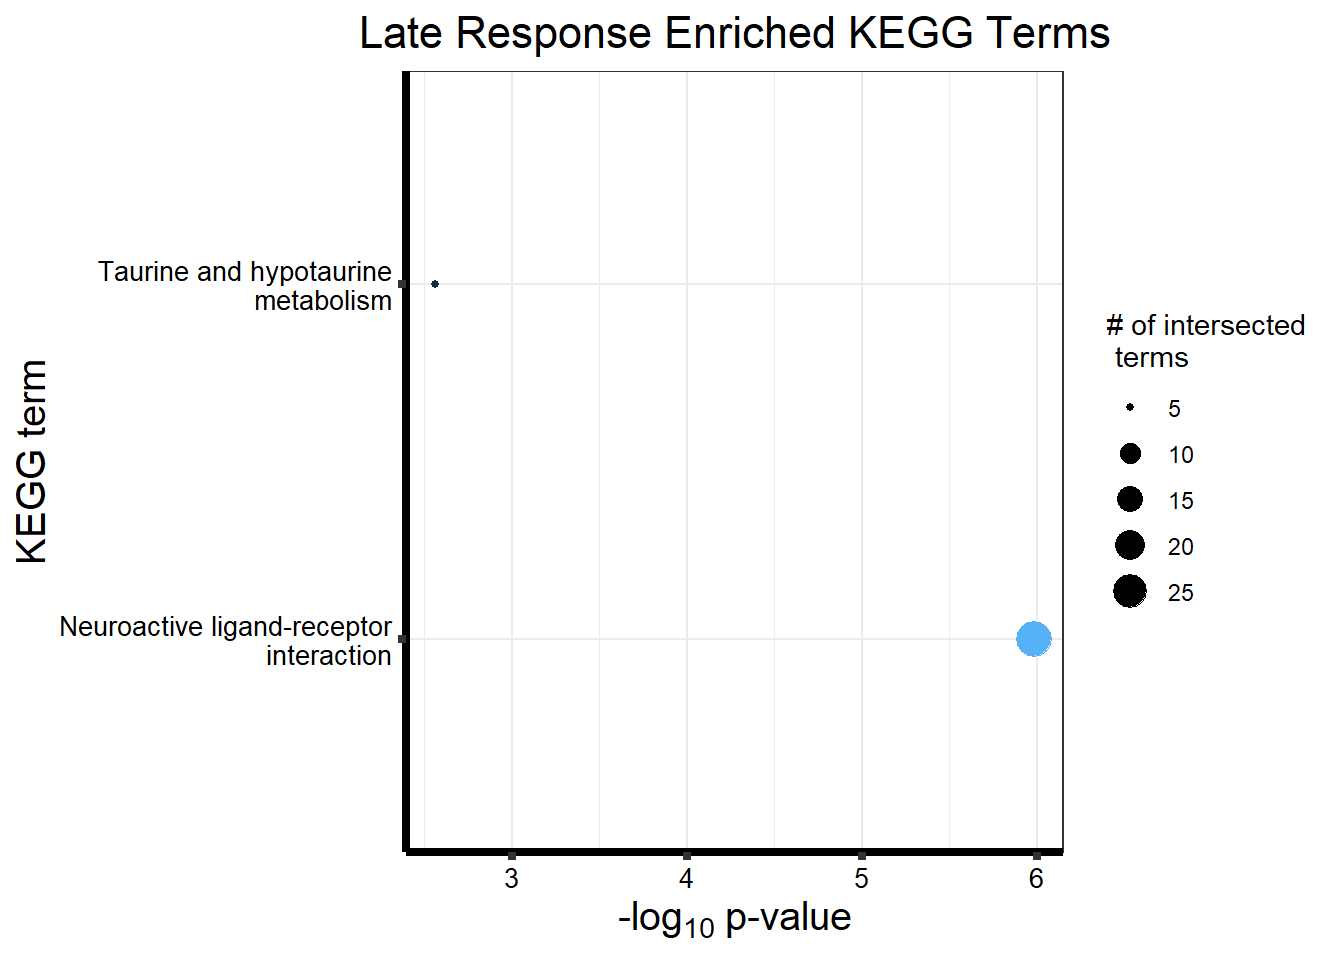
Now let’s look at this motif 3 (Late Response) with the posterior probability
motif_LR_pp <- prob_motif_3

LRmotif_genes_pp <- gost(query = motif_LR_pp,
                      organism = "hsapiens",
                      ordered_query = FALSE,
                      measure_underrepresentation = FALSE,
                      evcodes = FALSE,
                      user_threshold = 0.05,
                      correction_method = c("fdr"),
                      sources = c("GO:BP", "KEGG"))

cormotifLRclust_pp <- gostplot(LRmotif_genes_pp, capped = FALSE, interactive = TRUE)
cormotifLRclust_pp
tableLR_pp <- LRmotif_genes_pp$result %>%
dplyr::select(c(source, term_id, term_name, intersection_size, term_size, p_value))
tableLR_pp %>%
mutate_at(.vars = 6, .funs = scales::label_scientific(digits=4)) %>%
kableExtra::kable(.,) %>%
kableExtra::kable_paper("striped", full_width = FALSE) %>%
kableExtra::kable_styling(full_width = FALSE, position = "left", bootstrap_options = c("striped", "hover")) %>%
kableExtra::scroll_box(width = "100%", height = "400px")| source | term_id | term_name | intersection_size | term_size | p_value |
|---|---|---|---|---|---|
| GO:BP | GO:0006811 | monoatomic ion transport | 60 | 1256 | 6.212e-11 |
| GO:BP | GO:0034220 | monoatomic ion transmembrane transport | 52 | 1017 | 1.681e-10 |
| GO:BP | GO:0055085 | transmembrane transport | 65 | 1538 | 4.113e-10 |
| GO:BP | GO:0098660 | inorganic ion transmembrane transport | 45 | 903 | 1.161e-08 |
| GO:BP | GO:0015698 | inorganic anion transport | 18 | 165 | 1.375e-07 |
| GO:BP | GO:0006820 | monoatomic anion transport | 18 | 167 | 1.400e-07 |
| GO:BP | GO:0048869 | cellular developmental process | 118 | 4382 | 2.840e-07 |
| GO:BP | GO:0030154 | cell differentiation | 118 | 4381 | 2.840e-07 |
| GO:BP | GO:0006810 | transport | 117 | 4341 | 2.971e-07 |
| GO:BP | GO:0006821 | chloride transport | 15 | 122 | 4.430e-07 |
| GO:BP | GO:0032501 | multicellular organismal process | 167 | 7234 | 1.046e-06 |
| GO:BP | GO:0006812 | monoatomic cation transport | 43 | 1032 | 2.823e-06 |
| GO:BP | GO:0098656 | monoatomic anion transmembrane transport | 15 | 142 | 2.844e-06 |
| GO:BP | GO:0032502 | developmental process | 152 | 6478 | 3.014e-06 |
| GO:BP | GO:0048468 | cell development | 83 | 2833 | 4.124e-06 |
| GO:BP | GO:1902476 | chloride transmembrane transport | 13 | 107 | 4.238e-06 |
| GO:BP | GO:0098655 | monoatomic cation transmembrane transport | 37 | 832 | 4.606e-06 |
| GO:BP | GO:0050896 | response to stimulus | 193 | 8993 | 4.865e-06 |
| GO:BP | GO:0030001 | metal ion transport | 38 | 875 | 4.881e-06 |
| GO:BP | GO:0007193 | adenylate cyclase-inhibiting G protein-coupled receptor signaling pathway | 11 | 79 | 1.047e-05 |
| GO:BP | GO:0007267 | cell-cell signaling | 48 | 1316 | 1.298e-05 |
| GO:BP | GO:0051234 | establishment of localization | 120 | 4869 | 1.533e-05 |
| GO:BP | GO:0065008 | regulation of biological quality | 81 | 2847 | 1.552e-05 |
| GO:BP | GO:0065007 | biological regulation | 247 | 12671 | 1.617e-05 |
| GO:BP | GO:0007188 | adenylate cyclase-modulating G protein-coupled receptor signaling pathway | 18 | 248 | 1.781e-05 |
| GO:BP | GO:0098661 | inorganic anion transmembrane transport | 13 | 127 | 2.060e-05 |
| GO:BP | GO:0098662 | inorganic cation transmembrane transport | 34 | 811 | 4.571e-05 |
| GO:BP | GO:0048856 | anatomical structure development | 136 | 5924 | 7.416e-05 |
| GO:BP | GO:0022414 | reproductive process | 51 | 1556 | 9.471e-05 |
| GO:BP | GO:0051179 | localization | 127 | 5521 | 2.049e-04 |
| GO:BP | GO:0006813 | potassium ion transport | 16 | 238 | 2.050e-04 |
| GO:BP | GO:0015711 | organic anion transport | 22 | 442 | 3.627e-04 |
| GO:BP | GO:0023052 | signaling | 142 | 6471 | 4.510e-04 |
| GO:BP | GO:0051480 | regulation of cytosolic calcium ion concentration | 8 | 59 | 5.282e-04 |
| GO:BP | GO:0007154 | cell communication | 142 | 6496 | 5.345e-04 |
| GO:BP | GO:0048232 | male gamete generation | 27 | 654 | 8.075e-04 |
| GO:BP | GO:0003006 | developmental process involved in reproduction | 36 | 1022 | 8.341e-04 |
| GO:BP | GO:0010817 | regulation of hormone levels | 24 | 548 | 9.563e-04 |
| GO:BP | GO:0071805 | potassium ion transmembrane transport | 14 | 213 | 9.594e-04 |
| GO:BP | GO:0002521 | leukocyte differentiation | 26 | 632 | 1.150e-03 |
| GO:BP | GO:0007186 | G protein-coupled receptor signaling pathway | 41 | 1275 | 1.504e-03 |
| GO:BP | GO:0050789 | regulation of biological process | 232 | 12278 | 1.750e-03 |
| GO:BP | GO:0035725 | sodium ion transmembrane transport | 12 | 169 | 1.750e-03 |
| GO:BP | GO:0007275 | multicellular organism development | 107 | 4658 | 1.750e-03 |
| GO:BP | GO:0099536 | synaptic signaling | 29 | 783 | 2.264e-03 |
| GO:BP | GO:0007283 | spermatogenesis | 25 | 637 | 3.208e-03 |
| GO:BP | GO:0030003 | intracellular monoatomic cation homeostasis | 22 | 521 | 3.208e-03 |
| GO:BP | GO:0019953 | sexual reproduction | 36 | 1103 | 3.281e-03 |
| GO:BP | GO:0055082 | intracellular chemical homeostasis | 27 | 723 | 3.477e-03 |
| GO:BP | GO:0042592 | homeostatic process | 49 | 1711 | 3.593e-03 |
| GO:BP | GO:0006873 | intracellular monoatomic ion homeostasis | 22 | 530 | 3.743e-03 |
| GO:BP | GO:0048731 | system development | 93 | 3985 | 3.743e-03 |
| GO:BP | GO:0098771 | inorganic ion homeostasis | 22 | 531 | 3.776e-03 |
| GO:BP | GO:0050877 | nervous system process | 44 | 1489 | 4.173e-03 |
| GO:BP | GO:0055074 | calcium ion homeostasis | 16 | 326 | 5.815e-03 |
| GO:BP | GO:0140013 | meiotic nuclear division | 12 | 198 | 6.435e-03 |
| GO:BP | GO:0021879 | forebrain neuron differentiation | 6 | 46 | 6.491e-03 |
| GO:BP | GO:0099537 | trans-synaptic signaling | 27 | 759 | 6.655e-03 |
| GO:BP | GO:0035270 | endocrine system development | 10 | 142 | 6.926e-03 |
| GO:BP | GO:0055080 | monoatomic cation homeostasis | 23 | 598 | 6.926e-03 |
| GO:BP | GO:0048609 | multicellular organismal reproductive process | 32 | 980 | 7.045e-03 |
| GO:BP | GO:0007200 | phospholipase C-activating G protein-coupled receptor signaling pathway | 9 | 116 | 7.045e-03 |
| GO:BP | GO:0048878 | chemical homeostasis | 33 | 1026 | 7.079e-03 |
| GO:BP | GO:0006814 | sodium ion transport | 13 | 235 | 7.216e-03 |
| GO:BP | GO:0006874 | intracellular calcium ion homeostasis | 15 | 302 | 7.216e-03 |
| GO:BP | GO:0010951 | negative regulation of endopeptidase activity | 5 | 31 | 7.902e-03 |
| GO:BP | GO:0050801 | monoatomic ion homeostasis | 23 | 608 | 7.924e-03 |
| GO:BP | GO:0002429 | immune response-activating cell surface receptor signaling pathway | 15 | 306 | 7.976e-03 |
| GO:BP | GO:0007276 | gamete generation | 28 | 822 | 8.608e-03 |
| GO:BP | GO:0042445 | hormone metabolic process | 13 | 243 | 9.261e-03 |
| GO:BP | GO:0001775 | cell activation | 34 | 1098 | 1.012e-02 |
| GO:BP | GO:0046903 | secretion | 31 | 968 | 1.091e-02 |
| GO:BP | GO:0051716 | cellular response to stimulus | 148 | 7320 | 1.099e-02 |
| GO:BP | GO:0007268 | chemical synaptic transmission | 26 | 753 | 1.099e-02 |
| GO:BP | GO:0098916 | anterograde trans-synaptic signaling | 26 | 753 | 1.099e-02 |
| GO:BP | GO:0042221 | response to chemical | 88 | 3867 | 1.099e-02 |
| GO:BP | GO:0019722 | calcium-mediated signaling | 12 | 218 | 1.157e-02 |
| GO:BP | GO:1901700 | response to oxygen-containing compound | 45 | 1632 | 1.161e-02 |
| GO:BP | GO:0050957 | equilibrioception | 3 | 8 | 1.165e-02 |
| GO:BP | GO:0060348 | bone development | 12 | 220 | 1.196e-02 |
| GO:BP | GO:1903046 | meiotic cell cycle process | 12 | 220 | 1.196e-02 |
| GO:BP | GO:0009410 | response to xenobiotic stimulus | 18 | 436 | 1.232e-02 |
| GO:BP | GO:0007140 | male meiotic nuclear division | 6 | 55 | 1.232e-02 |
| GO:BP | GO:0021630 | olfactory nerve maturation | 2 | 2 | 1.261e-02 |
| GO:BP | GO:0042110 | T cell activation | 21 | 558 | 1.261e-02 |
| GO:BP | GO:0021872 | forebrain generation of neurons | 6 | 56 | 1.261e-02 |
| GO:BP | GO:0030098 | lymphocyte differentiation | 18 | 438 | 1.261e-02 |
| GO:BP | GO:0036368 | cone photoresponse recovery | 2 | 2 | 1.261e-02 |
| GO:BP | GO:0040020 | regulation of meiotic nuclear division | 5 | 36 | 1.261e-02 |
| GO:BP | GO:0050851 | antigen receptor-mediated signaling pathway | 11 | 192 | 1.285e-02 |
| GO:BP | GO:0051321 | meiotic cell cycle | 14 | 294 | 1.330e-02 |
| GO:BP | GO:0098609 | cell-cell adhesion | 30 | 948 | 1.330e-02 |
| GO:BP | GO:0007155 | cell adhesion | 42 | 1511 | 1.363e-02 |
| GO:BP | GO:0045321 | leukocyte activation | 30 | 951 | 1.372e-02 |
| GO:BP | GO:0021536 | diencephalon development | 7 | 81 | 1.409e-02 |
| GO:BP | GO:0007600 | sensory perception | 30 | 955 | 1.413e-02 |
| GO:BP | GO:0002768 | immune response-regulating cell surface receptor signaling pathway | 15 | 334 | 1.413e-02 |
| GO:BP | GO:0045055 | regulated exocytosis | 12 | 229 | 1.413e-02 |
| GO:BP | GO:0030450 | regulation of complement activation, classical pathway | 3 | 9 | 1.413e-02 |
| GO:BP | GO:1903131 | mononuclear cell differentiation | 20 | 529 | 1.475e-02 |
| GO:BP | GO:0019725 | cellular homeostasis | 27 | 826 | 1.487e-02 |
| GO:BP | GO:0048485 | sympathetic nervous system development | 4 | 22 | 1.570e-02 |
| GO:BP | GO:0046649 | lymphocyte activation | 26 | 787 | 1.582e-02 |
| GO:BP | GO:0048732 | gland development | 18 | 454 | 1.582e-02 |
| GO:BP | GO:0051932 | synaptic transmission, GABAergic | 6 | 60 | 1.582e-02 |
| GO:BP | GO:0002366 | leukocyte activation involved in immune response | 14 | 305 | 1.666e-02 |
| GO:BP | GO:0050794 | regulation of cellular process | 219 | 11876 | 1.689e-02 |
| GO:BP | GO:0021953 | central nervous system neuron differentiation | 11 | 203 | 1.722e-02 |
| GO:BP | GO:0046942 | carboxylic acid transport | 15 | 344 | 1.746e-02 |
| GO:BP | GO:0015849 | organic acid transport | 15 | 345 | 1.783e-02 |
| GO:BP | GO:0009581 | detection of external stimulus | 9 | 142 | 1.795e-02 |
| GO:BP | GO:0002263 | cell activation involved in immune response | 14 | 309 | 1.795e-02 |
| GO:BP | GO:0030217 | T cell differentiation | 14 | 312 | 1.958e-02 |
| GO:BP | GO:1903306 | negative regulation of regulated secretory pathway | 4 | 24 | 1.990e-02 |
| GO:BP | GO:0009582 | detection of abiotic stimulus | 9 | 145 | 2.023e-02 |
| GO:BP | GO:0003008 | system process | 56 | 2266 | 2.064e-02 |
| GO:BP | GO:0009888 | tissue development | 51 | 2012 | 2.112e-02 |
| GO:BP | GO:0006869 | lipid transport | 17 | 431 | 2.155e-02 |
| GO:BP | GO:1903977 | positive regulation of glial cell migration | 3 | 11 | 2.180e-02 |
| GO:BP | GO:0015747 | urate transport | 3 | 11 | 2.180e-02 |
| GO:BP | GO:0003341 | cilium movement | 11 | 212 | 2.195e-02 |
| GO:BP | GO:0042391 | regulation of membrane potential | 17 | 433 | 2.195e-02 |
| GO:BP | GO:0046631 | alpha-beta T cell activation | 10 | 181 | 2.355e-02 |
| GO:BP | GO:0050848 | regulation of calcium-mediated signaling | 7 | 93 | 2.463e-02 |
| GO:BP | GO:0006311 | meiotic gene conversion | 2 | 3 | 2.463e-02 |
| GO:BP | GO:0010466 | negative regulation of peptidase activity | 5 | 45 | 2.463e-02 |
| GO:BP | GO:0010481 | epidermal cell division | 2 | 3 | 2.463e-02 |
| GO:BP | GO:0010482 | regulation of epidermal cell division | 2 | 3 | 2.463e-02 |
| GO:BP | GO:0071486 | cellular response to high light intensity | 2 | 3 | 2.463e-02 |
| GO:BP | GO:0033563 | dorsal/ventral axon guidance | 2 | 3 | 2.463e-02 |
| GO:BP | GO:0021605 | cranial nerve maturation | 2 | 3 | 2.463e-02 |
| GO:BP | GO:0021895 | cerebral cortex neuron differentiation | 4 | 26 | 2.463e-02 |
| GO:BP | GO:1902105 | regulation of leukocyte differentiation | 14 | 325 | 2.463e-02 |
| GO:BP | GO:0002064 | epithelial cell development | 11 | 217 | 2.463e-02 |
| GO:BP | GO:0051445 | regulation of meiotic cell cycle | 6 | 69 | 2.584e-02 |
| GO:BP | GO:0048513 | animal organ development | 70 | 3047 | 2.597e-02 |
| GO:BP | GO:0030097 | hemopoiesis | 29 | 971 | 2.827e-02 |
| GO:BP | GO:1903708 | positive regulation of hemopoiesis | 10 | 189 | 2.899e-02 |
| GO:BP | GO:1902107 | positive regulation of leukocyte differentiation | 10 | 189 | 2.899e-02 |
| GO:BP | GO:0002065 | columnar/cuboidal epithelial cell differentiation | 8 | 126 | 2.899e-02 |
| GO:BP | GO:0008283 | cell population proliferation | 50 | 2009 | 2.927e-02 |
| GO:BP | GO:0051446 | positive regulation of meiotic cell cycle | 4 | 28 | 2.927e-02 |
| GO:BP | GO:0006817 | phosphate ion transport | 4 | 28 | 2.927e-02 |
| GO:BP | GO:0048806 | genitalia development | 5 | 48 | 2.927e-02 |
| GO:BP | GO:0009653 | anatomical structure morphogenesis | 63 | 2692 | 2.952e-02 |
| GO:BP | GO:1904888 | cranial skeletal system development | 6 | 72 | 2.992e-02 |
| GO:BP | GO:0001501 | skeletal system development | 19 | 536 | 3.011e-02 |
| GO:BP | GO:0043301 | negative regulation of leukocyte degranulation | 3 | 13 | 3.011e-02 |
| GO:BP | GO:0042403 | thyroid hormone metabolic process | 4 | 29 | 3.176e-02 |
| GO:BP | GO:0007214 | gamma-aminobutyric acid signaling pathway | 4 | 29 | 3.176e-02 |
| GO:BP | GO:0060249 | anatomical structure homeostasis | 12 | 264 | 3.206e-02 |
| GO:BP | GO:0001894 | tissue homeostasis | 12 | 264 | 3.206e-02 |
| GO:BP | GO:0030900 | forebrain development | 16 | 417 | 3.206e-02 |
| GO:BP | GO:0060429 | epithelium development | 34 | 1229 | 3.455e-02 |
| GO:BP | GO:0007127 | meiosis I | 8 | 132 | 3.539e-02 |
| GO:BP | GO:0140352 | export from cell | 27 | 901 | 3.547e-02 |
| GO:BP | GO:0035589 | G protein-coupled purinergic nucleotide receptor signaling pathway | 3 | 14 | 3.548e-02 |
| GO:BP | GO:0048518 | positive regulation of biological process | 125 | 6235 | 3.604e-02 |
| GO:BP | GO:0043410 | positive regulation of MAPK cascade | 17 | 465 | 3.669e-02 |
| GO:BP | GO:0014070 | response to organic cyclic compound | 27 | 909 | 3.791e-02 |
| GO:BP | GO:0006968 | cellular defense response | 5 | 52 | 3.791e-02 |
| GO:BP | GO:0046352 | disaccharide catabolic process | 2 | 4 | 3.791e-02 |
| GO:BP | GO:0010845 | positive regulation of reciprocal meiotic recombination | 2 | 4 | 3.791e-02 |
| GO:BP | GO:0060294 | cilium movement involved in cell motility | 9 | 167 | 3.791e-02 |
| GO:BP | GO:0021682 | nerve maturation | 2 | 4 | 3.791e-02 |
| GO:BP | GO:0035822 | gene conversion | 2 | 4 | 3.791e-02 |
| GO:BP | GO:0141006 | transposable element silencing by piRNA-mediated heterochromatin formation | 2 | 4 | 3.791e-02 |
| GO:BP | GO:0140966 | piRNA-mediated heterochromatin formation | 2 | 4 | 3.791e-02 |
| GO:BP | GO:0010520 | regulation of reciprocal meiotic recombination | 2 | 4 | 3.791e-02 |
| GO:BP | GO:0045728 | respiratory burst after phagocytosis | 2 | 4 | 3.791e-02 |
| GO:BP | GO:1990834 | response to odorant | 2 | 4 | 3.791e-02 |
| GO:BP | GO:0009605 | response to external stimulus | 56 | 2367 | 3.880e-02 |
| GO:BP | GO:0071695 | anatomical structure maturation | 12 | 274 | 3.887e-02 |
| GO:BP | GO:0006816 | calcium ion transport | 16 | 433 | 4.134e-02 |
| GO:BP | GO:0007165 | signal transduction | 120 | 5979 | 4.180e-02 |
| GO:BP | GO:0007399 | nervous system development | 59 | 2541 | 4.341e-02 |
| GO:BP | GO:2000241 | regulation of reproductive process | 10 | 206 | 4.341e-02 |
| GO:BP | GO:0060285 | cilium-dependent cell motility | 9 | 172 | 4.341e-02 |
| GO:BP | GO:0001539 | cilium or flagellum-dependent cell motility | 9 | 172 | 4.341e-02 |
| GO:BP | GO:0030855 | epithelial cell differentiation | 23 | 741 | 4.442e-02 |
| GO:BP | GO:0032940 | secretion by cell | 25 | 832 | 4.442e-02 |
| GO:BP | GO:0007218 | neuropeptide signaling pathway | 7 | 110 | 4.452e-02 |
| GO:BP | GO:0006957 | complement activation, alternative pathway | 3 | 16 | 4.452e-02 |
| GO:BP | GO:0007194 | negative regulation of adenylate cyclase activity | 3 | 16 | 4.452e-02 |
| GO:BP | GO:0010876 | lipid localization | 17 | 480 | 4.452e-02 |
| GO:BP | GO:0061982 | meiosis I cell cycle process | 8 | 141 | 4.452e-02 |
| GO:BP | GO:0061101 | neuroendocrine cell differentiation | 3 | 16 | 4.452e-02 |
| GO:BP | GO:0043374 | CD8-positive, alpha-beta T cell differentiation | 3 | 16 | 4.452e-02 |
| GO:BP | GO:0048522 | positive regulation of cellular process | 118 | 5886 | 4.481e-02 |
| GO:BP | GO:1903530 | regulation of secretion by cell | 19 | 567 | 4.481e-02 |
| GO:BP | GO:0003382 | epithelial cell morphogenesis | 4 | 34 | 4.481e-02 |
| GO:BP | GO:0043270 | positive regulation of monoatomic ion transport | 10 | 209 | 4.481e-02 |
| GO:BP | GO:0010526 | transposable element silencing | 4 | 34 | 4.481e-02 |
| GO:BP | GO:0015701 | bicarbonate transport | 4 | 34 | 4.481e-02 |
| GO:BP | GO:0045745 | positive regulation of G protein-coupled receptor signaling pathway | 4 | 34 | 4.481e-02 |
| GO:BP | GO:0050870 | positive regulation of T cell activation | 11 | 248 | 4.822e-02 |
| GO:BP | GO:0009566 | fertilization | 10 | 212 | 4.830e-02 |
| GO:BP | GO:0045577 | regulation of B cell differentiation | 4 | 35 | 4.848e-02 |
| GO:BP | GO:0051050 | positive regulation of transport | 25 | 844 | 4.848e-02 |
| GO:BP | GO:0043299 | leukocyte degranulation | 6 | 84 | 4.848e-02 |
| GO:BP | GO:0043949 | regulation of cAMP-mediated signaling | 4 | 35 | 4.848e-02 |
| GO:BP | GO:0002679 | respiratory burst involved in defense response | 3 | 17 | 4.900e-02 |
| GO:BP | GO:0009642 | response to light intensity | 3 | 17 | 4.900e-02 |
| GO:BP | GO:0009628 | response to abiotic stimulus | 31 | 1130 | 4.900e-02 |
| GO:BP | GO:0031280 | negative regulation of cyclase activity | 3 | 17 | 4.900e-02 |
| GO:BP | GO:0045917 | positive regulation of complement activation | 2 | 5 | 4.921e-02 |
| GO:BP | GO:0045920 | negative regulation of exocytosis | 4 | 36 | 4.921e-02 |
| GO:BP | GO:0070995 | NADPH oxidation | 2 | 5 | 4.921e-02 |
| GO:BP | GO:2000611 | positive regulation of thyroid hormone generation | 2 | 5 | 4.921e-02 |
| GO:BP | GO:0032197 | retrotransposition | 4 | 36 | 4.921e-02 |
| GO:BP | GO:0007610 | behavior | 21 | 665 | 4.921e-02 |
| GO:BP | GO:0009644 | response to high light intensity | 2 | 5 | 4.921e-02 |
| GO:BP | GO:0009887 | animal organ morphogenesis | 29 | 1037 | 4.921e-02 |
| GO:BP | GO:0030317 | flagellated sperm motility | 8 | 147 | 4.921e-02 |
| GO:BP | GO:0009914 | hormone transport | 13 | 328 | 4.921e-02 |
| GO:BP | GO:0097722 | sperm motility | 8 | 147 | 4.921e-02 |
| GO:BP | GO:0023061 | signal release | 17 | 493 | 4.921e-02 |
| GO:BP | GO:0071484 | cellular response to light intensity | 2 | 5 | 4.921e-02 |
| GO:BP | GO:0042127 | regulation of cell population proliferation | 42 | 1682 | 4.921e-02 |
| GO:BP | GO:0002434 | immune complex clearance | 2 | 5 | 4.921e-02 |
| GO:BP | GO:0045216 | cell-cell junction organization | 10 | 216 | 4.931e-02 |
| KEGG | KEGG:04080 | Neuroactive ligand-receptor interaction | 25 | 365 | 1.188e-05 |
#write.csv(tableLR_pp, "output/table_LRmotif.csv")

#GO:BP
tableLR_GOBP_pp <- tableLR_pp %>%
  dplyr::filter(source=="GO:BP") %>%
  dplyr::select(p_value, term_name, intersection_size) %>%
  dplyr::slice_min(., n=10, order_by=p_value) %>%
  mutate(log_val = -log10(p_value))

#saveRDS(tableLR_GOBP_pp, "data/tableLR_GOBP_postprob.RDS")

tableLR_GOBP_pp %>% ggplot(., aes(x = log_val, y = reorder(term_name, p_value), col= intersection_size)) +
  geom_point(aes(size = intersection_size)) +
  ggtitle("No Response Enriched GO:BP Terms")+
  xlab(expression("-log"[10]~"p-value"))+
  guides(col="none", size= guide_legend(title = "# of intersected \n terms"))+
  ylab("GO:BP term")+
  scale_y_discrete(labels = scales::label_wrap(30))+
  theme_bw()+
  theme(plot.title = element_text(size = rel(1.5), hjust = 0.5),
        axis.title = element_text(size = 15, colour = "black"),
        axis.ticks = element_line(linewidth = 1.5),
        axis.line = element_line(linewidth = 1.5),
        axis.text = element_text(size = 10, colour = "black", angle = 0),
        strip.text = element_text(size = 15, colour = "black", face = "bold"))
#KEGG
tableLR_KEGG_pp <- tableLR_pp %>%
  dplyr::filter(source=="KEGG") %>%
  dplyr::select(p_value, term_name, intersection_size) %>%
  dplyr::slice_min(., n=10, order_by=p_value) %>%
  mutate(log_val = -log10(p_value))

tableLR_KEGG_pp %>% ggplot(., aes(x = log_val, y = reorder(term_name, p_value), col= intersection_size)) +
  geom_point(aes(size = intersection_size)) +
  ggtitle("No Response Enriched KEGG Terms")+
  xlab(expression("-log"[10]~"p-value"))+
  guides(col="none", size= guide_legend(title = "# of intersected \n terms"))+
  ylab("KEGG term")+
  scale_y_discrete(labels = scales::label_wrap(30))+
  theme_bw()+
  theme(plot.title = element_text(size = rel(1.5), hjust = 0.5),
        axis.title = element_text(size = 15, colour = "black"),
        axis.ticks = element_line(linewidth = 1.5),
        axis.line = element_line(linewidth = 1.5),
        axis.text = element_text(size = 10, colour = "black", angle = 0),
        strip.text = element_text(size = 15, colour = "black", face = "bold"))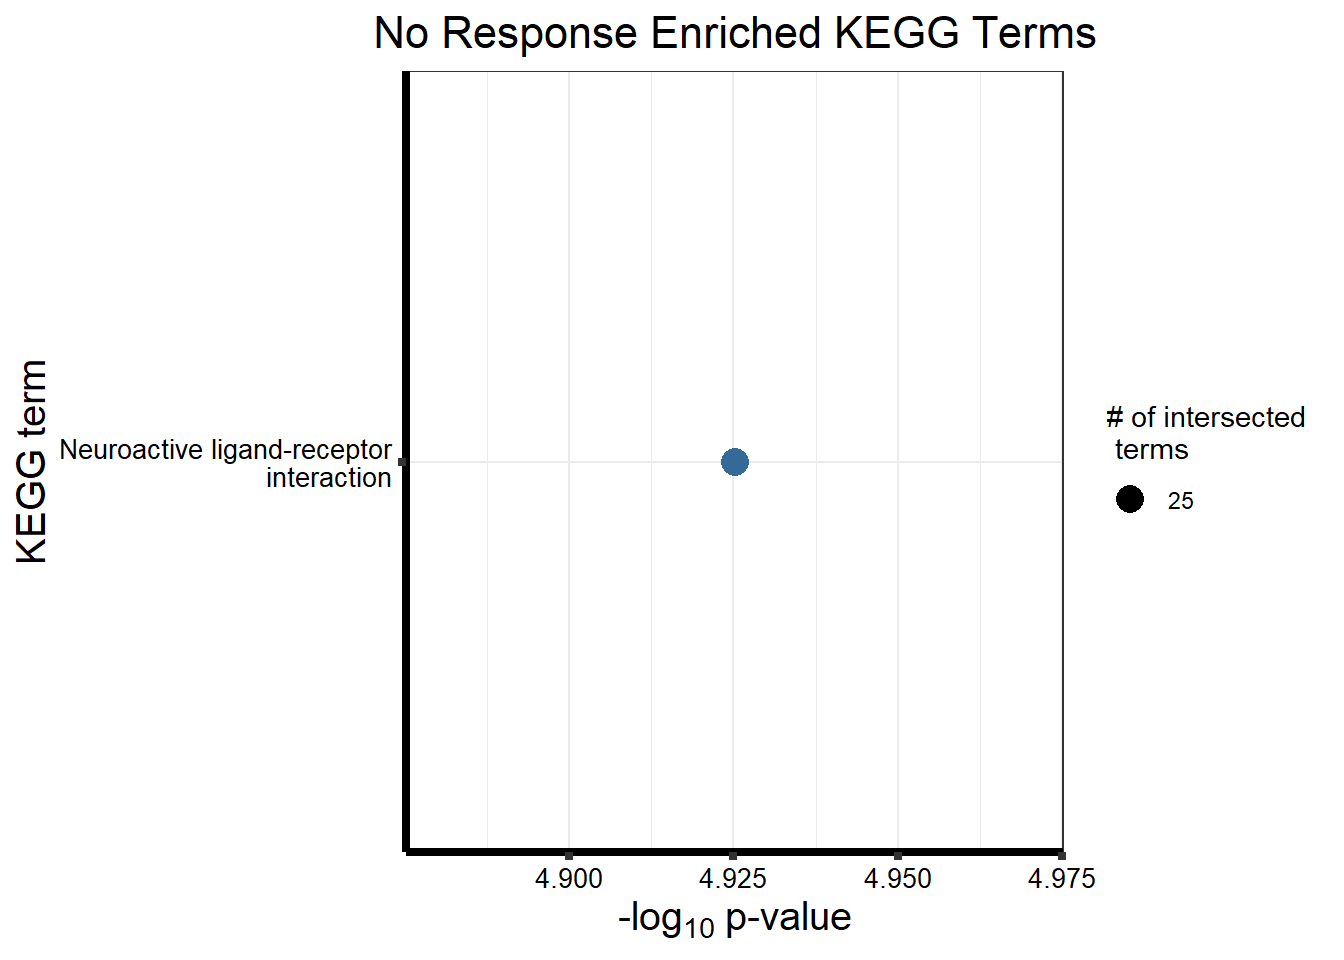
Now let’s look at motif 4 - Early Sustained Response
motif_ED_d <- clust4_d

EDmotif_genes_d <- gost(query = motif_ED_d,
                      organism = "hsapiens",
                      ordered_query = FALSE,
                      measure_underrepresentation = FALSE,
                      evcodes = FALSE,
                      user_threshold = 0.05,
                      correction_method = c("fdr"),
                      sources = c("GO:BP", "KEGG"))

cormotifEDclust_d <- gostplot(EDmotif_genes_d, capped = FALSE, interactive = TRUE)
cormotifEDclust_d
tableED_d <- EDmotif_genes_d$result %>%
dplyr::select(c(source, term_id, term_name, intersection_size, term_size, p_value))
tableED_d %>%
mutate_at(.vars = 6, .funs = scales::label_scientific(digits=4)) %>%
kableExtra::kable(.,) %>%
kableExtra::kable_paper("striped", full_width = FALSE) %>%
kableExtra::kable_styling(full_width = FALSE, position = "left", bootstrap_options = c("striped", "hover")) %>%
kableExtra::scroll_box(width = "100%", height = "400px")| source | term_id | term_name | intersection_size | term_size | p_value |
|---|---|---|---|---|---|
| GO:BP | GO:0032502 | developmental process | 355 | 6478 | 5.420e-13 |
| GO:BP | GO:0048856 | anatomical structure development | 331 | 5924 | 5.420e-13 |
| GO:BP | GO:0032501 | multicellular organismal process | 372 | 7234 | 6.854e-10 |
| GO:BP | GO:0048869 | cellular developmental process | 249 | 4382 | 2.296e-09 |
| GO:BP | GO:0030154 | cell differentiation | 249 | 4381 | 2.296e-09 |
| GO:BP | GO:0045165 | cell fate commitment | 37 | 291 | 1.255e-07 |
| GO:BP | GO:0007275 | multicellular organism development | 253 | 4658 | 1.298e-07 |
| GO:BP | GO:0048731 | system development | 221 | 3985 | 4.809e-07 |
| GO:BP | GO:0003002 | regionalization | 44 | 434 | 2.357e-06 |
| GO:BP | GO:0007389 | pattern specification process | 45 | 478 | 1.363e-05 |
| GO:BP | GO:0001708 | cell fate specification | 19 | 113 | 2.533e-05 |
| GO:BP | GO:0048513 | animal organ development | 171 | 3047 | 2.533e-05 |
| GO:BP | GO:0009891 | positive regulation of biosynthetic process | 155 | 2707 | 3.346e-05 |
| GO:BP | GO:0048663 | neuron fate commitment | 15 | 73 | 3.397e-05 |
| GO:BP | GO:0007399 | nervous system development | 147 | 2541 | 3.675e-05 |
| GO:BP | GO:0009953 | dorsal/ventral pattern formation | 16 | 90 | 8.195e-05 |
| GO:BP | GO:0060429 | epithelium development | 83 | 1229 | 8.195e-05 |
| GO:BP | GO:0009653 | anatomical structure morphogenesis | 152 | 2692 | 8.195e-05 |
| GO:BP | GO:0009887 | animal organ morphogenesis | 73 | 1037 | 8.710e-05 |
| GO:BP | GO:0018958 | phenol-containing compound metabolic process | 18 | 116 | 1.125e-04 |
| GO:BP | GO:0007204 | positive regulation of cytosolic calcium ion concentration | 22 | 169 | 1.341e-04 |
| GO:BP | GO:0009888 | tissue development | 118 | 2012 | 3.034e-04 |
| GO:BP | GO:0033993 | response to lipid | 65 | 921 | 3.055e-04 |
| GO:BP | GO:0007423 | sensory organ development | 48 | 612 | 4.541e-04 |
| GO:BP | GO:0048468 | cell development | 154 | 2833 | 4.613e-04 |
| GO:BP | GO:0034220 | monoatomic ion transmembrane transport | 69 | 1017 | 5.073e-04 |
| GO:BP | GO:0030182 | neuron differentiation | 89 | 1434 | 6.680e-04 |
| GO:BP | GO:0006357 | regulation of transcription by RNA polymerase II | 141 | 2572 | 7.935e-04 |
| GO:BP | GO:0048665 | neuron fate specification | 9 | 35 | 8.914e-04 |
| GO:BP | GO:0007417 | central nervous system development | 69 | 1038 | 8.914e-04 |
| GO:BP | GO:0010557 | positive regulation of macromolecule biosynthetic process | 141 | 2604 | 1.377e-03 |
| GO:BP | GO:0048699 | generation of neurons | 91 | 1517 | 1.699e-03 |
| GO:BP | GO:1901615 | organic hydroxy compound metabolic process | 42 | 549 | 2.643e-03 |
| GO:BP | GO:1901616 | organic hydroxy compound catabolic process | 11 | 61 | 2.797e-03 |
| GO:BP | GO:0030855 | epithelial cell differentiation | 52 | 741 | 2.797e-03 |
| GO:BP | GO:0006366 | transcription by RNA polymerase II | 143 | 2698 | 3.046e-03 |
| GO:BP | GO:0048880 | sensory system development | 34 | 414 | 3.661e-03 |
| GO:BP | GO:0060579 | ventral spinal cord interneuron fate commitment | 5 | 11 | 4.463e-03 |
| GO:BP | GO:0060581 | cell fate commitment involved in pattern specification | 5 | 11 | 4.463e-03 |
| GO:BP | GO:0022008 | neurogenesis | 99 | 1746 | 5.269e-03 |
| GO:BP | GO:0021513 | spinal cord dorsal/ventral patterning | 6 | 18 | 5.269e-03 |
| GO:BP | GO:0150063 | visual system development | 33 | 408 | 5.729e-03 |
| GO:BP | GO:0019336 | phenol-containing compound catabolic process | 5 | 12 | 6.722e-03 |
| GO:BP | GO:0009952 | anterior/posterior pattern specification | 22 | 225 | 6.780e-03 |
| GO:BP | GO:0006952 | defense response | 101 | 1809 | 7.147e-03 |
| GO:BP | GO:0002118 | aggressive behavior | 4 | 7 | 8.370e-03 |
| GO:BP | GO:0006811 | monoatomic ion transport | 75 | 1256 | 8.467e-03 |
| GO:BP | GO:0098660 | inorganic ion transmembrane transport | 58 | 903 | 8.467e-03 |
| GO:BP | GO:0021511 | spinal cord patterning | 6 | 20 | 8.625e-03 |
| GO:BP | GO:0045944 | positive regulation of transcription by RNA polymerase II | 75 | 1261 | 8.709e-03 |
| GO:BP | GO:0060732 | positive regulation of inositol phosphate biosynthetic process | 5 | 13 | 8.709e-03 |
| GO:BP | GO:0001654 | eye development | 32 | 404 | 8.709e-03 |
| GO:BP | GO:0006954 | inflammatory response | 55 | 847 | 8.709e-03 |
| GO:BP | GO:0021514 | ventral spinal cord interneuron differentiation | 5 | 13 | 8.709e-03 |
| GO:BP | GO:0042403 | thyroid hormone metabolic process | 7 | 29 | 8.866e-03 |
| GO:BP | GO:0003407 | neural retina development | 12 | 85 | 8.906e-03 |
| GO:BP | GO:0007281 | germ cell development | 30 | 370 | 8.906e-03 |
| GO:BP | GO:0022412 | cellular process involved in reproduction in multicellular organism | 32 | 408 | 9.645e-03 |
| GO:BP | GO:0035270 | endocrine system development | 16 | 142 | 1.008e-02 |
| GO:BP | GO:0009893 | positive regulation of metabolic process | 179 | 3648 | 1.135e-02 |
| GO:BP | GO:0060040 | retinal bipolar neuron differentiation | 4 | 8 | 1.224e-02 |
| GO:BP | GO:2000179 | positive regulation of neural precursor cell proliferation | 10 | 64 | 1.319e-02 |
| GO:BP | GO:0071542 | dopaminergic neuron differentiation | 8 | 42 | 1.456e-02 |
| GO:BP | GO:0010919 | regulation of inositol phosphate biosynthetic process | 5 | 15 | 1.557e-02 |
| GO:BP | GO:0007267 | cell-cell signaling | 76 | 1316 | 1.589e-02 |
| GO:BP | GO:0009605 | response to external stimulus | 123 | 2367 | 1.634e-02 |
| GO:BP | GO:0035115 | embryonic forelimb morphogenesis | 7 | 33 | 1.744e-02 |
| GO:BP | GO:0043010 | camera-type eye development | 28 | 352 | 1.744e-02 |
| GO:BP | GO:1903409 | reactive oxygen species biosynthetic process | 9 | 55 | 1.768e-02 |
| GO:BP | GO:0042420 | dopamine catabolic process | 4 | 9 | 1.862e-02 |
| GO:BP | GO:0007156 | homophilic cell adhesion via plasma membrane adhesion molecules | 17 | 168 | 1.930e-02 |
| GO:BP | GO:0050793 | regulation of developmental process | 126 | 2453 | 1.952e-02 |
| GO:BP | GO:0042127 | regulation of cell population proliferation | 92 | 1682 | 1.952e-02 |
| GO:BP | GO:0062013 | positive regulation of small molecule metabolic process | 15 | 138 | 1.952e-02 |
| GO:BP | GO:0072330 | monocarboxylic acid biosynthetic process | 20 | 218 | 2.027e-02 |
| GO:BP | GO:1902932 | positive regulation of alcohol biosynthetic process | 6 | 25 | 2.104e-02 |
| GO:BP | GO:0045595 | regulation of cell differentiation | 87 | 1577 | 2.104e-02 |
| GO:BP | GO:0045893 | positive regulation of DNA-templated transcription | 93 | 1710 | 2.104e-02 |
| GO:BP | GO:0051239 | regulation of multicellular organismal process | 146 | 2928 | 2.122e-02 |
| GO:BP | GO:1902680 | positive regulation of RNA biosynthetic process | 93 | 1713 | 2.144e-02 |
| GO:BP | GO:0071396 | cellular response to lipid | 41 | 609 | 2.226e-02 |
| GO:BP | GO:0065007 | biological regulation | 528 | 12671 | 2.357e-02 |
| GO:BP | GO:0003006 | developmental process involved in reproduction | 61 | 1022 | 2.358e-02 |
| GO:BP | GO:0019614 | catechol-containing compound catabolic process | 4 | 10 | 2.479e-02 |
| GO:BP | GO:0042424 | catecholamine catabolic process | 4 | 10 | 2.479e-02 |
| GO:BP | GO:0006633 | fatty acid biosynthetic process | 16 | 159 | 2.560e-02 |
| GO:BP | GO:0051094 | positive regulation of developmental process | 75 | 1331 | 2.715e-02 |
| GO:BP | GO:0062012 | regulation of small molecule metabolic process | 25 | 314 | 2.821e-02 |
| GO:BP | GO:0006334 | nucleosome assembly | 13 | 115 | 2.821e-02 |
| GO:BP | GO:0042759 | long-chain fatty acid biosynthetic process | 6 | 27 | 2.857e-02 |
| GO:BP | GO:0098742 | cell-cell adhesion via plasma-membrane adhesion molecules | 23 | 280 | 2.988e-02 |
| GO:BP | GO:0010628 | positive regulation of gene expression | 68 | 1189 | 3.217e-02 |
| GO:BP | GO:0046069 | cGMP catabolic process | 3 | 5 | 3.232e-02 |
| GO:BP | GO:0060284 | regulation of cell development | 52 | 851 | 3.278e-02 |
| GO:BP | GO:2000049 | positive regulation of cell-cell adhesion mediated by cadherin | 4 | 11 | 3.278e-02 |
| GO:BP | GO:0021515 | cell differentiation in spinal cord | 8 | 50 | 3.278e-02 |
| GO:BP | GO:0010752 | regulation of cGMP-mediated signaling | 4 | 11 | 3.278e-02 |
| GO:BP | GO:0014049 | positive regulation of glutamate secretion | 4 | 11 | 3.278e-02 |
| GO:BP | GO:2000026 | regulation of multicellular organismal development | 78 | 1413 | 3.360e-02 |
| GO:BP | GO:2000177 | regulation of neural precursor cell proliferation | 12 | 104 | 3.422e-02 |
| GO:BP | GO:0042391 | regulation of membrane potential | 31 | 433 | 3.442e-02 |
| GO:BP | GO:0034728 | nucleosome organization | 14 | 135 | 3.596e-02 |
| GO:BP | GO:0051254 | positive regulation of RNA metabolic process | 97 | 1844 | 3.596e-02 |
| GO:BP | GO:0030900 | forebrain development | 30 | 417 | 3.759e-02 |
| GO:BP | GO:0022414 | reproductive process | 84 | 1556 | 3.821e-02 |
| GO:BP | GO:1903426 | regulation of reactive oxygen species biosynthetic process | 7 | 40 | 3.821e-02 |
| GO:BP | GO:0055085 | transmembrane transport | 83 | 1538 | 4.038e-02 |
| GO:BP | GO:0003008 | system process | 115 | 2266 | 4.038e-02 |
| GO:BP | GO:0090596 | sensory organ morphogenesis | 23 | 290 | 4.038e-02 |
| GO:BP | GO:0048598 | embryonic morphogenesis | 40 | 617 | 4.038e-02 |
| GO:BP | GO:0014070 | response to organic cyclic compound | 54 | 909 | 4.145e-02 |
| GO:BP | GO:0035136 | forelimb morphogenesis | 7 | 41 | 4.145e-02 |
| GO:BP | GO:1901654 | response to ketone | 19 | 221 | 4.145e-02 |
| GO:BP | GO:0045597 | positive regulation of cell differentiation | 52 | 866 | 4.145e-02 |
| GO:BP | GO:0052652 | cyclic purine nucleotide metabolic process | 7 | 41 | 4.145e-02 |
| GO:BP | GO:0061351 | neural precursor cell proliferation | 16 | 171 | 4.226e-02 |
| GO:BP | GO:0010604 | positive regulation of macromolecule metabolic process | 160 | 3349 | 4.343e-02 |
| GO:BP | GO:0001819 | positive regulation of cytokine production | 33 | 486 | 4.343e-02 |
| GO:BP | GO:0009187 | cyclic nucleotide metabolic process | 7 | 42 | 4.343e-02 |
| GO:BP | GO:0009713 | catechol-containing compound biosynthetic process | 5 | 21 | 4.343e-02 |
| GO:BP | GO:0060322 | head development | 48 | 789 | 4.343e-02 |
| GO:BP | GO:0060563 | neuroepithelial cell differentiation | 7 | 42 | 4.343e-02 |
| GO:BP | GO:0021536 | diencephalon development | 10 | 81 | 4.343e-02 |
| GO:BP | GO:0048609 | multicellular organismal reproductive process | 57 | 980 | 4.343e-02 |
| GO:BP | GO:0065008 | regulation of biological quality | 139 | 2847 | 4.343e-02 |
| GO:BP | GO:0007218 | neuropeptide signaling pathway | 12 | 110 | 4.343e-02 |
| GO:BP | GO:1903142 | positive regulation of establishment of endothelial barrier | 3 | 6 | 4.343e-02 |
| GO:BP | GO:0042475 | odontogenesis of dentin-containing tooth | 11 | 95 | 4.343e-02 |
| GO:BP | GO:0042423 | catecholamine biosynthetic process | 5 | 21 | 4.343e-02 |
| GO:BP | GO:0007610 | behavior | 42 | 665 | 4.343e-02 |
| GO:BP | GO:0098662 | inorganic cation transmembrane transport | 49 | 811 | 4.343e-02 |
| GO:BP | GO:0048568 | embryonic organ development | 32 | 463 | 4.343e-02 |
| GO:BP | GO:0021554 | optic nerve development | 5 | 21 | 4.343e-02 |
| GO:BP | GO:1901552 | positive regulation of endothelial cell development | 3 | 6 | 4.343e-02 |
| GO:BP | GO:0043132 | NAD transport | 3 | 6 | 4.343e-02 |
| GO:BP | GO:0002065 | columnar/cuboidal epithelial cell differentiation | 13 | 126 | 4.371e-02 |
| GO:BP | GO:0008283 | cell population proliferation | 103 | 2009 | 4.371e-02 |
| GO:BP | GO:0021983 | pituitary gland development | 7 | 43 | 4.596e-02 |
| GO:BP | GO:0007501 | mesodermal cell fate specification | 4 | 13 | 4.663e-02 |
| GO:BP | GO:0036006 | cellular response to macrophage colony-stimulating factor stimulus | 4 | 13 | 4.663e-02 |
| GO:BP | GO:2001141 | regulation of RNA biosynthetic process | 164 | 3454 | 4.663e-02 |
| GO:BP | GO:0045907 | positive regulation of vasoconstriction | 6 | 32 | 4.715e-02 |
| GO:BP | GO:0045723 | positive regulation of fatty acid biosynthetic process | 5 | 22 | 4.864e-02 |
| GO:BP | GO:0008544 | epidermis development | 28 | 394 | 4.864e-02 |
| KEGG | KEGG:04080 | Neuroactive ligand-receptor interaction | 40 | 365 | 3.260e-07 |
| KEGG | KEGG:05322 | Systemic lupus erythematosus | 22 | 132 | 6.042e-07 |
| KEGG | KEGG:05034 | Alcoholism | 22 | 187 | 2.222e-04 |
| KEGG | KEGG:04613 | Neutrophil extracellular trap formation | 20 | 188 | 2.170e-03 |
| KEGG | KEGG:05032 | Morphine addiction | 12 | 89 | 6.221e-03 |
| KEGG | KEGG:04060 | Cytokine-cytokine receptor interaction | 25 | 291 | 6.221e-03 |
| KEGG | KEGG:05202 | Transcriptional misregulation in cancer | 18 | 192 | 1.531e-02 |
#write.csv(tableED, "output/table_EarlyDOXmotif.csv")


#GO:BP
tableED_GOBP_d <- tableED_d %>%
  dplyr::filter(source=="GO:BP") %>%
  dplyr::select(p_value, term_name, intersection_size) %>%
  dplyr::slice_min(., n=10, order_by=p_value) %>%
  mutate(log_val = -log10(p_value))

#saveRDS(tableED_GOBP, "data/tableED_GOBP.RDS")

tableED_GOBP_d %>% ggplot(., aes(x = log_val, y = reorder(term_name, p_value), col= intersection_size)) +
  geom_point(aes(size = intersection_size)) +
  ggtitle("Early Sustained Response Enriched GO:BP Terms")+
  xlab(expression("-log"[10]~"p-value"))+
  guides(col="none", size= guide_legend(title = "# of intersected \n terms"))+
  ylab("GO:BP term")+
  scale_y_discrete(labels = scales::label_wrap(30))+
  theme_bw()+
  theme(plot.title = element_text(size = rel(1.5), hjust = 0.5),
        axis.title = element_text(size = 15, colour = "black"),
        axis.ticks = element_line(linewidth = 1.5),
        axis.line = element_line(linewidth = 1.5),
        axis.text = element_text(size = 10, colour = "black", angle = 0),
        strip.text = element_text(size = 15, colour = "black", face = "bold"))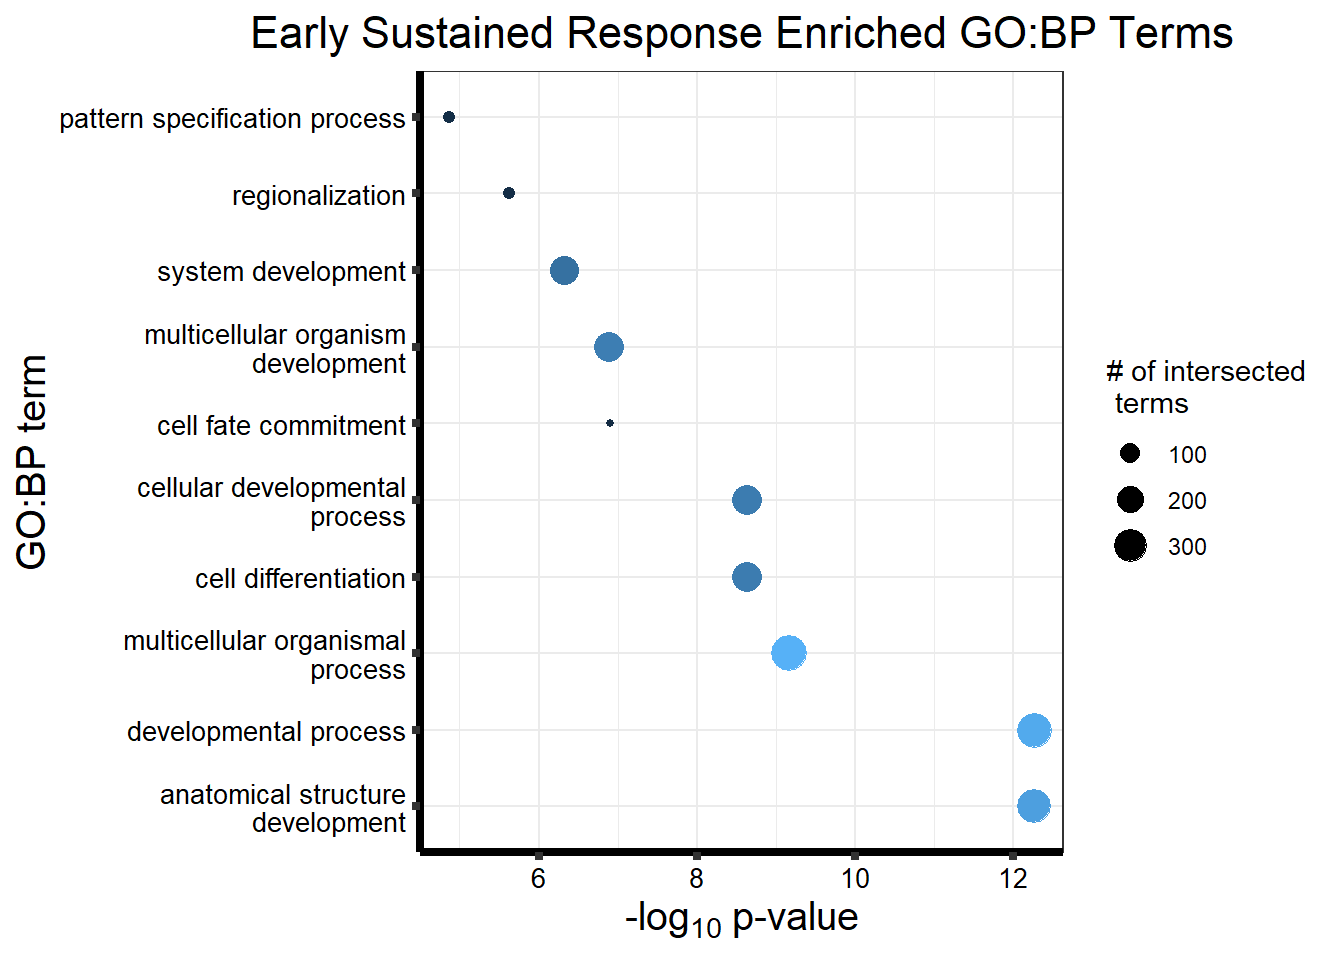
#KEGG
tableED_KEGG_d <- tableED_d %>%
  dplyr::filter(source=="KEGG") %>%
  dplyr::select(p_value, term_name, intersection_size) %>%
  dplyr::slice_min(., n=10, order_by=p_value) %>%
  mutate(log_val = -log10(p_value))

tableED_KEGG_d %>% ggplot(., aes(x = log_val, y = reorder(term_name, p_value), col= intersection_size)) +
  geom_point(aes(size = intersection_size)) +
  ggtitle("Early Sustained Response Enriched KEGG Terms")+
  xlab(expression("-log"[10]~"p-value"))+
  guides(col="none", size= guide_legend(title = "# of intersected \n terms"))+
  ylab("KEGG term")+
  scale_y_discrete(labels = scales::label_wrap(30))+
  theme_bw()+
  theme(plot.title = element_text(size = rel(1.5), hjust = 0.5),
        axis.title = element_text(size = 15, colour = "black"),
        axis.ticks = element_line(linewidth = 1.5),
        axis.line = element_line(linewidth = 1.5),
        axis.text = element_text(size = 10, colour = "black", angle = 0),
        strip.text = element_text(size = 15, colour = "black", face = "bold"))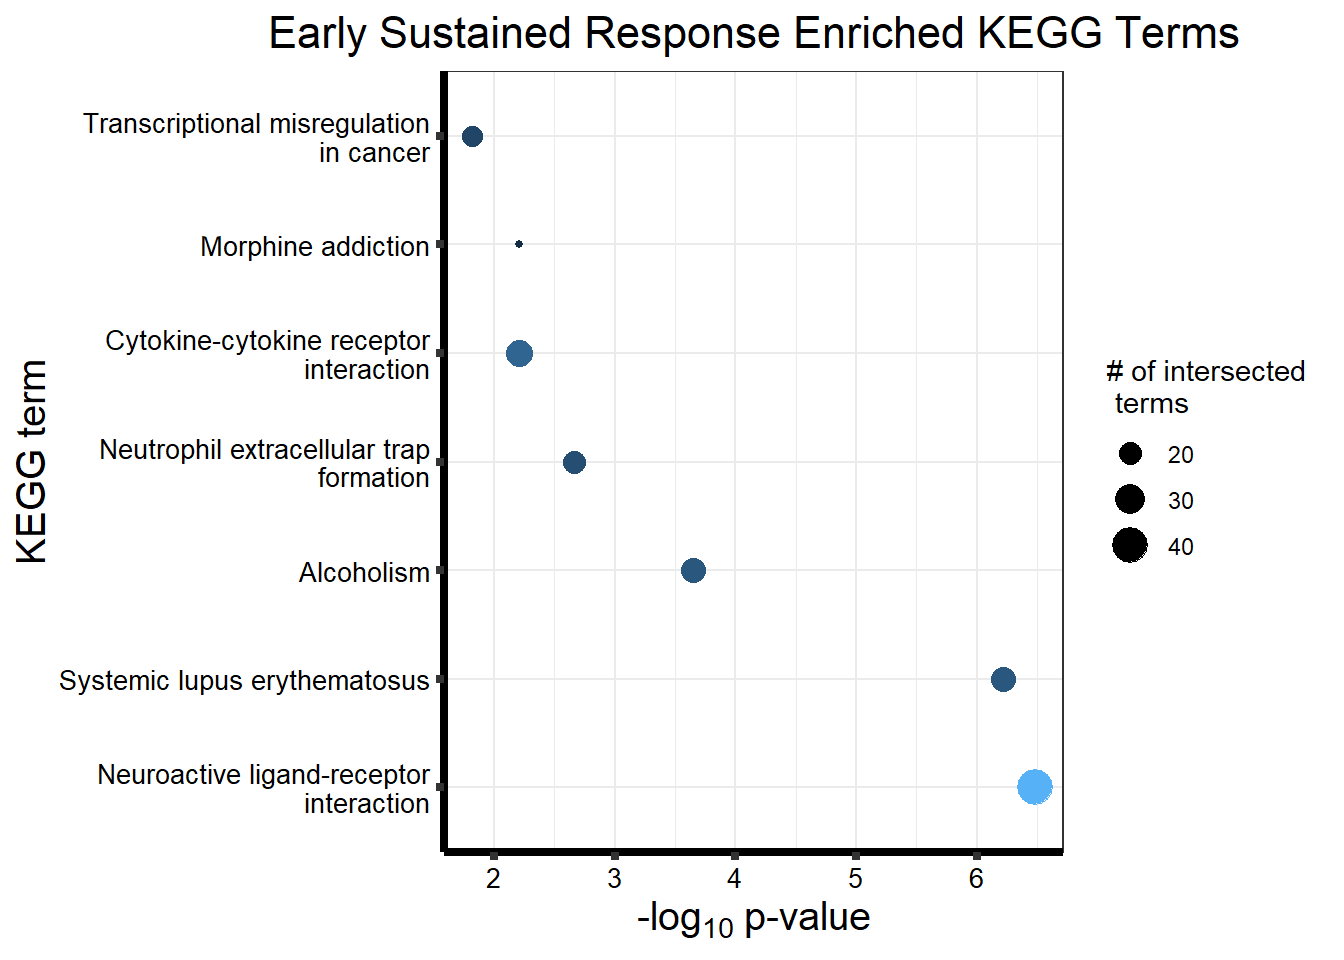
Now let’s see this with the posterior probability for the Early Sustained Response motif 4
motif_ESR_pp <- prob_motif_4

ESRmotif_genes_pp <- gost(query = motif_ESR_pp,
                      organism = "hsapiens",
                      ordered_query = FALSE,
                      measure_underrepresentation = FALSE,
                      evcodes = FALSE,
                      user_threshold = 0.05,
                      correction_method = c("fdr"),
                      sources = c("GO:BP", "KEGG"))

cormotifESRclust_pp <- gostplot(ESRmotif_genes_pp, capped = FALSE, interactive = TRUE)
cormotifESRclust_pp
tableESR_pp <- LRmotif_genes_pp$result %>%
dplyr::select(c(source, term_id, term_name, intersection_size, term_size, p_value))
tableESR_pp %>%
mutate_at(.vars = 6, .funs = scales::label_scientific(digits=4)) %>%
kableExtra::kable(.,) %>%
kableExtra::kable_paper("striped", full_width = FALSE) %>%
kableExtra::kable_styling(full_width = FALSE, position = "left", bootstrap_options = c("striped", "hover")) %>%
kableExtra::scroll_box(width = "100%", height = "400px")| source | term_id | term_name | intersection_size | term_size | p_value |
|---|---|---|---|---|---|
| GO:BP | GO:0006811 | monoatomic ion transport | 60 | 1256 | 6.212e-11 |
| GO:BP | GO:0034220 | monoatomic ion transmembrane transport | 52 | 1017 | 1.681e-10 |
| GO:BP | GO:0055085 | transmembrane transport | 65 | 1538 | 4.113e-10 |
| GO:BP | GO:0098660 | inorganic ion transmembrane transport | 45 | 903 | 1.161e-08 |
| GO:BP | GO:0015698 | inorganic anion transport | 18 | 165 | 1.375e-07 |
| GO:BP | GO:0006820 | monoatomic anion transport | 18 | 167 | 1.400e-07 |
| GO:BP | GO:0048869 | cellular developmental process | 118 | 4382 | 2.840e-07 |
| GO:BP | GO:0030154 | cell differentiation | 118 | 4381 | 2.840e-07 |
| GO:BP | GO:0006810 | transport | 117 | 4341 | 2.971e-07 |
| GO:BP | GO:0006821 | chloride transport | 15 | 122 | 4.430e-07 |
| GO:BP | GO:0032501 | multicellular organismal process | 167 | 7234 | 1.046e-06 |
| GO:BP | GO:0006812 | monoatomic cation transport | 43 | 1032 | 2.823e-06 |
| GO:BP | GO:0098656 | monoatomic anion transmembrane transport | 15 | 142 | 2.844e-06 |
| GO:BP | GO:0032502 | developmental process | 152 | 6478 | 3.014e-06 |
| GO:BP | GO:0048468 | cell development | 83 | 2833 | 4.124e-06 |
| GO:BP | GO:1902476 | chloride transmembrane transport | 13 | 107 | 4.238e-06 |
| GO:BP | GO:0098655 | monoatomic cation transmembrane transport | 37 | 832 | 4.606e-06 |
| GO:BP | GO:0050896 | response to stimulus | 193 | 8993 | 4.865e-06 |
| GO:BP | GO:0030001 | metal ion transport | 38 | 875 | 4.881e-06 |
| GO:BP | GO:0007193 | adenylate cyclase-inhibiting G protein-coupled receptor signaling pathway | 11 | 79 | 1.047e-05 |
| GO:BP | GO:0007267 | cell-cell signaling | 48 | 1316 | 1.298e-05 |
| GO:BP | GO:0051234 | establishment of localization | 120 | 4869 | 1.533e-05 |
| GO:BP | GO:0065008 | regulation of biological quality | 81 | 2847 | 1.552e-05 |
| GO:BP | GO:0065007 | biological regulation | 247 | 12671 | 1.617e-05 |
| GO:BP | GO:0007188 | adenylate cyclase-modulating G protein-coupled receptor signaling pathway | 18 | 248 | 1.781e-05 |
| GO:BP | GO:0098661 | inorganic anion transmembrane transport | 13 | 127 | 2.060e-05 |
| GO:BP | GO:0098662 | inorganic cation transmembrane transport | 34 | 811 | 4.571e-05 |
| GO:BP | GO:0048856 | anatomical structure development | 136 | 5924 | 7.416e-05 |
| GO:BP | GO:0022414 | reproductive process | 51 | 1556 | 9.471e-05 |
| GO:BP | GO:0051179 | localization | 127 | 5521 | 2.049e-04 |
| GO:BP | GO:0006813 | potassium ion transport | 16 | 238 | 2.050e-04 |
| GO:BP | GO:0015711 | organic anion transport | 22 | 442 | 3.627e-04 |
| GO:BP | GO:0023052 | signaling | 142 | 6471 | 4.510e-04 |
| GO:BP | GO:0051480 | regulation of cytosolic calcium ion concentration | 8 | 59 | 5.282e-04 |
| GO:BP | GO:0007154 | cell communication | 142 | 6496 | 5.345e-04 |
| GO:BP | GO:0048232 | male gamete generation | 27 | 654 | 8.075e-04 |
| GO:BP | GO:0003006 | developmental process involved in reproduction | 36 | 1022 | 8.341e-04 |
| GO:BP | GO:0010817 | regulation of hormone levels | 24 | 548 | 9.563e-04 |
| GO:BP | GO:0071805 | potassium ion transmembrane transport | 14 | 213 | 9.594e-04 |
| GO:BP | GO:0002521 | leukocyte differentiation | 26 | 632 | 1.150e-03 |
| GO:BP | GO:0007186 | G protein-coupled receptor signaling pathway | 41 | 1275 | 1.504e-03 |
| GO:BP | GO:0050789 | regulation of biological process | 232 | 12278 | 1.750e-03 |
| GO:BP | GO:0035725 | sodium ion transmembrane transport | 12 | 169 | 1.750e-03 |
| GO:BP | GO:0007275 | multicellular organism development | 107 | 4658 | 1.750e-03 |
| GO:BP | GO:0099536 | synaptic signaling | 29 | 783 | 2.264e-03 |
| GO:BP | GO:0007283 | spermatogenesis | 25 | 637 | 3.208e-03 |
| GO:BP | GO:0030003 | intracellular monoatomic cation homeostasis | 22 | 521 | 3.208e-03 |
| GO:BP | GO:0019953 | sexual reproduction | 36 | 1103 | 3.281e-03 |
| GO:BP | GO:0055082 | intracellular chemical homeostasis | 27 | 723 | 3.477e-03 |
| GO:BP | GO:0042592 | homeostatic process | 49 | 1711 | 3.593e-03 |
| GO:BP | GO:0006873 | intracellular monoatomic ion homeostasis | 22 | 530 | 3.743e-03 |
| GO:BP | GO:0048731 | system development | 93 | 3985 | 3.743e-03 |
| GO:BP | GO:0098771 | inorganic ion homeostasis | 22 | 531 | 3.776e-03 |
| GO:BP | GO:0050877 | nervous system process | 44 | 1489 | 4.173e-03 |
| GO:BP | GO:0055074 | calcium ion homeostasis | 16 | 326 | 5.815e-03 |
| GO:BP | GO:0140013 | meiotic nuclear division | 12 | 198 | 6.435e-03 |
| GO:BP | GO:0021879 | forebrain neuron differentiation | 6 | 46 | 6.491e-03 |
| GO:BP | GO:0099537 | trans-synaptic signaling | 27 | 759 | 6.655e-03 |
| GO:BP | GO:0035270 | endocrine system development | 10 | 142 | 6.926e-03 |
| GO:BP | GO:0055080 | monoatomic cation homeostasis | 23 | 598 | 6.926e-03 |
| GO:BP | GO:0048609 | multicellular organismal reproductive process | 32 | 980 | 7.045e-03 |
| GO:BP | GO:0007200 | phospholipase C-activating G protein-coupled receptor signaling pathway | 9 | 116 | 7.045e-03 |
| GO:BP | GO:0048878 | chemical homeostasis | 33 | 1026 | 7.079e-03 |
| GO:BP | GO:0006814 | sodium ion transport | 13 | 235 | 7.216e-03 |
| GO:BP | GO:0006874 | intracellular calcium ion homeostasis | 15 | 302 | 7.216e-03 |
| GO:BP | GO:0010951 | negative regulation of endopeptidase activity | 5 | 31 | 7.902e-03 |
| GO:BP | GO:0050801 | monoatomic ion homeostasis | 23 | 608 | 7.924e-03 |
| GO:BP | GO:0002429 | immune response-activating cell surface receptor signaling pathway | 15 | 306 | 7.976e-03 |
| GO:BP | GO:0007276 | gamete generation | 28 | 822 | 8.608e-03 |
| GO:BP | GO:0042445 | hormone metabolic process | 13 | 243 | 9.261e-03 |
| GO:BP | GO:0001775 | cell activation | 34 | 1098 | 1.012e-02 |
| GO:BP | GO:0046903 | secretion | 31 | 968 | 1.091e-02 |
| GO:BP | GO:0051716 | cellular response to stimulus | 148 | 7320 | 1.099e-02 |
| GO:BP | GO:0007268 | chemical synaptic transmission | 26 | 753 | 1.099e-02 |
| GO:BP | GO:0098916 | anterograde trans-synaptic signaling | 26 | 753 | 1.099e-02 |
| GO:BP | GO:0042221 | response to chemical | 88 | 3867 | 1.099e-02 |
| GO:BP | GO:0019722 | calcium-mediated signaling | 12 | 218 | 1.157e-02 |
| GO:BP | GO:1901700 | response to oxygen-containing compound | 45 | 1632 | 1.161e-02 |
| GO:BP | GO:0050957 | equilibrioception | 3 | 8 | 1.165e-02 |
| GO:BP | GO:0060348 | bone development | 12 | 220 | 1.196e-02 |
| GO:BP | GO:1903046 | meiotic cell cycle process | 12 | 220 | 1.196e-02 |
| GO:BP | GO:0009410 | response to xenobiotic stimulus | 18 | 436 | 1.232e-02 |
| GO:BP | GO:0007140 | male meiotic nuclear division | 6 | 55 | 1.232e-02 |
| GO:BP | GO:0021630 | olfactory nerve maturation | 2 | 2 | 1.261e-02 |
| GO:BP | GO:0042110 | T cell activation | 21 | 558 | 1.261e-02 |
| GO:BP | GO:0021872 | forebrain generation of neurons | 6 | 56 | 1.261e-02 |
| GO:BP | GO:0030098 | lymphocyte differentiation | 18 | 438 | 1.261e-02 |
| GO:BP | GO:0036368 | cone photoresponse recovery | 2 | 2 | 1.261e-02 |
| GO:BP | GO:0040020 | regulation of meiotic nuclear division | 5 | 36 | 1.261e-02 |
| GO:BP | GO:0050851 | antigen receptor-mediated signaling pathway | 11 | 192 | 1.285e-02 |
| GO:BP | GO:0051321 | meiotic cell cycle | 14 | 294 | 1.330e-02 |
| GO:BP | GO:0098609 | cell-cell adhesion | 30 | 948 | 1.330e-02 |
| GO:BP | GO:0007155 | cell adhesion | 42 | 1511 | 1.363e-02 |
| GO:BP | GO:0045321 | leukocyte activation | 30 | 951 | 1.372e-02 |
| GO:BP | GO:0021536 | diencephalon development | 7 | 81 | 1.409e-02 |
| GO:BP | GO:0007600 | sensory perception | 30 | 955 | 1.413e-02 |
| GO:BP | GO:0002768 | immune response-regulating cell surface receptor signaling pathway | 15 | 334 | 1.413e-02 |
| GO:BP | GO:0045055 | regulated exocytosis | 12 | 229 | 1.413e-02 |
| GO:BP | GO:0030450 | regulation of complement activation, classical pathway | 3 | 9 | 1.413e-02 |
| GO:BP | GO:1903131 | mononuclear cell differentiation | 20 | 529 | 1.475e-02 |
| GO:BP | GO:0019725 | cellular homeostasis | 27 | 826 | 1.487e-02 |
| GO:BP | GO:0048485 | sympathetic nervous system development | 4 | 22 | 1.570e-02 |
| GO:BP | GO:0046649 | lymphocyte activation | 26 | 787 | 1.582e-02 |
| GO:BP | GO:0048732 | gland development | 18 | 454 | 1.582e-02 |
| GO:BP | GO:0051932 | synaptic transmission, GABAergic | 6 | 60 | 1.582e-02 |
| GO:BP | GO:0002366 | leukocyte activation involved in immune response | 14 | 305 | 1.666e-02 |
| GO:BP | GO:0050794 | regulation of cellular process | 219 | 11876 | 1.689e-02 |
| GO:BP | GO:0021953 | central nervous system neuron differentiation | 11 | 203 | 1.722e-02 |
| GO:BP | GO:0046942 | carboxylic acid transport | 15 | 344 | 1.746e-02 |
| GO:BP | GO:0015849 | organic acid transport | 15 | 345 | 1.783e-02 |
| GO:BP | GO:0009581 | detection of external stimulus | 9 | 142 | 1.795e-02 |
| GO:BP | GO:0002263 | cell activation involved in immune response | 14 | 309 | 1.795e-02 |
| GO:BP | GO:0030217 | T cell differentiation | 14 | 312 | 1.958e-02 |
| GO:BP | GO:1903306 | negative regulation of regulated secretory pathway | 4 | 24 | 1.990e-02 |
| GO:BP | GO:0009582 | detection of abiotic stimulus | 9 | 145 | 2.023e-02 |
| GO:BP | GO:0003008 | system process | 56 | 2266 | 2.064e-02 |
| GO:BP | GO:0009888 | tissue development | 51 | 2012 | 2.112e-02 |
| GO:BP | GO:0006869 | lipid transport | 17 | 431 | 2.155e-02 |
| GO:BP | GO:1903977 | positive regulation of glial cell migration | 3 | 11 | 2.180e-02 |
| GO:BP | GO:0015747 | urate transport | 3 | 11 | 2.180e-02 |
| GO:BP | GO:0003341 | cilium movement | 11 | 212 | 2.195e-02 |
| GO:BP | GO:0042391 | regulation of membrane potential | 17 | 433 | 2.195e-02 |
| GO:BP | GO:0046631 | alpha-beta T cell activation | 10 | 181 | 2.355e-02 |
| GO:BP | GO:0050848 | regulation of calcium-mediated signaling | 7 | 93 | 2.463e-02 |
| GO:BP | GO:0006311 | meiotic gene conversion | 2 | 3 | 2.463e-02 |
| GO:BP | GO:0010466 | negative regulation of peptidase activity | 5 | 45 | 2.463e-02 |
| GO:BP | GO:0010481 | epidermal cell division | 2 | 3 | 2.463e-02 |
| GO:BP | GO:0010482 | regulation of epidermal cell division | 2 | 3 | 2.463e-02 |
| GO:BP | GO:0071486 | cellular response to high light intensity | 2 | 3 | 2.463e-02 |
| GO:BP | GO:0033563 | dorsal/ventral axon guidance | 2 | 3 | 2.463e-02 |
| GO:BP | GO:0021605 | cranial nerve maturation | 2 | 3 | 2.463e-02 |
| GO:BP | GO:0021895 | cerebral cortex neuron differentiation | 4 | 26 | 2.463e-02 |
| GO:BP | GO:1902105 | regulation of leukocyte differentiation | 14 | 325 | 2.463e-02 |
| GO:BP | GO:0002064 | epithelial cell development | 11 | 217 | 2.463e-02 |
| GO:BP | GO:0051445 | regulation of meiotic cell cycle | 6 | 69 | 2.584e-02 |
| GO:BP | GO:0048513 | animal organ development | 70 | 3047 | 2.597e-02 |
| GO:BP | GO:0030097 | hemopoiesis | 29 | 971 | 2.827e-02 |
| GO:BP | GO:1903708 | positive regulation of hemopoiesis | 10 | 189 | 2.899e-02 |
| GO:BP | GO:1902107 | positive regulation of leukocyte differentiation | 10 | 189 | 2.899e-02 |
| GO:BP | GO:0002065 | columnar/cuboidal epithelial cell differentiation | 8 | 126 | 2.899e-02 |
| GO:BP | GO:0008283 | cell population proliferation | 50 | 2009 | 2.927e-02 |
| GO:BP | GO:0051446 | positive regulation of meiotic cell cycle | 4 | 28 | 2.927e-02 |
| GO:BP | GO:0006817 | phosphate ion transport | 4 | 28 | 2.927e-02 |
| GO:BP | GO:0048806 | genitalia development | 5 | 48 | 2.927e-02 |
| GO:BP | GO:0009653 | anatomical structure morphogenesis | 63 | 2692 | 2.952e-02 |
| GO:BP | GO:1904888 | cranial skeletal system development | 6 | 72 | 2.992e-02 |
| GO:BP | GO:0001501 | skeletal system development | 19 | 536 | 3.011e-02 |
| GO:BP | GO:0043301 | negative regulation of leukocyte degranulation | 3 | 13 | 3.011e-02 |
| GO:BP | GO:0042403 | thyroid hormone metabolic process | 4 | 29 | 3.176e-02 |
| GO:BP | GO:0007214 | gamma-aminobutyric acid signaling pathway | 4 | 29 | 3.176e-02 |
| GO:BP | GO:0060249 | anatomical structure homeostasis | 12 | 264 | 3.206e-02 |
| GO:BP | GO:0001894 | tissue homeostasis | 12 | 264 | 3.206e-02 |
| GO:BP | GO:0030900 | forebrain development | 16 | 417 | 3.206e-02 |
| GO:BP | GO:0060429 | epithelium development | 34 | 1229 | 3.455e-02 |
| GO:BP | GO:0007127 | meiosis I | 8 | 132 | 3.539e-02 |
| GO:BP | GO:0140352 | export from cell | 27 | 901 | 3.547e-02 |
| GO:BP | GO:0035589 | G protein-coupled purinergic nucleotide receptor signaling pathway | 3 | 14 | 3.548e-02 |
| GO:BP | GO:0048518 | positive regulation of biological process | 125 | 6235 | 3.604e-02 |
| GO:BP | GO:0043410 | positive regulation of MAPK cascade | 17 | 465 | 3.669e-02 |
| GO:BP | GO:0014070 | response to organic cyclic compound | 27 | 909 | 3.791e-02 |
| GO:BP | GO:0006968 | cellular defense response | 5 | 52 | 3.791e-02 |
| GO:BP | GO:0046352 | disaccharide catabolic process | 2 | 4 | 3.791e-02 |
| GO:BP | GO:0010845 | positive regulation of reciprocal meiotic recombination | 2 | 4 | 3.791e-02 |
| GO:BP | GO:0060294 | cilium movement involved in cell motility | 9 | 167 | 3.791e-02 |
| GO:BP | GO:0021682 | nerve maturation | 2 | 4 | 3.791e-02 |
| GO:BP | GO:0035822 | gene conversion | 2 | 4 | 3.791e-02 |
| GO:BP | GO:0141006 | transposable element silencing by piRNA-mediated heterochromatin formation | 2 | 4 | 3.791e-02 |
| GO:BP | GO:0140966 | piRNA-mediated heterochromatin formation | 2 | 4 | 3.791e-02 |
| GO:BP | GO:0010520 | regulation of reciprocal meiotic recombination | 2 | 4 | 3.791e-02 |
| GO:BP | GO:0045728 | respiratory burst after phagocytosis | 2 | 4 | 3.791e-02 |
| GO:BP | GO:1990834 | response to odorant | 2 | 4 | 3.791e-02 |
| GO:BP | GO:0009605 | response to external stimulus | 56 | 2367 | 3.880e-02 |
| GO:BP | GO:0071695 | anatomical structure maturation | 12 | 274 | 3.887e-02 |
| GO:BP | GO:0006816 | calcium ion transport | 16 | 433 | 4.134e-02 |
| GO:BP | GO:0007165 | signal transduction | 120 | 5979 | 4.180e-02 |
| GO:BP | GO:0007399 | nervous system development | 59 | 2541 | 4.341e-02 |
| GO:BP | GO:2000241 | regulation of reproductive process | 10 | 206 | 4.341e-02 |
| GO:BP | GO:0060285 | cilium-dependent cell motility | 9 | 172 | 4.341e-02 |
| GO:BP | GO:0001539 | cilium or flagellum-dependent cell motility | 9 | 172 | 4.341e-02 |
| GO:BP | GO:0030855 | epithelial cell differentiation | 23 | 741 | 4.442e-02 |
| GO:BP | GO:0032940 | secretion by cell | 25 | 832 | 4.442e-02 |
| GO:BP | GO:0007218 | neuropeptide signaling pathway | 7 | 110 | 4.452e-02 |
| GO:BP | GO:0006957 | complement activation, alternative pathway | 3 | 16 | 4.452e-02 |
| GO:BP | GO:0007194 | negative regulation of adenylate cyclase activity | 3 | 16 | 4.452e-02 |
| GO:BP | GO:0010876 | lipid localization | 17 | 480 | 4.452e-02 |
| GO:BP | GO:0061982 | meiosis I cell cycle process | 8 | 141 | 4.452e-02 |
| GO:BP | GO:0061101 | neuroendocrine cell differentiation | 3 | 16 | 4.452e-02 |
| GO:BP | GO:0043374 | CD8-positive, alpha-beta T cell differentiation | 3 | 16 | 4.452e-02 |
| GO:BP | GO:0048522 | positive regulation of cellular process | 118 | 5886 | 4.481e-02 |
| GO:BP | GO:1903530 | regulation of secretion by cell | 19 | 567 | 4.481e-02 |
| GO:BP | GO:0003382 | epithelial cell morphogenesis | 4 | 34 | 4.481e-02 |
| GO:BP | GO:0043270 | positive regulation of monoatomic ion transport | 10 | 209 | 4.481e-02 |
| GO:BP | GO:0010526 | transposable element silencing | 4 | 34 | 4.481e-02 |
| GO:BP | GO:0015701 | bicarbonate transport | 4 | 34 | 4.481e-02 |
| GO:BP | GO:0045745 | positive regulation of G protein-coupled receptor signaling pathway | 4 | 34 | 4.481e-02 |
| GO:BP | GO:0050870 | positive regulation of T cell activation | 11 | 248 | 4.822e-02 |
| GO:BP | GO:0009566 | fertilization | 10 | 212 | 4.830e-02 |
| GO:BP | GO:0045577 | regulation of B cell differentiation | 4 | 35 | 4.848e-02 |
| GO:BP | GO:0051050 | positive regulation of transport | 25 | 844 | 4.848e-02 |
| GO:BP | GO:0043299 | leukocyte degranulation | 6 | 84 | 4.848e-02 |
| GO:BP | GO:0043949 | regulation of cAMP-mediated signaling | 4 | 35 | 4.848e-02 |
| GO:BP | GO:0002679 | respiratory burst involved in defense response | 3 | 17 | 4.900e-02 |
| GO:BP | GO:0009642 | response to light intensity | 3 | 17 | 4.900e-02 |
| GO:BP | GO:0009628 | response to abiotic stimulus | 31 | 1130 | 4.900e-02 |
| GO:BP | GO:0031280 | negative regulation of cyclase activity | 3 | 17 | 4.900e-02 |
| GO:BP | GO:0045917 | positive regulation of complement activation | 2 | 5 | 4.921e-02 |
| GO:BP | GO:0045920 | negative regulation of exocytosis | 4 | 36 | 4.921e-02 |
| GO:BP | GO:0070995 | NADPH oxidation | 2 | 5 | 4.921e-02 |
| GO:BP | GO:2000611 | positive regulation of thyroid hormone generation | 2 | 5 | 4.921e-02 |
| GO:BP | GO:0032197 | retrotransposition | 4 | 36 | 4.921e-02 |
| GO:BP | GO:0007610 | behavior | 21 | 665 | 4.921e-02 |
| GO:BP | GO:0009644 | response to high light intensity | 2 | 5 | 4.921e-02 |
| GO:BP | GO:0009887 | animal organ morphogenesis | 29 | 1037 | 4.921e-02 |
| GO:BP | GO:0030317 | flagellated sperm motility | 8 | 147 | 4.921e-02 |
| GO:BP | GO:0009914 | hormone transport | 13 | 328 | 4.921e-02 |
| GO:BP | GO:0097722 | sperm motility | 8 | 147 | 4.921e-02 |
| GO:BP | GO:0023061 | signal release | 17 | 493 | 4.921e-02 |
| GO:BP | GO:0071484 | cellular response to light intensity | 2 | 5 | 4.921e-02 |
| GO:BP | GO:0042127 | regulation of cell population proliferation | 42 | 1682 | 4.921e-02 |
| GO:BP | GO:0002434 | immune complex clearance | 2 | 5 | 4.921e-02 |
| GO:BP | GO:0045216 | cell-cell junction organization | 10 | 216 | 4.931e-02 |
| KEGG | KEGG:04080 | Neuroactive ligand-receptor interaction | 25 | 365 | 1.188e-05 |
write.csv(tableESR_pp, "output/table_ESRmotif.csv")

#GO:BP
tableESR_GOBP_pp <- tableESR_pp %>%
  dplyr::filter(source=="GO:BP") %>%
  dplyr::select(p_value, term_name, intersection_size) %>%
  dplyr::slice_min(., n=10, order_by=p_value) %>%
  mutate(log_val = -log10(p_value))

#saveRDS(tableESR_GOBP_pp, "data/tableESR_GOBP_postprob.RDS")

tableESR_GOBP_pp %>% ggplot(., aes(x = log_val, y = reorder(term_name, p_value), col= intersection_size)) +
  geom_point(aes(size = intersection_size)) +
  ggtitle("No Response Enriched GO:BP Terms")+
  xlab(expression("-log"[10]~"p-value"))+
  guides(col="none", size= guide_legend(title = "# of intersected \n terms"))+
  ylab("GO:BP term")+
  scale_y_discrete(labels = scales::label_wrap(30))+
  theme_bw()+
  theme(plot.title = element_text(size = rel(1.5), hjust = 0.5),
        axis.title = element_text(size = 15, colour = "black"),
        axis.ticks = element_line(linewidth = 1.5),
        axis.line = element_line(linewidth = 1.5),
        axis.text = element_text(size = 10, colour = "black", angle = 0),
        strip.text = element_text(size = 15, colour = "black", face = "bold"))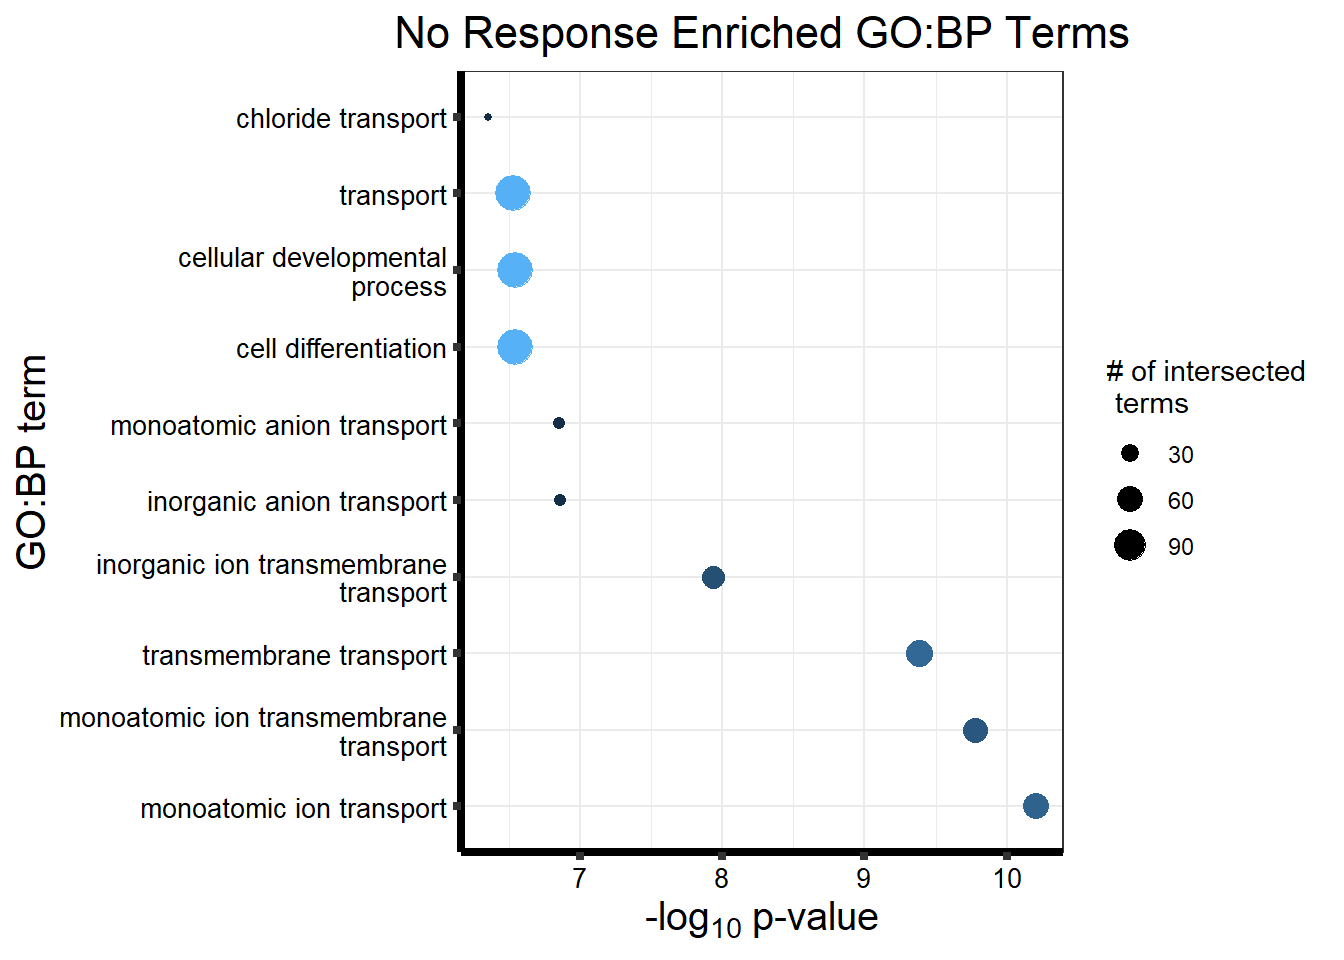
#KEGG
tableESR_KEGG_pp <- tableESR_pp %>%
  dplyr::filter(source=="KEGG") %>%
  dplyr::select(p_value, term_name, intersection_size) %>%
  dplyr::slice_min(., n=10, order_by=p_value) %>%
  mutate(log_val = -log10(p_value))

tableESR_KEGG_pp %>% ggplot(., aes(x = log_val, y = reorder(term_name, p_value), col= intersection_size)) +
  geom_point(aes(size = intersection_size)) +
  ggtitle("No Response Enriched KEGG Terms")+
  xlab(expression("-log"[10]~"p-value"))+
  guides(col="none", size= guide_legend(title = "# of intersected \n terms"))+
  ylab("KEGG term")+
  scale_y_discrete(labels = scales::label_wrap(30))+
  theme_bw()+
  theme(plot.title = element_text(size = rel(1.5), hjust = 0.5),
        axis.title = element_text(size = 15, colour = "black"),
        axis.ticks = element_line(linewidth = 1.5),
        axis.line = element_line(linewidth = 1.5),
        axis.text = element_text(size = 10, colour = "black", angle = 0),
        strip.text = element_text(size = 15, colour = "black", face = "bold"))
Currently for the posterior probability code - motif 3 and motif 4 are showing up identically
sessionInfo()R version 4.4.2 (2024-10-31 ucrt)
Platform: x86_64-w64-mingw32/x64
Running under: Windows 11 x64 (build 22000)
Matrix products: default
locale:
[1] LC_COLLATE=English_United States.utf8
[2] LC_CTYPE=English_United States.utf8
[3] LC_MONETARY=English_United States.utf8
[4] LC_NUMERIC=C
[5] LC_TIME=English_United States.utf8
time zone: America/Chicago
tzcode source: internal
attached base packages:
[1] stats4 stats graphics grDevices utils datasets methods
[8] base
other attached packages:
[1] gprofiler2_0.2.3 cowplot_1.1.3
[3] Rfast_2.1.5.1 RcppParallel_5.1.10
[5] zigg_0.0.2 Rcpp_1.0.13-1
[7] RUVSeq_1.40.0 EDASeq_2.40.0
[9] ShortRead_1.64.0 GenomicAlignments_1.42.0
[11] SummarizedExperiment_1.36.0 MatrixGenerics_1.18.1
[13] matrixStats_1.4.1 Rsamtools_2.22.0
[15] GenomicRanges_1.58.0 Biostrings_2.74.0
[17] GenomeInfoDb_1.42.3 XVector_0.46.0
[19] IRanges_2.40.0 S4Vectors_0.44.0
[21] BiocParallel_1.40.0 biomaRt_2.62.1
[23] RColorBrewer_1.1-3 Cormotif_1.52.0
[25] affy_1.84.0 Biobase_2.66.0
[27] BiocGenerics_0.52.0 PCAtools_2.18.0
[29] ggfortify_0.4.17 pheatmap_1.0.12
[31] edgeR_4.4.0 limma_3.62.1
[33] readxl_1.4.3 edgebundleR_0.1.4
[35] lubridate_1.9.3 forcats_1.0.0
[37] stringr_1.5.1 dplyr_1.1.4
[39] purrr_1.0.2 readr_2.1.5
[41] tidyr_1.3.1 tidyverse_2.0.0
[43] tibble_3.2.1 hrbrthemes_0.8.7
[45] reshape2_1.4.4 ggrepel_0.9.6
[47] ggplot2_3.5.1 workflowr_1.7.1
loaded via a namespace (and not attached):
[1] later_1.4.1 BiocIO_1.16.0
[3] bitops_1.0-9 filelock_1.0.3
[5] R.oo_1.27.0 cellranger_1.1.0
[7] preprocessCore_1.68.0 XML_3.99-0.18
[9] lifecycle_1.0.4 httr2_1.1.0
[11] pwalign_1.2.0 rprojroot_2.0.4
[13] MASS_7.3-61 processx_3.8.5
[15] lattice_0.22-6 crosstalk_1.2.1
[17] magrittr_2.0.3 plotly_4.10.4
[19] sass_0.4.9 rmarkdown_2.29
[21] jquerylib_0.1.4 yaml_2.3.10
[23] httpuv_1.6.15 DBI_1.2.3
[25] abind_1.4-8 zlibbioc_1.52.0
[27] R.utils_2.12.3 RCurl_1.98-1.16
[29] rappdirs_0.3.3 git2r_0.35.0
[31] gdtools_0.4.1 GenomeInfoDbData_1.2.13
[33] irlba_2.3.5.1 dqrng_0.4.1
[35] svglite_2.1.3 DelayedMatrixStats_1.28.1
[37] codetools_0.2-20 DelayedArray_0.32.0
[39] xml2_1.3.6 tidyselect_1.2.1
[41] farver_2.1.2 UCSC.utils_1.2.0
[43] ScaledMatrix_1.14.0 BiocFileCache_2.14.0
[45] jsonlite_1.8.9 systemfonts_1.1.0
[47] tools_4.4.2 progress_1.2.3
[49] glue_1.8.0 gridExtra_2.3
[51] Rttf2pt1_1.3.12 SparseArray_1.6.0
[53] xfun_0.49 withr_3.0.2
[55] BiocManager_1.30.25 fastmap_1.2.0
[57] latticeExtra_0.6-30 callr_3.7.6
[59] digest_0.6.37 rsvd_1.0.5
[61] timechange_0.3.0 R6_2.6.1
[63] mime_0.12 colorspace_2.1-1
[65] jpeg_0.1-10 RSQLite_2.3.8
[67] R.methodsS3_1.8.2 generics_0.1.3
[69] data.table_1.16.4 fontLiberation_0.1.0
[71] rtracklayer_1.66.0 prettyunits_1.2.0
[73] httr_1.4.7 htmlwidgets_1.6.4
[75] S4Arrays_1.6.0 whisker_0.4.1
[77] pkgconfig_2.0.3 gtable_0.3.6
[79] blob_1.2.4 hwriter_1.3.2.1
[81] htmltools_0.5.8.1 fontBitstreamVera_0.1.1
[83] kableExtra_1.4.0 scales_1.3.0
[85] png_0.1-8 knitr_1.49
[87] rstudioapi_0.17.1 tzdb_0.4.0
[89] rjson_0.2.23 curl_6.0.1
[91] cachem_1.1.0 parallel_4.4.2
[93] extrafont_0.19 AnnotationDbi_1.68.0
[95] restfulr_0.0.15 pillar_1.10.1
[97] grid_4.4.2 vctrs_0.6.5
[99] promises_1.3.2 BiocSingular_1.22.0
[101] dbplyr_2.5.0 beachmat_2.22.0
[103] xtable_1.8-4 extrafontdb_1.0
[105] evaluate_1.0.3 GenomicFeatures_1.58.0
[107] cli_3.6.3 locfit_1.5-9.10
[109] compiler_4.4.2 rlang_1.1.4
[111] crayon_1.5.3 labeling_0.4.3
[113] aroma.light_3.36.0 interp_1.1-6
[115] ps_1.8.1 getPass_0.2-4
[117] plyr_1.8.9 fs_1.6.5
[119] stringi_1.8.4 viridisLite_0.4.2
[121] deldir_2.0-4 munsell_0.5.1
[123] lazyeval_0.2.2 fontquiver_0.2.1
[125] Matrix_1.7-1 hms_1.1.3
[127] sparseMatrixStats_1.18.0 bit64_4.5.2
[129] KEGGREST_1.46.0 statmod_1.5.0
[131] shiny_1.10.0 igraph_2.1.1
[133] memoise_2.0.1 affyio_1.76.0
[135] bslib_0.9.0 bit_4.5.0