Results publication
Jens Daniel Müller
11 August, 2022
Last updated: 2022-08-11
Checks: 7 0
Knit directory: emlr_obs_analysis/analysis/
This reproducible R Markdown analysis was created with workflowr (version 1.7.0). The Checks tab describes the reproducibility checks that were applied when the results were created. The Past versions tab lists the development history.
Great! Since the R Markdown file has been committed to the Git repository, you know the exact version of the code that produced these results.
Great job! The global environment was empty. Objects defined in the global environment can affect the analysis in your R Markdown file in unknown ways. For reproduciblity it’s best to always run the code in an empty environment.
The command set.seed(20210412) was run prior to running the code in the R Markdown file. Setting a seed ensures that any results that rely on randomness, e.g. subsampling or permutations, are reproducible.
Great job! Recording the operating system, R version, and package versions is critical for reproducibility.
Nice! There were no cached chunks for this analysis, so you can be confident that you successfully produced the results during this run.
Great job! Using relative paths to the files within your workflowr project makes it easier to run your code on other machines.
Great! You are using Git for version control. Tracking code development and connecting the code version to the results is critical for reproducibility.
The results in this page were generated with repository version 77719db. See the Past versions tab to see a history of the changes made to the R Markdown and HTML files.
Note that you need to be careful to ensure that all relevant files for the analysis have been committed to Git prior to generating the results (you can use wflow_publish or wflow_git_commit). workflowr only checks the R Markdown file, but you know if there are other scripts or data files that it depends on. Below is the status of the Git repository when the results were generated:
Ignored files:
    Ignored:    .Rhistory
    Ignored:    .Rproj.user/
    Ignored:    data/
    Ignored:    output/other/
    Ignored:    output/publication/

Unstaged changes:
    Modified:   code/Workflowr_project_managment.R
Note that any generated files, e.g. HTML, png, CSS, etc., are not included in this status report because it is ok for generated content to have uncommitted changes.
These are the previous versions of the repository in which changes were made to the R Markdown (analysis/results_publication.Rmd) and HTML (docs/results_publication.html) files. If you’ve configured a remote Git repository (see ?wflow_git_remote), click on the hyperlinks in the table below to view the files as they were in that past version.
| File | Version | Author | Date | Message |
|---|---|---|---|---|
| Rmd | 77719db | jens-daniel-mueller | 2022-08-11 | rebuild with 5 basin separation as standard case |
| html | 318fefe | jens-daniel-mueller | 2022-08-11 | Build site. |
| Rmd | 60dae4b | jens-daniel-mueller | 2022-08-11 | delta dcant budget analysis |
| html | 5b77c4f | jens-daniel-mueller | 2022-08-10 | Build site. |
| Rmd | c25333a | jens-daniel-mueller | 2022-08-10 | bias sections and maps added |
| html | 9c3be27 | jens-daniel-mueller | 2022-08-09 | Build site. |
| Rmd | a940880 | jens-daniel-mueller | 2022-08-09 | improve delta dcant bias assesment |
| html | a691b29 | jens-daniel-mueller | 2022-08-09 | Build site. |
| Rmd | d136a86 | jens-daniel-mueller | 2022-08-09 | include delta dcant bias assesment |
| html | 910f96e | jens-daniel-mueller | 2022-08-08 | Build site. |
| Rmd | e064958 | jens-daniel-mueller | 2022-08-08 | include bias assesment |
| html | e99640e | jens-daniel-mueller | 2022-07-29 | Build site. |
| html | f68fcfa | jens-daniel-mueller | 2022-07-26 | Build site. |
| Rmd | abec0de | jens-daniel-mueller | 2022-07-26 | changed color scale back |
| html | f2615fb | jens-daniel-mueller | 2022-07-26 | Build site. |
| Rmd | 8da318e | jens-daniel-mueller | 2022-07-26 | changed color scale |
| html | 99a82db | jens-daniel-mueller | 2022-07-25 | Build site. |
| Rmd | 1d6985d | jens-daniel-mueller | 2022-07-25 | stat analysis of layer budgets and CIs |
| html | 4af29f9 | jens-daniel-mueller | 2022-07-24 | Build site. |
| Rmd | b2c4ff6 | jens-daniel-mueller | 2022-07-24 | revised GCB plot |
| html | e2adac6 | jens-daniel-mueller | 2022-07-22 | Build site. |
| Rmd | a9c8af4 | jens-daniel-mueller | 2022-07-22 | revised section plots and tables |
| html | 9bbc6a4 | jens-daniel-mueller | 2022-07-20 | Build site. |
| Rmd | f937de2 | jens-daniel-mueller | 2022-07-20 | revised plots |
| html | 0c6db30 | jens-daniel-mueller | 2022-07-20 | Build site. |
| Rmd | a42e52d | jens-daniel-mueller | 2022-07-20 | revised plots |
| html | b18b250 | jens-daniel-mueller | 2022-07-20 | Build site. |
| Rmd | 36691bf | jens-daniel-mueller | 2022-07-20 | revised plots |
| html | a80b59b | jens-daniel-mueller | 2022-07-20 | Build site. |
| Rmd | f9c0545 | jens-daniel-mueller | 2022-07-20 | revised budget stats |
| html | fea41c1 | jens-daniel-mueller | 2022-07-20 | Build site. |
| Rmd | b27e42f | jens-daniel-mueller | 2022-07-20 | rerun with corrected Canyon-B talk gap-filling in standard case |
| html | 9ce772d | jens-daniel-mueller | 2022-07-19 | Build site. |
| Rmd | aaf37cf | jens-daniel-mueller | 2022-07-19 | coverage maps with gap filling |
| html | d803308 | jens-daniel-mueller | 2022-07-19 | Build site. |
| Rmd | 933285c | jens-daniel-mueller | 2022-07-19 | revised plots |
| html | b1f7ab3 | jens-daniel-mueller | 2022-07-18 | Build site. |
| Rmd | ab5220b | jens-daniel-mueller | 2022-07-18 | revised budget over atm pCO2 plot |
| html | d2ae54c | jens-daniel-mueller | 2022-07-18 | Build site. |
| Rmd | 85f482c | jens-daniel-mueller | 2022-07-18 | include scaled Sabine data for budgets |
| html | 2695085 | jens-daniel-mueller | 2022-07-17 | Build site. |
| Rmd | 8624c93 | jens-daniel-mueller | 2022-07-17 | use global output from MLR basins |
| html | 535196a | jens-daniel-mueller | 2022-07-17 | Build site. |
| html | d20faeb | jens-daniel-mueller | 2022-07-17 | Build site. |
| Rmd | b6ef86b | jens-daniel-mueller | 2022-07-17 | revised budget plots |
| html | 0160c40 | jens-daniel-mueller | 2022-07-16 | Build site. |
| Rmd | d2b1090 | jens-daniel-mueller | 2022-07-16 | cleaned code |
| html | efa414b | jens-daniel-mueller | 2022-07-16 | Build site. |
| Rmd | e84b169 | jens-daniel-mueller | 2022-07-16 | added bias global analysis |
| html | 7267b08 | jens-daniel-mueller | 2022-07-16 | Build site. |
| Rmd | b91f619 | jens-daniel-mueller | 2022-07-16 | analysed dcant budget stats |
| html | 08c00b4 | jens-daniel-mueller | 2022-07-16 | Build site. |
| html | 692c937 | jens-daniel-mueller | 2022-07-16 | Build site. |
| html | afb27ad | jens-daniel-mueller | 2022-07-15 | Build site. |
| Rmd | 53e63d5 | jens-daniel-mueller | 2022-07-15 | plot no surface data equi |
| html | b492b46 | jens-daniel-mueller | 2022-07-15 | Build site. |
| Rmd | 31f29fe | jens-daniel-mueller | 2022-07-15 | plot decadal sink trends as boxplots |
| html | bd24a0f | jens-daniel-mueller | 2022-07-15 | Build site. |
| Rmd | efbb1dc | jens-daniel-mueller | 2022-07-15 | include no surface equi cases |
| html | 022fd60 | jens-daniel-mueller | 2022-07-14 | Build site. |
| Rmd | 5a9e419 | jens-daniel-mueller | 2022-07-14 | implemented beta budget analysis |
| Rmd | d2092c1 | jens-daniel-mueller | 2022-07-14 | implemented beta budget analysis |
| html | f1d7f80 | jens-daniel-mueller | 2022-07-13 | Build site. |
| Rmd | 6811ae4 | jens-daniel-mueller | 2022-07-13 | refined profil plots |
| html | ea46812 | jens-daniel-mueller | 2022-07-13 | Build site. |
| Rmd | defdcfe | jens-daniel-mueller | 2022-07-13 | additional analyis |
| html | 17cd1d1 | jens-daniel-mueller | 2022-07-13 | Build site. |
| Rmd | 1bf1708 | jens-daniel-mueller | 2022-07-13 | rerun reoccupation |
| html | 26e9496 | jens-daniel-mueller | 2022-07-12 | Build site. |
| Rmd | 5d121f0 | jens-daniel-mueller | 2022-07-12 | applied dcant scaling and improved ensemble member analysis |
| html | 8fb595c | jens-daniel-mueller | 2022-07-12 | Build site. |
| Rmd | e2d97ef | jens-daniel-mueller | 2022-07-12 | excluded no adjustment from ensemble |
| html | 003b161 | jens-daniel-mueller | 2022-07-12 | Build site. |
| Rmd | 54a0d14 | jens-daniel-mueller | 2022-07-12 | added cruise based adjustment |
| html | b44c72a | jens-daniel-mueller | 2022-07-03 | Build site. |
| html | 37f56b3 | jens-daniel-mueller | 2022-07-01 | Build site. |
| Rmd | 8c4a9f8 | jens-daniel-mueller | 2022-07-01 | added basin separation analysis |
| html | 232909e | jens-daniel-mueller | 2022-07-01 | Build site. |
| Rmd | 7f85db3 | jens-daniel-mueller | 2022-07-01 | added basin separation analysis |
| html | df21d31 | jens-daniel-mueller | 2022-07-01 | Build site. |
| Rmd | 2bbfba0 | jens-daniel-mueller | 2022-07-01 | rebuild |
| html | 6be73e0 | jens-daniel-mueller | 2022-06-30 | Build site. |
| Rmd | 6e173bf | jens-daniel-mueller | 2022-06-30 | updated regional budget plots |
| html | 6e173bf | jens-daniel-mueller | 2022-06-30 | updated regional budget plots |
| html | 8ab4a87 | jens-daniel-mueller | 2022-06-29 | Build site. |
| Rmd | d8c7cb9 | jens-daniel-mueller | 2022-06-29 | ensemble with unadjusted data |
| html | 7629c78 | jens-daniel-mueller | 2022-06-29 | Build site. |
| Rmd | 4758911 | jens-daniel-mueller | 2022-06-29 | ensemble without unadjusted data |
| html | f6786c8 | jens-daniel-mueller | 2022-06-29 | Build site. |
| Rmd | 6f694a1 | jens-daniel-mueller | 2022-06-29 | included Cstar N in ensemble |
| html | f09080e | jens-daniel-mueller | 2022-06-28 | Build site. |
| Rmd | d457610 | jens-daniel-mueller | 2022-06-28 | save figures for publication |
| html | ee30748 | jens-daniel-mueller | 2022-06-28 | Build site. |
| Rmd | fe42644 | jens-daniel-mueller | 2022-06-28 | GCB emissions ratio included |
| html | 9393c07 | jens-daniel-mueller | 2022-06-28 | Build site. |
| Rmd | 2a3cf97 | jens-daniel-mueller | 2022-06-28 | included basin-hemisphere bias, and bias contributions |
| html | 0825298 | jens-daniel-mueller | 2022-06-28 | Build site. |
| Rmd | d35ddb1 | jens-daniel-mueller | 2022-06-28 | included GCB ocean sink data as boxplot |
| html | a13a7cf | jens-daniel-mueller | 2022-06-28 | Build site. |
| html | fb59a6f | jens-daniel-mueller | 2022-06-27 | Build site. |
| Rmd | 7ff568c | jens-daniel-mueller | 2022-06-27 | included GCB ocean sink data |
| html | a26a21d | jens-daniel-mueller | 2022-06-27 | Build site. |
| Rmd | 9425709 | jens-daniel-mueller | 2022-06-27 | scaled sabine 2004 to full area |
| html | 748aa43 | jens-daniel-mueller | 2022-06-27 | Build site. |
| Rmd | 82d5793 | jens-daniel-mueller | 2022-06-27 | ensemble scatter plot |
| html | 457e640 | jens-daniel-mueller | 2022-06-27 | Build site. |
| Rmd | 426c5bf | jens-daniel-mueller | 2022-06-27 | cleaned read-in section |
| html | 16dc3af | jens-daniel-mueller | 2022-06-27 | Build site. |
| Rmd | dd2063a | jens-daniel-mueller | 2022-06-27 | ensemble member analysis added |
| html | 87e9eb8 | jens-daniel-mueller | 2022-06-27 | Build site. |
| Rmd | 09a3348 | jens-daniel-mueller | 2022-06-27 | 1 as standard case and new ensemble members |
| html | b52b159 | jens-daniel-mueller | 2022-06-27 | Build site. |
| html | 09b0780 | jens-daniel-mueller | 2022-05-24 | Build site. |
| html | 25da2fb | jens-daniel-mueller | 2022-05-24 | Build site. |
| html | 1d73ec9 | jens-daniel-mueller | 2022-05-16 | Build site. |
| Rmd | e117b7b | jens-daniel-mueller | 2022-05-16 | rerun w/o data adjustments |
| html | 2ffbdda | jens-daniel-mueller | 2022-05-16 | Build site. |
| Rmd | 6fc8438 | jens-daniel-mueller | 2022-05-16 | plot individual zonal sections |
| html | c71227f | jens-daniel-mueller | 2022-05-16 | Build site. |
| Rmd | 55e9ac6 | jens-daniel-mueller | 2022-05-16 | plot individual zonal sections |
| html | 3c1100c | jens-daniel-mueller | 2022-05-16 | Build site. |
| Rmd | fdb111d | jens-daniel-mueller | 2022-05-16 | plot individual zonal sections |
| html | 2ca0109 | jens-daniel-mueller | 2022-05-02 | Build site. |
| Rmd | 63d51bd | jens-daniel-mueller | 2022-05-02 | rerun with adjusted data |
| html | dcf2eaf | jens-daniel-mueller | 2022-05-02 | Build site. |
| Rmd | a3a2cf9 | jens-daniel-mueller | 2022-05-02 | IO sections seperate |
| html | eff4fd7 | jens-daniel-mueller | 2022-05-02 | Build site. |
| Rmd | 39e920a | jens-daniel-mueller | 2022-05-02 | IO sections seperate |
| html | 08607eb | jens-daniel-mueller | 2022-05-02 | Build site. |
| Rmd | 0791c1b | jens-daniel-mueller | 2022-05-02 | modified plots |
| html | b018a9a | jens-daniel-mueller | 2022-04-29 | Build site. |
| Rmd | 02ede93 | jens-daniel-mueller | 2022-04-29 | standard case uncorrected data |
| html | e09320d | jens-daniel-mueller | 2022-04-12 | Build site. |
| Rmd | 0dec180 | jens-daniel-mueller | 2022-04-12 | 3 data adjustment procedures implemented |
| html | 8dca96a | jens-daniel-mueller | 2022-04-12 | Build site. |
| Rmd | e5e9288 | jens-daniel-mueller | 2022-04-12 | 3 data adjustment procedures implemented |
| html | 2f20ea6 | jens-daniel-mueller | 2022-04-11 | Build site. |
| html | 209c9b6 | jens-daniel-mueller | 2022-04-10 | Build site. |
| Rmd | 537aff7 | jens-daniel-mueller | 2022-04-10 | no data adjustment implemented |
| html | acad2e2 | jens-daniel-mueller | 2022-04-09 | Build site. |
| html | 3d81135 | jens-daniel-mueller | 2022-04-07 | Build site. |
| html | 0f5d372 | jens-daniel-mueller | 2022-04-04 | Build site. |
| Rmd | ac5121f | jens-daniel-mueller | 2022-04-04 | added zonal mean beta distribution new figure |
| html | 1b5a309 | jens-daniel-mueller | 2022-04-04 | Build site. |
| Rmd | 8b96a9d | jens-daniel-mueller | 2022-04-04 | added zonal mean beta distribution new figure |
| html | a74e341 | jens-daniel-mueller | 2022-04-04 | Build site. |
| Rmd | c0432be | jens-daniel-mueller | 2022-04-04 | added zonal mean beta distribution ensemble sd |
| html | b599680 | jens-daniel-mueller | 2022-04-04 | Build site. |
| Rmd | e406c39 | jens-daniel-mueller | 2022-04-04 | added zonal mean beta distribution |
| html | ca7e590 | jens-daniel-mueller | 2022-03-22 | Build site. |
| Rmd | 8cb4b78 | jens-daniel-mueller | 2022-03-22 | use 1800 as tref for sabine estimates |
| html | 5a6be34 | jens-daniel-mueller | 2022-03-22 | Build site. |
| Rmd | cee203c | jens-daniel-mueller | 2022-03-22 | rerun with NP 2021 talk correction |
| html | bd9e11d | jens-daniel-mueller | 2022-03-22 | Build site. |
| html | 2501978 | jens-daniel-mueller | 2022-03-21 | Build site. |
| Rmd | 9e12898 | jens-daniel-mueller | 2022-03-21 | use 1800 as tref for sabine estimates |
| html | c3a6238 | jens-daniel-mueller | 2022-03-08 | Build site. |
| Rmd | 775eb4f | jens-daniel-mueller | 2022-03-08 | moving eras analysis implemented |
| html | 094bfa0 | jens-daniel-mueller | 2022-02-18 | Build site. |
| Rmd | fa258cc | jens-daniel-mueller | 2022-02-18 | updated plots |
| html | ba2d62e | jens-daniel-mueller | 2022-02-17 | Build site. |
| Rmd | 5420131 | jens-daniel-mueller | 2022-02-17 | added Seaflux data |
| html | 192504c | jens-daniel-mueller | 2022-02-17 | Build site. |
| Rmd | 2394302 | jens-daniel-mueller | 2022-02-17 | added Seaflux data |
| html | 251c7cf | jens-daniel-mueller | 2022-02-17 | Build site. |
| Rmd | 9ea0d8c | jens-daniel-mueller | 2022-02-17 | adapted beta factor |
| html | 565224d | jens-daniel-mueller | 2022-02-17 | Build site. |
| Rmd | 33422e3 | jens-daniel-mueller | 2022-02-17 | scaled budgets to global coverage |
| html | 2116dd3 | jens-daniel-mueller | 2022-02-09 | Build site. |
| Rmd | e281bf3 | jens-daniel-mueller | 2022-02-09 | updated plots |
| html | 6fe70a1 | jens-daniel-mueller | 2022-02-05 | Build site. |
| Rmd | 8955c85 | jens-daniel-mueller | 2022-02-05 | cleaned plots |
| html | a6b33aa | jens-daniel-mueller | 2022-02-04 | Build site. |
| Rmd | 73efef8 | jens-daniel-mueller | 2022-02-04 | atm co2 time series plotted, uncertainties revised |
| html | 4b48475 | jens-daniel-mueller | 2022-02-04 | Build site. |
| Rmd | 6afd7b1 | jens-daniel-mueller | 2022-02-04 | calculated uncertainty of basin budget changes |
| html | fec5a1e | jens-daniel-mueller | 2022-02-04 | Build site. |
| Rmd | 325da3a | jens-daniel-mueller | 2022-02-04 | calculated uncertainty of basin budget changes |
| html | d2191ad | jens-daniel-mueller | 2022-02-04 | Build site. |
| Rmd | 79a54fe | jens-daniel-mueller | 2022-02-04 | new coaverage map |
| html | 4c5b079 | jens-daniel-mueller | 2022-02-03 | Build site. |
| Rmd | 66d89a9 | jens-daniel-mueller | 2022-02-03 | added surface flux model products |
| html | 4077397 | jens-daniel-mueller | 2022-02-03 | Build site. |
| Rmd | c0c3be1 | jens-daniel-mueller | 2022-02-03 | added surface flux products |
| html | 0d0f790 | jens-daniel-mueller | 2022-02-02 | Build site. |
| Rmd | 049346f | jens-daniel-mueller | 2022-02-02 | shifted year labels |
| html | 4673df5 | jens-daniel-mueller | 2022-02-02 | Build site. |
| Rmd | 1185397 | jens-daniel-mueller | 2022-02-02 | rearranged plots |
| html | 60727e6 | jens-daniel-mueller | 2022-02-02 | Build site. |
| Rmd | db5308b | jens-daniel-mueller | 2022-02-02 | rearranged plots |
| html | c7b4984 | jens-daniel-mueller | 2022-02-02 | Build site. |
| Rmd | a3d8469 | jens-daniel-mueller | 2022-02-02 | ensemble uncertainties in global buget |
| html | 7fb28a2 | jens-daniel-mueller | 2022-02-02 | Build site. |
| Rmd | a332fe6 | jens-daniel-mueller | 2022-02-02 | ensemble uncertainties in time series |
| html | 49097e8 | jens-daniel-mueller | 2022-02-02 | Build site. |
| Rmd | f98c33b | jens-daniel-mueller | 2022-02-02 | incl ensemble uncertainties in plot |
| html | fe11bfd | jens-daniel-mueller | 2022-02-02 | Build site. |
| Rmd | d3f7f05 | jens-daniel-mueller | 2022-02-02 | incl ensemble uncertainties |
| html | fa46251 | jens-daniel-mueller | 2022-02-02 | Build site. |
| Rmd | 33feacf | jens-daniel-mueller | 2022-02-02 | incl sabine budgets |
| html | 7655085 | jens-daniel-mueller | 2022-02-02 | Build site. |
| Rmd | 09dd555 | jens-daniel-mueller | 2022-02-02 | incl sabine budgets |
| html | 226d67d | jens-daniel-mueller | 2022-02-02 | Build site. |
| Rmd | ed056e2 | jens-daniel-mueller | 2022-02-02 | incl sabine budgets |
| html | ed903f7 | jens-daniel-mueller | 2022-02-02 | Build site. |
| Rmd | 9d11695 | jens-daniel-mueller | 2022-02-02 | scaled budget to atm pco2 increase |
| html | 32e9682 | jens-daniel-mueller | 2022-02-02 | Build site. |
| Rmd | 5cc5572 | jens-daniel-mueller | 2022-02-02 | included Sabine column inventory as reference |
| html | 913e42f | jens-daniel-mueller | 2022-02-01 | Build site. |
| Rmd | c4b2de9 | jens-daniel-mueller | 2022-02-01 | updated profile plots |
| html | 189de95 | jens-daniel-mueller | 2022-02-01 | Build site. |
| Rmd | b0c17bc | jens-daniel-mueller | 2022-02-01 | updated profile plots |
| html | ab001eb | jens-daniel-mueller | 2022-01-31 | Build site. |
| Rmd | ccf6723 | jens-daniel-mueller | 2022-01-31 | filled step plot for layer budgets |
| html | d2ae5fe | jens-daniel-mueller | 2022-01-31 | Build site. |
| Rmd | 278523c | jens-daniel-mueller | 2022-01-31 | step plot for layer budgets |
| html | b62308d | jens-daniel-mueller | 2022-01-31 | Build site. |
| Rmd | 714c5cc | jens-daniel-mueller | 2022-01-31 | step plot for layer budgets |
| html | ec7fe7e | jens-daniel-mueller | 2022-01-31 | Build site. |
| Rmd | 5c948ae | jens-daniel-mueller | 2022-01-31 | added time series vs atm pco2 |
| html | de557de | jens-daniel-mueller | 2022-01-28 | Build site. |
| html | 5f2aed0 | jens-daniel-mueller | 2022-01-27 | Build site. |
| Rmd | 54c9e26 | jens-daniel-mueller | 2022-01-27 | added layer budget profiles |
| html | eccd82b | jens-daniel-mueller | 2022-01-26 | Build site. |
| Rmd | c5577d3 | jens-daniel-mueller | 2022-01-26 | added meand sd to offset mean concentrations profiles |
| html | c6fe495 | jens-daniel-mueller | 2022-01-26 | Build site. |
| Rmd | e0e7974 | jens-daniel-mueller | 2022-01-26 | added offset mean concentrations profiles |
| html | 9753eb8 | jens-daniel-mueller | 2022-01-26 | Build site. |
| html | b1d7720 | jens-daniel-mueller | 2022-01-21 | Build site. |
| Rmd | 0210ed5 | jens-daniel-mueller | 2022-01-21 | added mean concentrations profiles per 5 basins |
| html | d6b399a | jens-daniel-mueller | 2022-01-21 | Build site. |
| Rmd | da17a07 | jens-daniel-mueller | 2022-01-21 | added mean concentrations profiles |
| html | c499be8 | jens-daniel-mueller | 2022-01-21 | Build site. |
| Rmd | d941871 | jens-daniel-mueller | 2022-01-21 | run color map test |
| html | e572075 | jens-daniel-mueller | 2022-01-21 | Build site. |
| Rmd | 99b6c92 | jens-daniel-mueller | 2022-01-21 | run color map test |
| html | 4fe7150 | jens-daniel-mueller | 2022-01-21 | Build site. |
| Rmd | 0379e99 | jens-daniel-mueller | 2022-01-21 | script cleaning |
| html | 49b41cf | jens-daniel-mueller | 2022-01-21 | Build site. |
| Rmd | 2c82651 | jens-daniel-mueller | 2022-01-21 | added map of scaled absolute change |
| html | c0807e8 | jens-daniel-mueller | 2022-01-21 | Build site. |
| Rmd | 5dd3d7a | jens-daniel-mueller | 2022-01-21 | added map of scaled relative change |
| html | 22b421f | jens-daniel-mueller | 2022-01-21 | Build site. |
| Rmd | 2c3fa75 | jens-daniel-mueller | 2022-01-21 | cleaned alluvial plots |
| html | 1a35f1f | jens-daniel-mueller | 2022-01-20 | Build site. |
| Rmd | e58f510 | jens-daniel-mueller | 2022-01-20 | added relative changes to alluvial plots |
| html | b503ae1 | jens-daniel-mueller | 2022-01-20 | Build site. |
| Rmd | 2eb2567 | jens-daniel-mueller | 2022-01-20 | added relative changes to alluvial plots |
| html | cc31f4b | jens-daniel-mueller | 2022-01-20 | Build site. |
| Rmd | 416e107 | jens-daniel-mueller | 2022-01-20 | added delta dcant map |
| html | 11a800b | jens-daniel-mueller | 2022-01-20 | Build site. |
| Rmd | 81a40d5 | jens-daniel-mueller | 2022-01-20 | updated alluvial plots |
| html | 3087804 | jens-daniel-mueller | 2022-01-20 | Build site. |
| Rmd | 2ae5966 | jens-daniel-mueller | 2022-01-20 | updated alluvial plots |
| html | 6d566d5 | jens-daniel-mueller | 2022-01-20 | Build site. |
| Rmd | 4901b0f | jens-daniel-mueller | 2022-01-20 | updated alluvial plots |
| html | 44796b1 | jens-daniel-mueller | 2022-01-20 | Build site. |
| Rmd | cdbd92c | jens-daniel-mueller | 2022-01-20 | created alluvial plots |
| html | 48ec4c6 | jens-daniel-mueller | 2022-01-19 | Build site. |
| Rmd | 0fb2ae5 | jens-daniel-mueller | 2022-01-19 | printed column inv from AIP standard runs |
| html | f347cd7 | jens-daniel-mueller | 2022-01-18 | Build site. |
| Rmd | 86b711c | jens-daniel-mueller | 2022-01-18 | plot hemisphere budgets and publication results |
1 Libraries
2 Read files
2.1 Paths and Versions
version_id_pattern <- "1"

# identify required version IDs

Version_IDs_1 <- list.files(path = "/nfs/kryo/work/jenmueller/emlr_cant/observations",
                            pattern = paste0("v_1", version_id_pattern))

Version_IDs_2 <- list.files(path = "/nfs/kryo/work/jenmueller/emlr_cant/observations",
                            pattern = paste0("v_2", version_id_pattern))

Version_IDs_3 <- list.files(path = "/nfs/kryo/work/jenmueller/emlr_cant/observations",
                            pattern = paste0("v_3", version_id_pattern))

Version_IDs_x <- c(Version_IDs_1, Version_IDs_2, Version_IDs_3)

version_id_pattern <- "o"

# identify required version IDs

Version_IDs_1 <- list.files(path = "/nfs/kryo/work/jenmueller/emlr_cant/observations",
                            pattern = paste0("v_1", version_id_pattern))

Version_IDs_2 <- list.files(path = "/nfs/kryo/work/jenmueller/emlr_cant/observations",
                            pattern = paste0("v_2", version_id_pattern))

Version_IDs_3 <- list.files(path = "/nfs/kryo/work/jenmueller/emlr_cant/observations",
                            pattern = paste0("v_3", version_id_pattern))

Version_IDs_o <- c(Version_IDs_1, Version_IDs_2, Version_IDs_3)

version_id_pattern <- "d"

# identify required version IDs

Version_IDs_1 <- list.files(path = "/nfs/kryo/work/jenmueller/emlr_cant/observations",
                            pattern = paste0("v_1", version_id_pattern))

Version_IDs_2 <- list.files(path = "/nfs/kryo/work/jenmueller/emlr_cant/observations",
                            pattern = paste0("v_2", version_id_pattern))

Version_IDs_3 <- list.files(path = "/nfs/kryo/work/jenmueller/emlr_cant/observations",
                            pattern = paste0("v_3", version_id_pattern))

Version_IDs_d <- c(Version_IDs_1, Version_IDs_2, Version_IDs_3)

version_id_pattern <- "g"

# identify required version IDs

Version_IDs_1 <- list.files(path = "/nfs/kryo/work/jenmueller/emlr_cant/observations",
                            pattern = paste0("v_1", version_id_pattern))

Version_IDs_2 <- list.files(path = "/nfs/kryo/work/jenmueller/emlr_cant/observations",
                            pattern = paste0("v_2", version_id_pattern))

Version_IDs_3 <- list.files(path = "/nfs/kryo/work/jenmueller/emlr_cant/observations",
                            pattern = paste0("v_3", version_id_pattern))

Version_IDs_g <- c(Version_IDs_1, Version_IDs_2, Version_IDs_3)

version_id_pattern <- "n"

# identify required version IDs

Version_IDs_1 <- list.files(path = "/nfs/kryo/work/jenmueller/emlr_cant/observations",
                            pattern = paste0("v_1", version_id_pattern))

Version_IDs_2 <- list.files(path = "/nfs/kryo/work/jenmueller/emlr_cant/observations",
                            pattern = paste0("v_2", version_id_pattern))

Version_IDs_3 <- list.files(path = "/nfs/kryo/work/jenmueller/emlr_cant/observations",
                            pattern = paste0("v_3", version_id_pattern))

Version_IDs_n <- c(Version_IDs_1, Version_IDs_2, Version_IDs_3)
rm(Version_IDs_1, Version_IDs_2, Version_IDs_3)

version_id_pattern <- "c"

# identify required version IDs

Version_IDs_1 <- list.files(path = "/nfs/kryo/work/jenmueller/emlr_cant/observations",
                            pattern = paste0("v_1", version_id_pattern))

Version_IDs_2 <- list.files(path = "/nfs/kryo/work/jenmueller/emlr_cant/observations",
                            pattern = paste0("v_2", version_id_pattern))

Version_IDs_3 <- list.files(path = "/nfs/kryo/work/jenmueller/emlr_cant/observations",
                            pattern = paste0("v_3", version_id_pattern))

Version_IDs_c <- c(Version_IDs_1, Version_IDs_2, Version_IDs_3)
rm(Version_IDs_1, Version_IDs_2, Version_IDs_3)

version_id_pattern <- "e"

# identify required version IDs

Version_IDs_1 <- list.files(path = "/nfs/kryo/work/jenmueller/emlr_cant/observations",
                            pattern = paste0("v_1", version_id_pattern))

Version_IDs_2 <- list.files(path = "/nfs/kryo/work/jenmueller/emlr_cant/observations",
                            pattern = paste0("v_2", version_id_pattern))

Version_IDs_3 <- list.files(path = "/nfs/kryo/work/jenmueller/emlr_cant/observations",
                            pattern = paste0("v_3", version_id_pattern))

Version_IDs_e <- c(Version_IDs_1, Version_IDs_2, Version_IDs_3)
rm(Version_IDs_1, Version_IDs_2, Version_IDs_3)

Version_IDs_ensemble <- c(Version_IDs_x, Version_IDs_o, Version_IDs_d, Version_IDs_g, Version_IDs_n, Version_IDs_c, Version_IDs_e)

rm(Version_IDs_x, Version_IDs_o, Version_IDs_g, Version_IDs_n, Version_IDs_c, Version_IDs_e)
# subset Standard case
Version_IDs <- Version_IDs_ensemble[str_detect(Version_IDs_ensemble, "104")]2.2 Parameters
for (i_Version_IDs in Version_IDs_ensemble) {

  path_version_data     <-
    paste(path_observations,
          i_Version_IDs,
          "/data/",
          sep = "")

  params_local <-
    read_rds(paste(path_version_data,
                   "params_local.rds",
                   sep = ""))

  params_local <- bind_cols(
    Version_ID = i_Version_IDs,
    tref1 = params_local$tref1,
    tref2 = params_local$tref2,
    MLR_basins = params_local$MLR_basins
  )

  tref <- read_csv(paste(path_version_data,
                         "tref.csv",
                         sep = ""))

  params_local <- params_local %>%
    mutate(
      median_year_1 = sort(tref$median_year)[1],
      median_year_2 = sort(tref$median_year)[2],
      duration = median_year_2 - median_year_1,
      period = paste(median_year_1, "-", median_year_2)
    )

  if (exists("params_local_all_ensemble")) {
    params_local_all_ensemble <- bind_rows(params_local_all_ensemble, params_local)
  }

  if (!exists("params_local_all_ensemble")) {
    params_local_all_ensemble <- params_local
  }


}

rm(params_local,
   tref)


params_local_all_ensemble <- params_local_all_ensemble %>%
  select(Version_ID, period, MLR_basins, tref1, tref2)

params_local_all_ensemble <-
  params_local_all_ensemble %>%
  mutate(
    Version_ID_group = str_sub(Version_ID, 4, 4),
    Version_ID_group = case_when(
      Version_ID_group == "1" ~ "Bulk adjustment",
      Version_ID_group == "c" ~ "Cruise adjustment",
      Version_ID_group == "d" ~ "No adjustment",
      Version_ID_group == "g" ~ "No gap filling",
      Version_ID_group == "o" ~ "Reoccupation filter",
      Version_ID_group == "e" ~ "Surface eMLR(C*)",
      Version_ID_group == "n" ~ "C*(N)",
      TRUE ~ Version_ID_group
    )
  )

params_local_all_ensemble <-
  params_local_all_ensemble %>%
  mutate(
    MLR_basins = case_when(
      MLR_basins == "AIP" ~ "3",
      MLR_basins == "SO_AIP" ~ "3+SO",
      MLR_basins == "SO_5" ~ "5+SO",
      TRUE ~ MLR_basins
    )
  )
params_local_all <- params_local_all_ensemble %>%
filter(Version_ID %in% Version_IDs)path_version_data <-
paste(path_observations,
Version_IDs[1],
"/data/",
sep = "")
params_local <-
read_rds(paste(path_version_data,
"params_local.rds",
sep = ""))2.3 Budgets
for (i_Version_IDs in Version_IDs_ensemble) {
  # i_Version_IDs <- Version_IDs[1]

  path_version_data     <-
    paste(path_observations,
          i_Version_IDs,
          "/data/",
          sep = "")

  # load and join data files

  dcant_budget_global <-
    read_csv(paste(path_version_data,
                   "dcant_budget_global.csv",
                   sep = ""))

  dcant_budget_global_mod_truth <-
    read_csv(paste(
      path_version_data,
      "dcant_budget_global_mod_truth.csv",
      sep = ""
    ))

  dcant_budget_global <- bind_rows(dcant_budget_global,
                                   dcant_budget_global_mod_truth)

  dcant_budget_global <- dcant_budget_global %>%
    mutate(Version_ID = i_Version_IDs)

  if (exists("dcant_budget_global_all")) {
    dcant_budget_global_all <-
      bind_rows(dcant_budget_global_all, dcant_budget_global)
  }

  if (!exists("dcant_budget_global_all")) {
    dcant_budget_global_all <- dcant_budget_global
  }

}

rm(dcant_budget_global,
   dcant_budget_global_mod_truth)
for (i_Version_IDs in Version_IDs_ensemble) {
# i_Version_IDs <- Version_IDs[1]
# print(i_Version_IDs)
path_version_data <-
paste(path_observations,
i_Version_IDs,
"/data/",
sep = "")
# load and join data files
dcant_budget_basin_MLR <-
read_csv(paste(path_version_data,
"dcant_budget_basin_MLR.csv",
sep = ""))
dcant_budget_basin_MLR_mod_truth <-
read_csv(paste(
path_version_data,
"dcant_budget_basin_MLR_mod_truth.csv",
sep = ""
))
dcant_budget_basin_MLR <- bind_rows(dcant_budget_basin_MLR,
dcant_budget_basin_MLR_mod_truth)
dcant_budget_basin_MLR <- dcant_budget_basin_MLR %>%
mutate(Version_ID = i_Version_IDs)
if (exists("dcant_budget_basin_MLR_all")) {
dcant_budget_basin_MLR_all <-
bind_rows(dcant_budget_basin_MLR_all, dcant_budget_basin_MLR)
}
if (!exists("dcant_budget_basin_MLR_all")) {
dcant_budget_basin_MLR_all <- dcant_budget_basin_MLR
}
dcant_budget_basin_MLR_bias_decomposition <-
read_csv(
paste(
path_version_data,
"dcant_budget_basin_MLR_bias_decomposition.csv",
sep = ""
)
)
dcant_budget_basin_MLR_bias_decomposition <-
dcant_budget_basin_MLR_bias_decomposition %>%
mutate(Version_ID = i_Version_IDs)
if (exists("dcant_budget_basin_MLR_bias_all_decomposition")) {
dcant_budget_basin_MLR_bias_all_decomposition <-
bind_rows(
dcant_budget_basin_MLR_bias_all_decomposition,
dcant_budget_basin_MLR_bias_decomposition
)
}
if (!exists("dcant_budget_basin_MLR_bias_all_decomposition")) {
dcant_budget_basin_MLR_bias_all_decomposition <-
dcant_budget_basin_MLR_bias_decomposition
}
}
rm(
dcant_budget_basin_MLR,
dcant_budget_basin_MLR_mod_truth,
dcant_budget_basin_MLR_bias_decomposition
)dcant_budget_global_all <- dcant_budget_global_all %>%
filter(estimate == "dcant",
method == "total") %>%
select(-c(estimate, method)) %>%
rename(dcant = value)
dcant_budget_global_all <- dcant_budget_global_all %>%
filter(inv_depth == params_global$inventory_depth_standard)dcant_budget_basin_MLR_all <- dcant_budget_basin_MLR_all %>%
filter(estimate == "dcant",
method == "total") %>%
select(-c(estimate, method)) %>%
rename(dcant = value)
dcant_budget_basin_MLR_all_1000 <- dcant_budget_basin_MLR_all %>%
filter(inv_depth == 1000)
dcant_budget_basin_MLR_all <- dcant_budget_basin_MLR_all %>%
filter(inv_depth == params_global$inventory_depth_standard)
dcant_budget_basin_MLR_bias_all_decomposition <-
dcant_budget_basin_MLR_bias_all_decomposition %>%
filter(inv_depth == params_global$inventory_depth_standard)2.4 Column inventories
for (i_Version_IDs in Version_IDs_ensemble) {
  # i_Version_IDs <- Version_IDs[1]

  path_version_data     <-
    paste(path_observations,
          i_Version_IDs,
          "/data/",
          sep = "")

  # load and join data files

  dcant_inv <-
    read_csv(paste(path_version_data,
                   "dcant_inv.csv",
                   sep = ""))

  dcant_inv_mod_truth <-
    read_csv(paste(path_version_data,
                   "dcant_inv_mod_truth.csv",
                   sep = "")) %>%
    filter(method == "total") %>%
    select(-method)

  dcant_inv_bias <-
    read_csv(paste(path_version_data,
                   "dcant_inv_bias.csv",
                   sep = "")) %>%
    mutate(Version_ID = i_Version_IDs)

  dcant_inv <- bind_rows(dcant_inv,
                         dcant_inv_mod_truth) %>%
    mutate(Version_ID = i_Version_IDs)

  dcant_budget_lat_grid <-
    read_csv(paste(path_version_data,
                   "dcant_budget_lat_grid.csv",
                   sep = "")) %>%
    mutate(Version_ID = i_Version_IDs)

  dcant_budget_lon_grid <-
    read_csv(paste(path_version_data,
                   "dcant_budget_lon_grid.csv",
                   sep = "")) %>%
    mutate(Version_ID = i_Version_IDs)
  if (exists("dcant_inv_all")) {
    dcant_inv_all <- bind_rows(dcant_inv_all, dcant_inv)
  }

  if (!exists("dcant_inv_all")) {
    dcant_inv_all <- dcant_inv
  }

  if (exists("dcant_inv_bias_all")) {
    dcant_inv_bias_all <- bind_rows(dcant_inv_bias_all, dcant_inv_bias)
  }

  if (!exists("dcant_inv_bias_all")) {
    dcant_inv_bias_all <- dcant_inv_bias
  }

  if (exists("dcant_budget_lat_grid_all")) {
    dcant_budget_lat_grid_all <- bind_rows(dcant_budget_lat_grid_all, dcant_budget_lat_grid)
  }

  if (!exists("dcant_budget_lat_grid_all")) {
    dcant_budget_lat_grid_all <- dcant_budget_lat_grid
  }

  if (exists("dcant_budget_lon_grid_all")) {
    dcant_budget_lon_grid_all <- bind_rows(dcant_budget_lon_grid_all, dcant_budget_lon_grid)
  }

  if (!exists("dcant_budget_lon_grid_all")) {
    dcant_budget_lon_grid_all <- dcant_budget_lon_grid
  }
}

rm(dcant_inv,
   dcant_inv_bias,
   dcant_inv_mod_truth,
   dcant_budget_lat_grid,
   dcant_budget_lon_grid)
dcant_inv_all <- dcant_inv_all %>%
filter(inv_depth == params_global$inventory_depth_standard)
dcant_budget_lat_grid_all <- dcant_budget_lat_grid_all %>%
filter(inv_depth == params_global$inventory_depth_standard)
dcant_budget_lon_grid_all <- dcant_budget_lon_grid_all %>%
filter(inv_depth == params_global$inventory_depth_standard)dcant_budget_lat_grid_all <- dcant_budget_lat_grid_all %>%
pivot_wider(names_from = estimate,
values_from = value) %>%
filter(period != "1994 - 2014",
method == "total")
dcant_budget_lon_grid_all <- dcant_budget_lon_grid_all %>%
pivot_wider(names_from = estimate,
values_from = value) %>%
filter(period != "1994 - 2014",
method == "total")dcant_inv_all %>%
filter(Version_ID == "v_1103",
data_source == "obs") %>%
select(lon, lat, dcant) %>%
write_csv(here::here("output/dcant_column_inventor_example.csv"))2.5 Sections / profiles
for (i_Version_IDs in Version_IDs_ensemble) {

  path_version_data     <-
  paste(path_observations,
        i_Version_IDs,
        "/data/",
        sep = "")

  # load and join data files

  dcant_zonal <-
    read_csv(paste(path_version_data,
                   "dcant_zonal.csv",
                   sep = ""))

  dcant_zonal_mod_truth <-
    read_csv(paste(path_version_data,
                   "dcant_zonal_mod_truth.csv",
                   sep = ""))

  dcant_zonal <- bind_rows(dcant_zonal,
                           dcant_zonal_mod_truth)

  dcant_profile <-
    read_csv(paste(path_version_data,
                   "dcant_profile.csv",
                   sep = ""))

  dcant_profile_mod_truth <-
    read_csv(paste(path_version_data,
                   "dcant_profile_mod_truth.csv",
                   sep = ""))

  dcant_profile <- bind_rows(dcant_profile,
                             dcant_profile_mod_truth)


  dcant_profile_basin_MLR <-
    read_csv(paste(path_version_data,
                   "dcant_profile_basin_MLR.csv",
                   sep = ""))


  dcant_profile_basin_MLR_mod_truth <-
    read_csv(paste(
      path_version_data,
      "dcant_profile_basin_MLR_mod_truth.csv",
      sep = ""
    ))

  dcant_profile_basin_MLR <- bind_rows(dcant_profile_basin_MLR,
                                       dcant_profile_basin_MLR_mod_truth)


  dcant_budget_basin_AIP_layer <-
    read_csv(paste(path_version_data,
                   "dcant_budget_basin_AIP_layer.csv",
                   sep = ""))

  dcant_budget_basin_MLR_layer <-
    read_csv(paste(path_version_data,
                   "dcant_budget_basin_MLR_layer.csv",

                   sep = ""))

  dcant_budget_basin_MLR_layer_mod_truth <-
    read_csv(paste(
      path_version_data,
      "dcant_budget_basin_MLR_layer_mod_truth.csv",
      sep = ""
    ))

  dcant_budget_basin_MLR_layer <-
    bind_rows(dcant_budget_basin_MLR_layer,
              dcant_budget_basin_MLR_layer_mod_truth)

  dcant_zonal_bias <-
    read_csv(paste(path_version_data,
                   "dcant_zonal_bias.csv",
                   sep = ""))


  dcant_zonal <- dcant_zonal %>%
    mutate(Version_ID = i_Version_IDs)

  dcant_profile <- dcant_profile %>%
    mutate(Version_ID = i_Version_IDs)

  dcant_profile_basin_MLR <- dcant_profile_basin_MLR %>%
    mutate(Version_ID = i_Version_IDs)

  dcant_budget_basin_AIP_layer <- dcant_budget_basin_AIP_layer %>%
    mutate(Version_ID = i_Version_IDs)

  dcant_budget_basin_MLR_layer <- dcant_budget_basin_MLR_layer %>%
    mutate(Version_ID = i_Version_IDs)

  dcant_zonal_bias <- dcant_zonal_bias %>%
    mutate(Version_ID = i_Version_IDs)


  if (exists("dcant_zonal_all")) {
    dcant_zonal_all <- bind_rows(dcant_zonal_all, dcant_zonal)
  }

  if (!exists("dcant_zonal_all")) {
    dcant_zonal_all <- dcant_zonal
  }

  if (exists("dcant_profile_all")) {
    dcant_profile_all <- bind_rows(dcant_profile_all, dcant_profile)
  }

  if (!exists("dcant_profile_all")) {
    dcant_profile_all <- dcant_profile
  }

  if (exists("dcant_profile_basin_MLR_all")) {
    dcant_profile_basin_MLR_all <- bind_rows(dcant_profile_basin_MLR_all, dcant_profile_basin_MLR)
  }

  if (!exists("dcant_profile_basin_MLR_all")) {
    dcant_profile_basin_MLR_all <- dcant_profile_basin_MLR
  }

  if (exists("dcant_budget_basin_AIP_layer_all")) {
    dcant_budget_basin_AIP_layer_all <-
      bind_rows(dcant_budget_basin_AIP_layer_all,
                dcant_budget_basin_AIP_layer)
  }

  if (!exists("dcant_budget_basin_AIP_layer_all")) {
    dcant_budget_basin_AIP_layer_all <- dcant_budget_basin_AIP_layer
  }

  if (exists("dcant_budget_basin_MLR_layer_all")) {
    dcant_budget_basin_MLR_layer_all <-
      bind_rows(dcant_budget_basin_MLR_layer_all,
                dcant_budget_basin_MLR_layer)
  }

  if (!exists("dcant_budget_basin_MLR_layer_all")) {
    dcant_budget_basin_MLR_layer_all <- dcant_budget_basin_MLR_layer
  }

  if (exists("dcant_zonal_bias_all")) {
    dcant_zonal_bias_all <- bind_rows(dcant_zonal_bias_all, dcant_zonal_bias)
  }

  if (!exists("dcant_zonal_bias_all")) {
    dcant_zonal_bias_all <- dcant_zonal_bias
  }

}

rm(dcant_zonal, dcant_zonal_bias, dcant_zonal_mod_truth,
   dcant_budget_basin_AIP_layer, dcant_budget_basin_MLR_layer,
   dcant_profile, dcant_profile_basin_MLR)
2.6 Observations coverage
for (i_Version_IDs in Version_IDs) {
  path_version_data     <-
    paste(path_observations,
          i_Version_IDs,
          "/data/",
          sep = "")

  # load and join data files

  GLODAP_grid_era  <-
    read_csv(paste(
      path_version_data,
      "GLODAPv2.2020_clean_obs_grid_era.csv",
      sep = ""
    ))


  GLODAP_grid_era <- GLODAP_grid_era %>%
    mutate(Version_ID = i_Version_IDs)

  if (exists("GLODAP_grid_era_all")) {
    GLODAP_grid_era_all <-
      bind_rows(GLODAP_grid_era_all, GLODAP_grid_era)
  }

  if (!exists("GLODAP_grid_era_all")) {
    GLODAP_grid_era_all <- GLODAP_grid_era
  }


  GLODAP <- read_csv(paste(
    path_version_data,
    "GLODAPv2.2020_clean.csv",
    sep = ""
  ))

  GLODAP <- GLODAP %>%
    mutate(Version_ID = i_Version_IDs)

  if (exists("GLODAP_all")) {
    GLODAP_all <-
      bind_rows(GLODAP_all, GLODAP)
  }

  if (!exists("GLODAP_all")) {
    GLODAP_all <- GLODAP
  }

}

rm(GLODAP_grid_era, GLODAP)


GLODAP_grid_era_all <- full_join(GLODAP_grid_era_all,
                                 params_local_all)

GLODAP_all <- full_join(GLODAP_all,
                        params_local_all)


GLODAP_expocodes <-
  read_tsv(
    paste(
      "/nfs/kryo/work/updata/glodapv2_2021/",
      "EXPOCODES.txt",
      sep = ""
    ),
    col_names = c("cruise", "cruise_expocode")
  )

GLODAP_all <-
  left_join(GLODAP_all, GLODAP_expocodes)
2.7 Atm CO2
co2_atm <-
  read_csv(paste(path_preprocessing,
                 "co2_atm.csv",
                 sep = ""))

co2_atm_reccap2 <-
  read_csv(paste(path_preprocessing,
                  "co2_atm_reccap2.csv",
                  sep = ""))
2.8 Sabine total Cant
tcant_inv <-
  read_csv(paste(path_preprocessing,
                  "S04_tcant_inv.csv", sep = ""))

tcant_inv <- tcant_inv %>%
  filter(inv_depth == 3000) %>%
  rename(dcant = tcant,
         dcant_pos = tcant_pos) %>%
  mutate(tref1 = 1800,
         tref2 = 1994)
2.9 GCB carbon sink
Ocean_Sink <-
  read_csv(paste(path_preprocessing,
                  "Ocean_Sink.csv",
                  sep = ""))

Global_Carbon_Budget <-
  read_csv(paste(path_preprocessing,
                  "GCB_Global_Carbon_Budget.csv",
                  sep = ""))
2.10 Periods
two_decades <- unique(params_local_all_ensemble$period)[1:2]3 Define labels
dcant_pgc_label <- expression(Delta * C["ant"]~(PgC))
dcant_bias_pgc_label <- expression(Bias ~ Delta * C["ant"]~(PgC))
delta_dcant_bias_pgc_label <- expression(Bias ~ Delta * Delta * C["ant"]~(PgC))
dcant_pgc_scaled_label <- expression(beta~(PgC~µatm^{-1}))

dcant_umol_label <- expression(Delta * C[ant]~(mu * mol ~ kg ^ {-1}))
ddcant_umol_label <- expression(Delta * Delta * C[ant]~(mu * mol ~ kg ^ {-1}))

dcant_layer_budget_label <-
  expression(Delta ~ C[ant] ~ "budget per 500m depth layer (PgC)")

dcant_CI_label <- expression(Delta * C[ant]~(mol ~ m ^ {-2}))
beta_CI_label <- expression(beta~(mol ~ m ^ {-2} ~ µatm ^ {-1}))
4 Coverage maps
cruises_phosphate_gap_fill <-
  c("33MW19930704",
    "33RO20030604",
    "33RO20050111",
    "33RO19980123")

cruises_talk_gap_fill <-
  c("06AQ19980328")

cruises_talk_calc <-
  c("06MT19900123",
    "316N19920502",
    "316N19921006")

GLODAP_all_coverage <- GLODAP_all %>%
  distinct(lat, lon, era, cruise_expocode) %>%
  mutate(gap_filling = case_when(
    cruise_expocode %in% cruises_phosphate_gap_fill ~ "PO4 w CANYON-B",
    cruise_expocode %in% cruises_talk_gap_fill ~ "TA w CANYON-B",
    cruise_expocode %in% cruises_talk_calc ~ "TA calculated",
    cruise_expocode %in% "31DS19940126" ~ "NO3 qc flag",
    TRUE ~ "None"
  )) %>%
  distinct(lat, lon, era, gap_filling)

coverage_map <- map +
  geom_tile(data = GLODAP_all_coverage %>% filter(gap_filling == "None"),
            aes(lon, lat),
            fill = "#BBBBBB",
            col = "#BBBBBB") +
  geom_tile(data = GLODAP_all_coverage %>% filter(gap_filling != "None"),
            aes(lon, lat,
            fill = gap_filling, col = gap_filling)) +
  facet_wrap( ~ era, ncol = 2) +
  scale_color_bright(name = "Gap-filling") +
  scale_fill_bright(name = "Gap-filling") +
  theme(axis.text = element_blank(),
        axis.ticks = element_blank(),
        legend.position = c(0.7,0.3))

coverage_map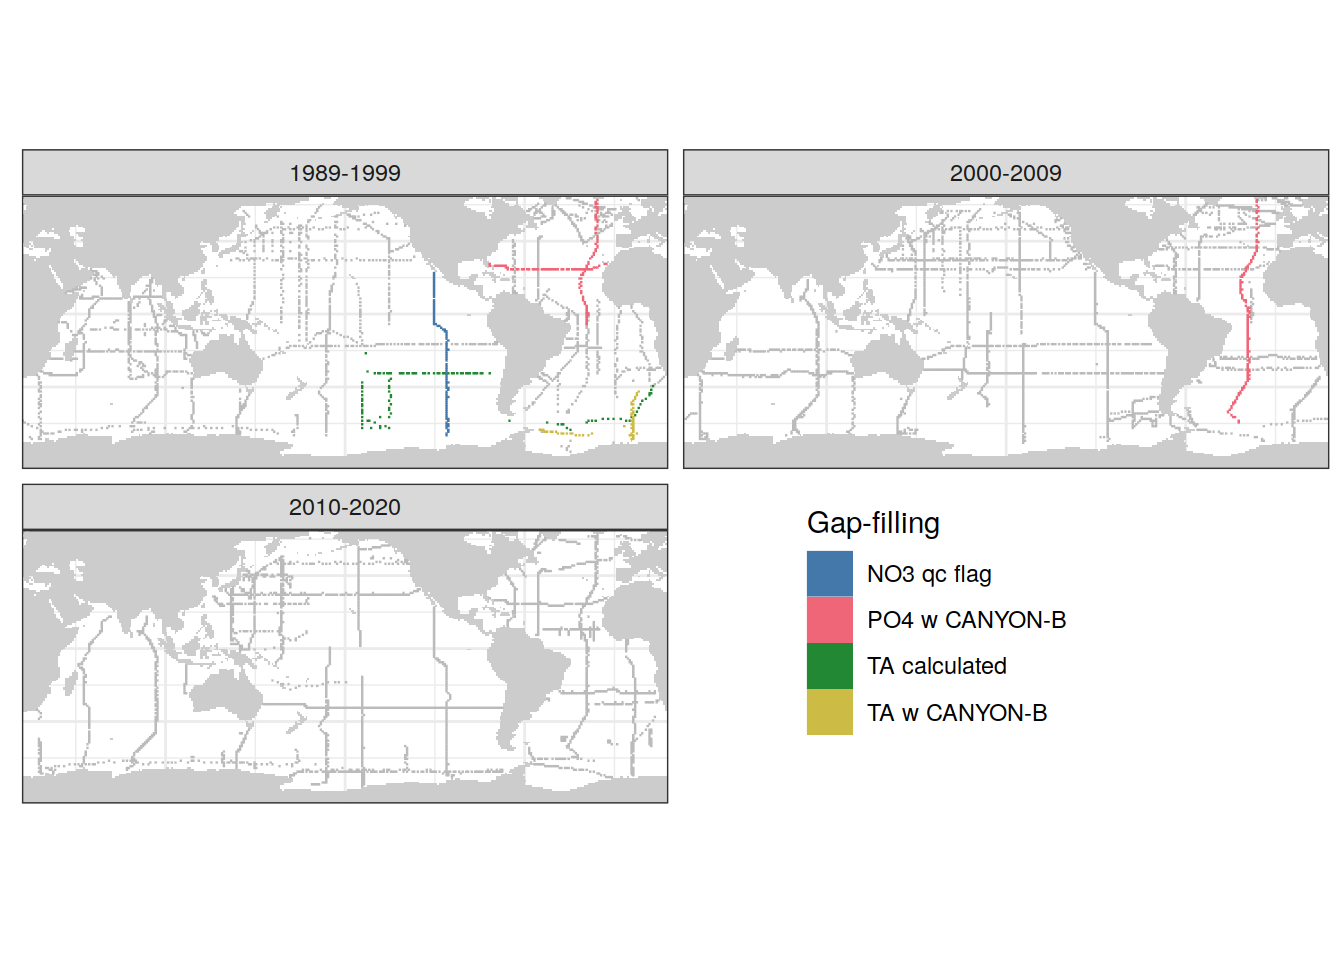
ggsave(plot = coverage_map,
       path = here::here("output/publication"),
       filename = "FigS_observations_coverage_map.png",
       height = 4,
       width = 8)

rm(coverage_map,
   GLODAP_all, GLODAP_all_coverage, GLODAP_expocodes,
   GLODAP_grid_era_all)


rm(cruises_phosphate_gap_fill,
   cruises_talk_gap_fill,
   cruises_talk_calc)
5 Atm CO2
co2_atm_roll <- co2_atm %>%
  mutate(pCO2_roll = zoo::rollmean(pCO2, 10, fill = NA))

p_pco2_atm <- co2_atm_roll %>%
  ggplot() +
  geom_point(aes(year, pCO2, col="annual")) +
  geom_path(aes(year, pCO2, col="annual")) +
  geom_point(aes(year, pCO2_roll, col="10yr roll")) +
  geom_path(aes(year, pCO2_roll, col="10yr roll"))

co2_atm_roll <- co2_atm_roll %>%
  mutate(delta_pCO2_roll = pCO2_roll - lag(pCO2_roll,10),
         delta_pCO2 = pCO2 - lag(pCO2,10))

p_delta_pCO2_atm <- co2_atm_roll %>%
  ggplot() +
  geom_point(aes(year, delta_pCO2, col="annual")) +
  geom_path(aes(year, delta_pCO2, col="annual")) +
  geom_point(aes(year, delta_pCO2_roll, col="10yr roll")) +
  geom_path(aes(year, delta_pCO2_roll, col="10yr roll"))

p_pco2_atm / p_delta_pCO2_atm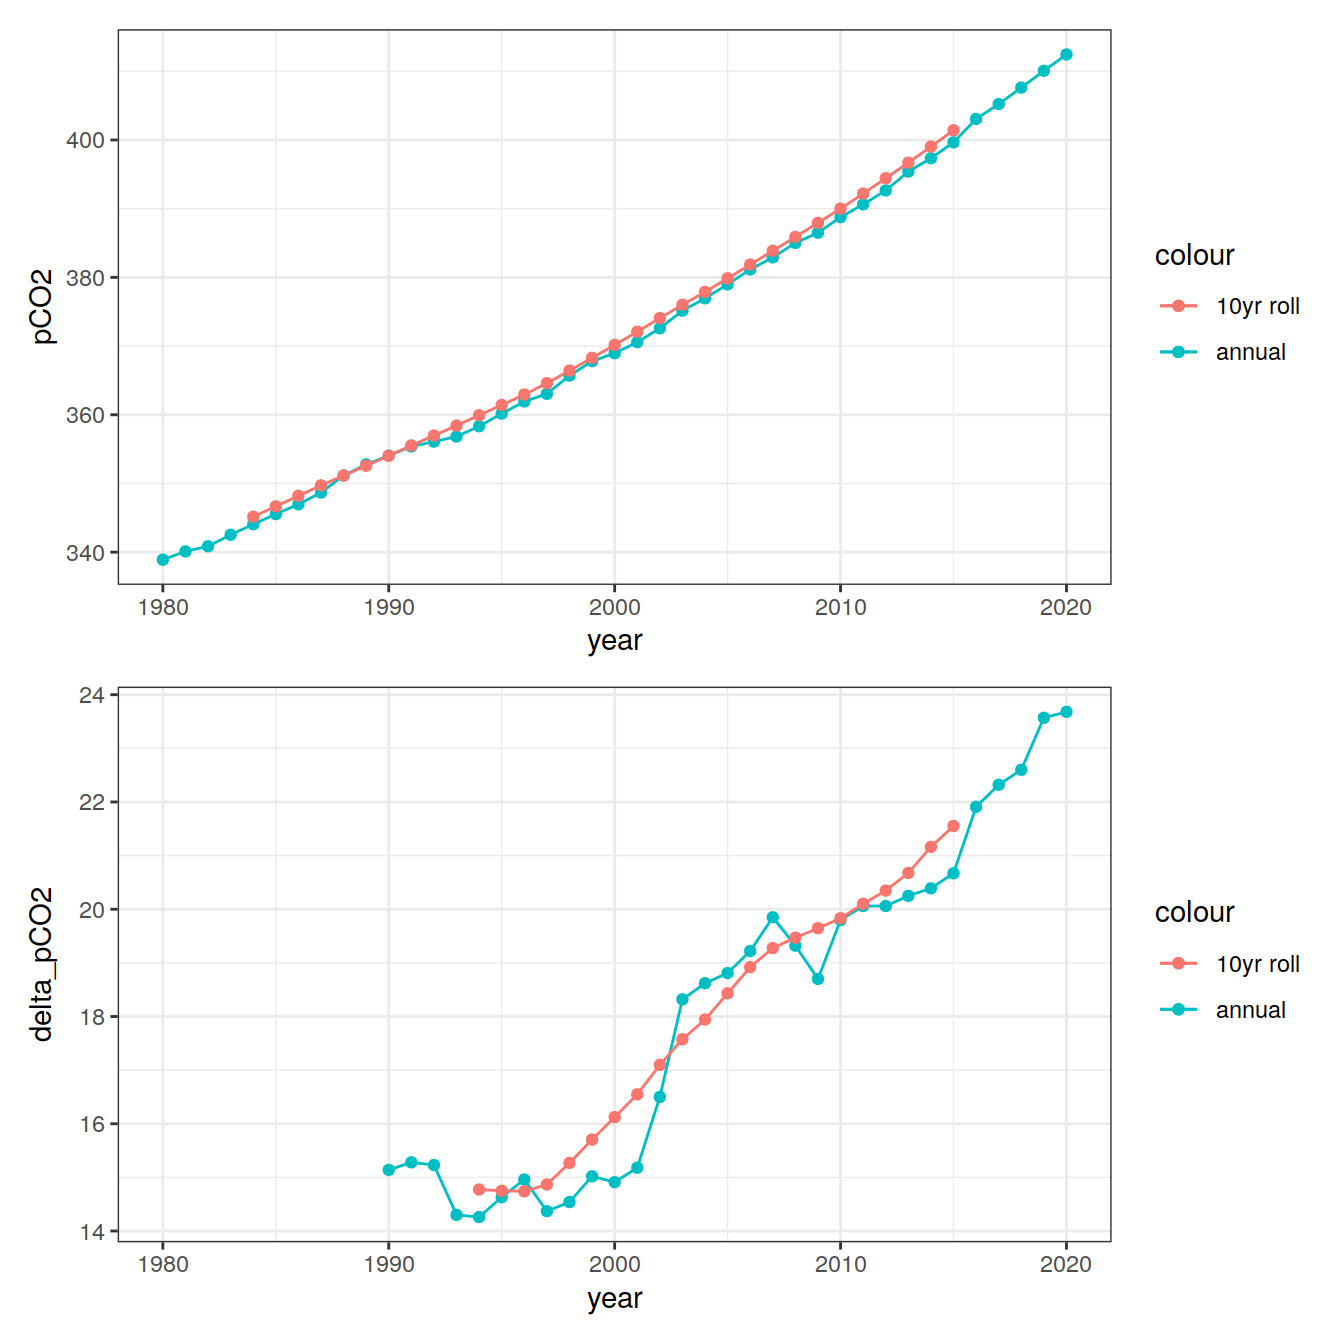
rm(p_pco2_atm, p_delta_pCO2_atm)

delta_pCO2_atm <-
  left_join(
    params_local_all %>%
      distinct(period, tref1, tref2),
    co2_atm_roll %>%
      select(
        tref1 = year,
        pCO2_1 = pCO2,
        pCO2_roll_1 = pCO2_roll
      )
  )

delta_pCO2_atm <-
  left_join(
    delta_pCO2_atm,
    co2_atm_roll %>%
      select(
        tref2 = year,
        pCO2_2 = pCO2,
        pCO2_roll_2 = pCO2_roll
      )
  )

delta_pCO2_atm <- delta_pCO2_atm %>%
  mutate(delta_pCO2 = pCO2_2 - pCO2_1,
         delta_pCO2_roll = pCO2_roll_2 - pCO2_roll_1) %>%
  select(period, delta_pCO2, delta_pCO2_roll)

delta_pCO2_atm <- delta_pCO2_atm %>%
  select(period, delta_pCO2)

delta_pCO2_atm <-
  bind_rows(
    delta_pCO2_atm,
    tibble(period = "1800 - 1994",
           delta_pCO2 = co2_atm %>% filter(year==1994) %>% pull(pCO2) - 280)
  )

rm(co2_atm_roll)
6 Globale scaling
- Accumulation beneath 3000m: +2%
- unmapped regions south of 65N: +1.5%
- Nordic Seas: +1%
- Arctic Ocean: +2%
dcant_scaling <- 1.02*1.015*1.01*1.027 Inventory maps
7.1 Absoulte values
7.1.1 dcant - absolute
# dcant_inv_all <- dcant_inv_all %>%
#   filter(data_source %in% c("obs"))


dcant_inv_all <- bind_rows(
  dcant_inv_all,
  tcant_inv %>% mutate(period = paste(tref1, tref2, sep = " - "),
                       data_source = "obs")
)


dcant_inv_all <- left_join(dcant_inv_all,
                           delta_pCO2_atm)


dcant_inv_all <- dcant_inv_all %>%
  mutate(beta = dcant / delta_pCO2,
         beta_pos = dcant_pos / delta_pCO2) %>%
  select(-starts_with("pCO2"))

dcant_inv_all_ensemble <- dcant_inv_all

dcant_inv_all <- dcant_inv_all %>%
  filter(Version_ID %in% Version_IDs | is.na(Version_ID))
p_CI_absolute <- dcant_inv_all %>%
filter(period %in% two_decades,
data_source %in% c("obs")) %>%
p_map_cant_inv(var = "dcant",
title_text = NULL) +
facet_wrap(~ period, ncol = 1) +
theme(axis.text.x = element_blank())
p_CI_absolute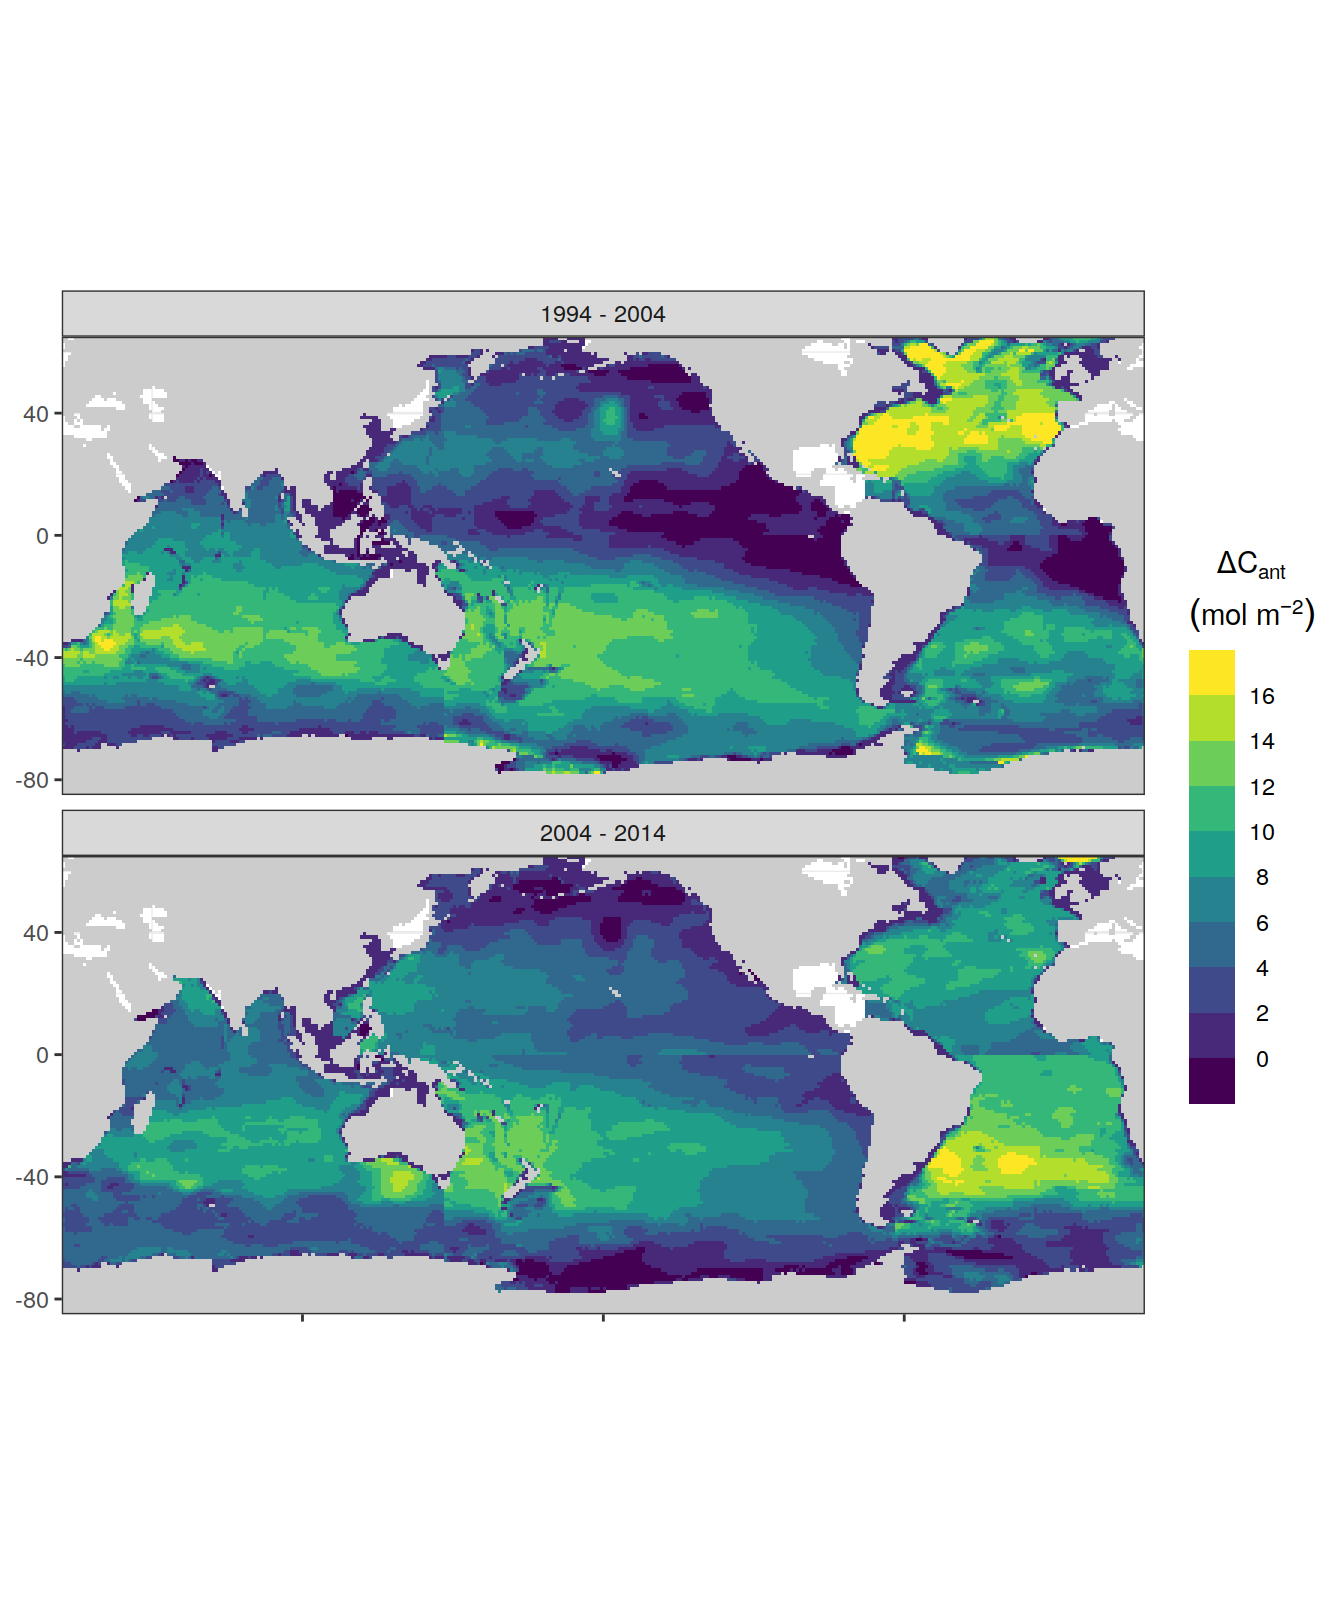
| Version | Author | Date |
|---|---|---|
| f68fcfa | jens-daniel-mueller | 2022-07-26 |
| f2615fb | jens-daniel-mueller | 2022-07-26 |
| fea41c1 | jens-daniel-mueller | 2022-07-20 |
| d2ae54c | jens-daniel-mueller | 2022-07-18 |
| ea46812 | jens-daniel-mueller | 2022-07-13 |
| f09080e | jens-daniel-mueller | 2022-06-28 |
| 87e9eb8 | jens-daniel-mueller | 2022-06-27 |
| b52b159 | jens-daniel-mueller | 2022-06-27 |
| 09b0780 | jens-daniel-mueller | 2022-05-24 |
| 1d73ec9 | jens-daniel-mueller | 2022-05-16 |
| 2ca0109 | jens-daniel-mueller | 2022-05-02 |
| 08607eb | jens-daniel-mueller | 2022-05-02 |
| b018a9a | jens-daniel-mueller | 2022-04-29 |
| e09320d | jens-daniel-mueller | 2022-04-12 |
| acad2e2 | jens-daniel-mueller | 2022-04-09 |
| 3d81135 | jens-daniel-mueller | 2022-04-07 |
| a74e341 | jens-daniel-mueller | 2022-04-04 |
| b599680 | jens-daniel-mueller | 2022-04-04 |
| bd9e11d | jens-daniel-mueller | 2022-03-22 |
| 2501978 | jens-daniel-mueller | 2022-03-21 |
| c3a6238 | jens-daniel-mueller | 2022-03-08 |
| 094bfa0 | jens-daniel-mueller | 2022-02-18 |
| d2191ad | jens-daniel-mueller | 2022-02-04 |
| 32e9682 | jens-daniel-mueller | 2022-02-02 |
| 5f2aed0 | jens-daniel-mueller | 2022-01-27 |
| 9753eb8 | jens-daniel-mueller | 2022-01-26 |
| b1d7720 | jens-daniel-mueller | 2022-01-21 |
| 4fe7150 | jens-daniel-mueller | 2022-01-21 |
dcant_inv_stat_mean <-
full_join(basinmask,
          dcant_inv_all) %>%
  mutate(surf_area = earth_surf(lat, lon)) %>%
  group_by(basin, period, data_source) %>%
  summarise(dcant = weighted.mean(dcant, surf_area)) %>%
  ungroup() %>%
  filter(!is.na(dcant))

dcant_inv_stat_ensemble <-
full_join(basinmask,
          dcant_inv_all_ensemble) %>%
  mutate(surf_area = earth_surf(lat, lon)) %>%
  group_by(basin, data_source, period, MLR_basins, Version_ID_group) %>%
  summarise(dcant = weighted.mean(dcant, surf_area)) %>%
  ungroup() %>%
  filter(!is.na(dcant)) %>%
  group_by(basin, data_source, period) %>%
  summarise(dcant_sd = sd(dcant)*2) %>%
  ungroup()

dcant_inv_stat <-
full_join(dcant_inv_stat_mean,
          dcant_inv_stat_ensemble)

rm(dcant_inv_stat_mean,
          dcant_inv_stat_ensemble)

dcant_inv_stat %>%
  filter(period %in% two_decades) %>%
  group_by(data_source, basin) %>%
  mutate(delta_dcant = dcant - lag(dcant),
         RSS = sqrt(dcant_sd ^ 2 + lag(dcant_sd ^ 2))) %>%
  ungroup() %>%
  kable() %>%
  kable_styling() %>%
scroll_box(height = "300px")| basin | period | data_source | dcant | dcant_sd | delta_dcant | RSS |
|---|---|---|---|---|---|---|
| N. Pacific | 1994 - 2004 | mod | 3.527437 | 0.5328718 | NA | NA |
| N. Pacific | 1994 - 2004 | mod_truth | 2.915800 | 0.0000000 | NA | NA |
| N. Pacific | 1994 - 2004 | obs | 2.347195 | 2.3109782 | NA | NA |
| N. Pacific | 2004 - 2014 | mod | 3.608933 | 0.6769466 | 0.0814953 | 0.8615156 |
| N. Pacific | 2004 - 2014 | mod_truth | 3.352012 | 0.0000000 | 0.4362120 | 0.0000000 |
| N. Pacific | 2004 - 2014 | obs | 4.038812 | 3.2083219 | 1.6916170 | 3.9539790 |
| S. Pacific | 1994 - 2004 | mod | 4.543124 | 1.3206295 | NA | NA |
| S. Pacific | 1994 - 2004 | mod_truth | 4.931744 | 0.0000000 | NA | NA |
| S. Pacific | 1994 - 2004 | obs | 7.278204 | 2.2631886 | NA | NA |
| S. Pacific | 2004 - 2014 | mod | 5.896297 | 0.9408415 | 1.3531731 | 1.6214947 |
| S. Pacific | 2004 - 2014 | mod_truth | 6.060215 | 0.0000000 | 1.1284704 | 0.0000000 |
| S. Pacific | 2004 - 2014 | obs | 6.600731 | 1.7210649 | -0.6774732 | 2.8432529 |
| N. Atlantic | 1994 - 2004 | mod | 4.834997 | 1.0037616 | NA | NA |
| N. Atlantic | 1994 - 2004 | mod_truth | 4.057536 | 0.0000000 | NA | NA |
| N. Atlantic | 1994 - 2004 | obs | 9.970307 | 1.0432559 | NA | NA |
| N. Atlantic | 2004 - 2014 | mod | 4.282947 | 0.9804729 | -0.5520499 | 1.4031624 |
| N. Atlantic | 2004 - 2014 | mod_truth | 4.878549 | 0.0000000 | 0.8210126 | 0.0000000 |
| N. Atlantic | 2004 - 2014 | obs | 7.652439 | 1.6768584 | -2.3178686 | 1.9749018 |
| S. Atlantic | 1994 - 2004 | mod | 5.579086 | 1.2343116 | NA | NA |
| S. Atlantic | 1994 - 2004 | mod_truth | 4.706655 | 0.0000000 | NA | NA |
| S. Atlantic | 1994 - 2004 | obs | 5.449012 | 2.3124413 | NA | NA |
| S. Atlantic | 2004 - 2014 | mod | 5.767762 | 0.9977609 | 0.1886764 | 1.5871521 |
| S. Atlantic | 2004 - 2014 | mod_truth | 5.251166 | 0.0000000 | 0.5445113 | 0.0000000 |
| S. Atlantic | 2004 - 2014 | obs | 9.647058 | 2.1252317 | 4.1980461 | 3.1406997 |
| Indian | 1994 - 2004 | mod | 5.875285 | 1.9889221 | NA | NA |
| Indian | 1994 - 2004 | mod_truth | 5.570926 | 0.0000000 | NA | NA |
| Indian | 1994 - 2004 | obs | 8.069098 | 4.0341866 | NA | NA |
| Indian | 2004 - 2014 | mod | 7.638433 | 1.2869140 | 1.7631482 | 2.3689573 |
| Indian | 2004 - 2014 | mod_truth | 6.501337 | 0.0000000 | 0.9304108 | 0.0000000 |
| Indian | 2004 - 2014 | obs | 6.547764 | 1.7211668 | -1.5213341 | 4.3860092 |
7.1.2 dcant - absolute delta
p_CI_delta <-
  dcant_inv_all %>%
  filter(data_source %in% c("obs"),
         period %in% two_decades) %>%
  select(data_source, lon, lat, basin_AIP, period, dcant) %>%
  pivot_wider(names_from = period,
              values_from = dcant) %>%
  mutate(dcant_offset = `2004 - 2014` - `1994 - 2004`,
         period = "(2004 - 2014) - (1994 - 2004)") %>%
  group_by(data_source) %>%
  group_split() %>%
  # head(1) %>%
  map(
    ~ p_map_cant_inv(
      df = .x,
      var = "dcant_offset",
      title_text = NULL,
      subtitle_text = NULL,
      col = "bias"
    ) +
      facet_wrap(~ period)
  )

p_CI_absolute / p_CI_delta +
  plot_annotation(tag_levels = 'A')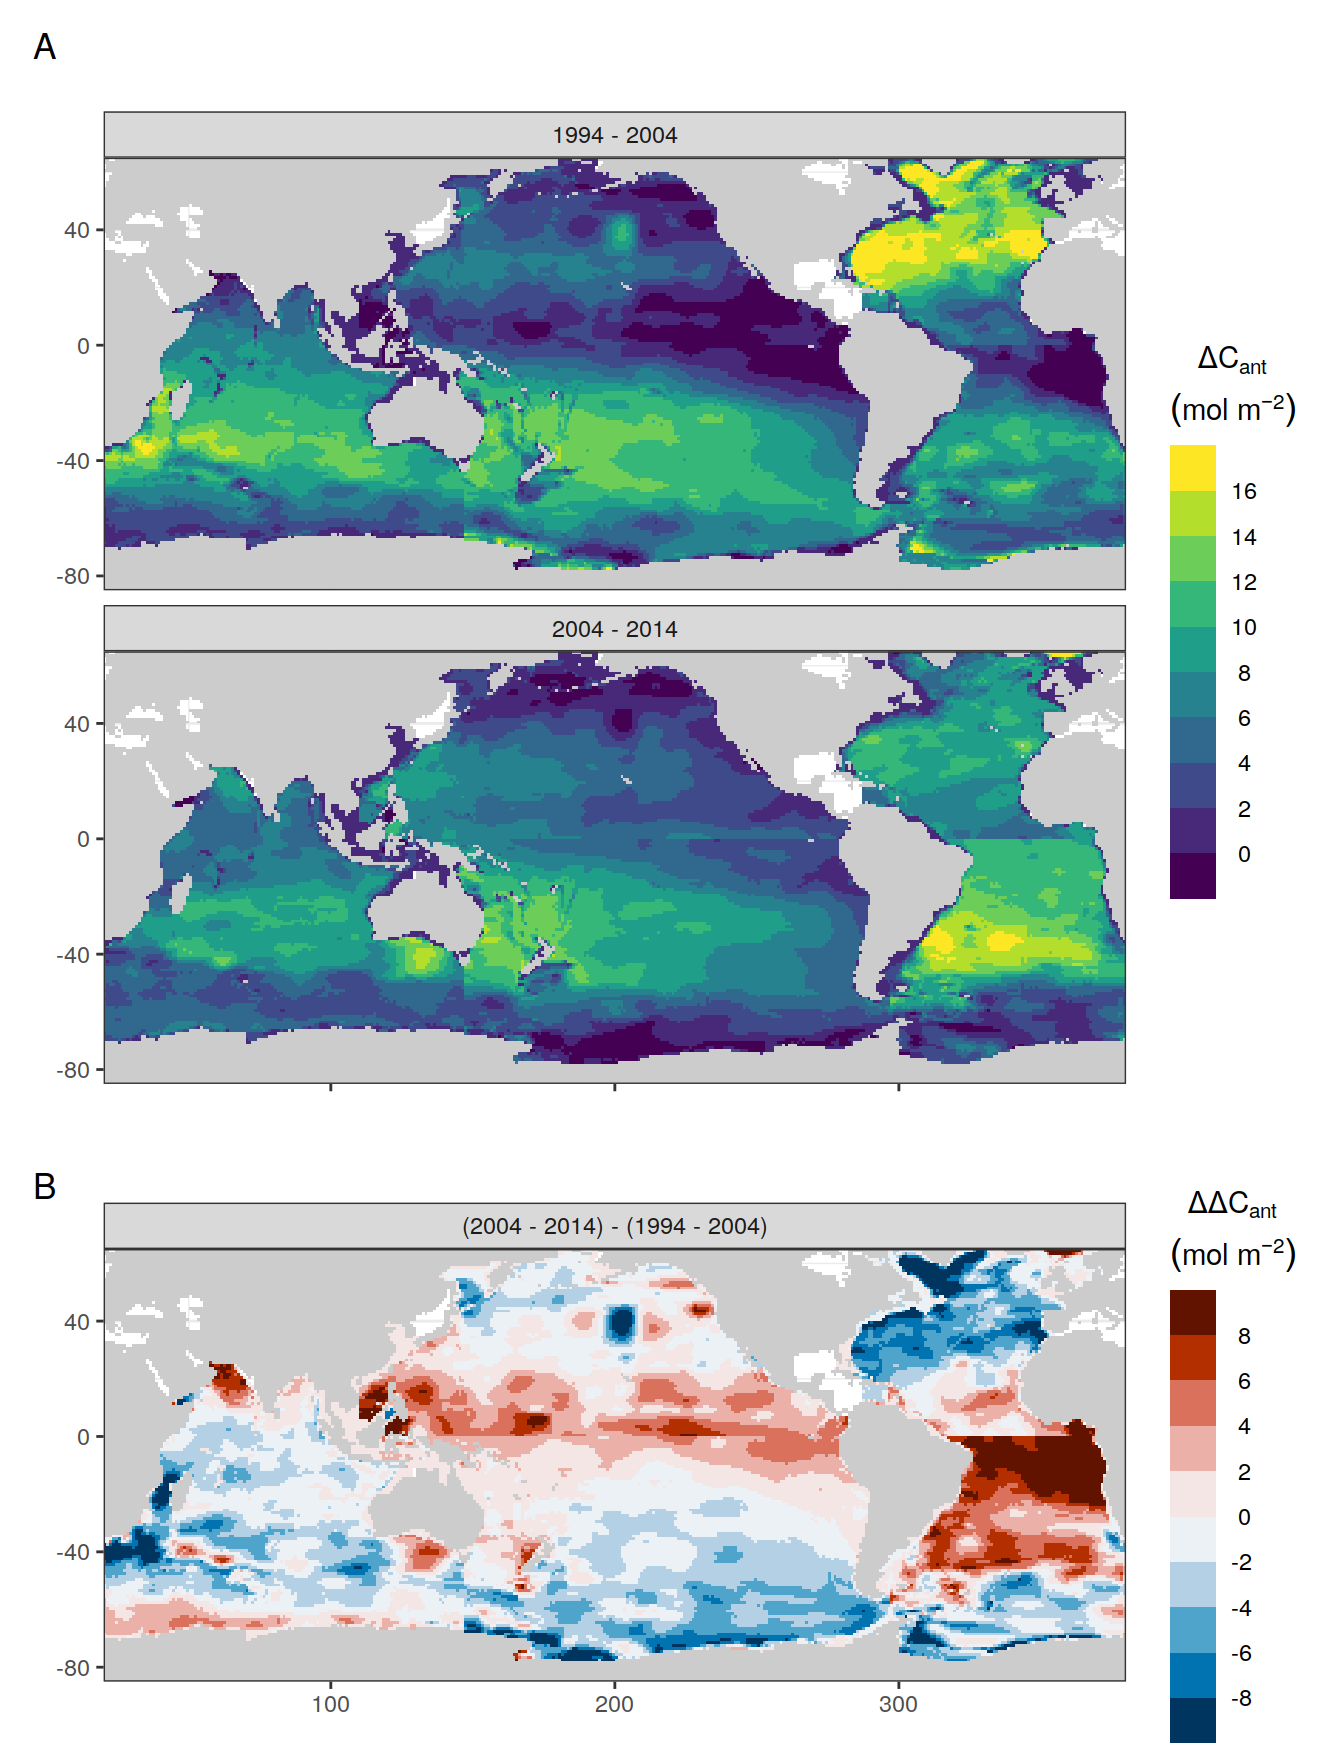
| Version | Author | Date |
|---|---|---|
| f68fcfa | jens-daniel-mueller | 2022-07-26 |
| f2615fb | jens-daniel-mueller | 2022-07-26 |
| 99a82db | jens-daniel-mueller | 2022-07-25 |
| fea41c1 | jens-daniel-mueller | 2022-07-20 |
| d2ae54c | jens-daniel-mueller | 2022-07-18 |
| efa414b | jens-daniel-mueller | 2022-07-16 |
| f1d7f80 | jens-daniel-mueller | 2022-07-13 |
| ea46812 | jens-daniel-mueller | 2022-07-13 |
| f09080e | jens-daniel-mueller | 2022-06-28 |
| 748aa43 | jens-daniel-mueller | 2022-06-27 |
| 87e9eb8 | jens-daniel-mueller | 2022-06-27 |
| b52b159 | jens-daniel-mueller | 2022-06-27 |
| 1d73ec9 | jens-daniel-mueller | 2022-05-16 |
| 2ca0109 | jens-daniel-mueller | 2022-05-02 |
| b018a9a | jens-daniel-mueller | 2022-04-29 |
| e09320d | jens-daniel-mueller | 2022-04-12 |
| acad2e2 | jens-daniel-mueller | 2022-04-09 |
| 3d81135 | jens-daniel-mueller | 2022-04-07 |
| a74e341 | jens-daniel-mueller | 2022-04-04 |
| b599680 | jens-daniel-mueller | 2022-04-04 |
| bd9e11d | jens-daniel-mueller | 2022-03-22 |
| 2501978 | jens-daniel-mueller | 2022-03-21 |
| c3a6238 | jens-daniel-mueller | 2022-03-08 |
| 094bfa0 | jens-daniel-mueller | 2022-02-18 |
| 32e9682 | jens-daniel-mueller | 2022-02-02 |
| 5f2aed0 | jens-daniel-mueller | 2022-01-27 |
| 9753eb8 | jens-daniel-mueller | 2022-01-26 |
| b1d7720 | jens-daniel-mueller | 2022-01-21 |
| 4fe7150 | jens-daniel-mueller | 2022-01-21 |
ggsave(path = here::here("output/publication"),
       filename = "Fig_dcant_column_inventory.png",
       height = 10,
       width = 8)

rm(p_CI_absolute, p_CI_delta)
7.1.3 Bias
p_CI_absolute_mod <- dcant_inv_all %>%
  filter(period %in% two_decades,
         data_source != "obs") %>%
  mutate(data_source = case_when(
    data_source == "mod" ~ "Reconstruction",
    data_source == "mod_truth" ~ "Model truth"
  )) %>%
  p_map_cant_inv(var = "dcant",
                 title_text = NULL) +
  facet_grid(data_source ~ period) +
  theme(axis.text.x = element_blank())

p_CI_absolute_mod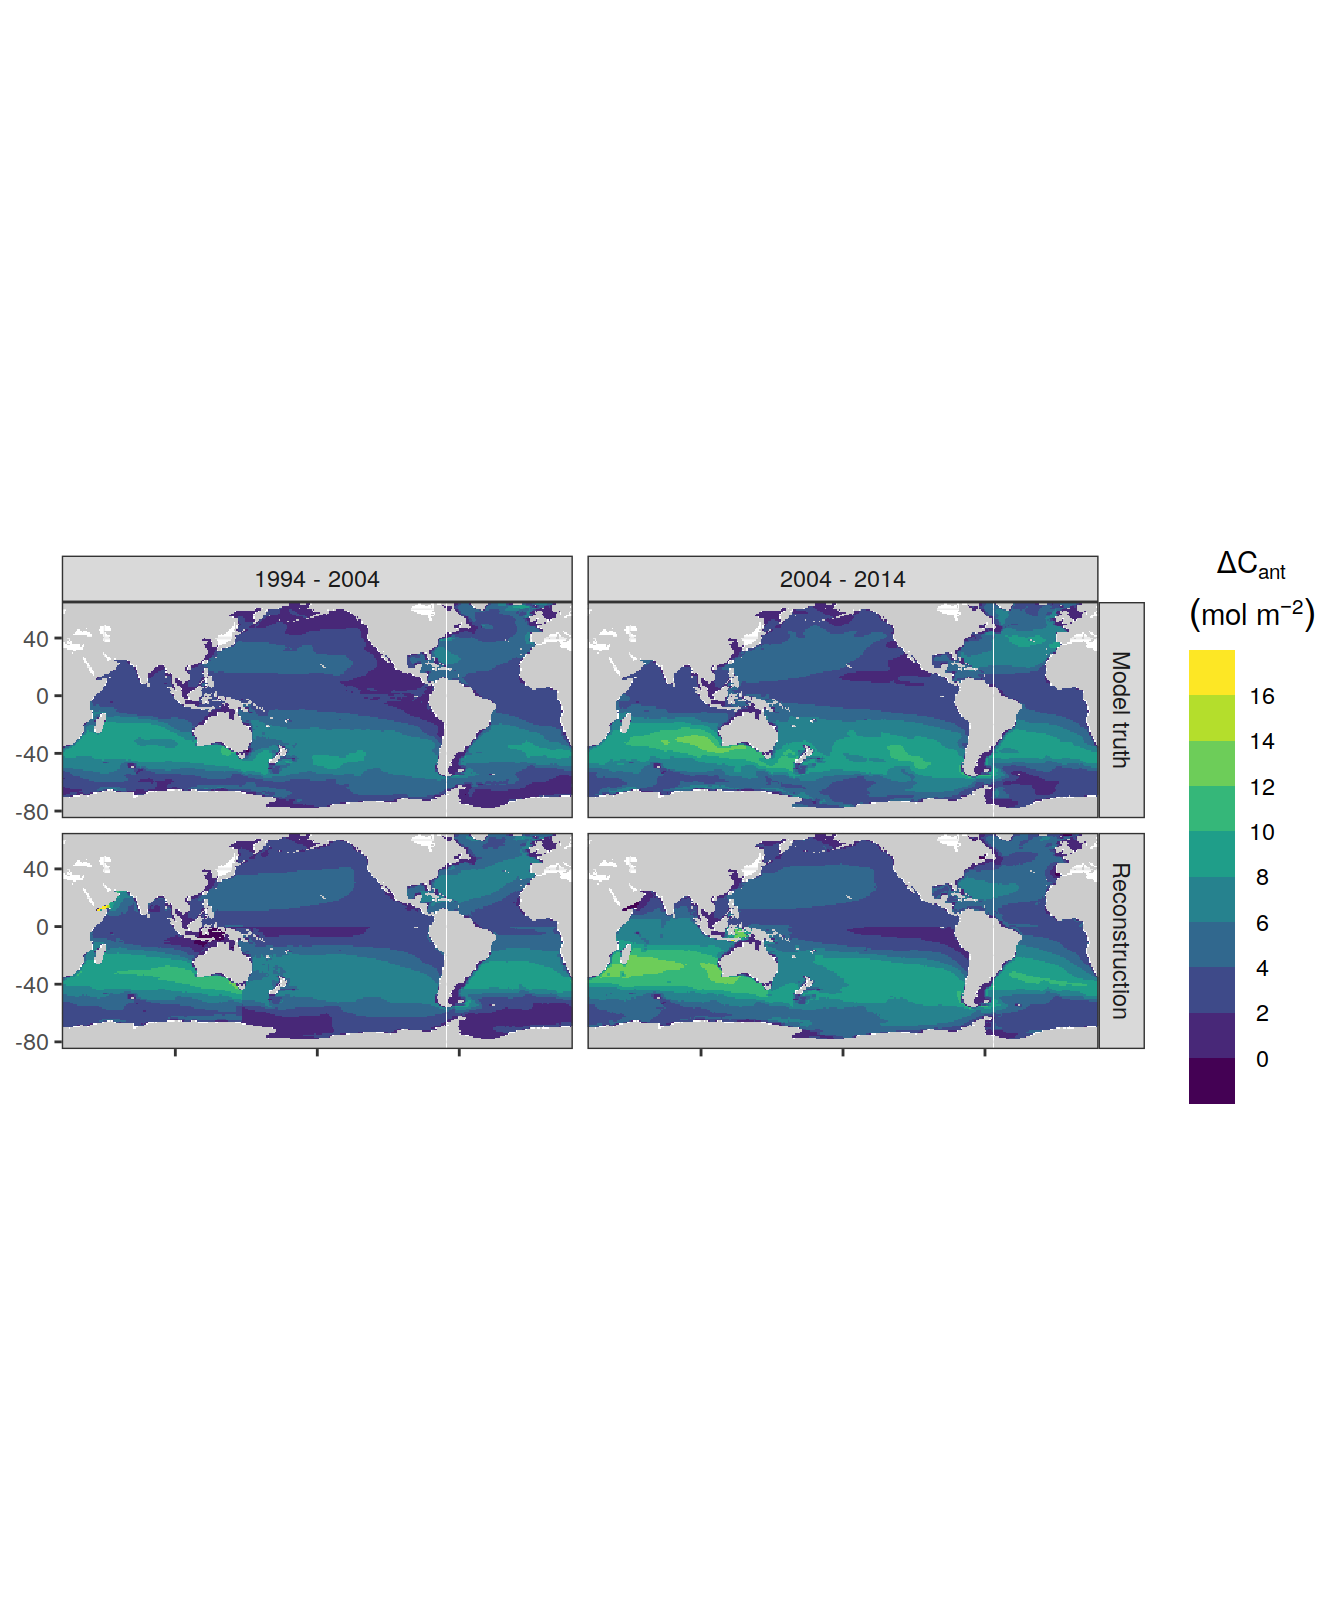
| Version | Author | Date |
|---|---|---|
| 5b77c4f | jens-daniel-mueller | 2022-08-10 |
p_CI_bias <-
  dcant_inv_all %>%
  filter(period %in% two_decades,
         data_source != "obs") %>%
  select(data_source, lon, lat, basin_AIP, period, dcant) %>%
  pivot_wider(names_from = data_source,
              values_from = dcant) %>%
  mutate(dcant_offset = mod - mod_truth,
         data_source = "Reconstruction bias") %>%
  p_map_cant_inv(
    var = "dcant_offset",
    title_text = NULL,
    subtitle_text = NULL,
    col = "bias"
  ) +
  facet_grid(data_source ~ period) +
  theme(strip.text.x = element_blank(),
        strip.background.x = element_blank())

p_CI_absolute_mod / p_CI_bias +
  plot_annotation(tag_levels = 'A')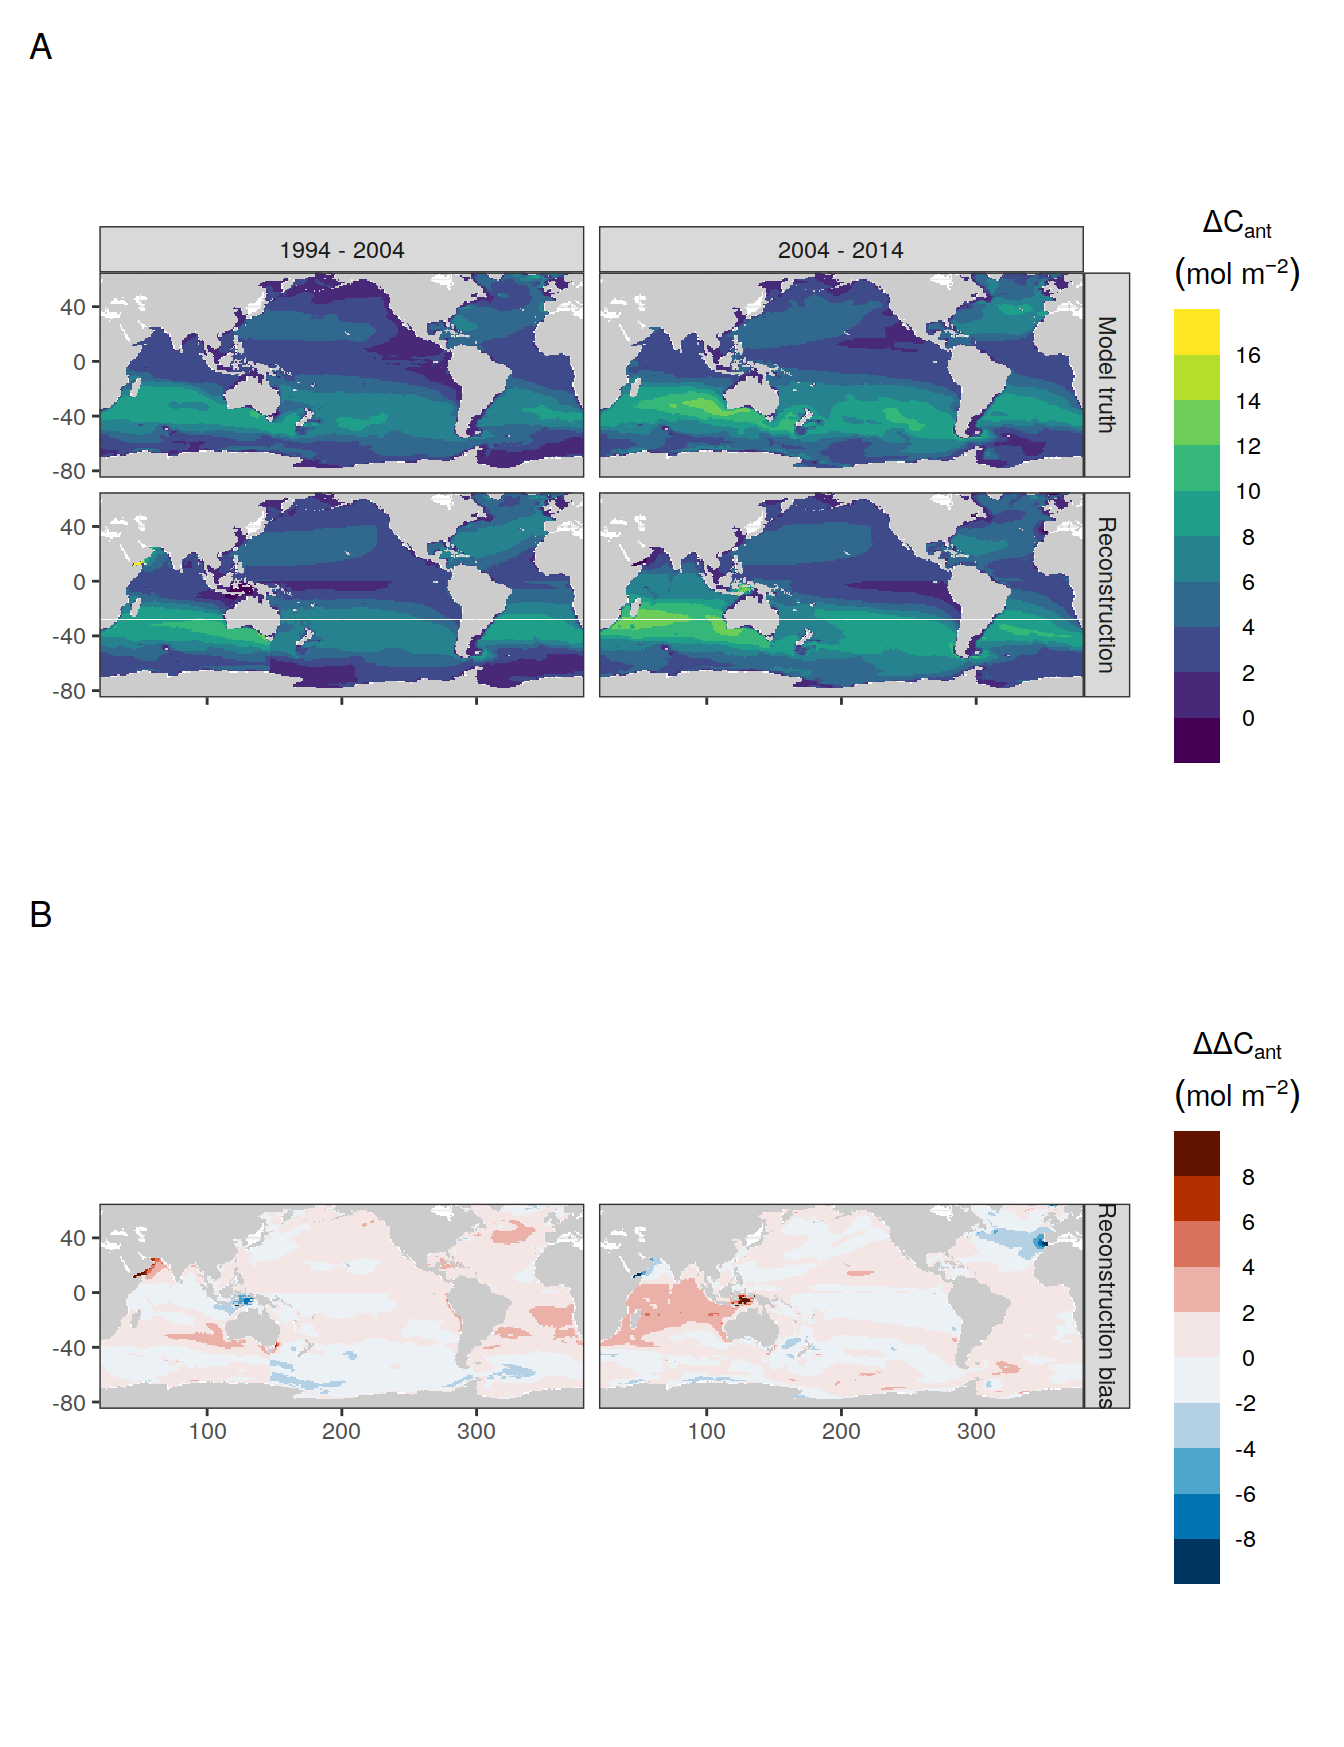
| Version | Author | Date |
|---|---|---|
| 5b77c4f | jens-daniel-mueller | 2022-08-10 |
ggsave(path = here::here("output/publication"),
       filename = "FigS_dcant_column_inventory_synthetic_data.png",
       height = 10,
       width = 11)

rm(p_CI_absolute_mod, p_CI_bias)
7.1.4 Ensemble SD
dcant_inv_all_ensemble_mean <-
  dcant_inv_all_ensemble %>%
  filter(period != "1800 - 1994",
         data_source == "obs") %>%
  group_by(data_source, period, lon, lat) %>%
  summarise(dcant_sd = sd(dcant)*2) %>%
  ungroup()


dcant_inv_all_ensemble_mean %>%
  p_map_cant_inv(var = "dcant_sd",
                 breaks = c(seq(0, 8, 1), Inf),
                 title_text = NULL) +
  facet_grid(period ~ .) +
  theme(axis.text = element_blank(),
        axis.ticks = element_blank())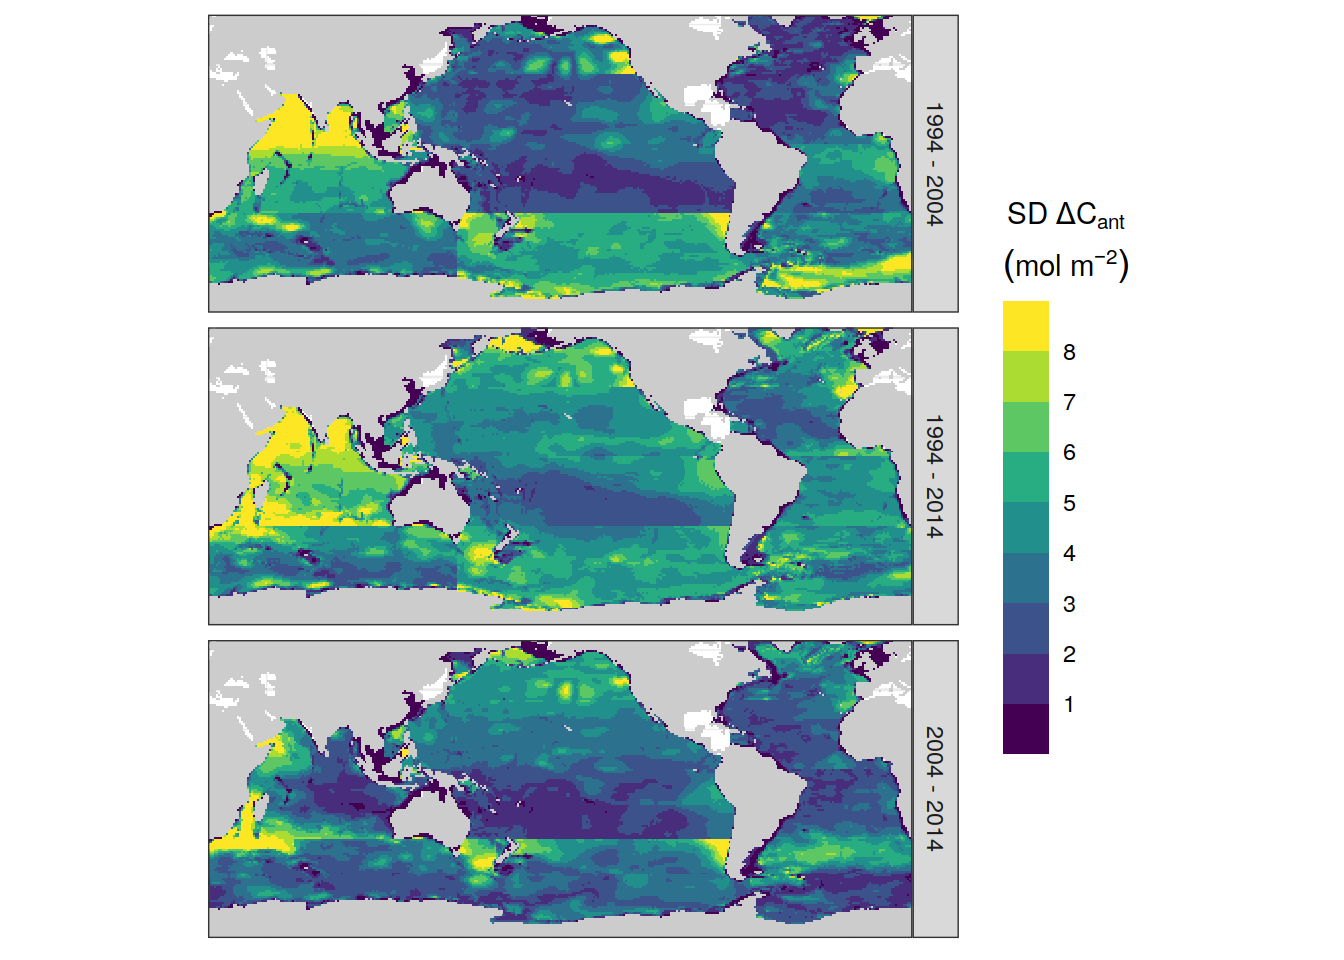
| Version | Author | Date |
|---|---|---|
| f68fcfa | jens-daniel-mueller | 2022-07-26 |
| f2615fb | jens-daniel-mueller | 2022-07-26 |
| fea41c1 | jens-daniel-mueller | 2022-07-20 |
| d2ae54c | jens-daniel-mueller | 2022-07-18 |
| 2695085 | jens-daniel-mueller | 2022-07-17 |
| 535196a | jens-daniel-mueller | 2022-07-17 |
| 0160c40 | jens-daniel-mueller | 2022-07-16 |
| afb27ad | jens-daniel-mueller | 2022-07-15 |
| b492b46 | jens-daniel-mueller | 2022-07-15 |
| bd24a0f | jens-daniel-mueller | 2022-07-15 |
| 17cd1d1 | jens-daniel-mueller | 2022-07-13 |
| 003b161 | jens-daniel-mueller | 2022-07-12 |
| 8ab4a87 | jens-daniel-mueller | 2022-06-29 |
| 7629c78 | jens-daniel-mueller | 2022-06-29 |
| f6786c8 | jens-daniel-mueller | 2022-06-29 |
| f09080e | jens-daniel-mueller | 2022-06-28 |
| 16dc3af | jens-daniel-mueller | 2022-06-27 |
# ggsave(path = here::here("output/publication"),
#        filename = "FigS_dcant_column_inventory_ensemble_standard_deviation.png",
#        height = 6,
#        width = 6)
7.1.5 Unadjusted data
dcant_inv_all_unadjusted <-
  dcant_inv_all_ensemble %>%
  filter(period %in% two_decades,
         data_source == "obs",
         MLR_basins == "3",
         Version_ID %in% Version_IDs |
           Version_ID %in% Version_IDs_d)


dcant_inv_all_unadjusted %>%
  p_map_cant_inv(var = "dcant",
                 title_text = NULL) +
  facet_grid(Version_ID_group ~ period)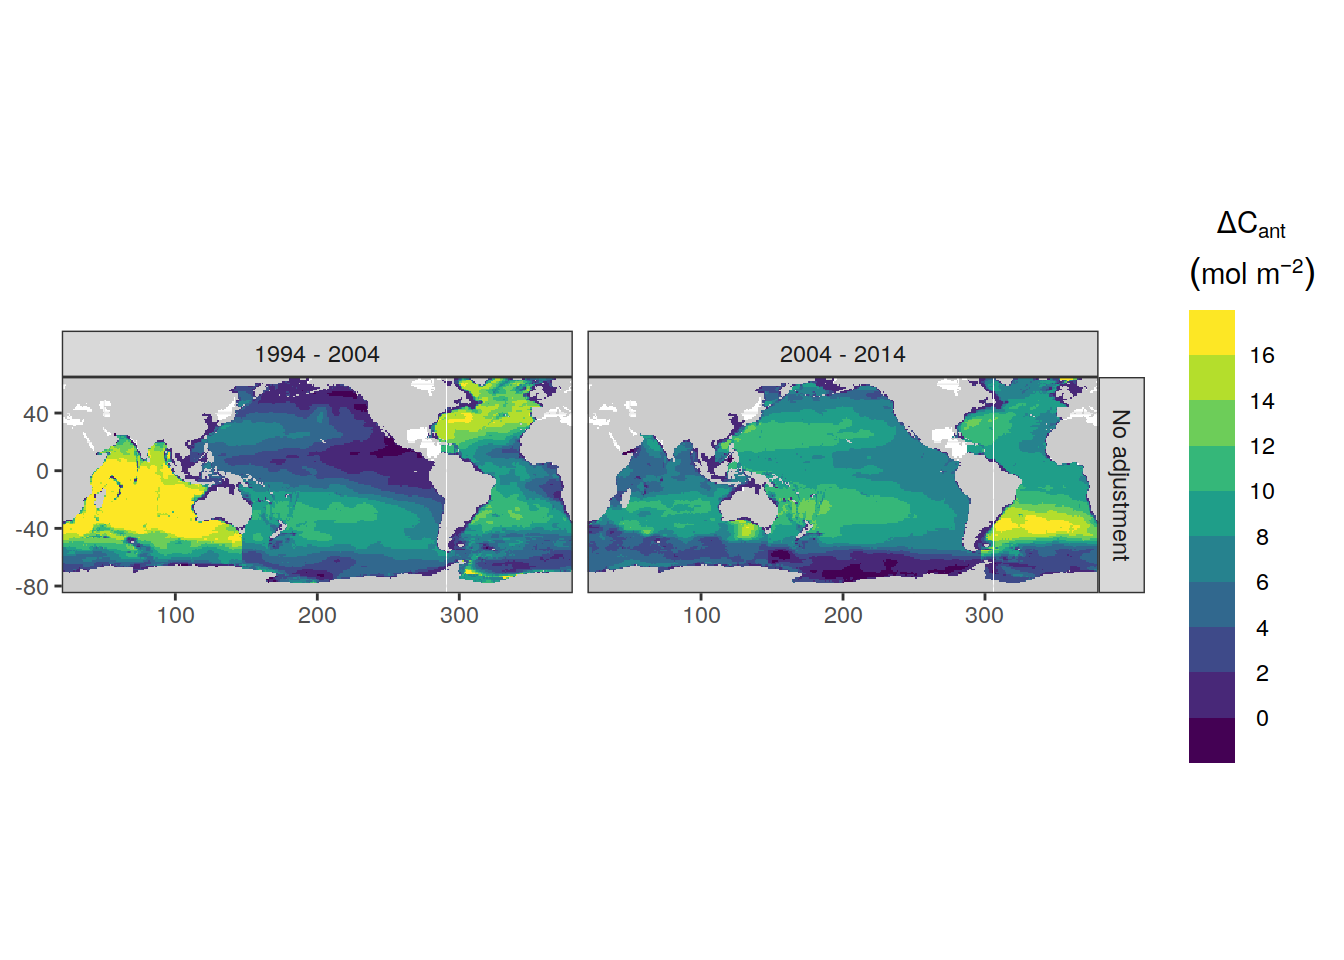
ggsave(path = here::here("output/publication"),
       filename = "FigS_dcant_column_inventory_unadjusted_data.png",
       height = 4,
       width = 8)
7.1.6 beta
dcant_inv_all %>%
  filter(data_source %in% c("obs")) %>%
  p_map_cant_inv(var = "beta",
                 breaks = c(-Inf, seq(0, 1, 0.1), Inf),
                 title_text = NULL) +
  facet_grid(period ~ .)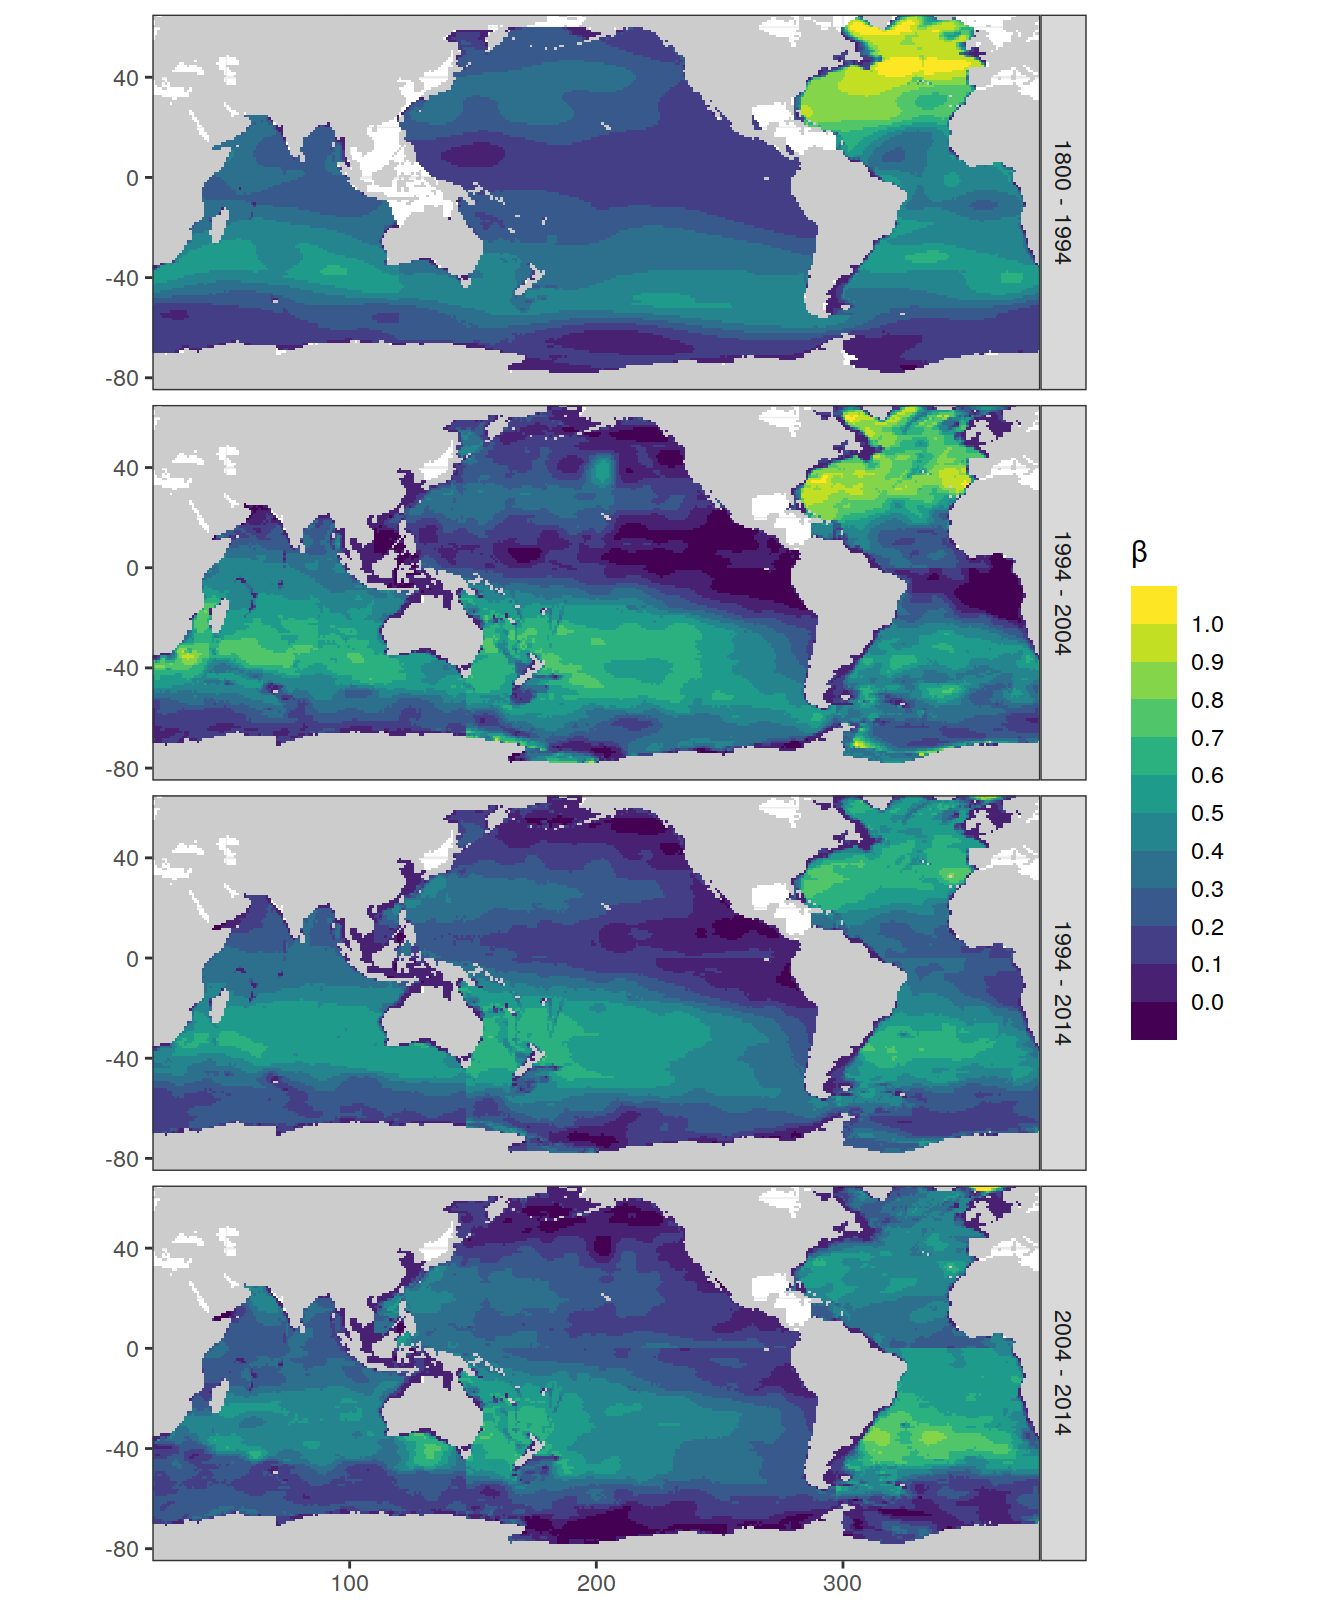
ggsave(path = here::here("output/publication"),
       filename = "FigS_beta_column_inventory.png",
       height = 8,
       width = 6)
7.2 Zonal means
dcant_inv_all <- m_grid_horizontal_coarse(dcant_inv_all)

dcant_inv_all_lat_mean <- dcant_inv_all %>%
  group_by(basin_AIP, period, lat_grid, data_source) %>%
  summarise(beta = mean(beta, na.rm = TRUE),
            dcant = mean(dcant, na.rm = TRUE)) %>%
  ungroup()

dcant_inv_all_ensemble <- m_grid_horizontal_coarse(dcant_inv_all_ensemble)

dcant_inv_all_ensemble_lat_mean <- dcant_inv_all_ensemble %>%
  group_by(basin_AIP, period, lat_grid, Version_ID, data_source) %>%
  summarise(beta_mean = mean(beta, na.rm = TRUE),
            dcant_mean = mean(dcant, na.rm = TRUE)) %>%
  ungroup()

dcant_inv_all_ensemble_lat_mean_average <- dcant_inv_all_ensemble_lat_mean %>%
  group_by(basin_AIP, period, lat_grid, data_source) %>%
  summarise(beta_sd = sd(beta_mean, na.rm = TRUE),
            beta_mean = mean(beta_mean, na.rm = TRUE),
            dcant_sd = sd(dcant_mean, na.rm = TRUE),
            dcant_mean = mean(dcant_mean, na.rm = TRUE)) %>%
  ungroup()

dcant_inv_all_lat_mean <- full_join(dcant_inv_all_lat_mean,
                                    dcant_inv_all_ensemble_lat_mean_average)
7.2.1 dcant
dcant_inv_all_lat_mean %>%
  filter(period != "1800 - 1994") %>%
  ggplot(aes(lat_grid, dcant, fill = period)) +
  geom_hline(yintercept = c(0,10)) +
  geom_vline(xintercept = c(-10,10)) +
  geom_vline(xintercept = c(-40,-30,30,40)) +
  geom_ribbon(aes(ymin = dcant - dcant_sd,
                  ymax = dcant + dcant_sd),
              alpha = 0.3) +
  geom_path(aes(col = period)) +
  geom_point(shape = 21) +
  scale_color_brewer(palette = "Dark2", name = "Mean ± SD") +
  scale_fill_brewer(palette = "Dark2", name = "Mean ± SD") +
  coord_flip() +
  facet_grid(data_source ~ basin_AIP) +
  labs(x = "Latitude (°N)",
       y = dcant_CI_label) +
  scale_x_continuous(breaks = seq(-75,75, 15))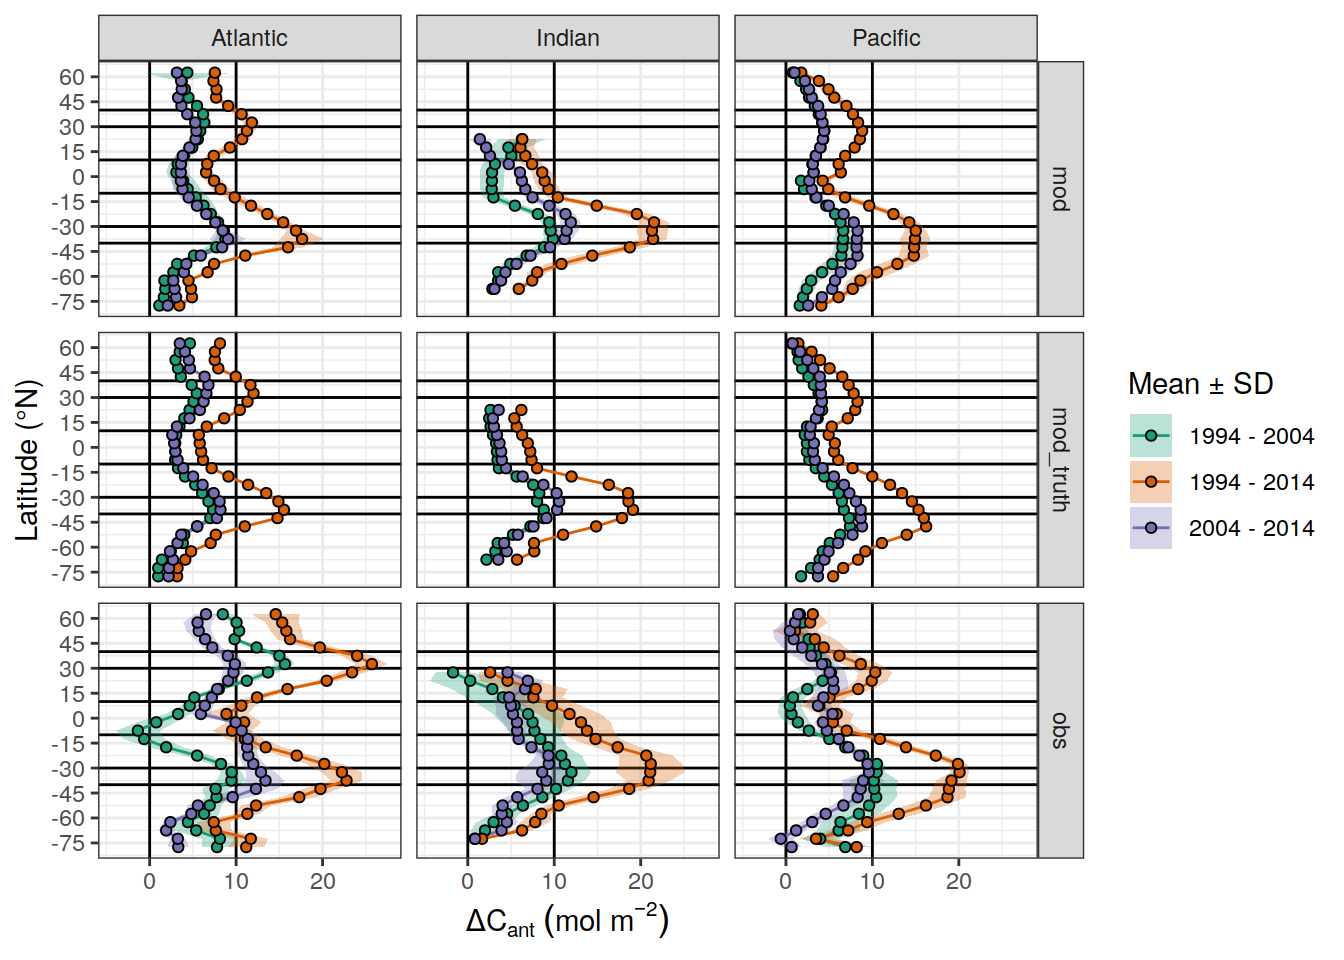
| Version | Author | Date |
|---|---|---|
| 5b77c4f | jens-daniel-mueller | 2022-08-10 |
| fea41c1 | jens-daniel-mueller | 2022-07-20 |
| d2ae54c | jens-daniel-mueller | 2022-07-18 |
| 2695085 | jens-daniel-mueller | 2022-07-17 |
| 535196a | jens-daniel-mueller | 2022-07-17 |
| afb27ad | jens-daniel-mueller | 2022-07-15 |
| b492b46 | jens-daniel-mueller | 2022-07-15 |
| bd24a0f | jens-daniel-mueller | 2022-07-15 |
| ea46812 | jens-daniel-mueller | 2022-07-13 |
dcant_inv_all_lat_mean %>%
  filter(period != "1800 - 1994") %>%
  mutate(lat_grid = cut(lat_grid, c(-40,-30,-10,10,30,40))) %>%
  group_by(lat_grid, data_source) %>%
  summarise(dcant_mean = mean(dcant_mean, na_rm = TRUE)) %>%
  ungroup()
# A tibble: 18 × 3
lat_grid data_source dcant_mean
<fct> <chr> <dbl>
1 (-40,-30] mod 11.7
2 (-40,-30] mod_truth 10.9
3 (-40,-30] obs 14.4
4 (-30,-10] mod 8.74
5 (-30,-10] mod_truth 7.73
6 (-30,-10] obs 11.6
7 (-10,10] mod 4.65
8 (-10,10] mod_truth 4.09
9 (-10,10] obs 7.45
10 (10,30] mod 5.40
11 (10,30] mod_truth 5.03
12 (10,30] obs 7.46
13 (30,40] mod 6.27
14 (30,40] mod_truth 6.46
15 (30,40] obs 11.0
16 <NA> mod 5.62
17 <NA> mod_truth 5.59
18 <NA> obs 7.35dcant_inv_all_lat_mean %>%
filter(period != "1800 - 1994") %>%
mutate(lat_grid = cut(lat_grid, c(-40,-30,-10,10,30,40))) %>%
group_by(lat_grid, basin_AIP, data_source) %>%
summarise(dcant_mean = mean(dcant_mean, na_rm = TRUE)) %>%
ungroup()# A tibble: 51 × 4
lat_grid basin_AIP data_source dcant_mean
<fct> <chr> <chr> <dbl>
1 (-40,-30] Atlantic mod 11.3
2 (-40,-30] Atlantic mod_truth 10.1
3 (-40,-30] Atlantic obs 15.6
4 (-40,-30] Indian mod 13.4
5 (-40,-30] Indian mod_truth 12.6
6 (-40,-30] Indian obs 14.5
7 (-40,-30] Pacific mod 10.6
8 (-40,-30] Pacific mod_truth 9.97
9 (-40,-30] Pacific obs 13.3
10 (-30,-10] Atlantic mod 7.55
# … with 41 more rowsdcant_inv_all_lat_mean %>%
filter(period != "1800 - 1994") %>%
mutate(lat_grid = cut(lat_grid, c(-90,0,90))) %>%
group_by(lat_grid, basin_AIP, period, data_source) %>%
summarise(dcant_mean = mean(dcant_mean, na_rm = TRUE)) %>%
ungroup()# A tibble: 54 × 5
lat_grid basin_AIP period data_source dcant_mean
<fct> <chr> <chr> <chr> <dbl>
1 (-90,0] Atlantic 1994 - 2004 mod 4.29
2 (-90,0] Atlantic 1994 - 2004 mod_truth 4.06
3 (-90,0] Atlantic 1994 - 2004 obs 7.31
4 (-90,0] Atlantic 1994 - 2014 mod 9.63
5 (-90,0] Atlantic 1994 - 2014 mod_truth 8.72
6 (-90,0] Atlantic 1994 - 2014 obs 15.2
7 (-90,0] Atlantic 2004 - 2014 mod 5.42
8 (-90,0] Atlantic 2004 - 2014 mod_truth 4.66
9 (-90,0] Atlantic 2004 - 2014 obs 7.71
10 (-90,0] Indian 1994 - 2004 mod 5.90
# … with 44 more rowsdcant_inv_all_ensemble_lat_mean %>%
ggplot(aes(lat_grid, dcant_mean, fill=period, group=Version_ID)) +
geom_hline(yintercept = 0) +
geom_path(aes(col=period), alpha = 0.3) +
scale_color_brewer(palette = "Dark2") +
scale_fill_brewer(palette = "Dark2") +
coord_flip() +
facet_grid(data_source ~ basin_AIP) +
labs(x = "Latitude (°N)",
y = dcant_CI_label)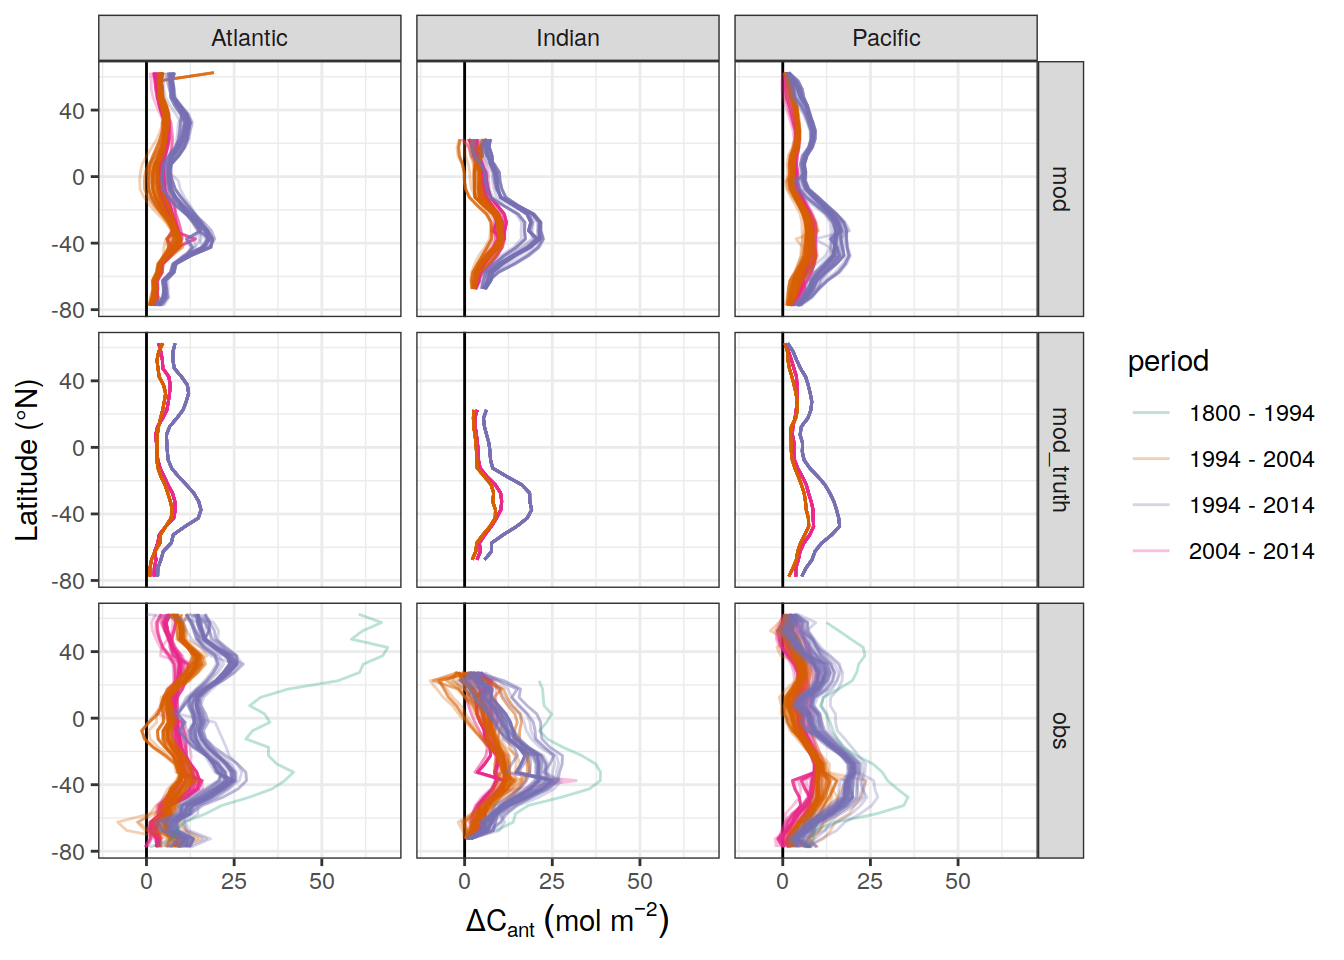
| Version | Author | Date |
|---|---|---|
| 5b77c4f | jens-daniel-mueller | 2022-08-10 |
| fea41c1 | jens-daniel-mueller | 2022-07-20 |
| d2ae54c | jens-daniel-mueller | 2022-07-18 |
| 2695085 | jens-daniel-mueller | 2022-07-17 |
| 535196a | jens-daniel-mueller | 2022-07-17 |
| 0160c40 | jens-daniel-mueller | 2022-07-16 |
| afb27ad | jens-daniel-mueller | 2022-07-15 |
| b492b46 | jens-daniel-mueller | 2022-07-15 |
| bd24a0f | jens-daniel-mueller | 2022-07-15 |
| ea46812 | jens-daniel-mueller | 2022-07-13 |
7.2.2 beta
dcant_inv_all_lat_mean %>%
  ggplot(aes(lat_grid, beta, fill = period)) +
  geom_hline(yintercept = 0) +
  geom_ribbon(aes(ymin = beta - beta_sd,
                  ymax = beta + beta_sd),
              alpha = 0.3) +
  geom_path(aes(col = period)) +
  geom_point(shape = 21) +
  scale_color_brewer(palette = "Dark2", name = "Mean ± SD") +
  scale_fill_brewer(palette = "Dark2", name = "Mean ± SD") +
  coord_flip() +
  facet_grid(data_source ~ basin_AIP) +
  labs(x = "Latitude (°N)",
       y = beta_CI_label) +
  scale_x_continuous(breaks = seq(-75,75, 15))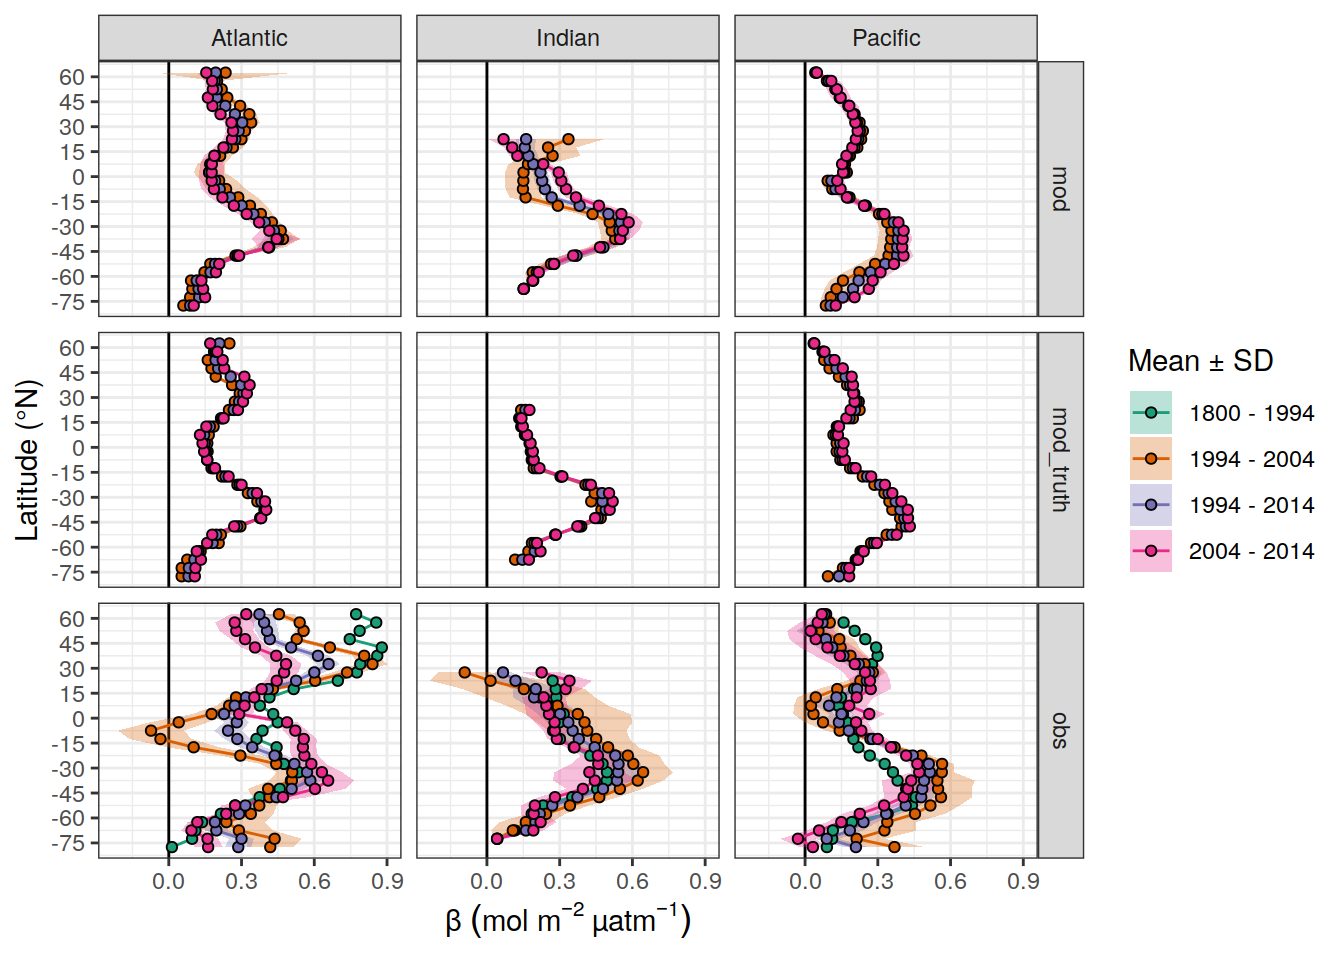
| Version | Author | Date |
|---|---|---|
| 5b77c4f | jens-daniel-mueller | 2022-08-10 |
| fea41c1 | jens-daniel-mueller | 2022-07-20 |
| d2ae54c | jens-daniel-mueller | 2022-07-18 |
| 2695085 | jens-daniel-mueller | 2022-07-17 |
| 535196a | jens-daniel-mueller | 2022-07-17 |
| afb27ad | jens-daniel-mueller | 2022-07-15 |
| b492b46 | jens-daniel-mueller | 2022-07-15 |
| bd24a0f | jens-daniel-mueller | 2022-07-15 |
| ea46812 | jens-daniel-mueller | 2022-07-13 |
dcant_inv_all_ensemble_lat_mean %>%
  ggplot(aes(lat_grid, beta_mean, fill=period, group=Version_ID)) +
  geom_hline(yintercept = 0) +
  geom_path(aes(col=period), alpha = 0.3) +
  scale_color_brewer(palette = "Dark2") +
  scale_fill_brewer(palette = "Dark2") +
  coord_flip() +
  facet_grid(data_source ~ basin_AIP) +
  labs(x = "Latitude (°N)",
       y = beta_CI_label)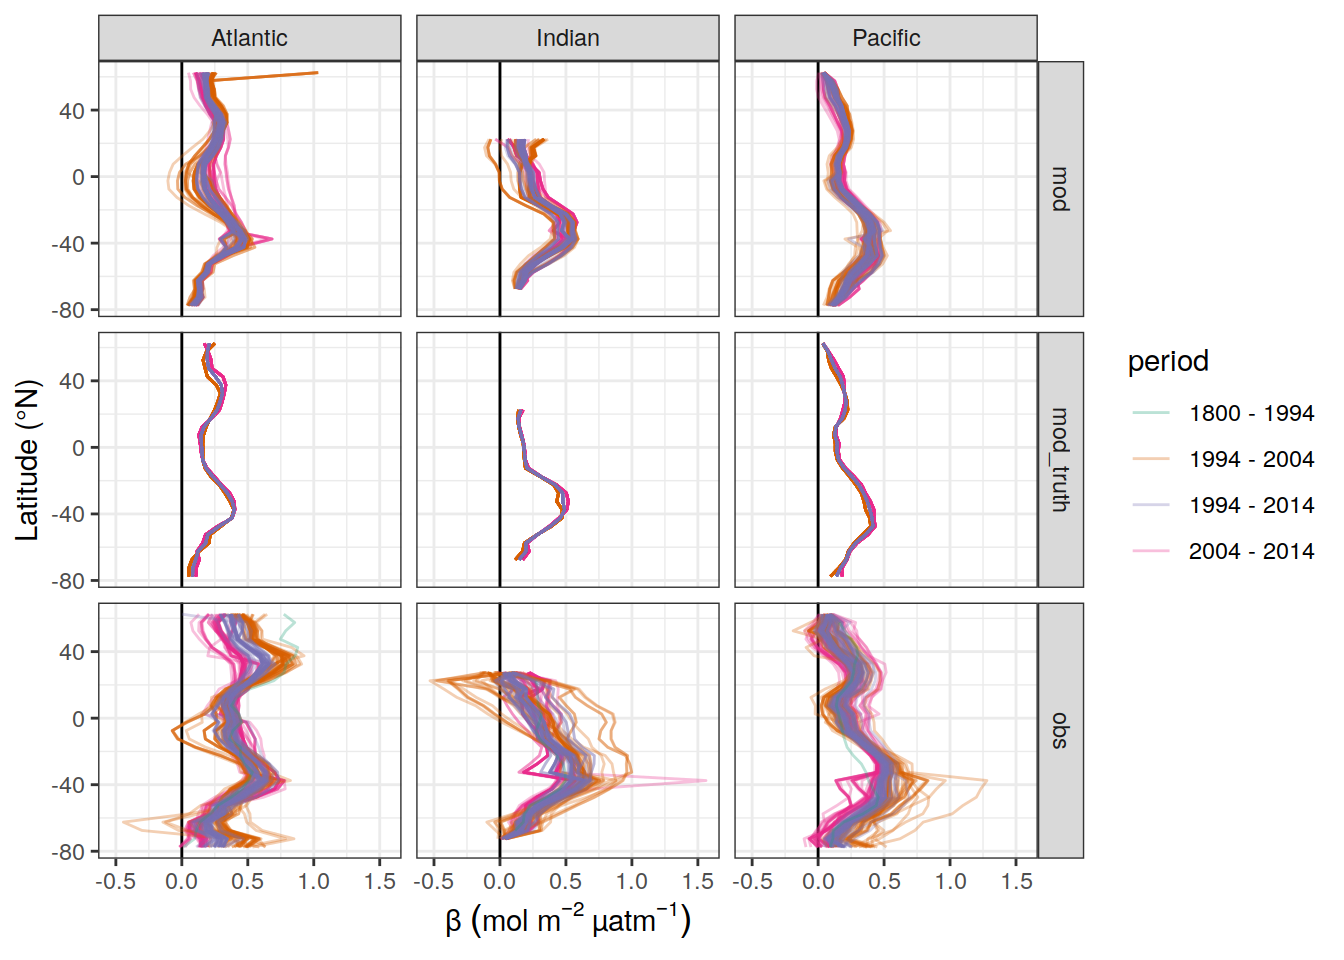
| Version | Author | Date |
|---|---|---|
| 5b77c4f | jens-daniel-mueller | 2022-08-10 |
| fea41c1 | jens-daniel-mueller | 2022-07-20 |
| d2ae54c | jens-daniel-mueller | 2022-07-18 |
| 2695085 | jens-daniel-mueller | 2022-07-17 |
| 535196a | jens-daniel-mueller | 2022-07-17 |
| 0160c40 | jens-daniel-mueller | 2022-07-16 |
| afb27ad | jens-daniel-mueller | 2022-07-15 |
| b492b46 | jens-daniel-mueller | 2022-07-15 |
| bd24a0f | jens-daniel-mueller | 2022-07-15 |
| ea46812 | jens-daniel-mueller | 2022-07-13 |
8 Zonal sections
8.1 dcant - absolut
p_dcant_zonal_absolute <-
  dcant_zonal_all %>%
  filter(
    data_source == "obs",
    period %in% two_decades,
    depth <= params_global$inventory_depth_standard
  ) %>%
  p_section_zonal_continous_depth(var = "dcant",
                                  plot_slabs = "n",
                                  title_text = NULL) +
  geom_contour(aes(lat, depth, z = dcant),
               breaks = 5,
               col = "white") +
  # geom_text_contour(
  #   aes(lat, depth, z = dcant),
  #   breaks = 5,
  #   stroke = 0.2,
  #   stroke.colour = "white",
  #   rotate = FALSE,
  #   label.placer = label_placer_n(n = 1)
  # ) +
  facet_grid(period ~ basin_AIP) +
  theme(
    axis.text.x = element_blank(),
    axis.title.x = element_blank(),
    legend.position = "top"
  ) +
  guides(fill = guide_colorsteps(
    barheight = unit(0.5, "cm"),
    barwidth = unit(7, "cm"),
    show.limits = FALSE
  ))

p_dcant_zonal_absolute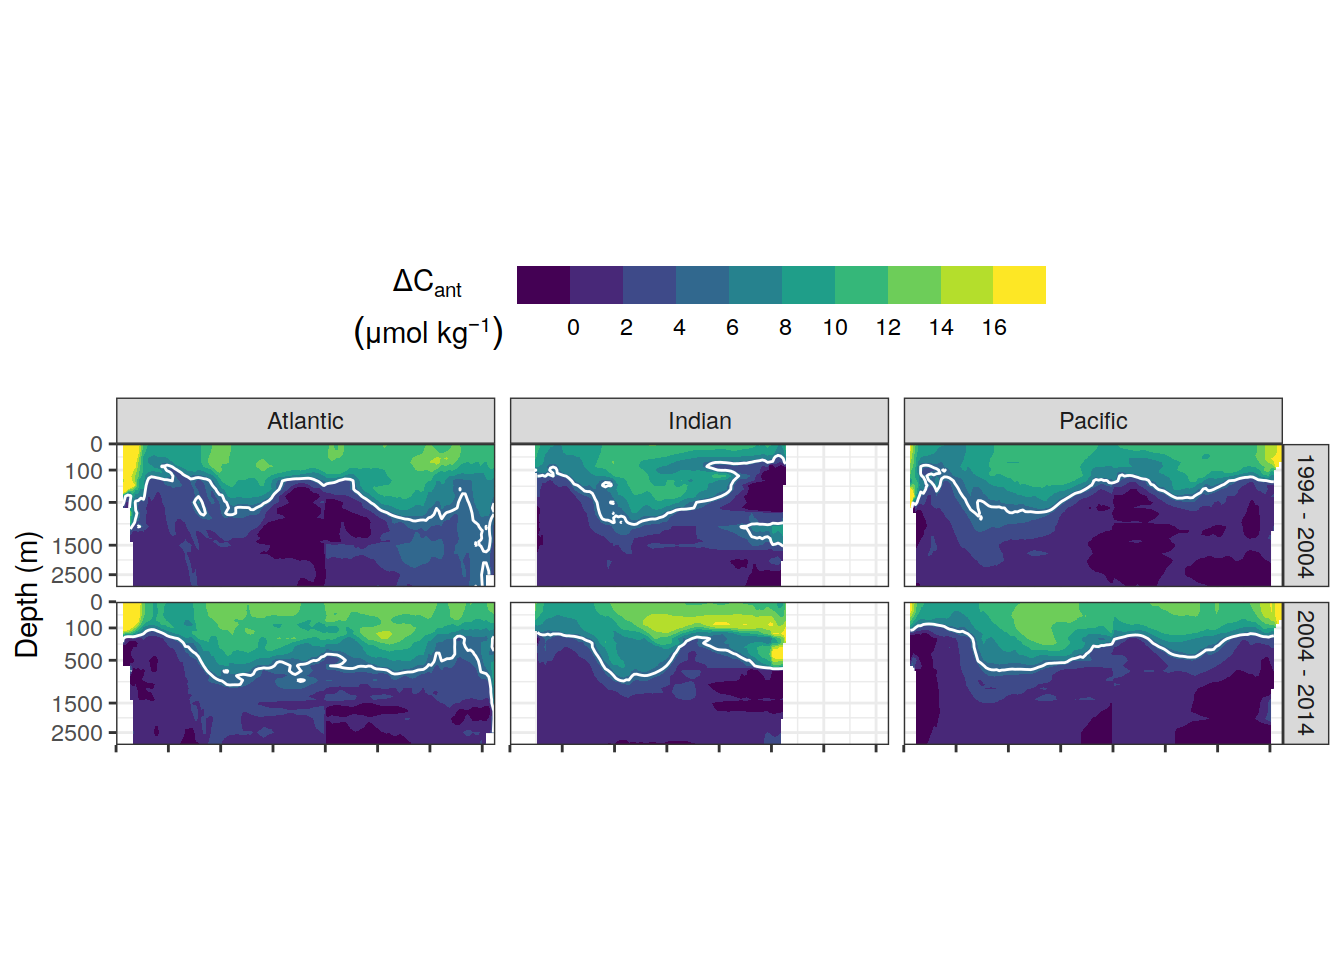
| Version | Author | Date |
|---|---|---|
| f68fcfa | jens-daniel-mueller | 2022-07-26 |
| f2615fb | jens-daniel-mueller | 2022-07-26 |
| e2adac6 | jens-daniel-mueller | 2022-07-22 |
| fea41c1 | jens-daniel-mueller | 2022-07-20 |
| d2ae54c | jens-daniel-mueller | 2022-07-18 |
| ea46812 | jens-daniel-mueller | 2022-07-13 |
| 16dc3af | jens-daniel-mueller | 2022-06-27 |
| 87e9eb8 | jens-daniel-mueller | 2022-06-27 |
| b52b159 | jens-daniel-mueller | 2022-06-27 |
| 09b0780 | jens-daniel-mueller | 2022-05-24 |
| 1d73ec9 | jens-daniel-mueller | 2022-05-16 |
| 2ca0109 | jens-daniel-mueller | 2022-05-02 |
| b018a9a | jens-daniel-mueller | 2022-04-29 |
| e09320d | jens-daniel-mueller | 2022-04-12 |
| acad2e2 | jens-daniel-mueller | 2022-04-09 |
| 3d81135 | jens-daniel-mueller | 2022-04-07 |
| a74e341 | jens-daniel-mueller | 2022-04-04 |
| bd9e11d | jens-daniel-mueller | 2022-03-22 |
| 2501978 | jens-daniel-mueller | 2022-03-21 |
| 094bfa0 | jens-daniel-mueller | 2022-02-18 |
| d2191ad | jens-daniel-mueller | 2022-02-04 |
| 5f2aed0 | jens-daniel-mueller | 2022-01-27 |
| 9753eb8 | jens-daniel-mueller | 2022-01-26 |
| b1d7720 | jens-daniel-mueller | 2022-01-21 |
| e572075 | jens-daniel-mueller | 2022-01-21 |
dcant_zonal_all %>%
  filter(
    data_source == "obs",
    period != "1994 - 2014",
    depth <= params_global$inventory_depth_standard
  ) %>%
  group_split(basin_AIP) %>%
  # head(1) %>%
  map(
    ~ p_section_zonal_continous_depth(
      df = .x,
      var = "dcant",
      breaks = c(-Inf, -1, 0, 1, seq(2,16,2), Inf),
      plot_slabs = "n",
      title_text = .x$basin_AIP,
      subtitle_text = NULL
    ) +
      facet_grid(period ~ .)
  )
8.2 dcant - absolute delta
dcant_zonal_all %>%
  filter(data_source %in% c("mod", "obs"),
         period != "1994 - 2014") %>%
  select(data_source, lat, depth, basin_AIP, period, dcant) %>%
  pivot_wider(names_from = period,
              values_from = dcant) %>%
  mutate(delta_dcant = `2004 - 2014` - `1994 - 2004`) %>%
  group_by(data_source) %>%
  group_split() %>%
  # head(1) %>%
  map(
    ~ p_section_zonal_continous_depth(
      df = .x,
      var = "delta_dcant",
      plot_slabs = "n",
      subtitle_text = unique(.x$data_source),
      col = "bias"
    ) +
      facet_grid(basin_AIP ~ .)
  )
[[1]]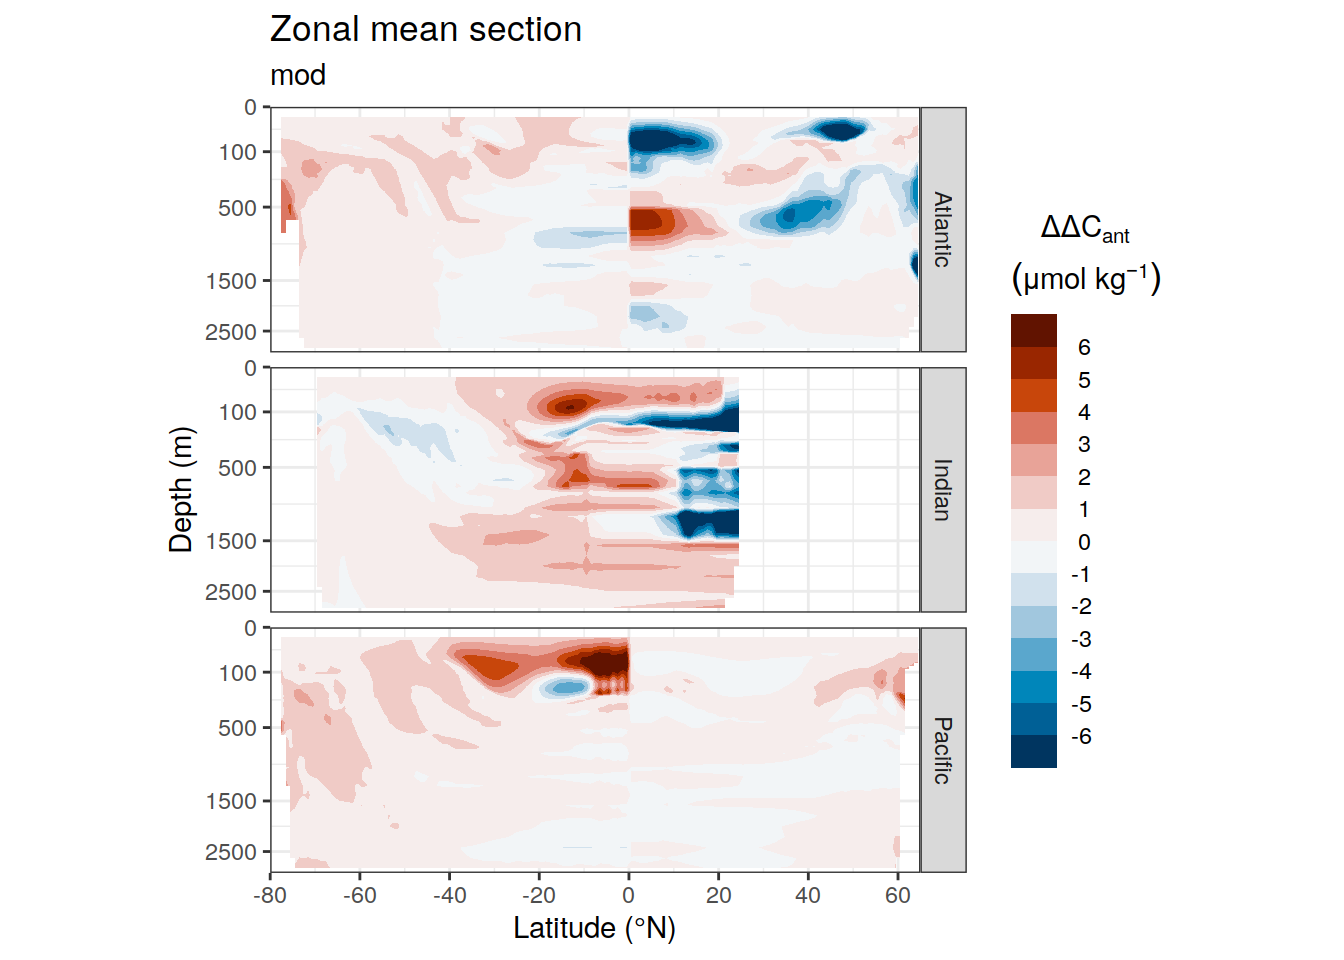
| Version | Author | Date |
|---|---|---|
| e2adac6 | jens-daniel-mueller | 2022-07-22 |
| fea41c1 | jens-daniel-mueller | 2022-07-20 |
| d2ae54c | jens-daniel-mueller | 2022-07-18 |
| ea46812 | jens-daniel-mueller | 2022-07-13 |
| f09080e | jens-daniel-mueller | 2022-06-28 |
| 16dc3af | jens-daniel-mueller | 2022-06-27 |
| 87e9eb8 | jens-daniel-mueller | 2022-06-27 |
| b52b159 | jens-daniel-mueller | 2022-06-27 |
| 1d73ec9 | jens-daniel-mueller | 2022-05-16 |
| 2ca0109 | jens-daniel-mueller | 2022-05-02 |
| b018a9a | jens-daniel-mueller | 2022-04-29 |
| e09320d | jens-daniel-mueller | 2022-04-12 |
| acad2e2 | jens-daniel-mueller | 2022-04-09 |
| 3d81135 | jens-daniel-mueller | 2022-04-07 |
| a74e341 | jens-daniel-mueller | 2022-04-04 |
| bd9e11d | jens-daniel-mueller | 2022-03-22 |
| 2501978 | jens-daniel-mueller | 2022-03-21 |
| 094bfa0 | jens-daniel-mueller | 2022-02-18 |
| d2191ad | jens-daniel-mueller | 2022-02-04 |
| 5f2aed0 | jens-daniel-mueller | 2022-01-27 |
| 9753eb8 | jens-daniel-mueller | 2022-01-26 |
| b1d7720 | jens-daniel-mueller | 2022-01-21 |
| d6b399a | jens-daniel-mueller | 2022-01-21 |
[[2]]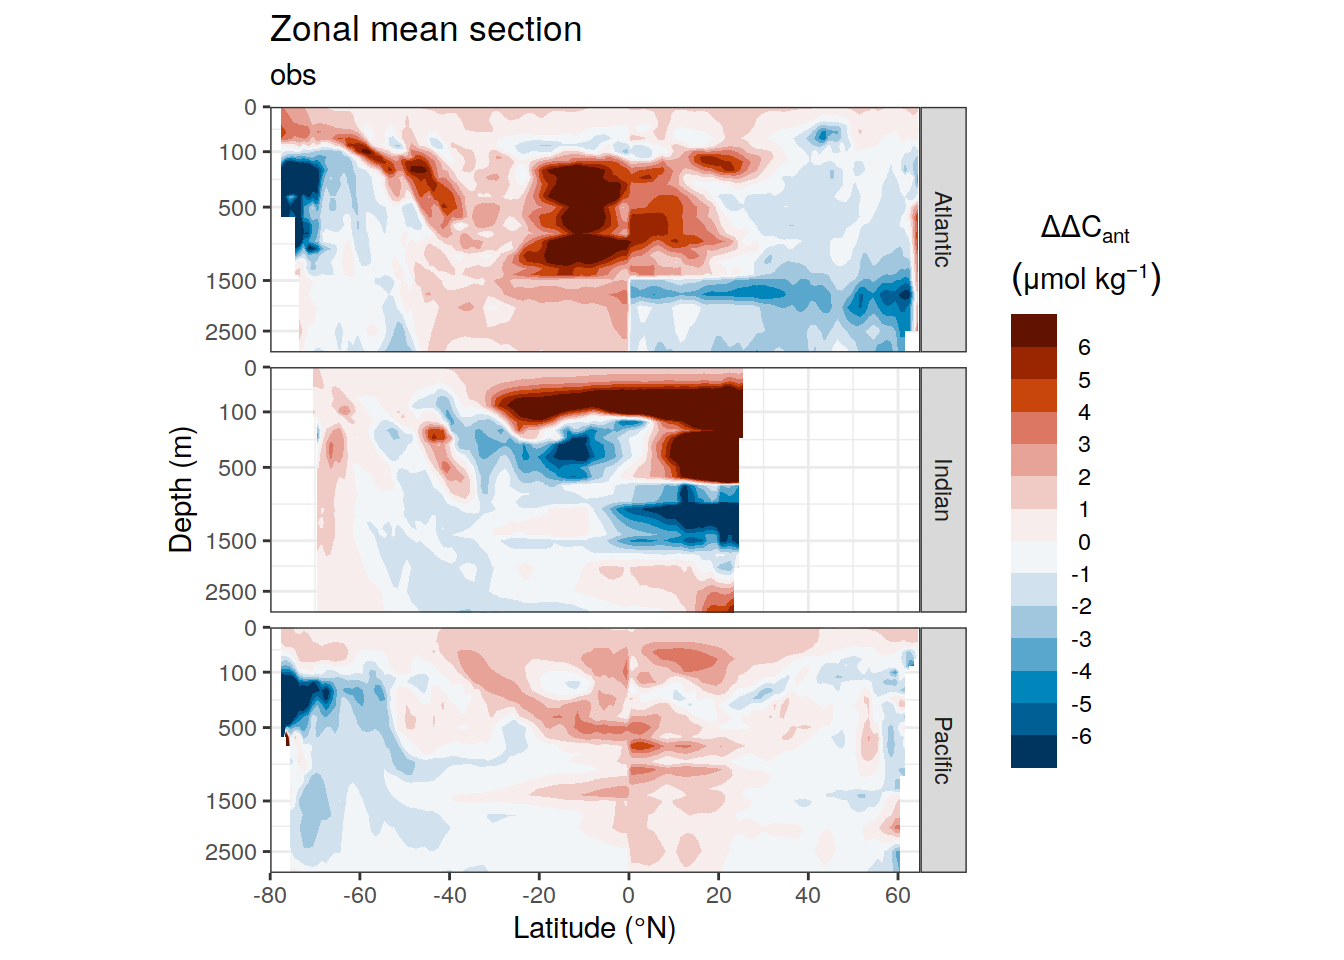
| Version | Author | Date |
|---|---|---|
| e2adac6 | jens-daniel-mueller | 2022-07-22 |
| fea41c1 | jens-daniel-mueller | 2022-07-20 |
| d2ae54c | jens-daniel-mueller | 2022-07-18 |
| ea46812 | jens-daniel-mueller | 2022-07-13 |
| f09080e | jens-daniel-mueller | 2022-06-28 |
| 16dc3af | jens-daniel-mueller | 2022-06-27 |
| 87e9eb8 | jens-daniel-mueller | 2022-06-27 |
| b52b159 | jens-daniel-mueller | 2022-06-27 |
| 1d73ec9 | jens-daniel-mueller | 2022-05-16 |
| 2ca0109 | jens-daniel-mueller | 2022-05-02 |
| b018a9a | jens-daniel-mueller | 2022-04-29 |
| e09320d | jens-daniel-mueller | 2022-04-12 |
| acad2e2 | jens-daniel-mueller | 2022-04-09 |
| 3d81135 | jens-daniel-mueller | 2022-04-07 |
| a74e341 | jens-daniel-mueller | 2022-04-04 |
| bd9e11d | jens-daniel-mueller | 2022-03-22 |
| 2501978 | jens-daniel-mueller | 2022-03-21 |
| 094bfa0 | jens-daniel-mueller | 2022-02-18 |
| d2191ad | jens-daniel-mueller | 2022-02-04 |
| 5f2aed0 | jens-daniel-mueller | 2022-01-27 |
| 9753eb8 | jens-daniel-mueller | 2022-01-26 |
| b1d7720 | jens-daniel-mueller | 2022-01-21 |
| d6b399a | jens-daniel-mueller | 2022-01-21 |
p_dcant_zonal_delta <-
  dcant_zonal_all %>%
  filter(data_source %in% c("obs"),
         period != "1994 - 2014") %>%
  select(data_source, lat, depth, basin_AIP, period, gamma_mean, dcant) %>%
  pivot_wider(names_from = period,
              values_from = dcant) %>%
  mutate(delta_dcant = `2004 - 2014` - `1994 - 2004`) %>%
  group_by(data_source) %>%
  group_split() %>%
  # head(1) %>%
  map(
    ~ p_section_zonal_continous_depth(
      df = .x,
      var = "delta_dcant",
      plot_slabs = "y",
      drop_slabs = 1,
      subtitle_text = NULL,
      title_text = NULL,
      col = "bias"
    ) +
      facet_grid("Dec. diff." ~ basin_AIP) +
      theme(
        strip.text.x = element_blank(),
        strip.background.x = element_blank(),
        legend.position = "bottom"
      ) +
      guides(fill = guide_colorsteps(
        barheight = unit(0.5, "cm"),
        barwidth = unit(10, "cm"),
        show.limits = FALSE
      ))
  )

p_dcant_zonal_absolute / p_dcant_zonal_delta +
  plot_layout(heights = c(2,1)) +
  plot_annotation(tag_levels = 'A')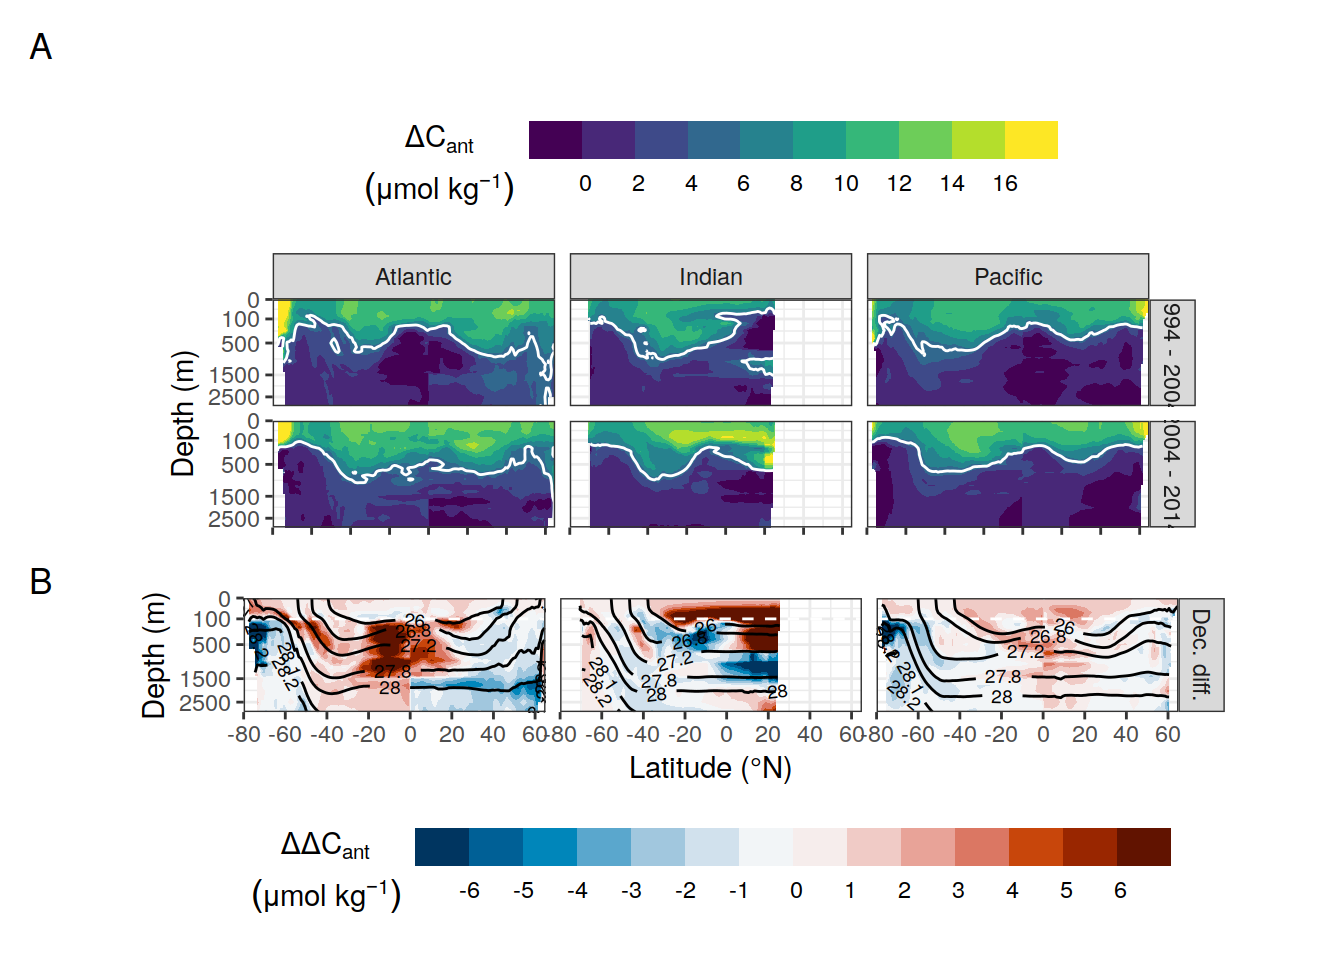
| Version | Author | Date |
|---|---|---|
| f68fcfa | jens-daniel-mueller | 2022-07-26 |
| f2615fb | jens-daniel-mueller | 2022-07-26 |
| e2adac6 | jens-daniel-mueller | 2022-07-22 |
| fea41c1 | jens-daniel-mueller | 2022-07-20 |
| d2ae54c | jens-daniel-mueller | 2022-07-18 |
| d20faeb | jens-daniel-mueller | 2022-07-17 |
| 0160c40 | jens-daniel-mueller | 2022-07-16 |
| f1d7f80 | jens-daniel-mueller | 2022-07-13 |
| ea46812 | jens-daniel-mueller | 2022-07-13 |
| f09080e | jens-daniel-mueller | 2022-06-28 |
ggsave(path = here::here("output/publication"),
       filename = "Fig_dcant_zonal_mean_section.png",
       height = 6,
       width = 8)

rm(p_dcant_zonal_absolute, p_dcant_zonal_delta)
8.3 Bias
p_dcant_zonal_absolute_mod <-
  dcant_zonal_all %>%
  filter(
    data_source != "obs",
    period %in% two_decades,
    depth <= params_global$inventory_depth_standard
  ) %>%
    mutate(data_source = case_when(
    data_source == "mod" ~ "Reconstruction",
    data_source == "mod_truth" ~ "Model truth"
  )) %>%
  p_section_zonal_continous_depth(var = "dcant",
                                  plot_slabs = "n",
                                  title_text = NULL) +
  geom_contour(aes(lat, depth, z = dcant),
               breaks = 5,
               col = "white") +
  facet_nested(data_source+period ~ basin_AIP) +
  theme(
    axis.text.x = element_blank(),
    axis.title.x = element_blank(),
    legend.position = "top"
  ) +
  guides(fill = guide_colorsteps(
    barheight = unit(0.5, "cm"),
    barwidth = unit(7, "cm"),
    show.limits = FALSE
  ))

p_dcant_zonal_absolute_mod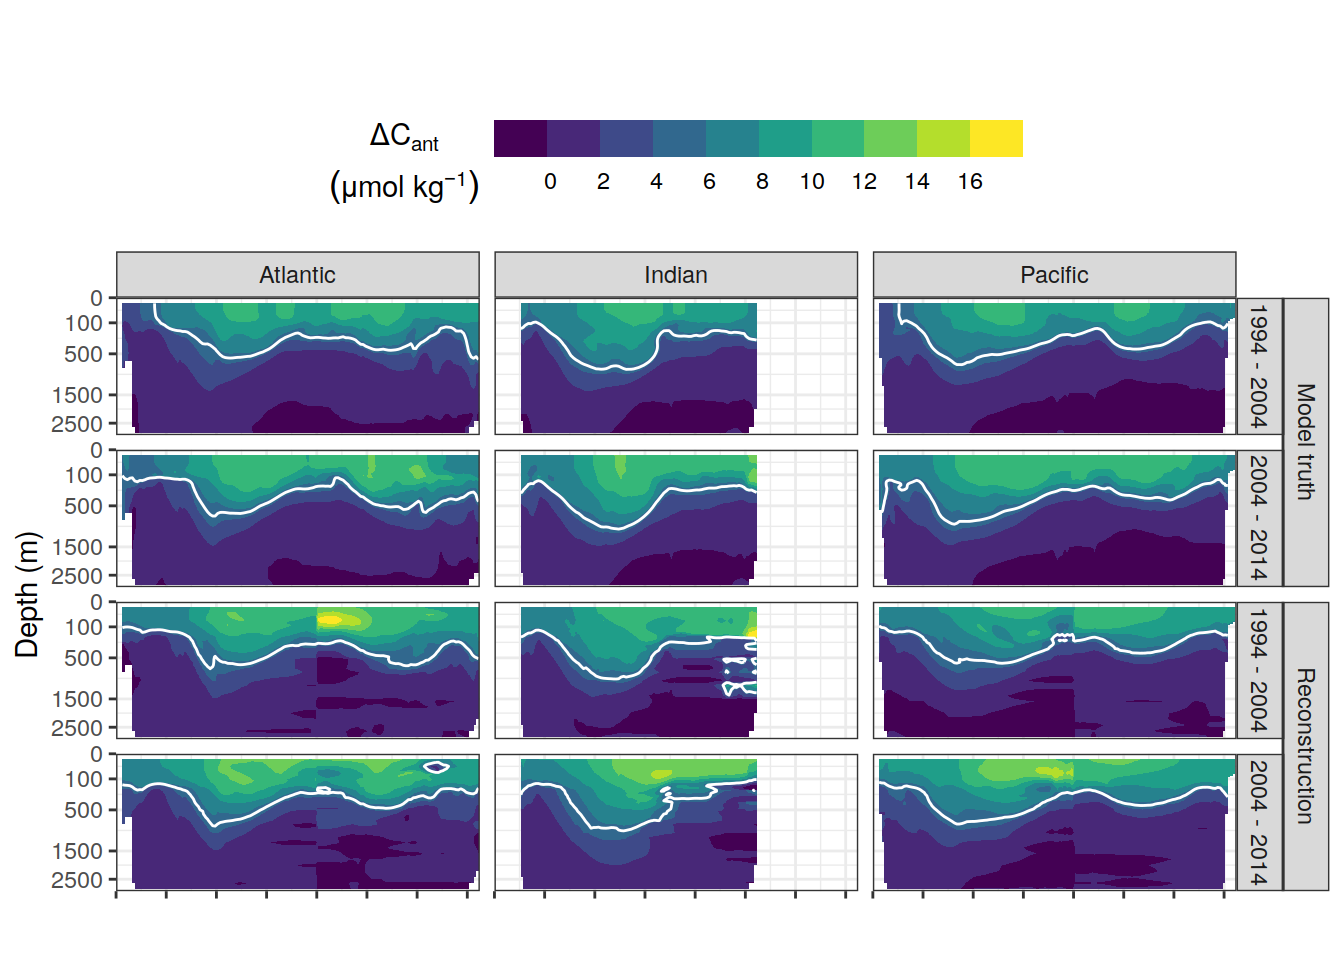
| Version | Author | Date |
|---|---|---|
| 5b77c4f | jens-daniel-mueller | 2022-08-10 |
p_dcant_zonal_bias <-
  dcant_zonal_all %>%
  filter(data_source != "obs",
         period %in% two_decades) %>%
  select(data_source, lat, depth, basin_AIP, period, dcant) %>%
  pivot_wider(names_from = data_source,
              values_from = dcant) %>%
  mutate(delta_dcant = mod - mod_truth) %>%
  p_section_zonal_continous_depth(
    var = "delta_dcant",
    plot_slabs = "n",
    drop_slabs = 1,
    subtitle_text = NULL,
    title_text = NULL,
    col = "bias"
  ) +
  facet_grid(period ~ basin_AIP) +
  theme(
    strip.text.x = element_blank(),
    strip.background.x = element_blank(),
    legend.position = "bottom"
  ) +
  guides(fill = guide_colorsteps(
    barheight = unit(0.5, "cm"),
    barwidth = unit(10, "cm"),
    show.limits = FALSE
  ))

p_dcant_zonal_absolute_mod / p_dcant_zonal_bias +
  plot_layout(heights = c(2,1)) +
  plot_annotation(tag_levels = 'A')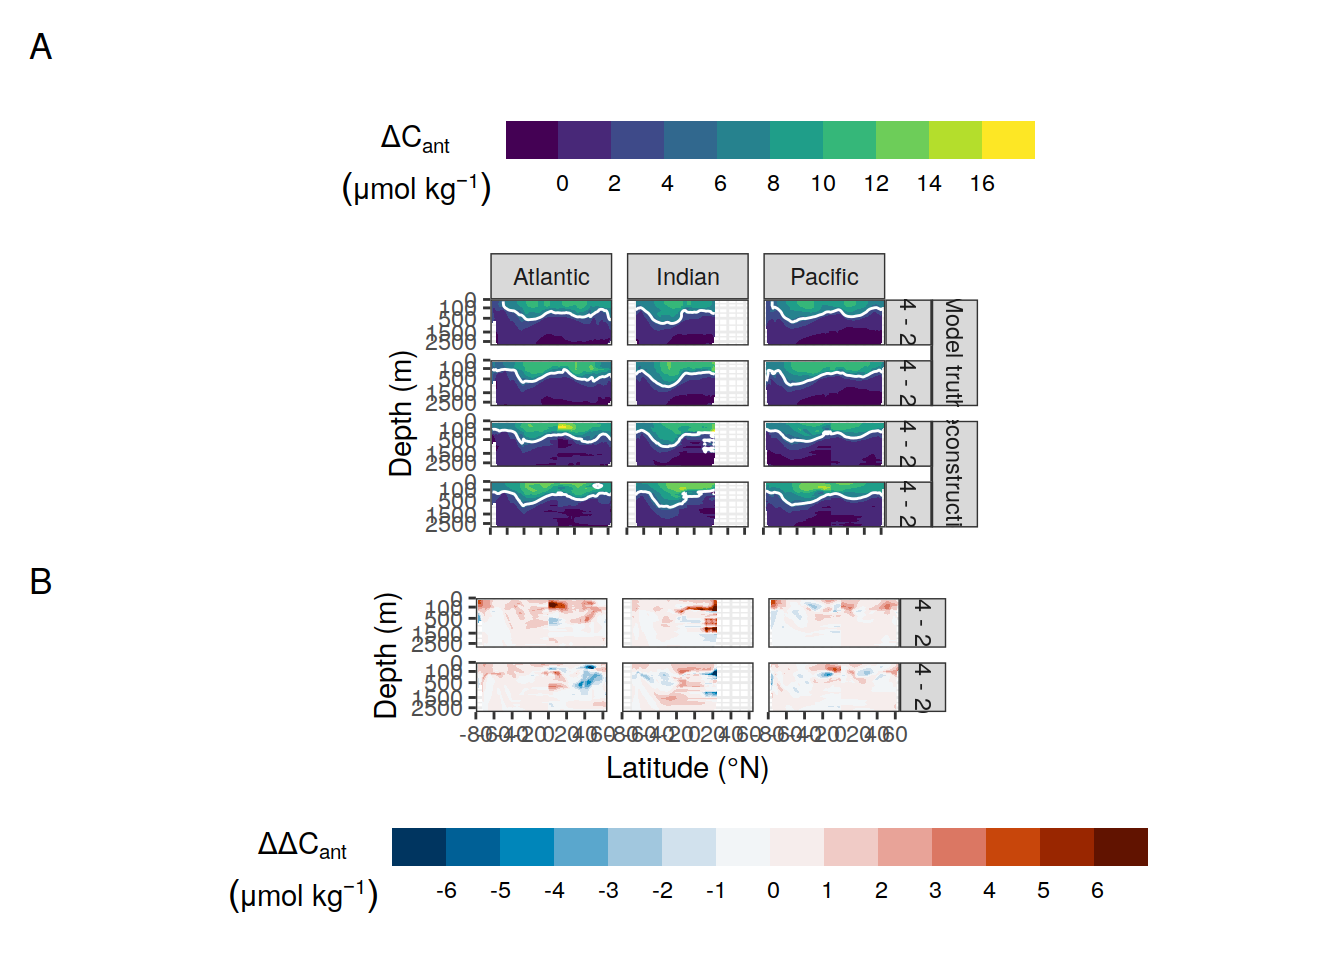
| Version | Author | Date |
|---|---|---|
| 5b77c4f | jens-daniel-mueller | 2022-08-10 |
ggsave(
  path = here::here("output/publication"),
  filename = "FigS_dcant_zonal_mean_section_synthetic_data.png",
  height = 9,
  width = 8
)

rm(p_dcant_zonal_absolute_mod,
   p_dcant_zonal_bias)
9 Concentration profiles
9.1 dcant, abs
9.1.1 Global
dcant_profile_global_all %>%
  arrange(depth) %>%
  filter(period != "1994 - 2014",
         depth <= params_global$inventory_depth_standard) %>%
  group_split(data_source) %>%
  # head(1) %>%
  map(
    ~ ggplot(data = .x,
             aes(dcant,
                 depth)) +
      geom_hline(yintercept = params_global$inventory_depth_standard) +
      geom_vline(xintercept = 0) +
      geom_ribbon(
        aes(
          xmin = dcant - dcant_sd,
          xmax = dcant + dcant_sd,
          fill = period
        ),
        alpha = 0.3
      ) +
      geom_path(aes(col = period)) +
      scale_y_continuous(trans = trans_reverser("sqrt"),
                         breaks = c(0, 100, 500, seq(1500, 5000, 1000))) +
      # scale_y_reverse(breaks = c(0, 100, 500, seq(1500, 5000, 1000))) +
      coord_cartesian(expand = 0) +
      scale_color_brewer(
        palette = "Set1",
        name = "mean \u00B1 sd",
        direction = -1
      ) +
      scale_fill_brewer(
        palette = "Set1",
        name = "mean \u00B1 sd",
        direction = -1
      ) +
      labs(
        title = paste("data_source", unique(.x$data_source)),
        y = "Depth (m)",
        x = dcant_umol_label
      ) +
      facet_wrap( ~ basin, ncol = 3, dir = "v") +
      theme(legend.position = c(0.8, 0.2))
  )
[[1]]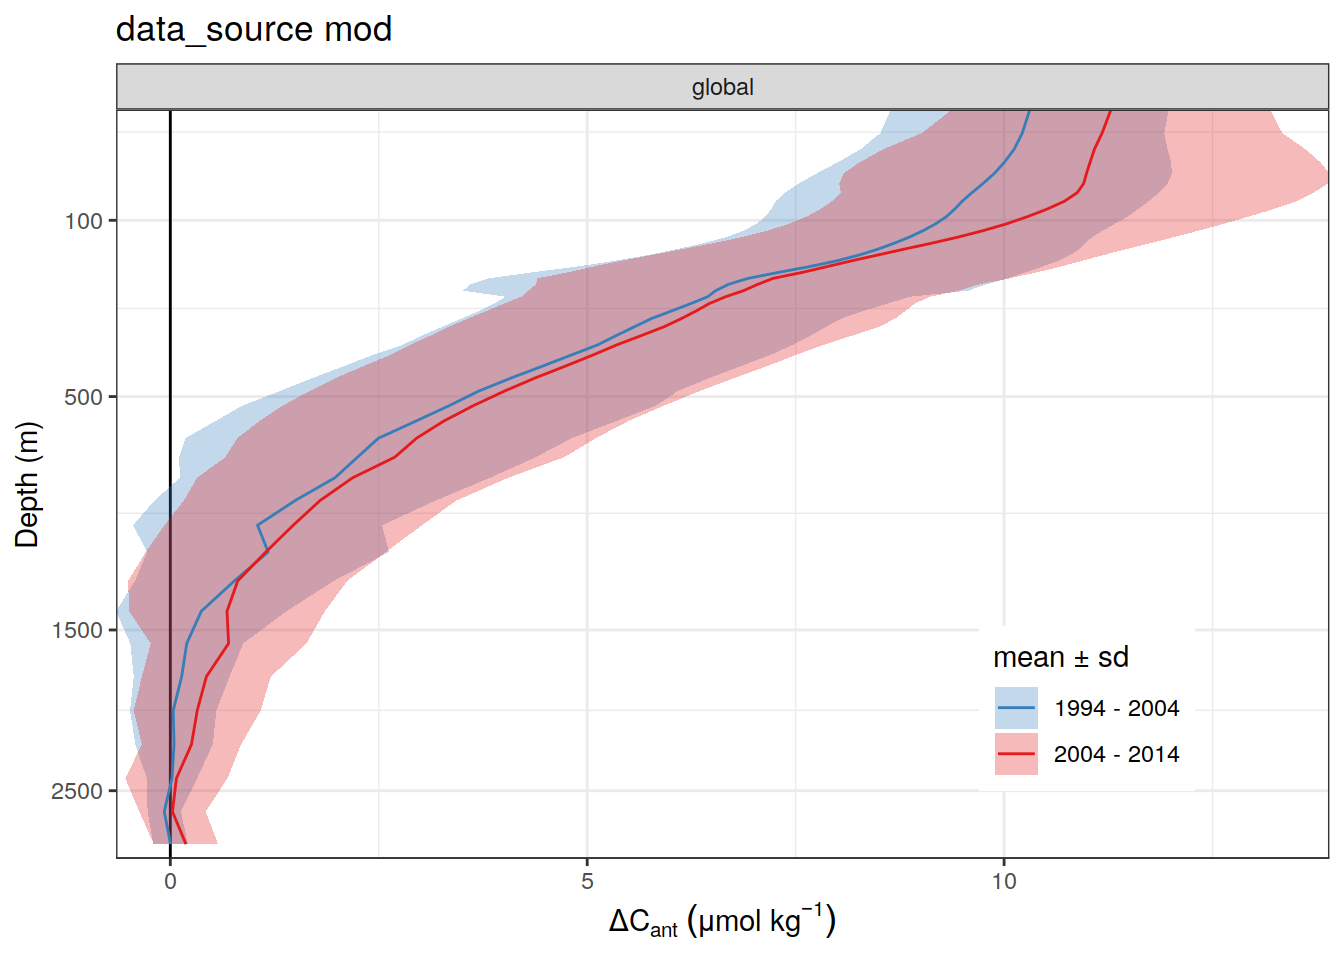
[[2]]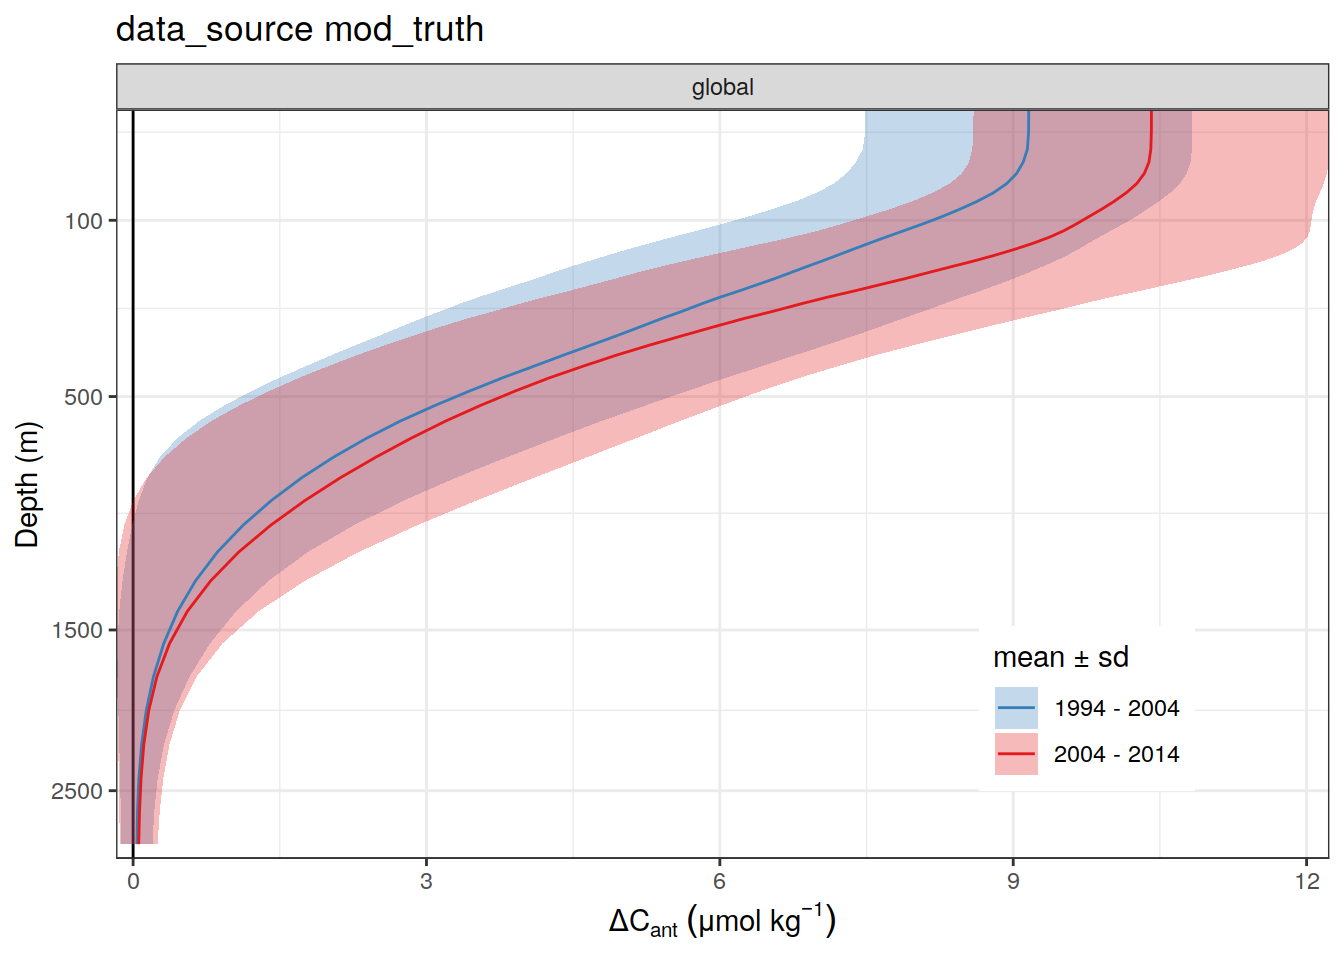
[[3]]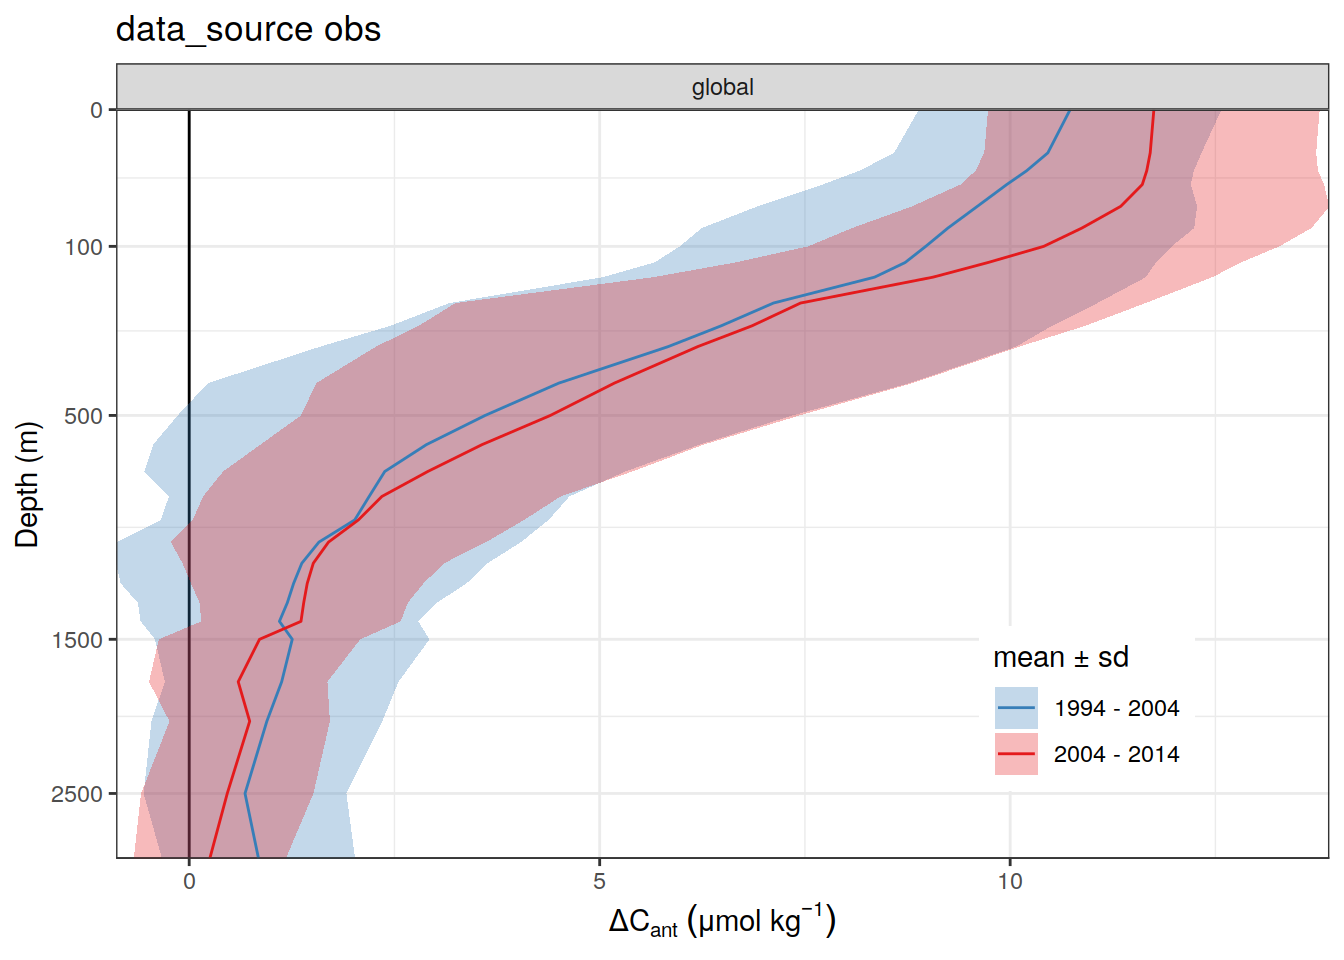
| Version | Author | Date |
|---|---|---|
| 318fefe | jens-daniel-mueller | 2022-08-11 |
mean_surface_dcant <- dcant_profile_global_all %>%
  arrange(depth) %>%
  filter(period != "1994 - 2014",
         data_source == "obs") %>%
  filter(depth <= 50) %>%
  group_by(period) %>%
  summarise(mean_surface_dcant = mean(dcant)) %>%
  ungroup()

full_join(dcant_profile_global_all_ensemble,
          mean_surface_dcant) %>%
  arrange(depth) %>%
  filter(period != "1994 - 2014",
         data_source == "obs") %>%
  filter(dcant >= mean_surface_dcant / 2) %>%
  group_by(period, Version_ID) %>%
  summarise(max_depth = max(depth)) %>%
  ungroup() %>%
  summarise(sd_max_depth = sd(max_depth)*2,
            mean_max_depth = mean(max_depth))
# A tibble: 1 × 2
sd_max_depth mean_max_depth
<dbl> <dbl>
1 102. 321.9.1.2 Basin hemisphere
dcant_profile_basin_MLR_all %>%
  arrange(depth) %>%
  filter(period != "1994 - 2014",
         depth <= params_global$inventory_depth_standard) %>%
  group_split(data_source) %>%
  # head(1) %>%
  map(
    ~ ggplot(data = .x,
             aes(dcant,
                 depth)) +
      geom_hline(yintercept = params_global$inventory_depth_standard) +
      geom_vline(xintercept = 0) +
      geom_ribbon(
        aes(
          xmin = dcant - dcant_sd,
          xmax = dcant + dcant_sd,
          fill = period
        ),
        alpha = 0.3
      ) +
      geom_path(aes(col = period)) +
      scale_y_continuous(trans = trans_reverser("sqrt"),
                         breaks = c(0, 100, 500, seq(1500, 5000, 1000))) +
      coord_cartesian(expand = 0) +
      scale_color_brewer(
        palette = "Set1",
        name = "mean \u00B1 sd",
        direction = -1
      ) +
      scale_fill_brewer(
        palette = "Set1",
        name = "mean \u00B1 sd",
        direction = -1
      ) +
      labs(
        title = paste("data_source", unique(.x$data_source)),
        y = "Depth (m)",
        x = dcant_umol_label
      ) +
      facet_wrap( ~ basin, ncol = 3, dir = "v") +
      theme(legend.position = c(0.8, 0.2))
  )
[[1]]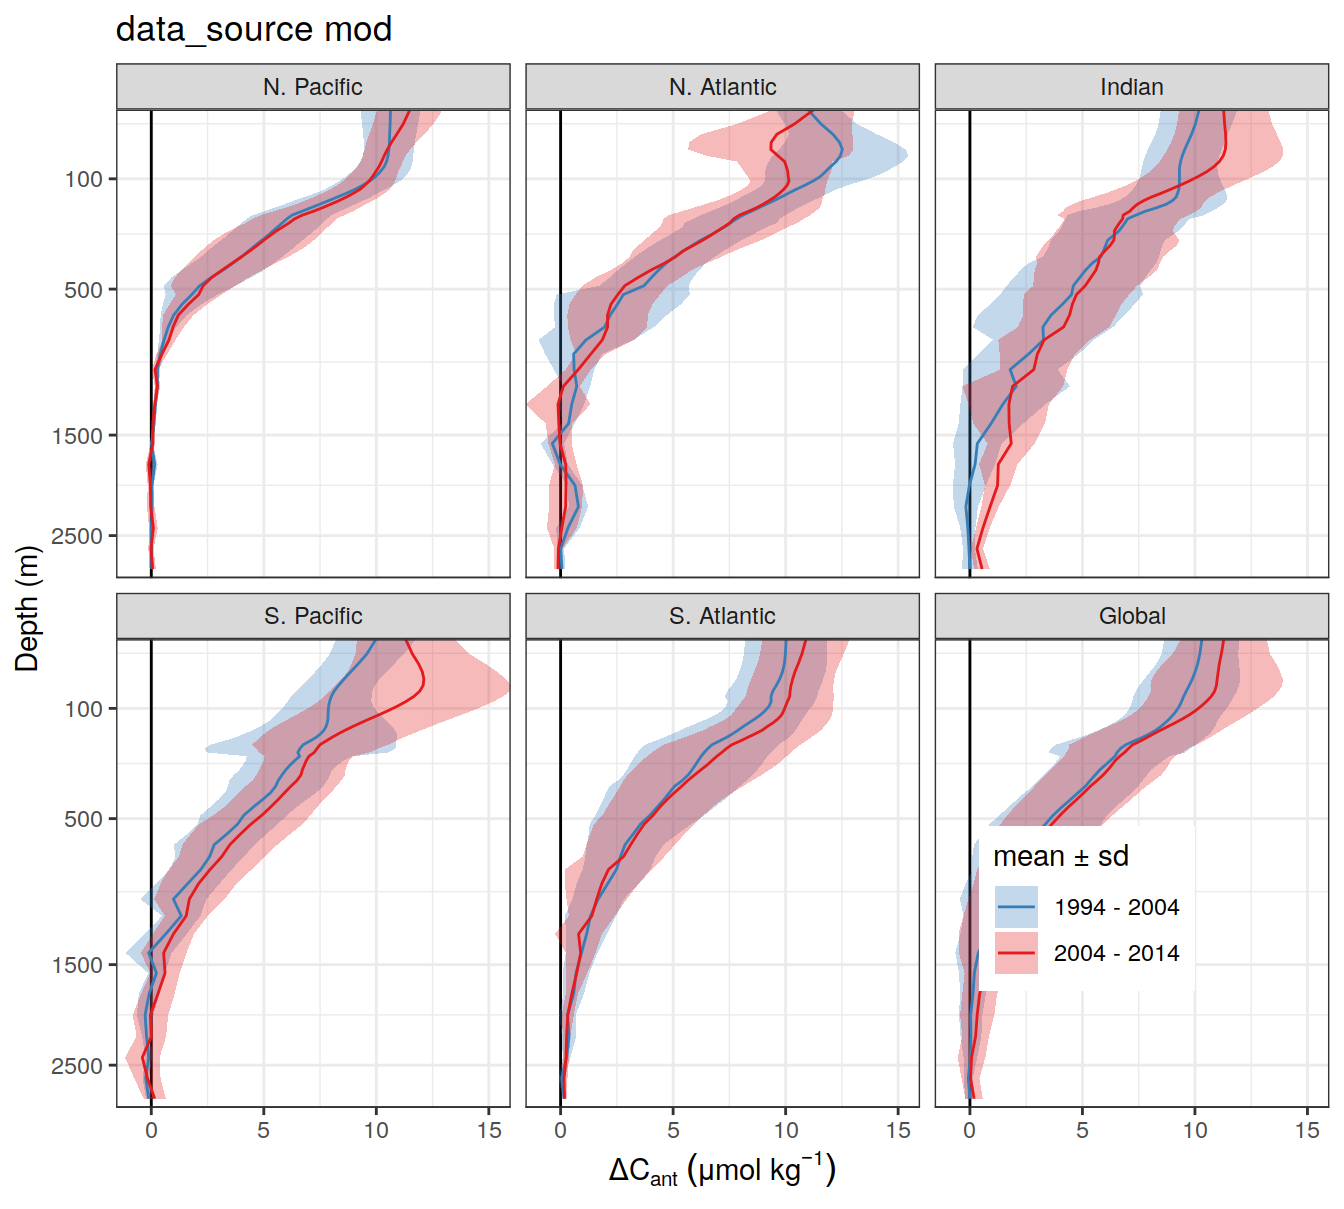
| Version | Author | Date |
|---|---|---|
| fea41c1 | jens-daniel-mueller | 2022-07-20 |
| d2ae54c | jens-daniel-mueller | 2022-07-18 |
| 2695085 | jens-daniel-mueller | 2022-07-17 |
| 87e9eb8 | jens-daniel-mueller | 2022-06-27 |
| b52b159 | jens-daniel-mueller | 2022-06-27 |
| 1d73ec9 | jens-daniel-mueller | 2022-05-16 |
| 2ca0109 | jens-daniel-mueller | 2022-05-02 |
| b018a9a | jens-daniel-mueller | 2022-04-29 |
| e09320d | jens-daniel-mueller | 2022-04-12 |
| acad2e2 | jens-daniel-mueller | 2022-04-09 |
| 3d81135 | jens-daniel-mueller | 2022-04-07 |
| a74e341 | jens-daniel-mueller | 2022-04-04 |
| bd9e11d | jens-daniel-mueller | 2022-03-22 |
| 2501978 | jens-daniel-mueller | 2022-03-21 |
| d2191ad | jens-daniel-mueller | 2022-02-04 |
| 4673df5 | jens-daniel-mueller | 2022-02-02 |
| 60727e6 | jens-daniel-mueller | 2022-02-02 |
| 913e42f | jens-daniel-mueller | 2022-02-01 |
| 189de95 | jens-daniel-mueller | 2022-02-01 |
| b62308d | jens-daniel-mueller | 2022-01-31 |
| 5f2aed0 | jens-daniel-mueller | 2022-01-27 |
| c6fe495 | jens-daniel-mueller | 2022-01-26 |
| 9753eb8 | jens-daniel-mueller | 2022-01-26 |
| b1d7720 | jens-daniel-mueller | 2022-01-21 |
[[2]]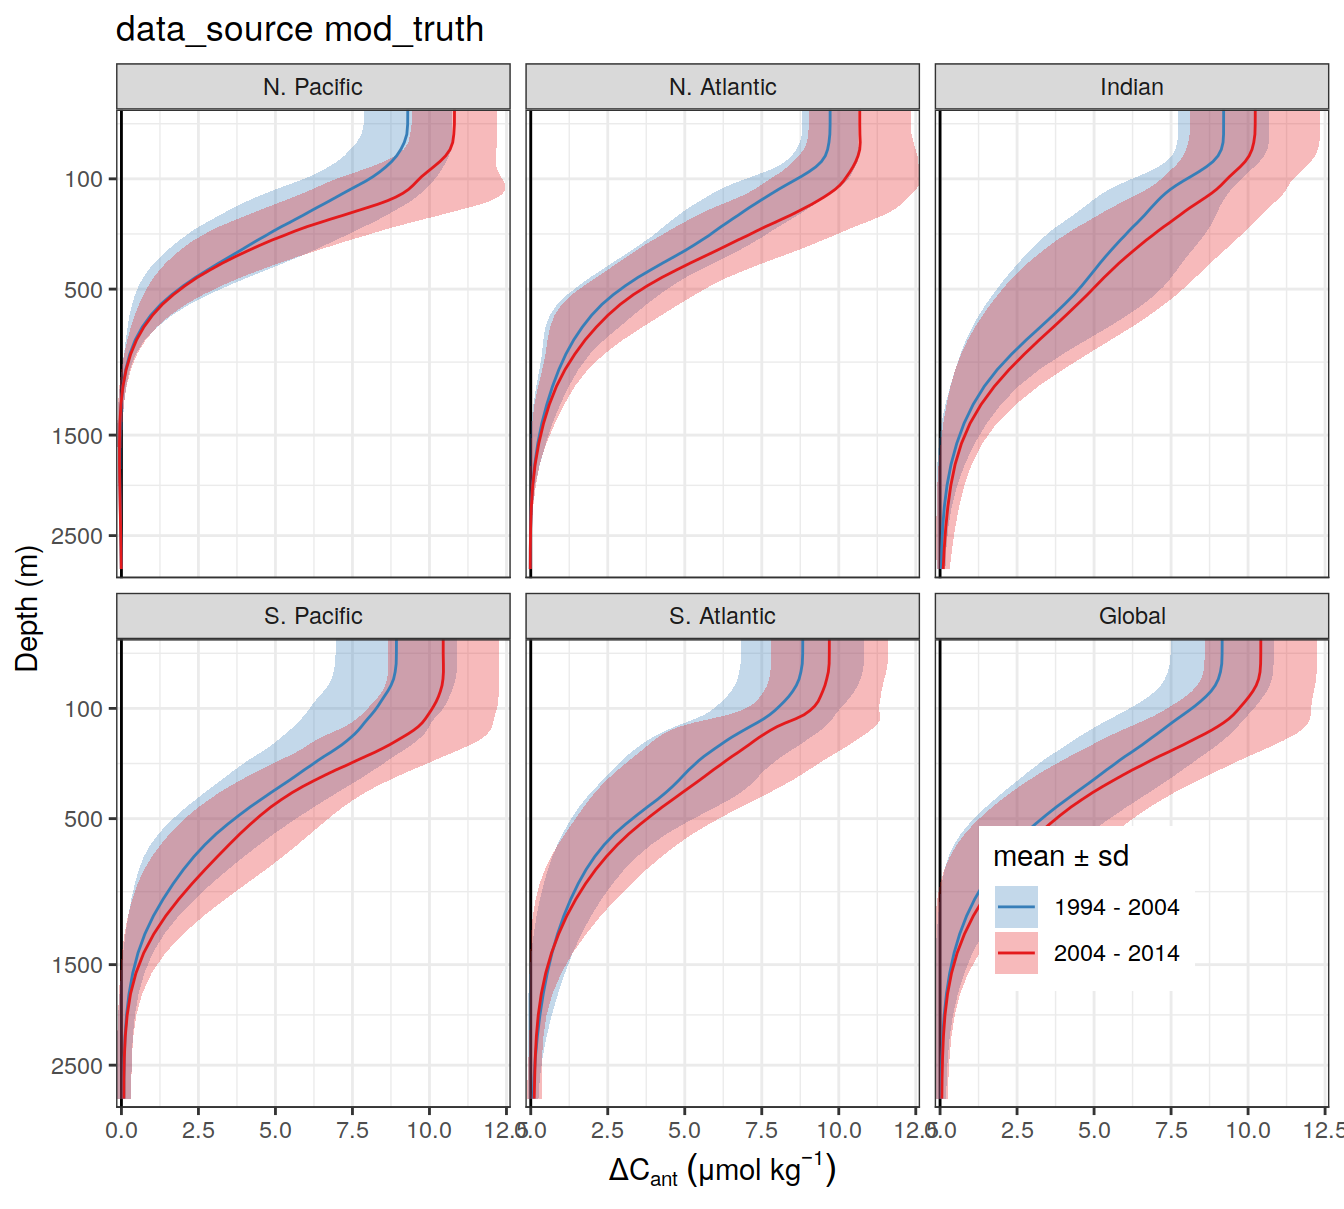
| Version | Author | Date |
|---|---|---|
| 318fefe | jens-daniel-mueller | 2022-08-11 |
| fea41c1 | jens-daniel-mueller | 2022-07-20 |
| d2ae54c | jens-daniel-mueller | 2022-07-18 |
| 2695085 | jens-daniel-mueller | 2022-07-17 |
| 748aa43 | jens-daniel-mueller | 2022-06-27 |
| 16dc3af | jens-daniel-mueller | 2022-06-27 |
| 87e9eb8 | jens-daniel-mueller | 2022-06-27 |
| b52b159 | jens-daniel-mueller | 2022-06-27 |
| 1d73ec9 | jens-daniel-mueller | 2022-05-16 |
| 2ca0109 | jens-daniel-mueller | 2022-05-02 |
| b018a9a | jens-daniel-mueller | 2022-04-29 |
| e09320d | jens-daniel-mueller | 2022-04-12 |
| acad2e2 | jens-daniel-mueller | 2022-04-09 |
| 3d81135 | jens-daniel-mueller | 2022-04-07 |
| a74e341 | jens-daniel-mueller | 2022-04-04 |
| bd9e11d | jens-daniel-mueller | 2022-03-22 |
| 2501978 | jens-daniel-mueller | 2022-03-21 |
| d2191ad | jens-daniel-mueller | 2022-02-04 |
| 4673df5 | jens-daniel-mueller | 2022-02-02 |
| 60727e6 | jens-daniel-mueller | 2022-02-02 |
| 913e42f | jens-daniel-mueller | 2022-02-01 |
| 189de95 | jens-daniel-mueller | 2022-02-01 |
| b62308d | jens-daniel-mueller | 2022-01-31 |
| 5f2aed0 | jens-daniel-mueller | 2022-01-27 |
| c6fe495 | jens-daniel-mueller | 2022-01-26 |
| 9753eb8 | jens-daniel-mueller | 2022-01-26 |
| b1d7720 | jens-daniel-mueller | 2022-01-21 |
[[3]]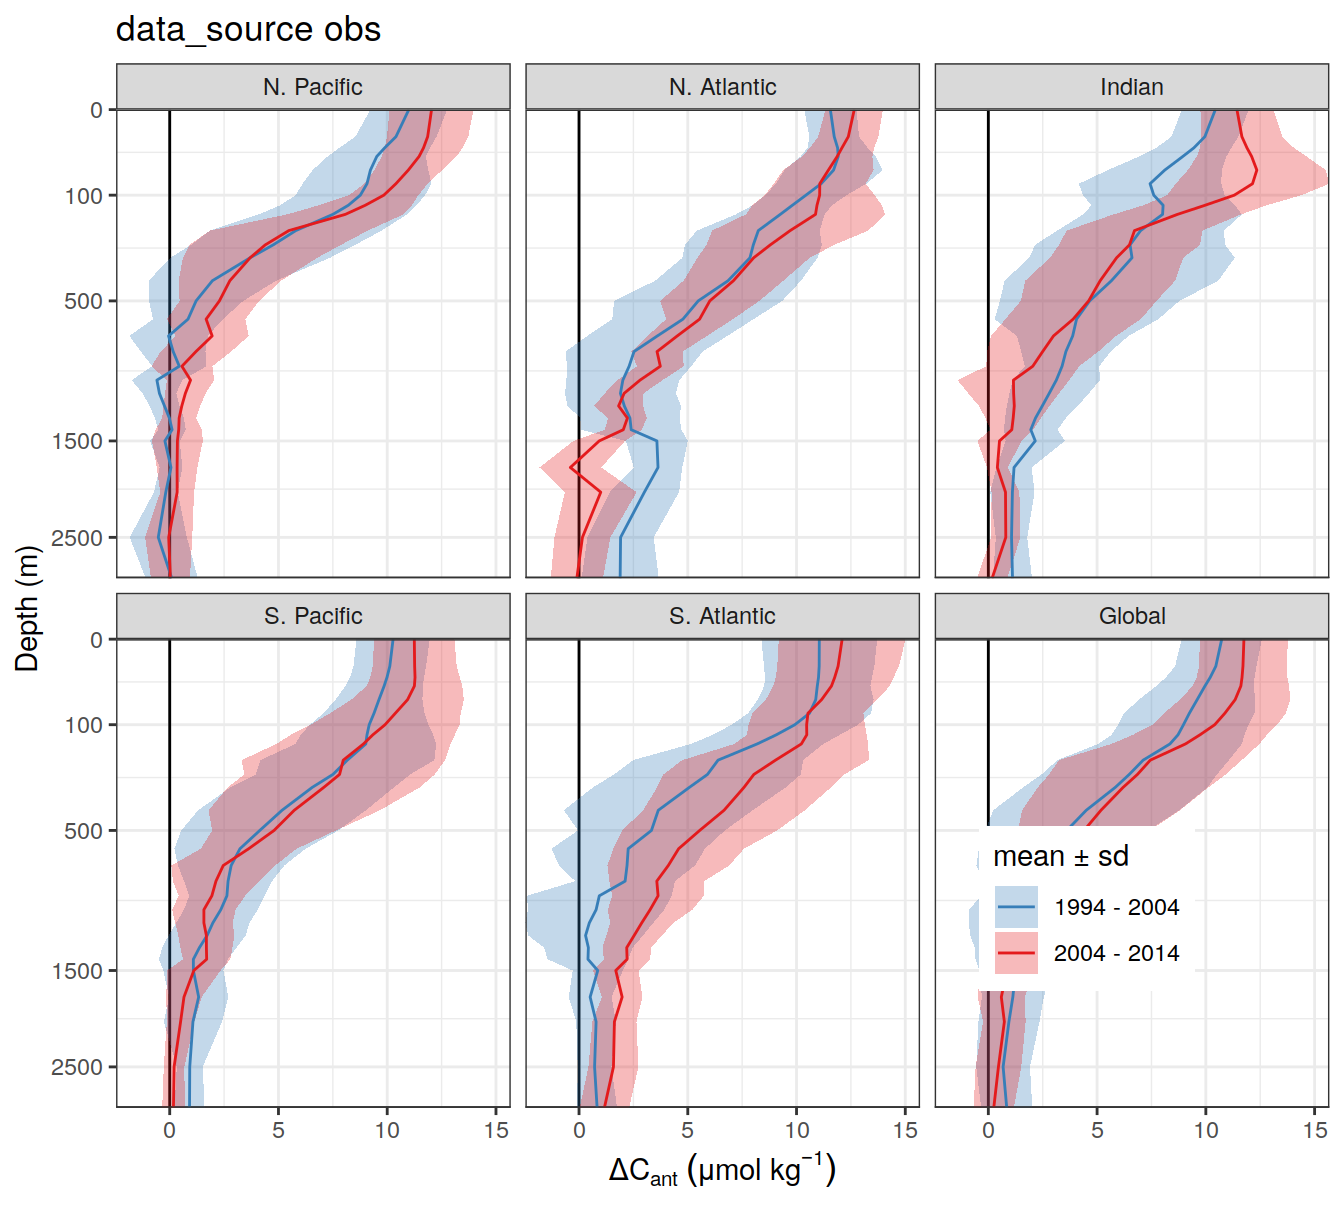
| Version | Author | Date |
|---|---|---|
| 318fefe | jens-daniel-mueller | 2022-08-11 |
9.2 dcant, abs, ensemble
9.2.1 Global
dcant_profile_global_all_ensemble %>%
  arrange(depth) %>%
  filter(
    period != "1994 - 2014",
    depth <= params_global$inventory_depth_standard,
    data_source == "obs"
  ) %>%
  group_split(data_source) %>%
  map(
    ~ ggplot() +
      geom_hline(yintercept = params_global$inventory_depth_standard) +
      geom_vline(xintercept = 0) +
      geom_path(
        data = .x,
        aes(
          dcant,
          depth,
          col = period,
          group = Version_ID,
          linetype = "Ensemble member",
          size = "Ensemble member"
        ), alpha = 0.5
      ) +
      geom_path(
        data = .x %>% filter(Version_ID %in% Version_IDs),
        aes(
          dcant,
          depth,
          col = period,
          group = Version_ID,
          linetype = "Standard case",
          size = "Standard case"
        )
      ) +
      scale_size_manual(values = c(0.5, 2), name="x") +
      scale_linetype_manual(values = c(2, 1), name="x") +
      scale_y_continuous(trans = trans_reverser("sqrt"),
                         breaks = c(0, 100, 500, seq(1500, 5000, 1000))) +
      coord_cartesian(expand = 0) +
      scale_color_brewer(
        palette = "Set1",
        direction = -1
      ) +
      scale_fill_brewer(
        palette = "Set1",
        direction = -1
      ) +
      labs(
        # title = paste("data_source", unique(.x$data_source)),
        y = "Depth (m)",
        x = dcant_umol_label
      ) +
      facet_wrap( ~ basin, ncol = 3, dir = "v") +
      theme(legend.position = c(0.85, 0.3),
            legend.title = element_blank())
  )
[[1]]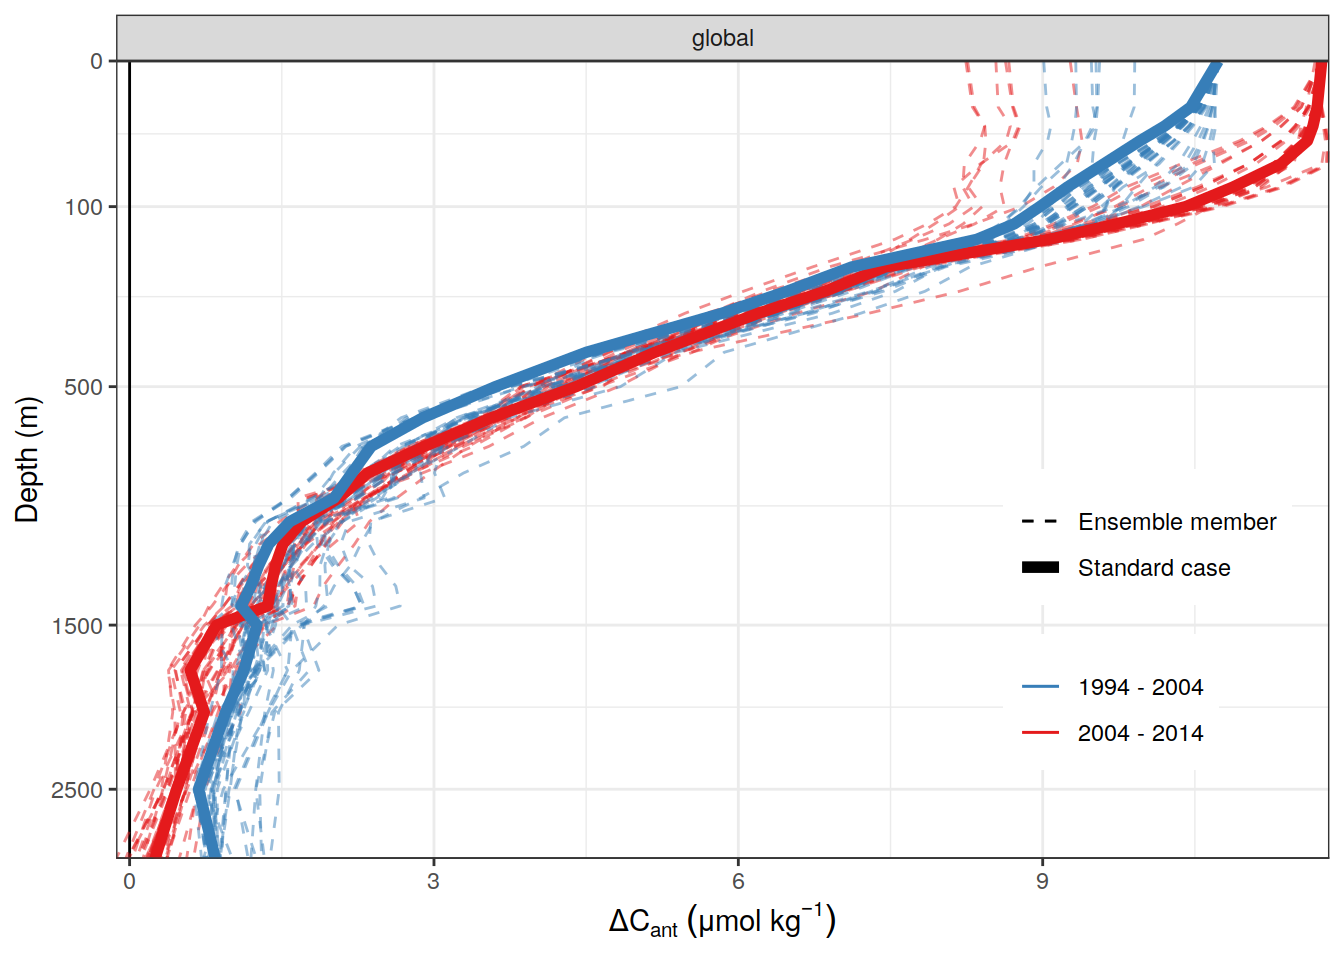
| Version | Author | Date |
|---|---|---|
| fea41c1 | jens-daniel-mueller | 2022-07-20 |
| d2ae54c | jens-daniel-mueller | 2022-07-18 |
| 2695085 | jens-daniel-mueller | 2022-07-17 |
| 535196a | jens-daniel-mueller | 2022-07-17 |
| afb27ad | jens-daniel-mueller | 2022-07-15 |
| b492b46 | jens-daniel-mueller | 2022-07-15 |
| bd24a0f | jens-daniel-mueller | 2022-07-15 |
| 17cd1d1 | jens-daniel-mueller | 2022-07-13 |
9.2.2 basin hemisphere
dcant_profile_basin_MLR_all_ensemble %>%
  arrange(depth) %>%
  filter(
    period != "1994 - 2014",
    depth <= params_global$inventory_depth_standard,
    data_source == "obs"
  ) %>%
  group_split(data_source) %>%
  map(
    ~ ggplot() +
      geom_hline(yintercept = params_global$inventory_depth_standard) +
      geom_vline(xintercept = 0) +
      geom_path(
        data = .x,
        aes(
          dcant,
          depth,
          col = period,
          group = Version_ID,
          linetype = "Ensemble member",
          size = "Ensemble member",
          alpha = "Ensemble member"
        )
      ) +
      geom_path(
        data = .x %>% filter(Version_ID %in% Version_IDs),
        aes(
          dcant,
          depth,
          col = period,
          group = Version_ID,
          linetype = "Standard case",
          alpha = "Standard case",
          size = "Standard case"
        )
      ) +
      geom_path(
        data = .x %>% filter(Version_ID %in% Version_IDs),
        aes(
          dcant,
          depth,
          group = Version_ID
        )
      ) +
      scale_size_manual(values = c(0.7, 1.5), name="x") +
      scale_linetype_manual(values = c(1, 1), name="x") +
      scale_alpha_manual(values = c(0.4, 1), name="x") +
      scale_y_continuous(trans = trans_reverser("sqrt"),
                         breaks = c(0, 100, 500, seq(1500, 5000, 1000))) +
      coord_cartesian(expand = 0) +
      scale_color_brewer(
        palette = "Set1",
        direction = -1
      ) +
      scale_fill_brewer(
        palette = "Set1",
        direction = -1
      ) +
      labs(
        # title = paste("data_source", unique(.x$data_source)),
        y = "Depth (m)",
        x = dcant_umol_label
      ) +
      facet_wrap( ~ basin, ncol = 3, dir = "v") +
      theme(legend.position = "top")
  )
[[1]]
| Version | Author | Date |
|---|---|---|
| fea41c1 | jens-daniel-mueller | 2022-07-20 |
| d2ae54c | jens-daniel-mueller | 2022-07-18 |
| 2695085 | jens-daniel-mueller | 2022-07-17 |
| 535196a | jens-daniel-mueller | 2022-07-17 |
| afb27ad | jens-daniel-mueller | 2022-07-15 |
| b492b46 | jens-daniel-mueller | 2022-07-15 |
| bd24a0f | jens-daniel-mueller | 2022-07-15 |
| f1d7f80 | jens-daniel-mueller | 2022-07-13 |
mean_surface_dcant <- dcant_profile_basin_MLR_all %>%
  arrange(depth) %>%
  filter(period != "1994 - 2014",
         data_source == "obs") %>%
  filter(depth <= 50) %>%
  group_by(basin, period) %>%
  summarise(mean_surface_dcant = mean(dcant)) %>%
  ungroup()

full_join(dcant_profile_basin_MLR_all,
          mean_surface_dcant) %>%
  arrange(depth) %>%
  filter(period != "1994 - 2014",
         data_source == "obs") %>%
  filter(dcant >= mean_surface_dcant/2) %>%
  group_by(period, basin, Version_ID) %>%
  summarise(max_depth = max(depth)) %>%
  ungroup() %>%
  group_by(basin, period) %>%
  summarise(sd_max_depth = sd(max_depth)*2,
            mean_max_depth = mean(max_depth)) %>%
  ungroup()
# A tibble: 12 × 4
basin period sd_max_depth mean_max_depth
<fct> <chr> <dbl> <dbl>
1 N. Pacific 1994 - 2004 NA 200
2 N. Pacific 2004 - 2014 NA 150
3 S. Pacific 1994 - 2004 NA 400
4 S. Pacific 2004 - 2014 NA 400
5 N. Atlantic 1994 - 2004 NA 400
6 N. Atlantic 2004 - 2014 NA 400
7 S. Atlantic 1994 - 2004 NA 250
8 S. Atlantic 2004 - 2014 NA 400
9 Indian 1994 - 2004 NA 400
10 Indian 2004 - 2014 NA 250
11 Global 1994 - 2004 NA 300
12 Global 2004 - 2014 NA 300full_join(dcant_profile_basin_MLR_all_ensemble,
mean_surface_dcant) %>%
arrange(depth) %>%
filter(period != "1994 - 2014",
data_source == "obs") %>%
filter(dcant >= mean_surface_dcant/2) %>%
group_by(period, basin, Version_ID) %>%
summarise(max_depth = max(depth)) %>%
ungroup() %>%
group_by(basin, period) %>%
summarise(sd_max_depth = sd(max_depth)*2,
mean_max_depth = mean(max_depth)) %>%
ungroup()# A tibble: 12 × 4
basin period sd_max_depth mean_max_depth
<fct> <chr> <dbl> <dbl>
1 N. Pacific 1994 - 2004 62.4 260.
2 N. Pacific 2004 - 2014 67.6 200
3 S. Pacific 1994 - 2004 190. 411.
4 S. Pacific 2004 - 2014 90.9 328.
5 N. Atlantic 1994 - 2004 89.3 397.
6 N. Atlantic 2004 - 2014 134. 481.
7 S. Atlantic 1994 - 2004 67.4 303.
8 S. Atlantic 2004 - 2014 237. 438.
9 Indian 1994 - 2004 144. 478.
10 Indian 2004 - 2014 119. 264.
11 Global 1994 - 2004 112. 350
12 Global 2004 - 2014 37.8 292.dcant_profile_basin_MLR_range <- dcant_profile_basin_MLR_all_ensemble %>%
# filter(period != "1994 - 2014") %>%
group_by(basin, depth, period, data_source) %>%
summarise(dcant_sd = sd(dcant)*2) %>%
ungroup()
dcant_profile_basin_MLR_all_ensemble <-
full_join(dcant_profile_basin_MLR_all_ensemble %>% select(-dcant_sd),
dcant_profile_basin_MLR_range)
p_dcant_profiles <-
dcant_profile_basin_MLR_all_ensemble %>%
arrange(depth) %>%
filter(
period != "1994 - 2014",
depth <= params_global$inventory_depth_standard,
data_source == "obs",
Version_ID %in% Version_IDs
) %>%
ggplot() +
geom_vline(xintercept = 0, size = 0.1) +
geom_hline(yintercept = 1000, size = 0.1) +
geom_ribbon(
aes(
xmin = dcant - dcant_sd,
xmax = dcant + dcant_sd,
y = depth,
fill = period,
group = Version_ID
),
alpha = 0.5
) +
geom_path(
aes(dcant,
depth,
col = period,
group = Version_ID,)
) +
scale_y_continuous(trans = trans_reverser("sqrt"),
breaks = c(0, 100, 500, seq(1000, 5000, 1000))) +
coord_cartesian(expand = 0) +
scale_color_manual(values = c("#EE7733", "#009988"), name = "Mean \u00B1 2 SD") +
scale_fill_manual(values = c("#EE7733", "#009988"), name = "Mean \u00B1 2 SD") +
labs(y = "Depth (m)",
x = dcant_umol_label) +
facet_wrap(~ basin, ncol = 3, dir = "v") +
theme(legend.position = c(0.9, 0.1))
p_dcant_profiles
| Version | Author | Date |
|---|---|---|
| fea41c1 | jens-daniel-mueller | 2022-07-20 |
| d803308 | jens-daniel-mueller | 2022-07-19 |
| b1f7ab3 | jens-daniel-mueller | 2022-07-18 |
| d2ae54c | jens-daniel-mueller | 2022-07-18 |
| 2695085 | jens-daniel-mueller | 2022-07-17 |
| 535196a | jens-daniel-mueller | 2022-07-17 |
| afb27ad | jens-daniel-mueller | 2022-07-15 |
| b492b46 | jens-daniel-mueller | 2022-07-15 |
| bd24a0f | jens-daniel-mueller | 2022-07-15 |
| f1d7f80 | jens-daniel-mueller | 2022-07-13 |
mean_surface_dcant <- dcant_profile_basin_MLR_all %>%
  arrange(depth) %>%
  filter(period != "1994 - 2014",
         data_source == "obs") %>%
  filter(depth <= 50) %>%
  group_by(basin, period) %>%
  summarise(mean_surface_dcant = mean(dcant)) %>%
  ungroup()

full_join(dcant_profile_basin_MLR_all,
          mean_surface_dcant) %>%
  arrange(depth) %>%
  filter(period != "1994 - 2014",
         data_source == "obs") %>%
  filter(dcant >= mean_surface_dcant/2) %>%
  group_by(period, basin, Version_ID) %>%
  summarise(max_depth = max(depth)) %>%
  ungroup() %>%
  group_by(basin, period) %>%
  summarise(sd_max_depth = sd(max_depth)*2,
            mean_max_depth = mean(max_depth)) %>%
  ungroup()
# A tibble: 12 × 4
basin period sd_max_depth mean_max_depth
<fct> <chr> <dbl> <dbl>
1 N. Pacific 1994 - 2004 NA 200
2 N. Pacific 2004 - 2014 NA 150
3 S. Pacific 1994 - 2004 NA 400
4 S. Pacific 2004 - 2014 NA 400
5 N. Atlantic 1994 - 2004 NA 400
6 N. Atlantic 2004 - 2014 NA 400
7 S. Atlantic 1994 - 2004 NA 250
8 S. Atlantic 2004 - 2014 NA 400
9 Indian 1994 - 2004 NA 400
10 Indian 2004 - 2014 NA 250
11 Global 1994 - 2004 NA 300
12 Global 2004 - 2014 NA 300full_join(dcant_profile_basin_MLR_all_ensemble,
mean_surface_dcant) %>%
arrange(depth) %>%
filter(period != "1994 - 2014",
data_source == "obs") %>%
filter(dcant >= mean_surface_dcant/2) %>%
group_by(period, basin, Version_ID) %>%
summarise(max_depth = max(depth)) %>%
ungroup() %>%
group_by(basin, period) %>%
summarise(sd_max_depth = sd(max_depth)*2,
mean_max_depth = mean(max_depth)) %>%
ungroup()# A tibble: 12 × 4
basin period sd_max_depth mean_max_depth
<fct> <chr> <dbl> <dbl>
1 N. Pacific 1994 - 2004 62.4 260.
2 N. Pacific 2004 - 2014 67.6 200
3 S. Pacific 1994 - 2004 190. 411.
4 S. Pacific 2004 - 2014 90.9 328.
5 N. Atlantic 1994 - 2004 89.3 397.
6 N. Atlantic 2004 - 2014 134. 481.
7 S. Atlantic 1994 - 2004 67.4 303.
8 S. Atlantic 2004 - 2014 237. 438.
9 Indian 1994 - 2004 144. 478.
10 Indian 2004 - 2014 119. 264.
11 Global 1994 - 2004 112. 350
12 Global 2004 - 2014 37.8 292.p_dcant_profiles_mod <-
dcant_profile_basin_MLR_all_ensemble %>%
arrange(depth) %>%
filter(
period != "1994 - 2014",
depth <= params_global$inventory_depth_standard,
data_source != "obs",
Version_ID %in% Version_IDs
) %>%
mutate(data_source = case_when(
data_source == "mod" ~ "Reconstruction",
data_source == "mod_truth" ~ "Model truth"
)) %>%
ggplot() +
geom_vline(xintercept = 0, size = 0.1) +
geom_hline(yintercept = 1000, size = 0.1) +
geom_ribbon(
aes(
xmin = dcant - dcant_sd,
xmax = dcant + dcant_sd,
y = depth,
fill = data_source,
group = interaction(Version_ID,data_source)
),
alpha = 0.5
) +
geom_path(
aes(dcant,
depth,
col = data_source,
group = interaction(Version_ID,data_source))
) +
scale_y_continuous(trans = trans_reverser("sqrt"),
breaks = c(0, 100, 500, seq(1000, 5000, 1000))) +
coord_cartesian(expand = 0) +
scale_color_manual(values = c("#009988", "#EE7733"), name = "Mean \u00B1 2 SD") +
scale_fill_manual(values = c("#009988", "#EE7733"), name = "Mean \u00B1 2 SD") +
labs(y = "Depth (m)",
x = dcant_umol_label) +
facet_grid(period ~ basin) +
theme(legend.position = "top")
p_dcant_profiles_mod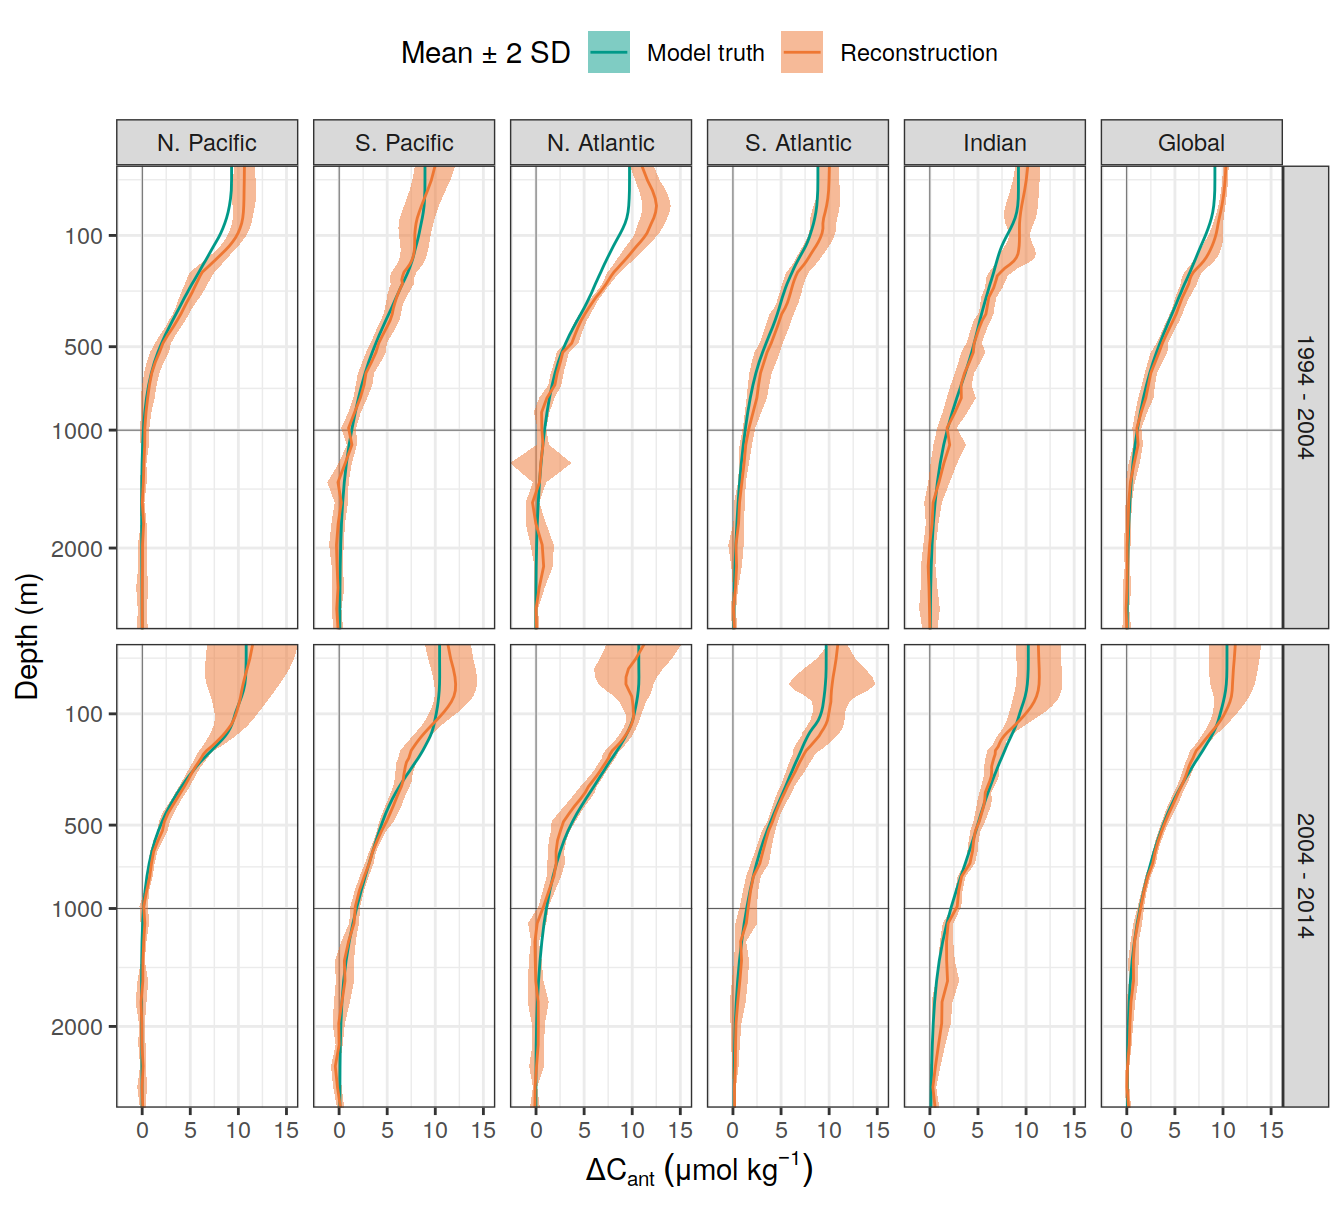
| Version | Author | Date |
|---|---|---|
| 318fefe | jens-daniel-mueller | 2022-08-11 |
dcant_profile_basin_MLR_all_ensemble %>%
  arrange(depth) %>%
  filter(
    period != "1994 - 2014",
    depth <= params_global$inventory_depth_standard,
    data_source == "obs"
  ) %>%
  group_split(data_source) %>%
  map(
    ~ ggplot() +
      geom_hline(yintercept = params_global$inventory_depth_standard) +
      geom_vline(xintercept = 0) +
      geom_path(
        data = .x,
        aes(dcant,
            depth,
            col = MLR_basins,
            group = Version_ID),
        alpha = 0.5
      ) +
      scale_size_manual(values = c(0.5, 2), name = "x") +
      scale_linetype_manual(values = c(2, 1), name = "x") +
      scale_y_continuous(trans = trans_reverser("sqrt"),
                         breaks = c(0, 100, 500, seq(1500, 5000, 1000))) +
      coord_cartesian(expand = 0) +
      scale_color_brewer(palette = "Dark2") +
      labs(y = "Depth (m)",
           x = dcant_umol_label) +
      facet_grid(basin ~ period)
  )
[[1]]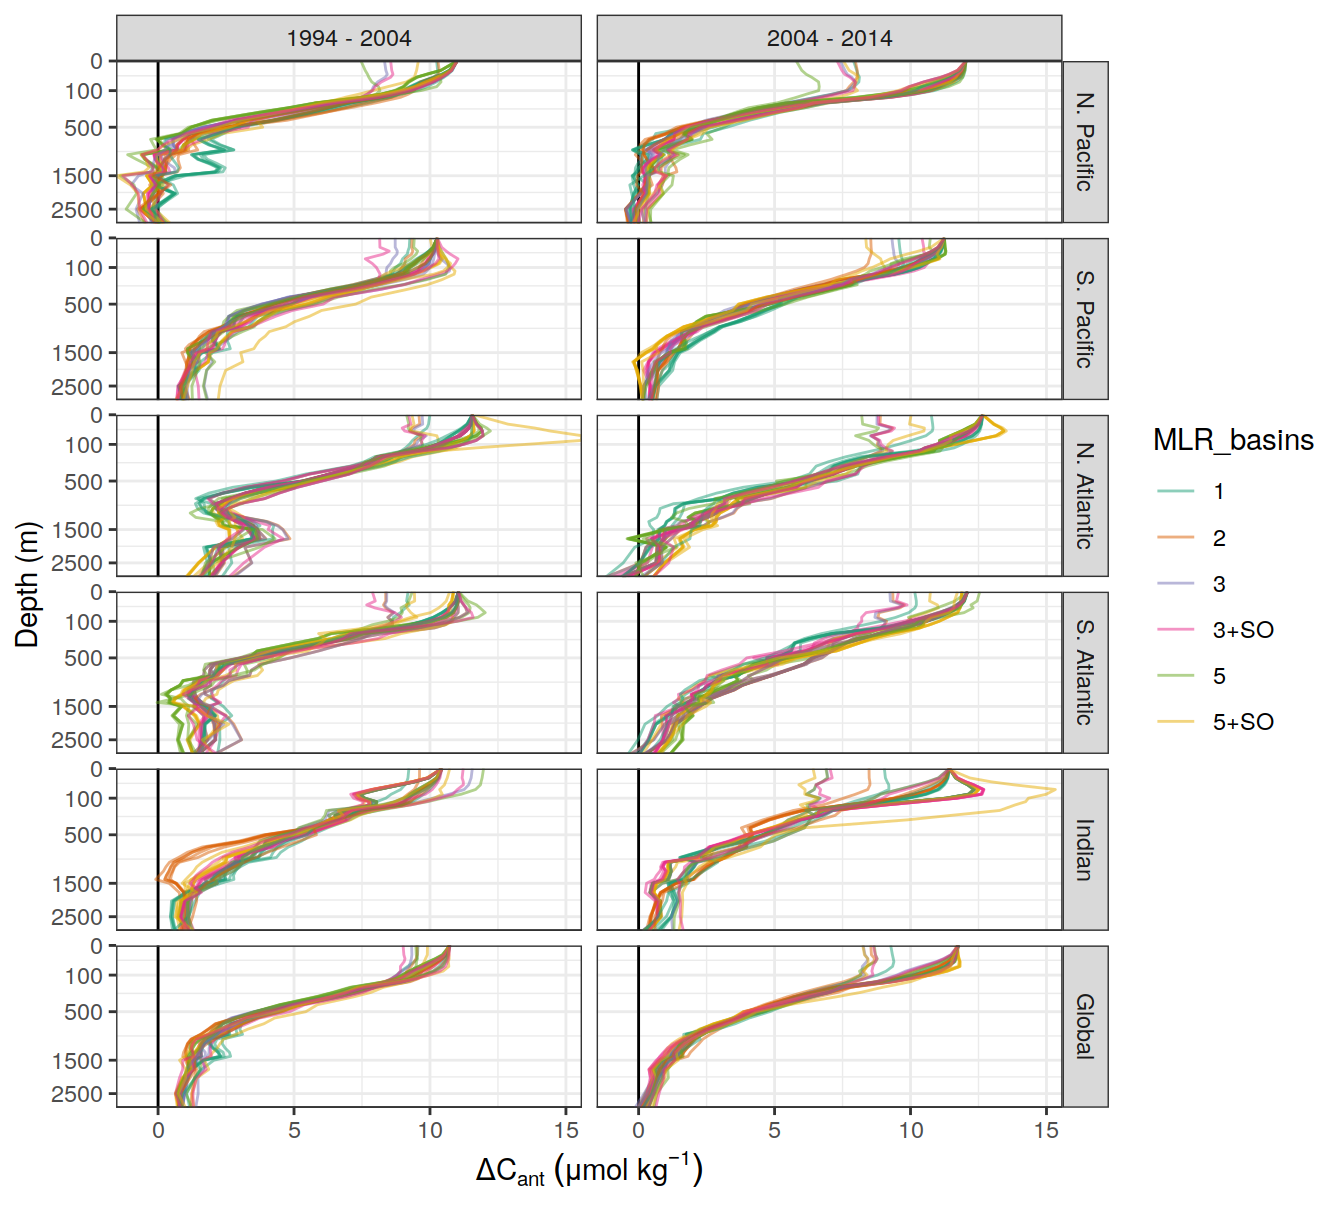
| Version | Author | Date |
|---|---|---|
| fea41c1 | jens-daniel-mueller | 2022-07-20 |
| d2ae54c | jens-daniel-mueller | 2022-07-18 |
| 2695085 | jens-daniel-mueller | 2022-07-17 |
| 535196a | jens-daniel-mueller | 2022-07-17 |
| afb27ad | jens-daniel-mueller | 2022-07-15 |
| b492b46 | jens-daniel-mueller | 2022-07-15 |
| bd24a0f | jens-daniel-mueller | 2022-07-15 |
| 17cd1d1 | jens-daniel-mueller | 2022-07-13 |
| 8fb595c | jens-daniel-mueller | 2022-07-12 |
| 003b161 | jens-daniel-mueller | 2022-07-12 |
| 232909e | jens-daniel-mueller | 2022-07-01 |
dcant_profile_basin_MLR_all_ensemble %>%
  arrange(depth) %>%
  filter(
    # period != "1994 - 2014",
    depth <= params_global$inventory_depth_standard
    # data_source == "obs"
  ) %>%
  group_split(data_source) %>%
  # head(1) %>%
  map(
    ~ ggplot() +
      geom_hline(yintercept = params_global$inventory_depth_standard) +
      geom_vline(xintercept = 0) +
      geom_path(
        data = .x,
        aes(
          dcant,
          depth,
          col = Version_ID_group,
          group = Version_ID
        ), alpha = 0.5
      ) +
      scale_y_continuous(trans = trans_reverser("sqrt"),
                         breaks = c(0, 100, 500, seq(1500, 5000, 1000))) +
      coord_cartesian(expand = 0) +
      scale_color_brewer(
        palette = "Dark2",
        direction = -1
      ) +
      scale_fill_brewer(
        palette = "Set1",
        direction = -1
      ) +
      labs(
        y = "Depth (m)",
        x = dcant_umol_label,
        title = unique(.x$data_source)
      ) +
      facet_grid(basin ~ period)
  )
[[1]]
| Version | Author | Date |
|---|---|---|
| fea41c1 | jens-daniel-mueller | 2022-07-20 |
| d2ae54c | jens-daniel-mueller | 2022-07-18 |
| 2695085 | jens-daniel-mueller | 2022-07-17 |
| 535196a | jens-daniel-mueller | 2022-07-17 |
| afb27ad | jens-daniel-mueller | 2022-07-15 |
| b492b46 | jens-daniel-mueller | 2022-07-15 |
| bd24a0f | jens-daniel-mueller | 2022-07-15 |
| 17cd1d1 | jens-daniel-mueller | 2022-07-13 |
| 8fb595c | jens-daniel-mueller | 2022-07-12 |
| 003b161 | jens-daniel-mueller | 2022-07-12 |
| 6be73e0 | jens-daniel-mueller | 2022-06-30 |
[[2]]
| Version | Author | Date |
|---|---|---|
| 318fefe | jens-daniel-mueller | 2022-08-11 |
| fea41c1 | jens-daniel-mueller | 2022-07-20 |
| d2ae54c | jens-daniel-mueller | 2022-07-18 |
| 2695085 | jens-daniel-mueller | 2022-07-17 |
| 535196a | jens-daniel-mueller | 2022-07-17 |
| afb27ad | jens-daniel-mueller | 2022-07-15 |
| b492b46 | jens-daniel-mueller | 2022-07-15 |
| bd24a0f | jens-daniel-mueller | 2022-07-15 |
| 17cd1d1 | jens-daniel-mueller | 2022-07-13 |
| 8fb595c | jens-daniel-mueller | 2022-07-12 |
| 003b161 | jens-daniel-mueller | 2022-07-12 |
| 6be73e0 | jens-daniel-mueller | 2022-06-30 |
[[3]]
| Version | Author | Date |
|---|---|---|
| 318fefe | jens-daniel-mueller | 2022-08-11 |
dcant_profile_basin_MLR_all %>%
  arrange(depth) %>%
  filter(period != "1994 - 2014",
         depth <= params_global$inventory_depth_standard) %>%
  group_split(data_source, basin) %>%
  # head(1) %>%
  map(
    ~ ggplot(data = .x,
             aes(dcant,
                 depth)) +
      geom_hline(yintercept = params_global$inventory_depth_standard) +
      geom_vline(xintercept = 0) +
      geom_ribbon(
        aes(
          xmin = dcant - dcant_sd,
          xmax = dcant + dcant_sd,
          fill = period
        ),
        alpha = 0.3
      ) +
      geom_path(aes(col = period)) +
      scale_y_continuous(trans = trans_reverser("sqrt"),
                         breaks = c(0, 100, 500, seq(1500, 5000, 1000))) +
      coord_cartesian(expand = 0) +
      scale_color_brewer(palette = "Set1", name = "mean \u00B1 sd", direction = -1) +
      scale_fill_brewer(palette = "Set1", name = "mean \u00B1 sd", direction = -1) +
      labs(
        title = paste("data_source", unique(.x$data_source),
                      "|", unique(.x$basin)),
        y = "Depth (m)",
        x = dcant_umol_label
      ) +
      # facet_wrap(~ basin, ncol = 3, dir = "v") +
      theme(legend.position = c(0.8,0.2))
  )
9.3 dcant - absolute delta
delta <- dcant_profile_basin_MLR_all %>%
  arrange(depth) %>%
  filter(period != "1994 - 2014") %>%
  select(data_source, depth, basin, period, dcant) %>%
  pivot_wider(names_from = period,
              values_from = dcant) %>%
  mutate(delta_dcant = `2004 - 2014` - `1994 - 2004`) %>%
  select(-c(`2004 - 2014`, `1994 - 2004`))

delta_sd <- dcant_profile_basin_MLR_all %>%
  arrange(depth) %>%
  filter(period != "1994 - 2014") %>%
  select(data_source, depth, basin, period, dcant_sd) %>%
  pivot_wider(names_from = period,
              values_from = dcant_sd) %>%
  mutate(delta_dcant_sd = sqrt(`2004 - 2014`^2 + `1994 - 2004`^2)) %>%
  select(-c(`2004 - 2014`, `1994 - 2004`))

dcant_profile_basin_MLR_all_delta <- full_join(delta, delta_sd)
rm(delta, delta_sd)


dcant_profile_basin_MLR_all_delta %>%
  group_split(data_source) %>%
  # head(3) %>%
  map(
    ~ ggplot(data = .x,
             aes(delta_dcant,
                 depth)) +
      geom_hline(yintercept = params_global$inventory_depth_standard) +
      geom_vline(xintercept = 0) +
      geom_ribbon(
        aes(
          xmin = delta_dcant - delta_dcant_sd,
          xmax = delta_dcant + delta_dcant_sd
        ),
        alpha = 0.3
      ) +
      geom_path() +
      scale_y_continuous(trans = trans_reverser("sqrt"),
                         breaks = c(0, 100, 500, seq(1500, 5000, 1000))) +
      coord_cartesian(expand = 0) +
      scale_color_brewer(palette = "Set1", name = "mean \u00B1 sd") +
      scale_fill_brewer(palette = "Set1", name = "mean \u00B1 sd") +
      labs(
        title = paste("data_source", unique(.x$data_source)),
        y = "Depth (m)",
        x = ddcant_umol_label
      ) +
      facet_wrap(~ basin, ncol = 3)
  )
[[1]]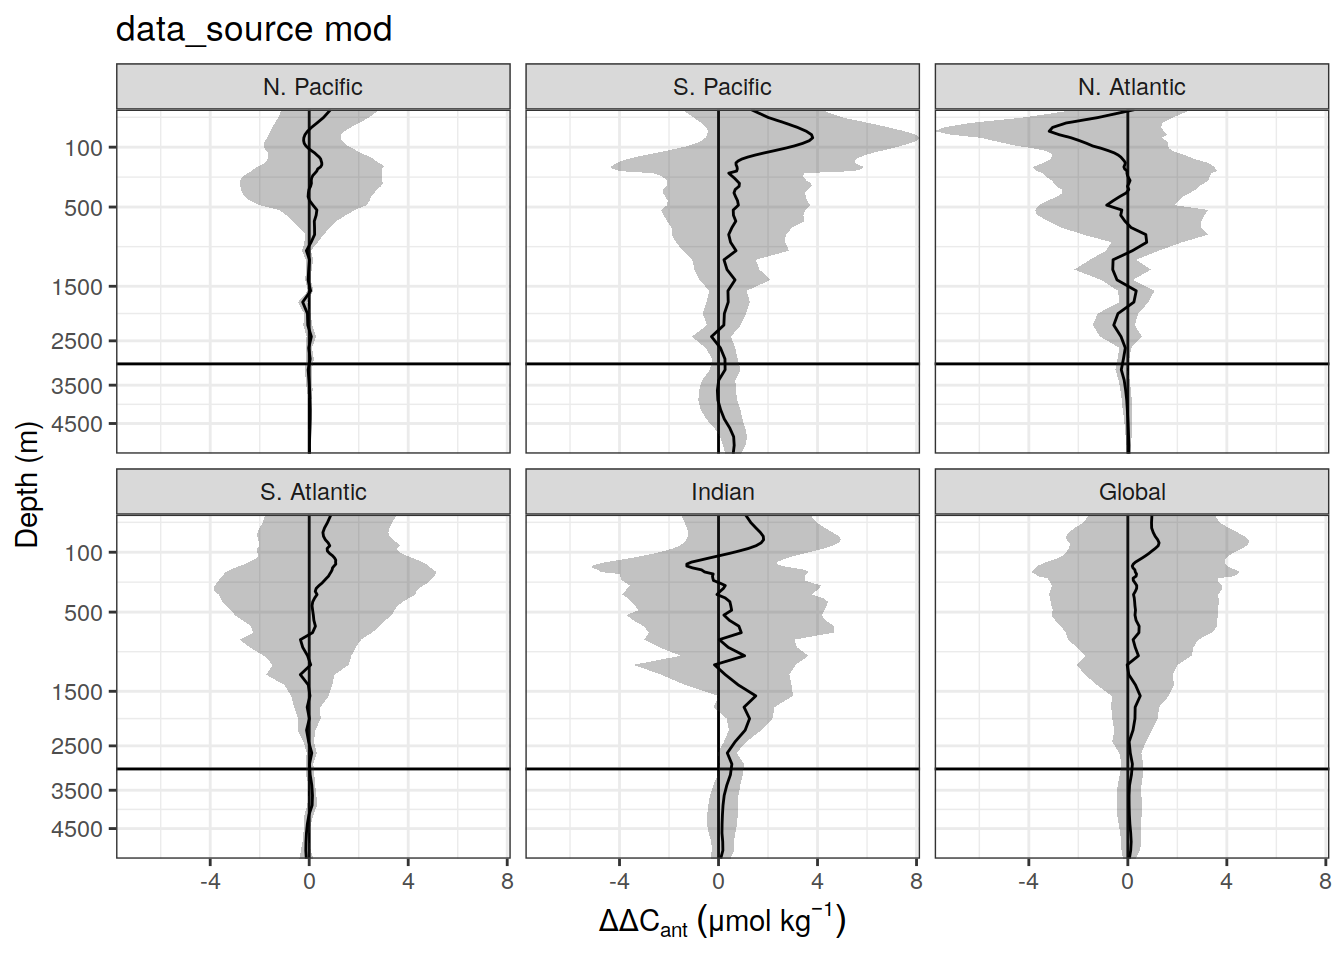
| Version | Author | Date |
|---|---|---|
| fea41c1 | jens-daniel-mueller | 2022-07-20 |
| d2ae54c | jens-daniel-mueller | 2022-07-18 |
| 2695085 | jens-daniel-mueller | 2022-07-17 |
| 87e9eb8 | jens-daniel-mueller | 2022-06-27 |
| b52b159 | jens-daniel-mueller | 2022-06-27 |
| 1d73ec9 | jens-daniel-mueller | 2022-05-16 |
| 2ca0109 | jens-daniel-mueller | 2022-05-02 |
| b018a9a | jens-daniel-mueller | 2022-04-29 |
| e09320d | jens-daniel-mueller | 2022-04-12 |
| acad2e2 | jens-daniel-mueller | 2022-04-09 |
| 3d81135 | jens-daniel-mueller | 2022-04-07 |
| a74e341 | jens-daniel-mueller | 2022-04-04 |
| bd9e11d | jens-daniel-mueller | 2022-03-22 |
| 2501978 | jens-daniel-mueller | 2022-03-21 |
| d2191ad | jens-daniel-mueller | 2022-02-04 |
| 913e42f | jens-daniel-mueller | 2022-02-01 |
| 189de95 | jens-daniel-mueller | 2022-02-01 |
| b62308d | jens-daniel-mueller | 2022-01-31 |
| 5f2aed0 | jens-daniel-mueller | 2022-01-27 |
| eccd82b | jens-daniel-mueller | 2022-01-26 |
| c6fe495 | jens-daniel-mueller | 2022-01-26 |
[[2]]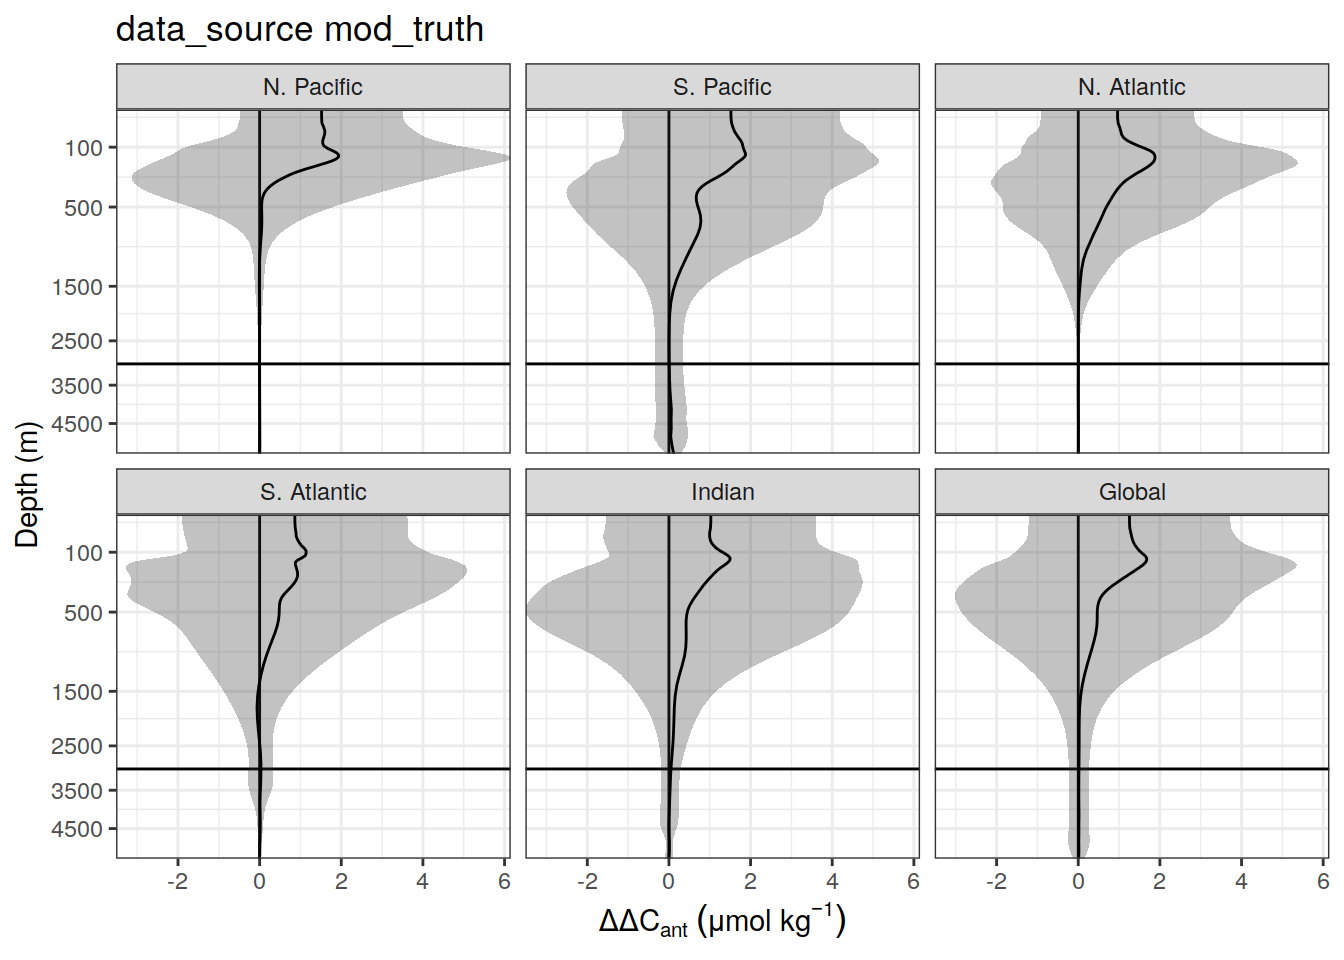
| Version | Author | Date |
|---|---|---|
| 318fefe | jens-daniel-mueller | 2022-08-11 |
| fea41c1 | jens-daniel-mueller | 2022-07-20 |
| d2ae54c | jens-daniel-mueller | 2022-07-18 |
| 2695085 | jens-daniel-mueller | 2022-07-17 |
| 87e9eb8 | jens-daniel-mueller | 2022-06-27 |
| b52b159 | jens-daniel-mueller | 2022-06-27 |
| 1d73ec9 | jens-daniel-mueller | 2022-05-16 |
| 2ca0109 | jens-daniel-mueller | 2022-05-02 |
| b018a9a | jens-daniel-mueller | 2022-04-29 |
| e09320d | jens-daniel-mueller | 2022-04-12 |
| acad2e2 | jens-daniel-mueller | 2022-04-09 |
| 3d81135 | jens-daniel-mueller | 2022-04-07 |
| a74e341 | jens-daniel-mueller | 2022-04-04 |
| bd9e11d | jens-daniel-mueller | 2022-03-22 |
| 2501978 | jens-daniel-mueller | 2022-03-21 |
| d2191ad | jens-daniel-mueller | 2022-02-04 |
| 913e42f | jens-daniel-mueller | 2022-02-01 |
| 189de95 | jens-daniel-mueller | 2022-02-01 |
| b62308d | jens-daniel-mueller | 2022-01-31 |
| 5f2aed0 | jens-daniel-mueller | 2022-01-27 |
| eccd82b | jens-daniel-mueller | 2022-01-26 |
| c6fe495 | jens-daniel-mueller | 2022-01-26 |
[[3]]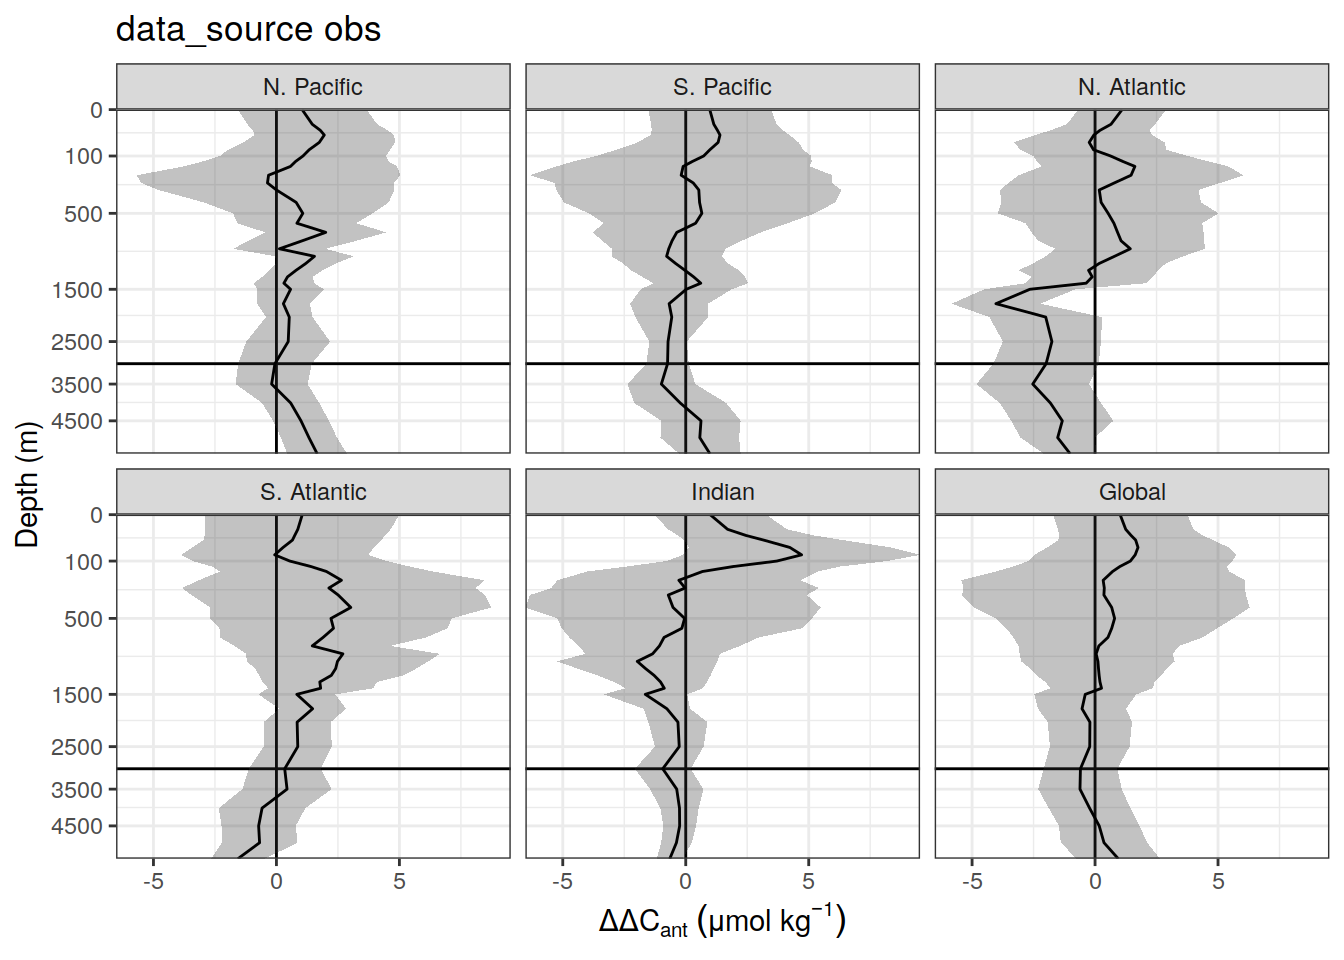
| Version | Author | Date |
|---|---|---|
| 318fefe | jens-daniel-mueller | 2022-08-11 |
10 Budgets
dcant_budget_global_all_ensemble <- dcant_budget_global_all_ensemble %>%
  mutate(dcant = dcant * dcant_scaling)

dcant_budget_global_all <- dcant_budget_global_all %>%
  mutate(dcant = dcant * dcant_scaling)

dcant_budget_global_all_no_adj <- dcant_budget_global_all_no_adj %>%
  mutate(dcant = dcant * dcant_scaling)

dcant_budget_basin_MLR_all_ensemble <- dcant_budget_basin_MLR_all_ensemble %>%
  mutate(dcant = if_else(basin == "Global",
                         dcant * dcant_scaling,
                         dcant))

dcant_budget_basin_MLR_all <- dcant_budget_basin_MLR_all %>%
  mutate(dcant = if_else(basin == "Global",
                         dcant * dcant_scaling,
                         dcant))

dcant_budget_basin_MLR_all_no_adj <- dcant_budget_basin_MLR_all_no_adj %>%
  mutate(dcant = if_else(basin == "Global",
                         dcant * dcant_scaling,
                         dcant))
dcant_budget_ensemble_stat <-
bind_rows(
dcant_budget_basin_MLR_all_ensemble
) %>%
filter(data_source == "obs",
period != "1994 - 2014") %>%
group_by(period, basin) %>%
summarise(
median = median(dcant),
sd = sd(dcant),
n = n()
) %>%
ungroup()
dcant_budget_ensemble_stat <-
full_join(
dcant_budget_ensemble_stat,
dcant_budget_basin_MLR_all_ensemble %>%
filter(Version_ID %in% Version_IDs,
data_source == "obs",
period != "1994 - 2014") %>%
select(period,
basin,
std_case = dcant)
)
dcant_budget_ensemble_significance <- dcant_budget_ensemble_stat %>%
pivot_longer(c(median,std_case),
names_to = "estimate",
values_to = "dcant") %>%
group_by(estimate, basin) %>%
mutate(
delta_dcant = dcant - lag(dcant),
delta_dcant_uncert = sqrt(2 * sd ^ 2 + lag(2 * sd ^ 2)),
error_prop_ratio = abs(delta_dcant_uncert / delta_dcant),
ttest_p = tsum.test(
mean.x = dcant,
s.x = sd,
n.x = n,
mean.y = lag(dcant),
s.y = lag(sd),
n.y = lag(n)
)$p.value
) %>%
ungroup() %>%
drop_na()
dcant_budget_ensemble_stat_significance <-
full_join(
dcant_budget_ensemble_stat %>%
select(-n) %>%
pivot_wider(
names_from = period,
values_from = median:std_case,
names_sep = " "
),
dcant_budget_ensemble_significance %>%
select(basin, estimate, delta_dcant, delta_dcant_uncert, ttest_p) %>%
pivot_wider(names_from = estimate,
values_from = delta_dcant:ttest_p) %>%
rename(delta_dcant_uncert = delta_dcant_uncert_std_case) %>%
select(-delta_dcant_uncert_median)
)
dcant_budget_ensemble_stat_significance %>%
kable() %>%
kable_styling() %>%
scroll_box(height = "300px")| basin | median 1994 - 2004 | median 2004 - 2014 | sd 1994 - 2004 | sd 2004 - 2014 | std_case 1994 - 2004 | std_case 2004 - 2014 | delta_dcant_median | delta_dcant_std_case | delta_dcant_uncert | ttest_p_median | ttest_p_std_case |
|---|---|---|---|---|---|---|---|---|---|---|---|
| N. Pacific | 2.86900 | 3.54000 | 0.9932880 | 0.8096496 | 2.20900 | 3.80200 | 0.671000 | 1.5930000 | 1.812266 | 0.0024972 | 0.0000000 |
| S. Pacific | 8.80550 | 7.63700 | 1.2820208 | 0.9030507 | 8.39900 | 7.61700 | -1.168500 | -0.7820000 | 2.217691 | 0.0000333 | 0.0039553 |
| N. Atlantic | 4.52250 | 3.65850 | 0.2466070 | 0.3747788 | 4.51400 | 3.46500 | -0.864000 | -1.0490000 | 0.634467 | 0.0000000 | 0.0000000 |
| S. Atlantic | 4.08700 | 4.89750 | 0.5931842 | 0.5702755 | 2.92700 | 5.18100 | 0.810500 | 2.2540000 | 1.163685 | 0.0000001 | 0.0000000 |
| Indian | 6.87100 | 5.74200 | 0.7230791 | 0.7783228 | 7.07200 | 5.73900 | -1.129000 | -1.3330000 | 1.502418 | 0.0000000 | 0.0000000 |
| Global | 28.95887 | 27.24436 | 2.3997433 | 1.6597223 | 26.79321 | 27.52167 | -1.714505 | 0.7284646 | 4.126366 | 0.0007990 | 0.1391916 |
dcant_budget_ensemble_significance %>%
  ggplot(aes(error_prop_ratio, ttest_p, col = basin)) +
  geom_vline(xintercept = 1) +
  geom_hline(yintercept = 0.05) +
  geom_point() +
  scale_y_log10() +
  scale_color_brewer(palette = "Dark2") +
  facet_grid(. ~ estimate)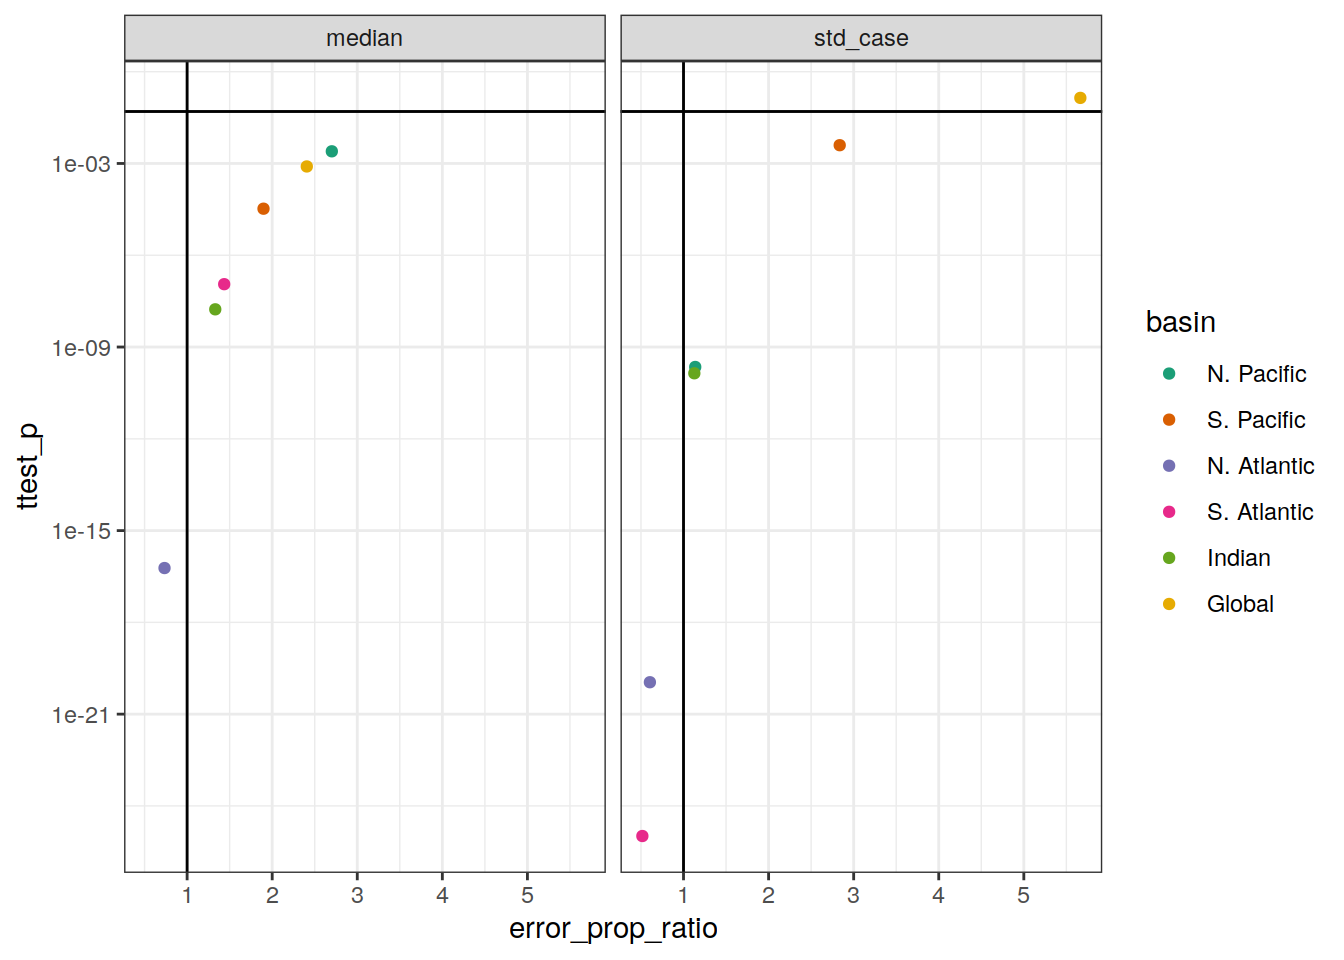
# estimate area scaling factor to achieve identical coverage

tcant_inv <-
  inner_join(tcant_inv, basinmask)

dcant_inv_all <-
  inner_join(dcant_inv_all, basinmask)

area_scaling <-
bind_rows(
  tcant_inv %>% distinct(lat, lon, basin) %>%
    mutate(source = "SO4"),
  dcant_inv_all %>% distinct(lat, lon, basin) %>%
    mutate(source = "M22")
)


map +
  geom_tile(data = area_scaling,
            aes(lon, lat, fill = basin)) +
  facet_wrap( ~ source)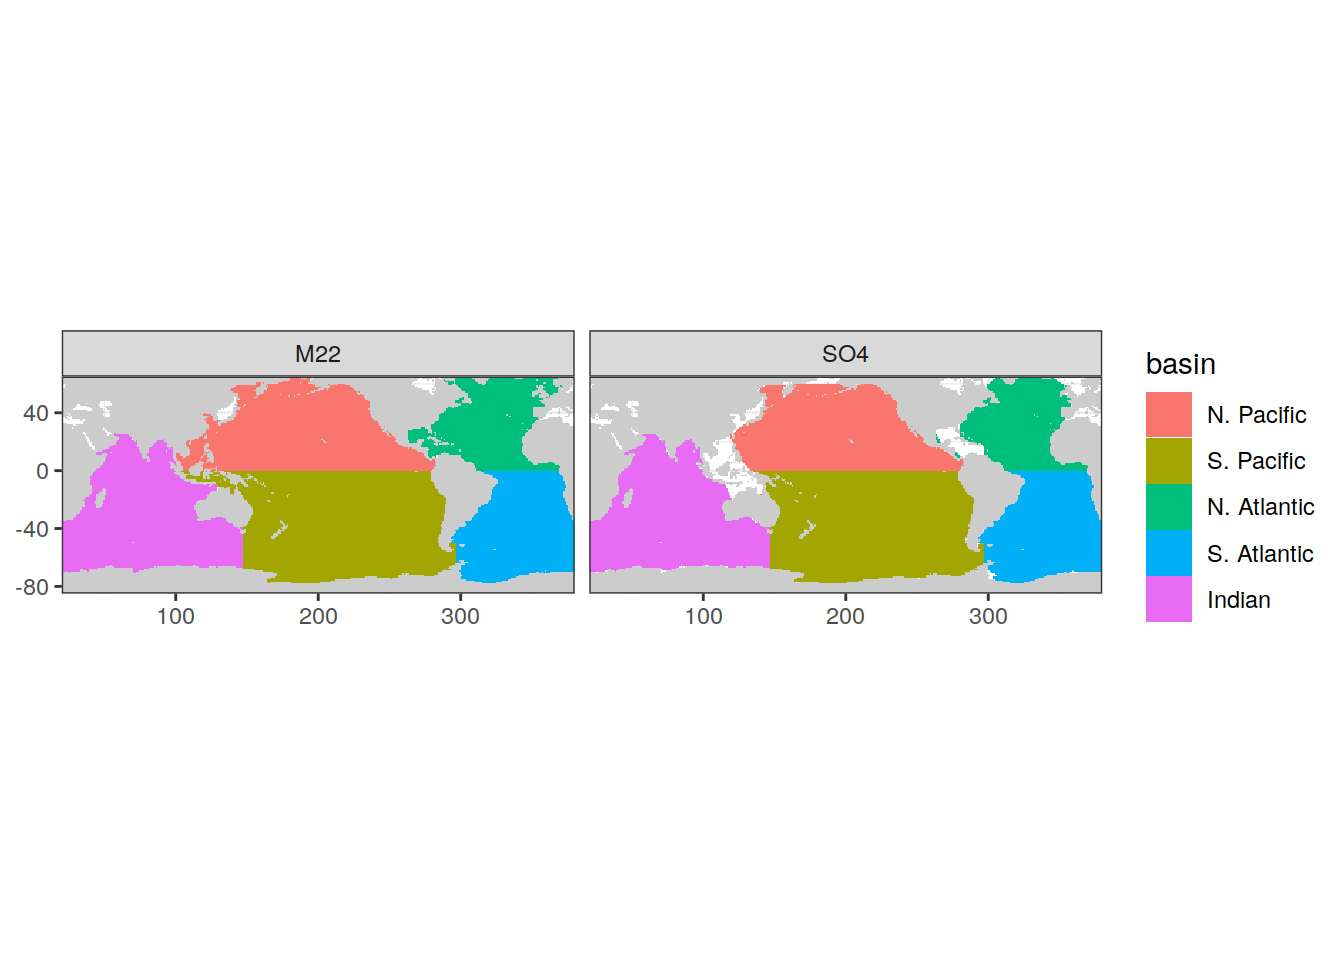
area_scaling <- area_scaling %>%
  mutate(area = earth_surf(lat, lon)) %>%
  group_by(basin, source) %>%
  summarise(area_total = sum(area)) %>%
  ungroup() %>%
  pivot_wider(values_from = area_total,
              names_from = source) %>%
  mutate(scaling_factor = M22 / SO4)


tcant_budget_basin_MLR <-
  tcant_inv %>%
  mutate(method = "layer",
         data_source = "obs") %>%
  group_by(basin) %>%
  nest() %>%
  mutate(budget = map(.x = data, ~m_dcant_budget(.x))) %>%
  select(-data) %>%
  unnest(budget)

tcant_budget_basin_MLR <-
  full_join(tcant_budget_basin_MLR,
            area_scaling %>% select(basin, scaling_factor)) %>%
  mutate(value = value * scaling_factor) %>%
  select(-scaling_factor)


tcant_budget_basin_MLR <-
  left_join(tcant_budget_basin_MLR %>%
              mutate(period = "1800 - 1994"),
            delta_pCO2_atm)


tcant_budget_basin_MLR <- tcant_budget_basin_MLR %>%
  filter(estimate == "dcant") %>%
  select(-estimate) %>%
  rename(dcant = value)

tcant_budget_basin_MLR <- tcant_budget_basin_MLR %>%
  mutate(beta_1994 = dcant / delta_pCO2) %>%
  select(basin, beta_1994)

tcant_budget_basin_MLR <-
  bind_rows(tcant_budget_basin_MLR,
            tibble(basin = "Global", beta_1994 = 118 / 78.3))
10.1 Scatterplots
10.1.1 Global
bind_rows(dcant_budget_global_all_no_adj,
          dcant_budget_global_all_ensemble) %>%
  ggplot(aes(period, dcant, col = Version_ID_group)) +
  geom_jitter() +
  scale_color_brewer(palette = "Dark2") +
  facet_grid(. ~ data_source)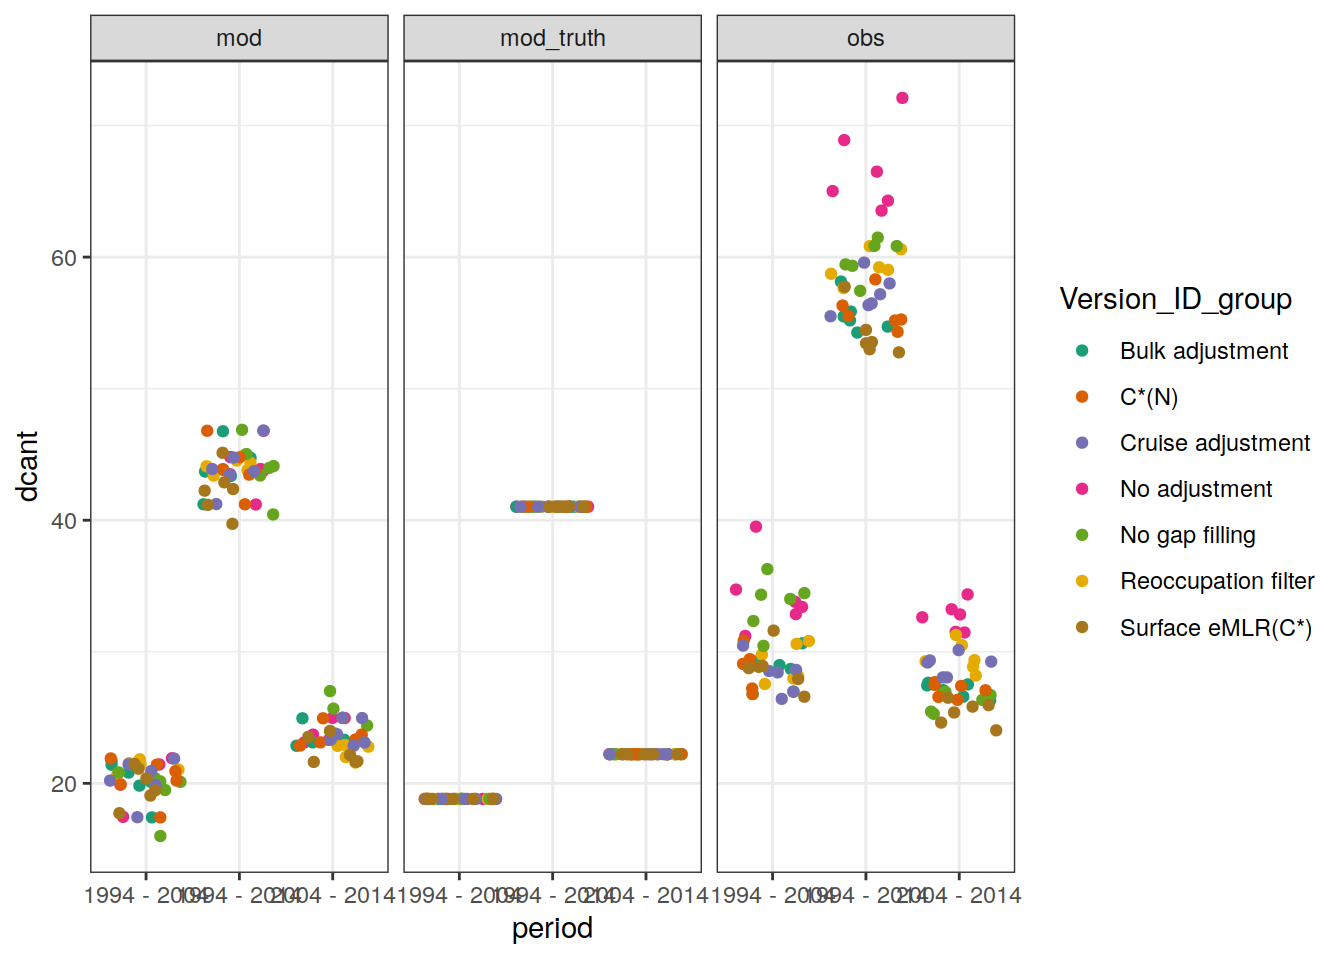
| Version | Author | Date |
|---|---|---|
| fea41c1 | jens-daniel-mueller | 2022-07-20 |
| d2ae54c | jens-daniel-mueller | 2022-07-18 |
| 2695085 | jens-daniel-mueller | 2022-07-17 |
| 535196a | jens-daniel-mueller | 2022-07-17 |
| d20faeb | jens-daniel-mueller | 2022-07-17 |
| afb27ad | jens-daniel-mueller | 2022-07-15 |
| b492b46 | jens-daniel-mueller | 2022-07-15 |
| bd24a0f | jens-daniel-mueller | 2022-07-15 |
| 17cd1d1 | jens-daniel-mueller | 2022-07-13 |
| 26e9496 | jens-daniel-mueller | 2022-07-12 |
| 8fb595c | jens-daniel-mueller | 2022-07-12 |
| 003b161 | jens-daniel-mueller | 2022-07-12 |
| 6be73e0 | jens-daniel-mueller | 2022-06-30 |
dcant_budget_global_all_ensemble_bias <-
dcant_budget_global_all_ensemble %>%
  filter(data_source != "obs") %>%
  pivot_wider(names_from = data_source,
              values_from = dcant) %>%
  mutate(dcant_bias = mod - mod_truth,
         dcant_bias_rel = 100*(mod - mod_truth)/mod_truth)

dcant_budget_global_all_ensemble_bias %>%
  ggplot(aes(period, dcant_bias, col = MLR_basins)) +
  geom_hline(yintercept = 0) +
  geom_jitter(width = 0.2) +
  scale_color_brewer(palette = "Dark2")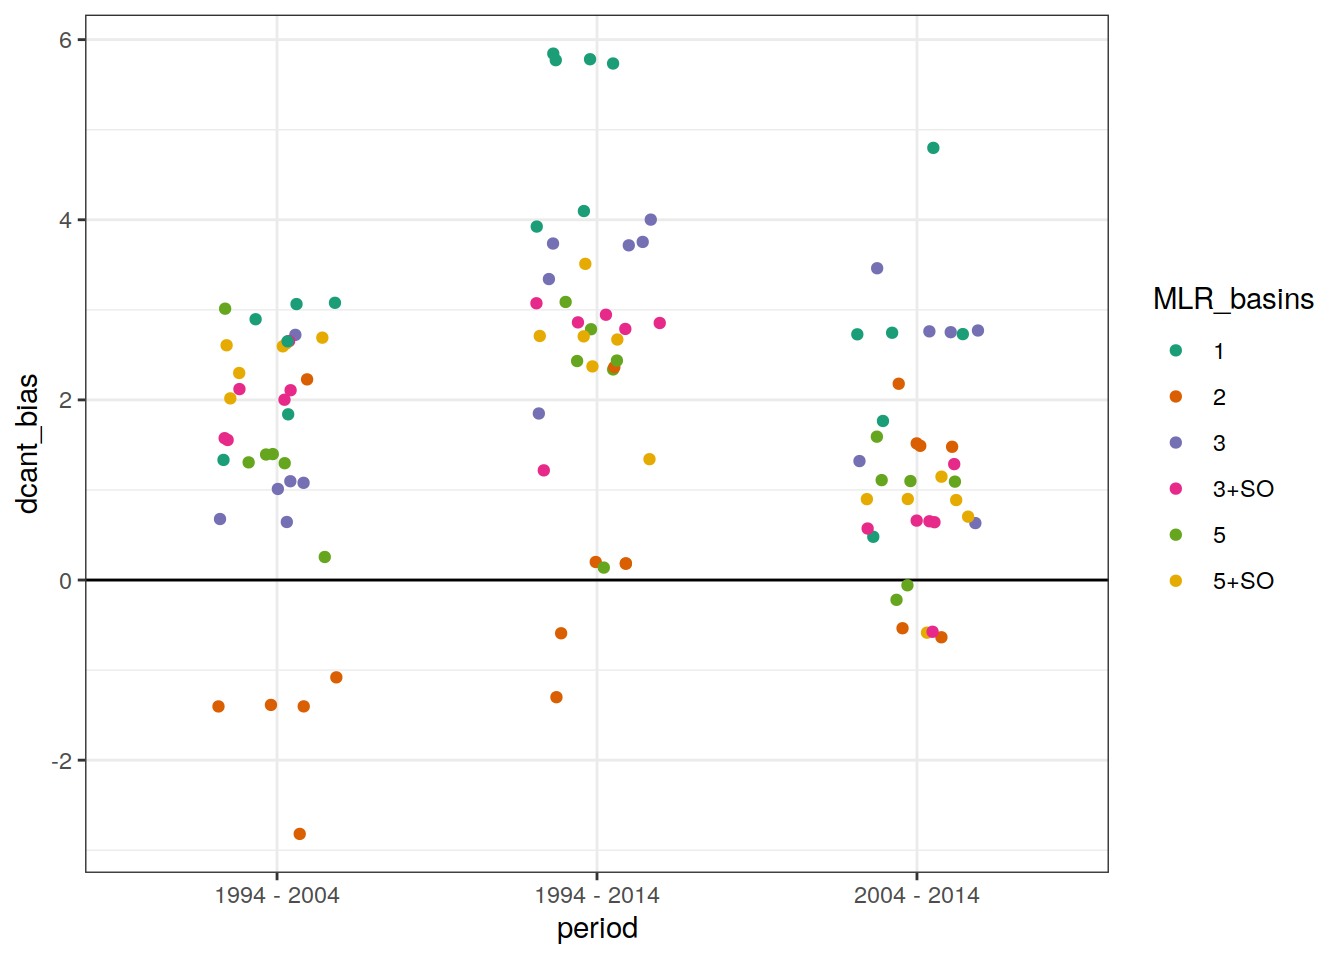
| Version | Author | Date |
|---|---|---|
| fea41c1 | jens-daniel-mueller | 2022-07-20 |
| d2ae54c | jens-daniel-mueller | 2022-07-18 |
| 535196a | jens-daniel-mueller | 2022-07-17 |
| 0160c40 | jens-daniel-mueller | 2022-07-16 |
| efa414b | jens-daniel-mueller | 2022-07-16 |
| afb27ad | jens-daniel-mueller | 2022-07-15 |
| b492b46 | jens-daniel-mueller | 2022-07-15 |
| bd24a0f | jens-daniel-mueller | 2022-07-15 |
| 17cd1d1 | jens-daniel-mueller | 2022-07-13 |
| 26e9496 | jens-daniel-mueller | 2022-07-12 |
| 8fb595c | jens-daniel-mueller | 2022-07-12 |
| 003b161 | jens-daniel-mueller | 2022-07-12 |
| 6be73e0 | jens-daniel-mueller | 2022-06-30 |
dcant_budget_global_all_ensemble_bias %>%
  ggplot(aes(period, dcant_bias_rel, col = MLR_basins)) +
  geom_hline(yintercept = 0) +
  geom_jitter(width = 0.2) +
  scale_color_brewer(palette = "Dark2")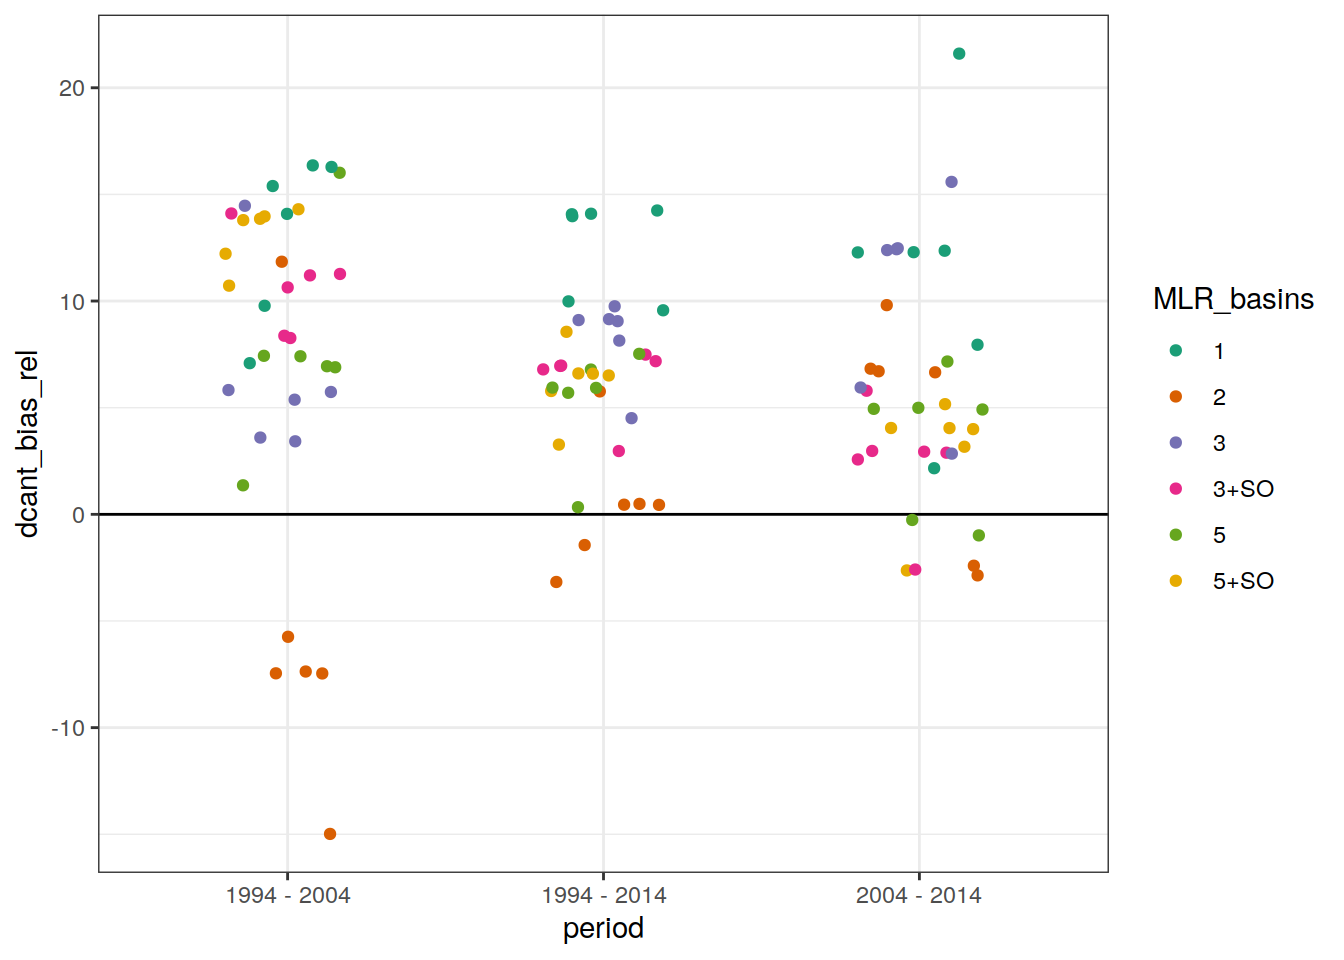
| Version | Author | Date |
|---|---|---|
| fea41c1 | jens-daniel-mueller | 2022-07-20 |
| d2ae54c | jens-daniel-mueller | 2022-07-18 |
| 535196a | jens-daniel-mueller | 2022-07-17 |
| d20faeb | jens-daniel-mueller | 2022-07-17 |
| efa414b | jens-daniel-mueller | 2022-07-16 |
| afb27ad | jens-daniel-mueller | 2022-07-15 |
| b492b46 | jens-daniel-mueller | 2022-07-15 |
| bd24a0f | jens-daniel-mueller | 2022-07-15 |
| 17cd1d1 | jens-daniel-mueller | 2022-07-13 |
| 8fb595c | jens-daniel-mueller | 2022-07-12 |
| 003b161 | jens-daniel-mueller | 2022-07-12 |
| 232909e | jens-daniel-mueller | 2022-07-01 |
dcant_budget_global_all_ensemble_bias %>%
  group_by(period) %>%
  summarise(dcant_bias_rel = mean(dcant_bias_rel)) %>%
  ungroup()
# A tibble: 3 × 2
period dcant_bias_rel
<chr> <dbl>
1 1994 - 2004 7.64
2 1994 - 2014 6.56
3 2004 - 2014 5.78delta_dcant_budget_global_all_ensemble <-
dcant_budget_global_all_ensemble %>%
filter(data_source != "obs",
period != "1994 - 2014") %>%
select(data_source, MLR_basins, Version_ID_group, tref1, dcant) %>%
pivot_wider(names_from = tref1,
values_from = dcant) %>%
mutate(delta_dcant = `2004` - `1994`)
delta_dcant_budget_global_all_ensemble %>%
ggplot(aes(data_source, delta_dcant, col = MLR_basins)) +
geom_hline(yintercept = 0) +
geom_jitter(width = 0.2) +
scale_color_brewer(palette = "Dark2")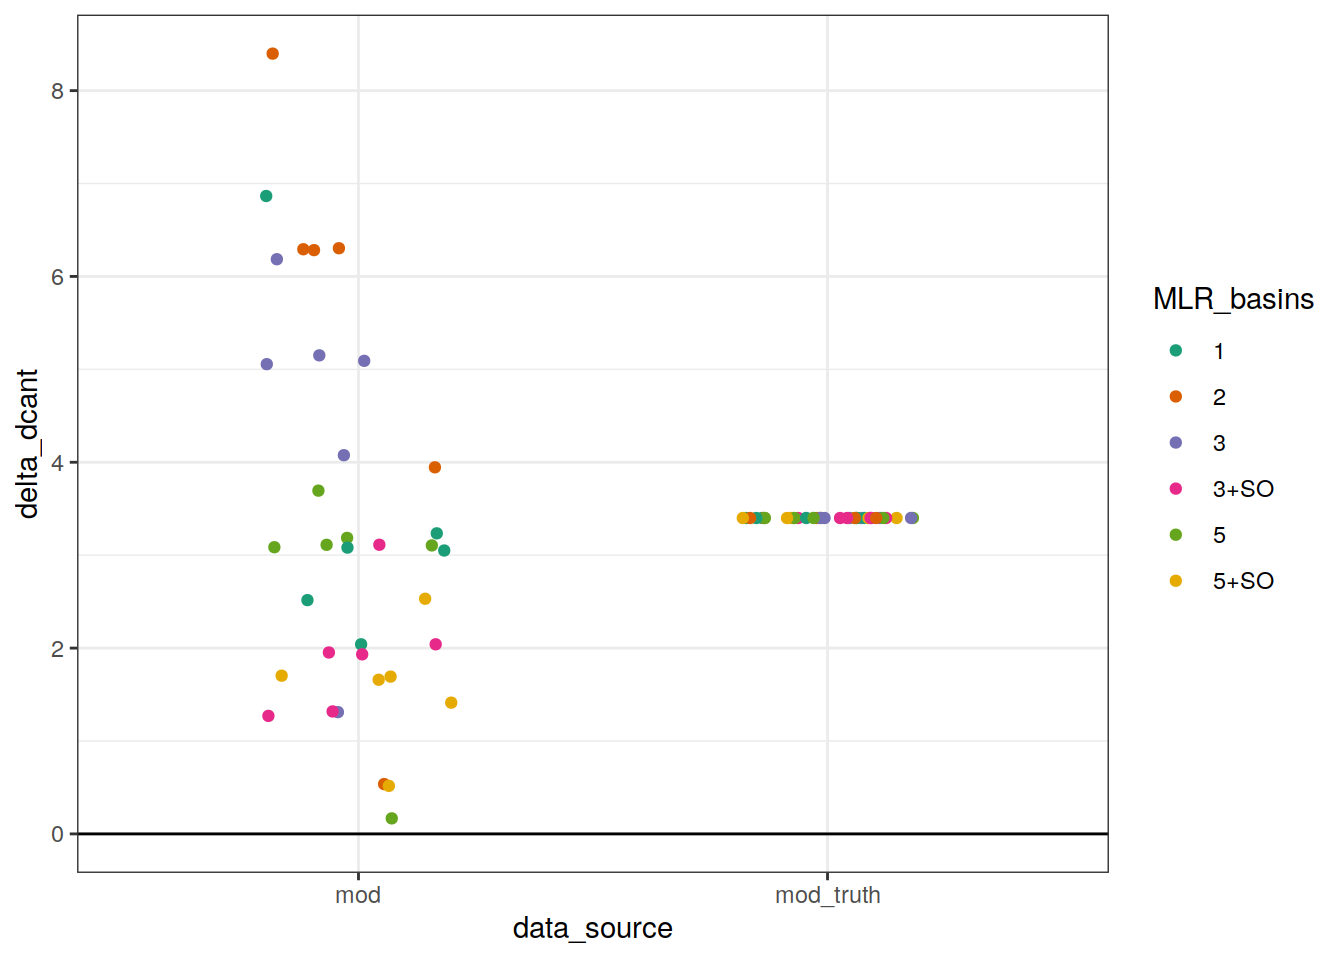
delta_dcant_budget_global_all_ensemble_bias <-
delta_dcant_budget_global_all_ensemble %>%
  select(data_source, MLR_basins, Version_ID_group, delta_dcant) %>%
  pivot_wider(names_from = data_source,
              values_from = delta_dcant) %>%
  mutate(delta_dcant_bias = mod - mod_truth,
         delta_dcant_bias_rel = 100*(mod - mod_truth)/mod_truth)


delta_dcant_budget_global_all_ensemble_bias %>%
  summarise(delta_dcant_bias = mean(delta_dcant_bias),
            delta_dcant_bias_rel = mean(delta_dcant_bias_rel))
# A tibble: 1 × 2
delta_dcant_bias delta_dcant_bias_rel
<dbl> <dbl>
1 -0.153 -4.49delta_dcant_budget_global_all_ensemble_bias %>%
group_by(MLR_basins) %>%
summarise(delta_dcant_bias = mean(delta_dcant_bias),
delta_dcant_bias_rel = mean(delta_dcant_bias_rel)) %>%
ungroup()# A tibble: 6 × 3
MLR_basins delta_dcant_bias delta_dcant_bias_rel
<chr> <dbl> <dbl>
1 1 0.0645 1.90
2 2 1.89 55.7
3 3 1.08 31.7
4 3+SO -1.46 -43.0
5 5 -0.675 -19.9
6 5+SO -1.81 -53.4 delta_dcant_budget_global_all_ensemble_bias %>%
ggplot(aes("Decade difference",delta_dcant_bias, col = MLR_basins)) +
geom_hline(yintercept = 0) +
geom_jitter(width = 0.2) +
scale_color_brewer(palette = "Dark2") +
theme(axis.title.x = element_blank())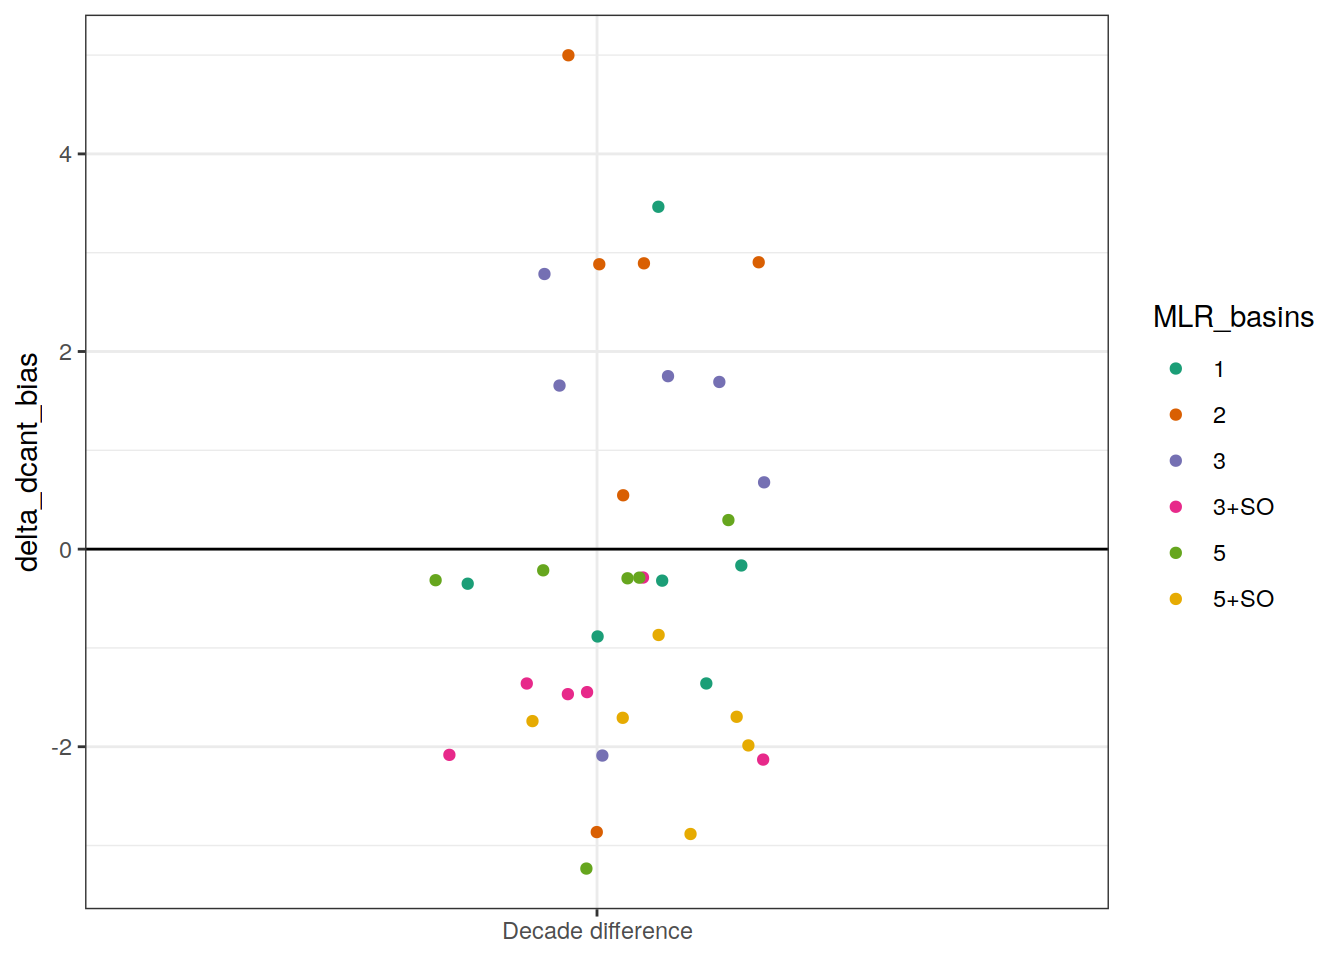
delta_dcant_budget_global_all_ensemble_bias %>%
  ggplot(aes("Decade difference",delta_dcant_bias_rel, col = MLR_basins)) +
  geom_hline(yintercept = 0) +
  geom_jitter(width = 0.2) +
  scale_color_brewer(palette = "Dark2") +
  theme(axis.title.x = element_blank())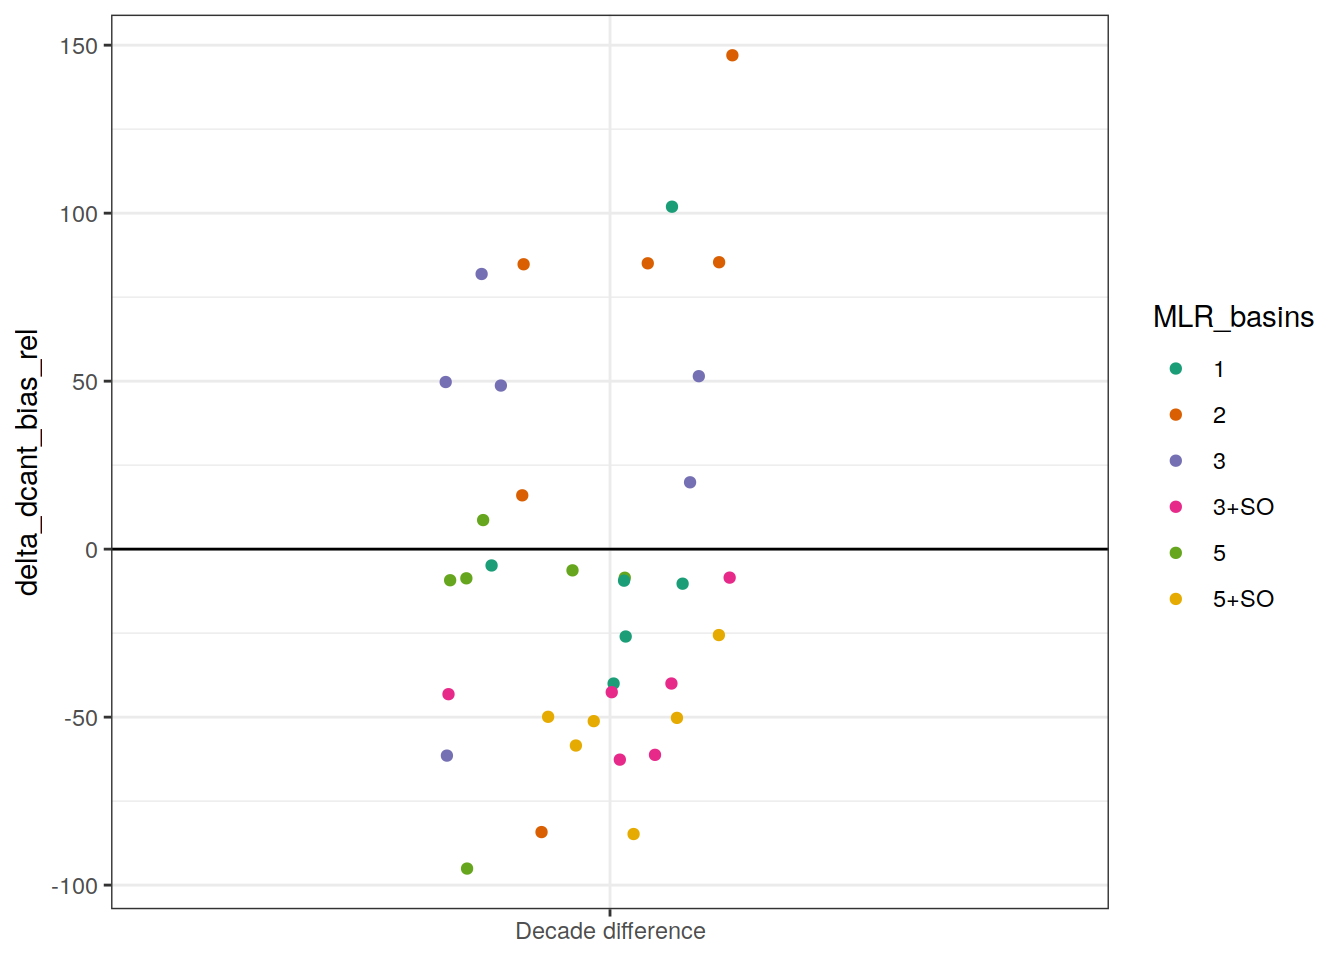
dcant_budget_global_all_ensemble %>%
  filter(data_source == "obs",
         period != "1994 - 2014",
         !(Version_ID %in% Version_IDs)) %>%
  ggplot(aes(period, dcant)) +
  scale_fill_manual(values = c("grey50", "red", "white")) +
  geom_point(
    data = dcant_budget_global_all_no_adj %>%
      filter(data_source == "obs",
             period != "1994 - 2014"),
    aes(fill = "Unadjusted data"),
    alpha = .7,
    shape = 21,
    position = position_dodge2(width = 0.3)
  ) +
  geom_point(
    aes(fill = "Ensemble member"),
    alpha = .5,
    shape = 21,
    position = position_dodge2(width = 0.3)
  ) +
  geom_linerange(
    data = dcant_budget_ensemble_stat %>%
      filter(basin == "Global"),
    aes(
      x = period,
      y = std_case,
      ymin = std_case - sd,
      ymax = std_case + sd
    ),
    col = "red"
  ) +
  geom_point(
    data = dcant_budget_ensemble_stat %>%
      filter(basin == "Global"),
    aes(x = period,
        y = std_case,
        fill = "Standard case"),
    size = 2,
    shape = 21
  ) +
  scale_y_continuous(name = dcant_pgc_label, breaks = seq(0, 100, 2)) +
  theme(legend.title = element_blank(),
        axis.title.x = element_blank(),
        legend.position = c(0.65,0.85),
        legend.background = element_rect(colour = "grey"))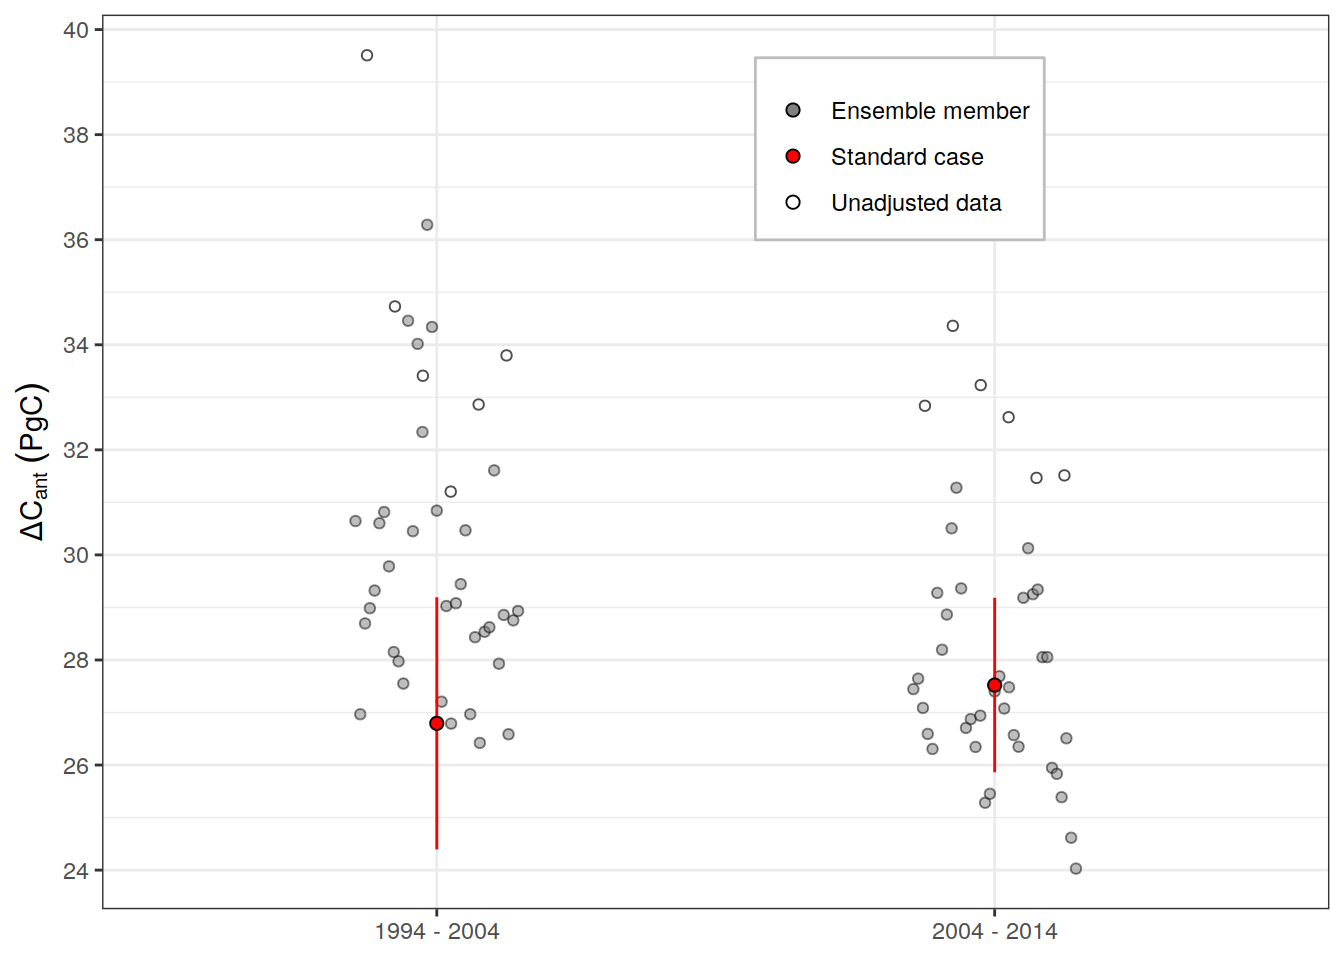
dcant_budget_global_all_ensemble %>%
  mutate(ensemble_role = case_when(Version_ID %in% Version_IDs ~ "Standard case",
                                   TRUE ~ "others")) %>%
  filter(data_source == "obs",
         period != "1994 - 2014") %>%
  ggplot(aes(period, dcant)) +
  scale_fill_brewer(palette = "Dark2", name = "ensemble group") +
  scale_color_manual(values = c("black", "red", "grey"),
                     name = "Ensemble member") +
  geom_boxplot(
    width = .1,
    outlier.shape = NA,
    fill = "grey",
    alpha = 0.7,
    position = position_nudge(x = 0.3)
  ) +
  geom_point(
    data = dcant_budget_global_all_no_adj %>%
      mutate(ensemble_role = "unadjusted") %>%
      filter(data_source == "obs",
             period != "1994 - 2014"),
    aes(col = ensemble_role),
    size = 2,
    alpha = .7,
    shape = 21,
    position = position_dodge2(width = 0.3)
  ) +
  geom_point(
    aes(fill = Version_ID_group,
        col = ensemble_role),
    size = 2,
    alpha = .5,
    shape = 21,
    position = position_dodge2(width = 0.3)
  ) +
  scale_y_continuous(name = dcant_pgc_label, breaks = seq(0, 100, 2))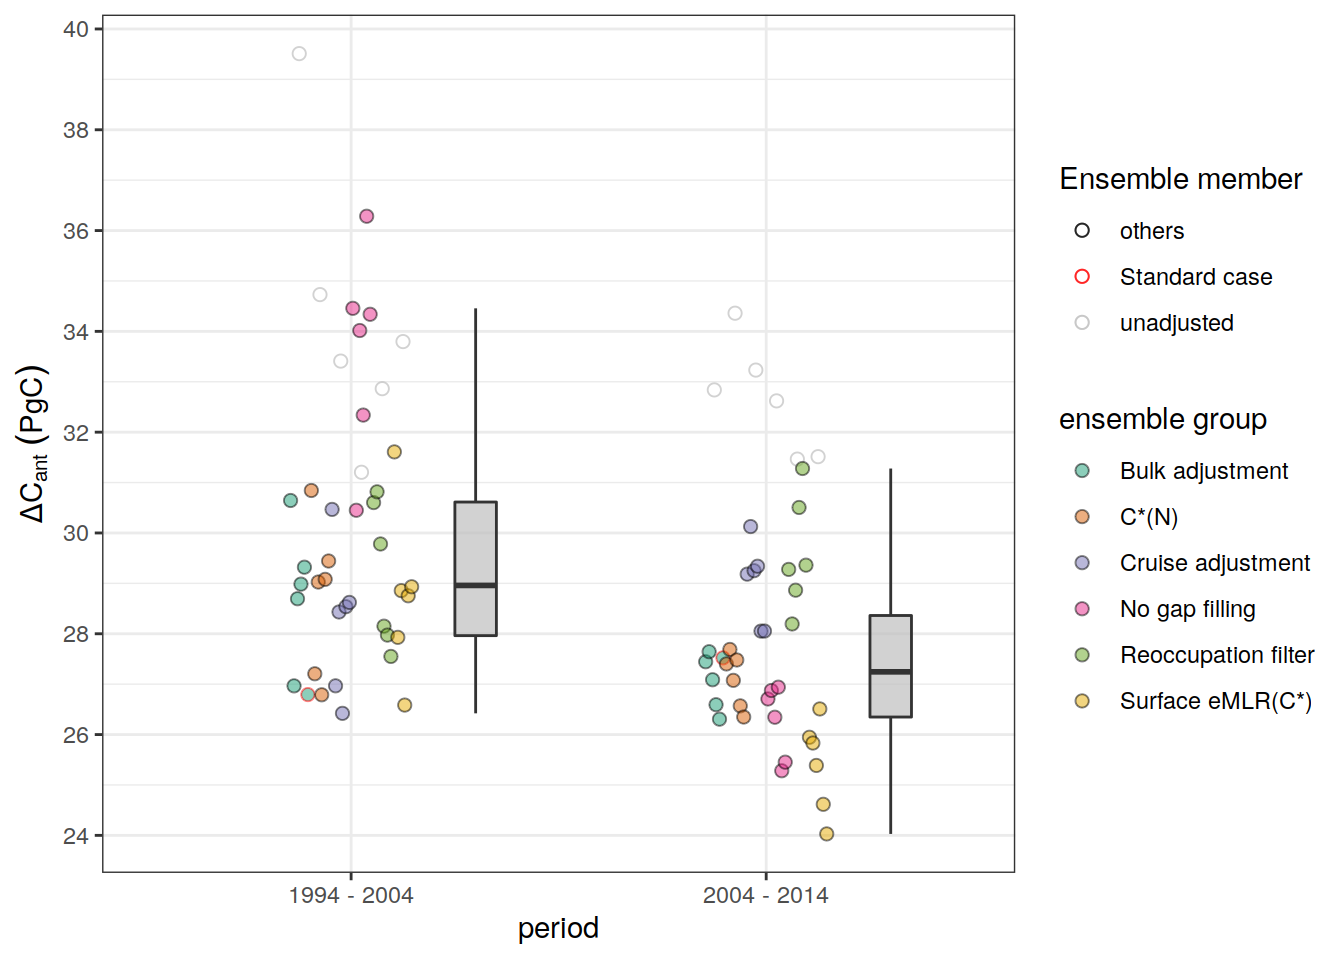
dcant_budget_global_all_ensemble %>%
  mutate(ensemble_role = if_else(Version_ID %in% Version_IDs,
                                 "Standard case",
                                 "others")) %>%
  filter(data_source == "obs",
         period != "1994 - 2014") %>%
  ggplot(aes(period, dcant)) +
  scale_fill_brewer(palette = "Dark2") +
  scale_color_manual(values = c("grey", "red"),
                     name = "Ensemble member") +
  geom_boxplot(
    width = .1,
    outlier.shape = NA,
    fill = "grey",
    alpha = 0.7,
    position = position_nudge(x = 0.3)
  ) +
  geom_point(
    aes(group = Version_ID_group,
        fill = MLR_basins,
        col = ensemble_role),
    size = 1.3,
    alpha = .7,
    shape = 21,
    position = position_dodge2(width = 0.3)
  ) +
  stat_summary(
    fun.data = "mean_sdl",
    fun.args = list(mult = 2),
    position = position_nudge(x = -0.3),
    col = "grey"
  ) +
  stat_summary(
    fun.data = "mean_sdl",
    fun.args = list(mult = 1),
    position = position_nudge(x = -0.3)
  ) +
  scale_y_continuous(name = dcant_pgc_label, breaks = seq(0, 100, 2))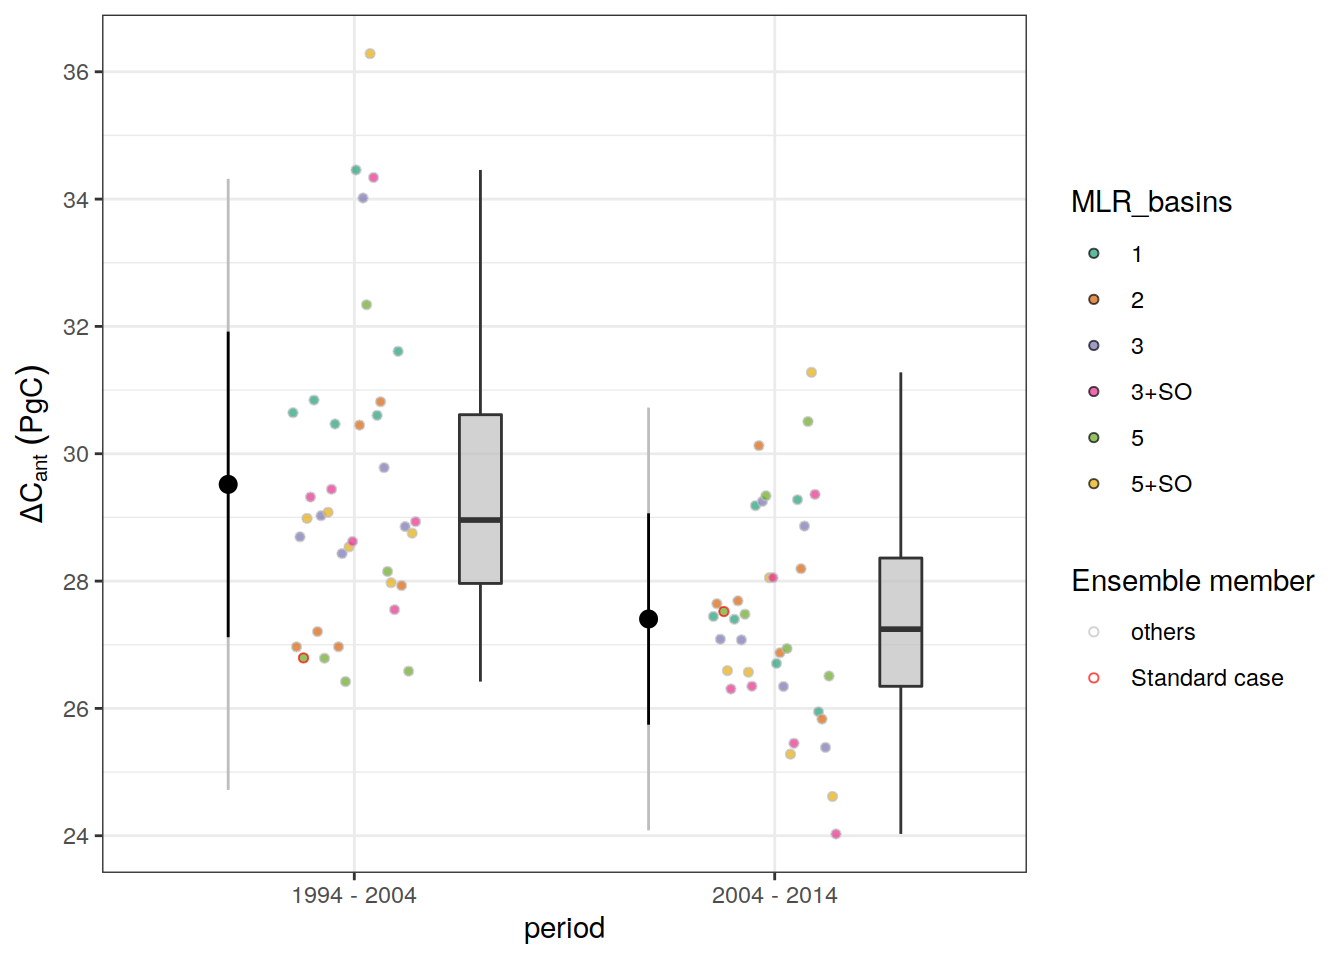
beta_budget_global_all_ensemble <-
  full_join(dcant_budget_global_all_ensemble,
            delta_pCO2_atm) %>%
  mutate(beta = dcant / delta_pCO2)


beta_budget_global_all_ensemble %>%
  mutate(ensemble_role = case_when(Version_ID %in% Version_IDs ~ "Standard case",
                                   TRUE ~ "others")) %>%
  filter(data_source == "obs",
         period != "1994 - 2014") %>%
  ggplot(aes(period, beta)) +
  scale_fill_brewer(palette = "Dark2", name = "ensemble group") +
  scale_color_manual(values = c("black", "red", "grey"),
                     name = "Ensemble member") +
  geom_boxplot(
    width = .1,
    outlier.shape = NA,
    fill = "grey",
    alpha = 0.7,
    position = position_nudge(x = 0.3)
  ) +
  geom_point(
    aes(fill = Version_ID_group,
        col = ensemble_role),
    size = 2,
    alpha = .5,
    shape = 21,
    position = position_dodge2(width = 0.3)
  ) +
  scale_y_continuous(name = dcant_pgc_scaled_label)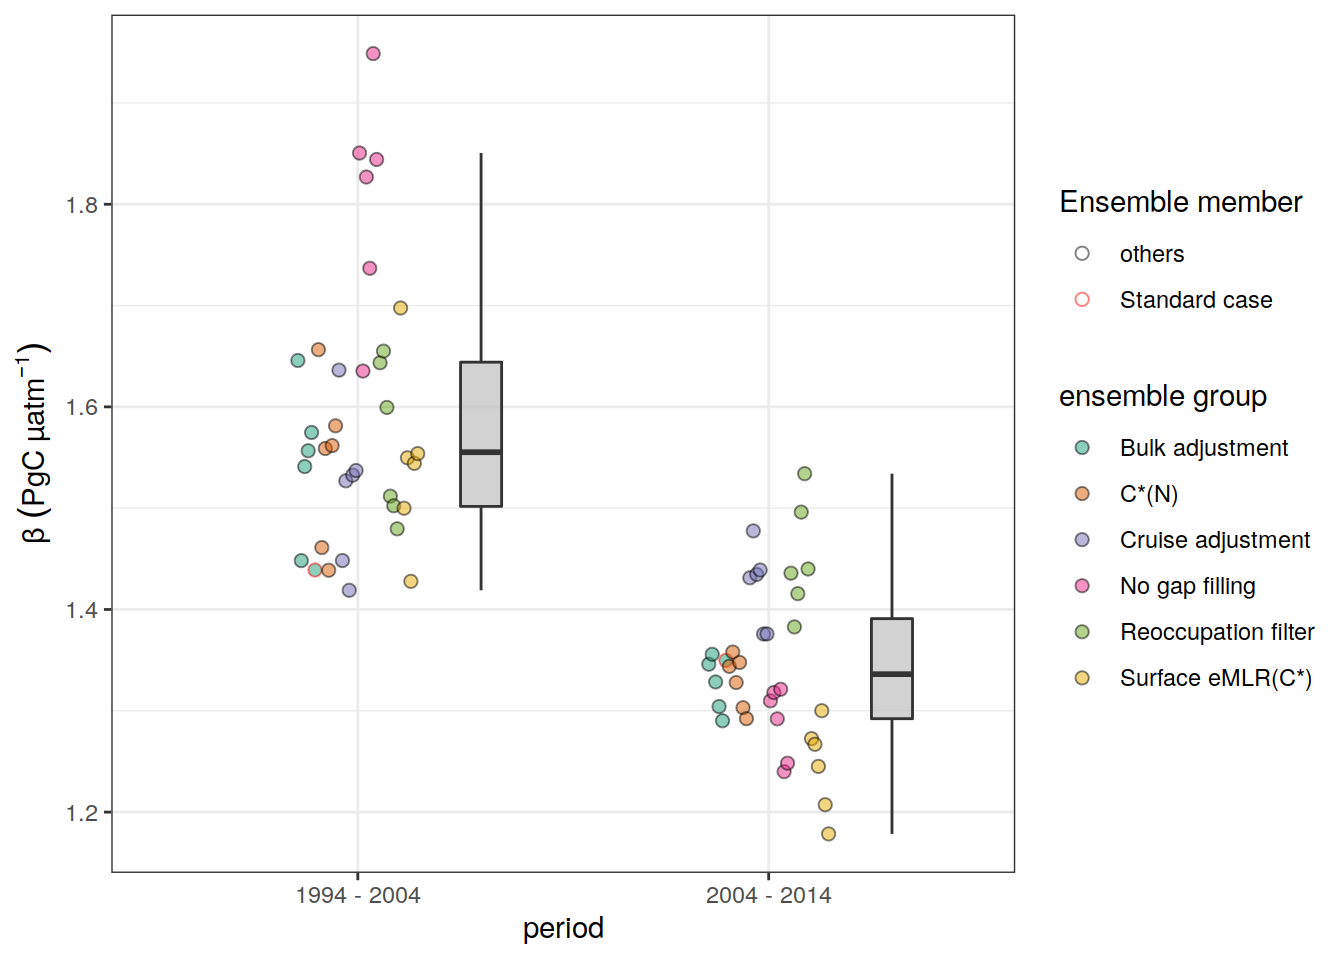
| Version | Author | Date |
|---|---|---|
| fea41c1 | jens-daniel-mueller | 2022-07-20 |
| d2ae54c | jens-daniel-mueller | 2022-07-18 |
| 2695085 | jens-daniel-mueller | 2022-07-17 |
| 535196a | jens-daniel-mueller | 2022-07-17 |
| d20faeb | jens-daniel-mueller | 2022-07-17 |
| afb27ad | jens-daniel-mueller | 2022-07-15 |
| b492b46 | jens-daniel-mueller | 2022-07-15 |
| bd24a0f | jens-daniel-mueller | 2022-07-15 |
| 022fd60 | jens-daniel-mueller | 2022-07-14 |
10.1.2 basin hemisphere
dcant_budget_basin_MLR_all_ensemble %>%
  ggplot(aes(period, dcant, col = Version_ID_group)) +
  geom_jitter(alpha = 0.5) +
  scale_color_brewer(palette = "Dark2") +
  facet_grid(basin ~ data_source, scales = "free_y")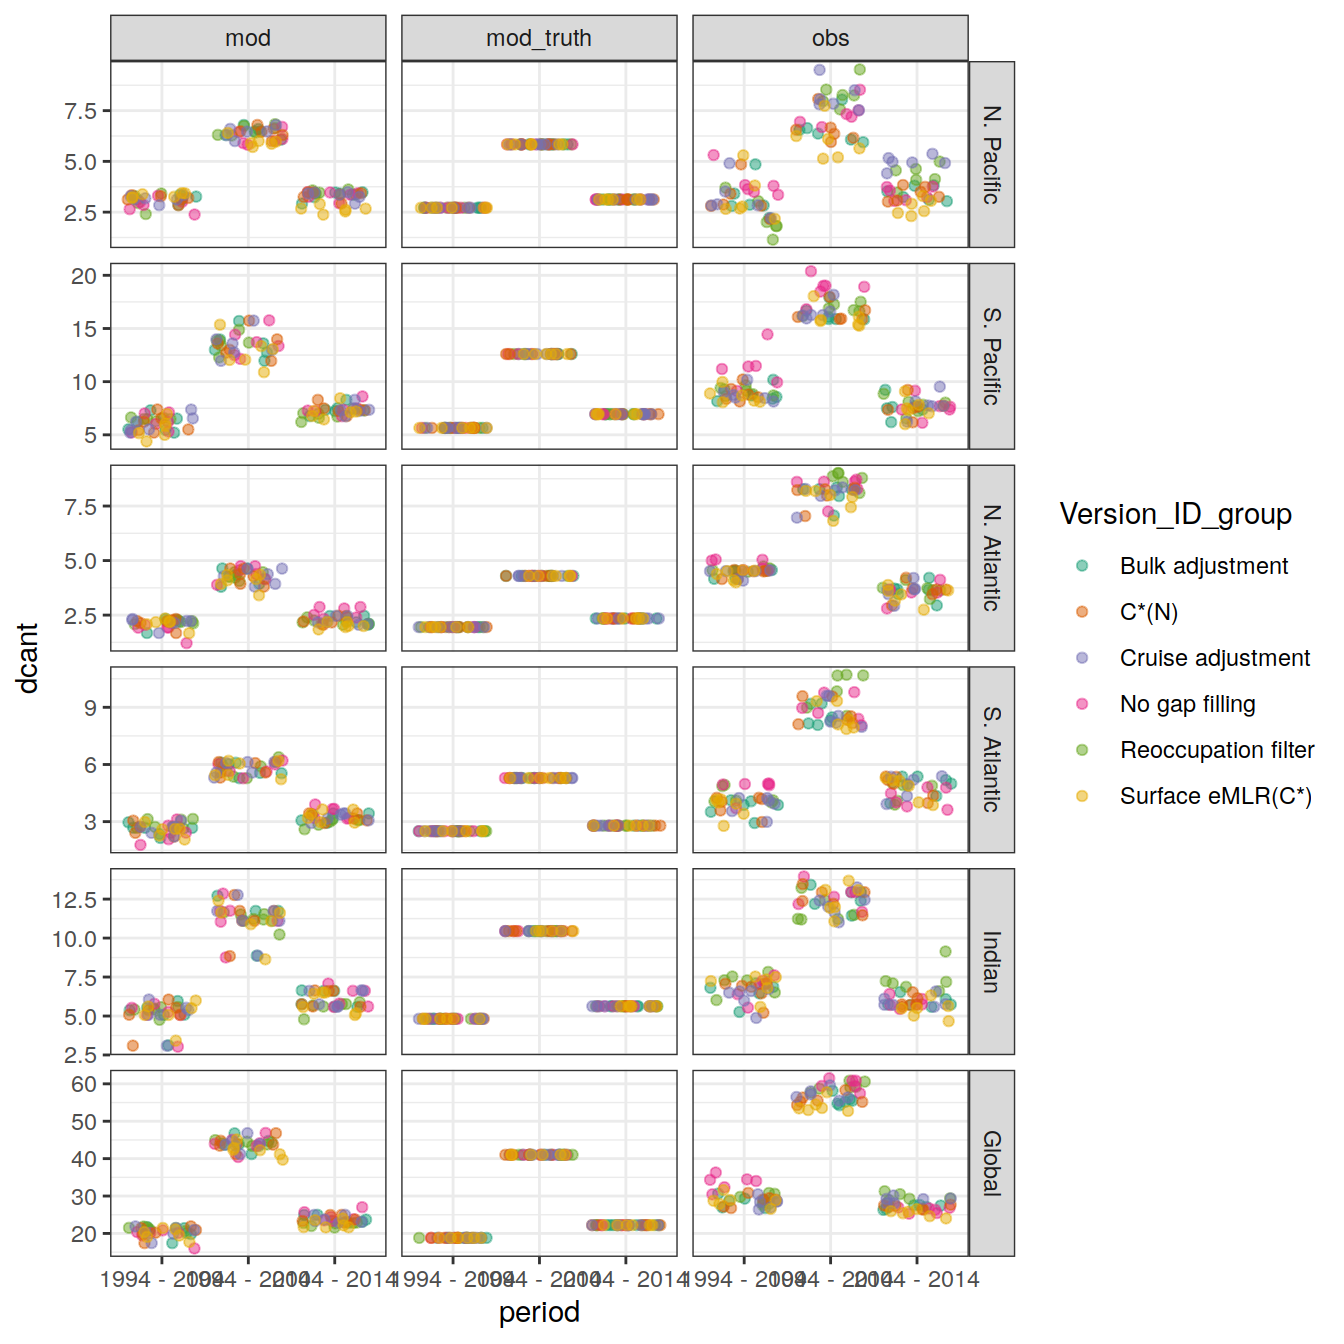
| Version | Author | Date |
|---|---|---|
| fea41c1 | jens-daniel-mueller | 2022-07-20 |
| d2ae54c | jens-daniel-mueller | 2022-07-18 |
| 2695085 | jens-daniel-mueller | 2022-07-17 |
| 535196a | jens-daniel-mueller | 2022-07-17 |
| d20faeb | jens-daniel-mueller | 2022-07-17 |
| efa414b | jens-daniel-mueller | 2022-07-16 |
| afb27ad | jens-daniel-mueller | 2022-07-15 |
| b492b46 | jens-daniel-mueller | 2022-07-15 |
| bd24a0f | jens-daniel-mueller | 2022-07-15 |
| 17cd1d1 | jens-daniel-mueller | 2022-07-13 |
| 8fb595c | jens-daniel-mueller | 2022-07-12 |
| 003b161 | jens-daniel-mueller | 2022-07-12 |
| df21d31 | jens-daniel-mueller | 2022-07-01 |
| 6be73e0 | jens-daniel-mueller | 2022-06-30 |
tcant_budget_basin_MLR <- expand_grid(
  tcant_budget_basin_MLR,
  delta_pCO2_atm %>% filter(period %in% two_decades)
)

tcant_budget_basin_MLR <- tcant_budget_basin_MLR %>%
  mutate(dcant = beta_1994 * delta_pCO2)

tcant_budget_basin_MLR <- tcant_budget_basin_MLR %>%
  mutate(
    basin = fct_relevel(
      basin,
      "N. Pacific",
      "S. Pacific",
      "N. Atlantic",
      "S. Atlantic",
      "Indian",
      "Global"
    )
  )

dcant_budget_basin_MLR_all_ensemble %>%
  filter(data_source == "obs",
         period != "1994 - 2014",
         !(Version_ID %in% Version_IDs)) %>%
  ggplot(aes(period, dcant)) +
  geom_errorbar(
    data = tcant_budget_basin_MLR,
    aes(x = period,
        ymax = dcant, ymin = dcant,
        col = "Scaled 1994\nestimate"),
    width = 0.5,
    linetype = 2,
    position = position_nudge(x = 0.1)
  ) +
  geom_jitter(
    data = dcant_budget_basin_MLR_all_no_adj %>%
      filter(data_source == "obs",
             period != "1994 - 2014"),
    aes(fill = "Unadjusted data",
        alpha = "Unadjusted data"),
    shape = 21,
    position = position_jitter(width = 0.1, height = 0)
  ) +
  geom_point(
    aes(fill = "Ensemble member",
        alpha = "Ensemble member"),
    shape = 21,
    position = position_jitter(width = 0.1, height = 0)
  ) +
  geom_crossbar(
    data = dcant_budget_ensemble_stat,
    aes(
      x = period,
      y = std_case,
      ymin = std_case - 2*sd,
      ymax = std_case + 2*sd,
      linetype = "Ensemble SD"
    ),
    width = 0.1,
    fill = "#AA3377",
    alpha = 0.2,
    position = position_nudge(x = 0.2)
  ) +
  geom_crossbar(
    data = dcant_budget_ensemble_stat,
    aes(
      x = period,
      y = std_case,
      ymin = std_case - sd,
      ymax = std_case + sd,
      alpha = "Ensemble SD",
    ),
    width = 0.1,
    fill = "#AA3377",
    alpha = 0.4,
    position = position_nudge(x = 0.2)
  ) +
  geom_point(
    data = dcant_budget_ensemble_stat,
    aes(x = period,
        y = std_case,
        fill = "Standard case",
        alpha = "Standard case"),
    size = 2,
    shape = 21,
    position = position_nudge(x = 0.2)
  ) +
  scale_fill_manual(name = "group", values = c("#BB5566", "white", "#BBBBBB")) +
  scale_color_manual(values = c("grey50"), label = expression(Scaled~C[ant]~1994)) +
  scale_linetype(name = "X") +
  scale_alpha_manual(name = "group", values = c(0.5,1,0.5)) +
  scale_shape_manual(values = 95) +
  scale_y_continuous(name = dcant_pgc_label) +
  guides(
    fill = guide_legend(order = 1),
    linetype = guide_legend(order = 2),
    alpha = guide_legend(order = 1)
  ) +
  facet_wrap(~ basin, ncol = 3, dir = "v", scales = "free_y") +
  theme(legend.title = element_blank(),
        axis.title.x = element_blank())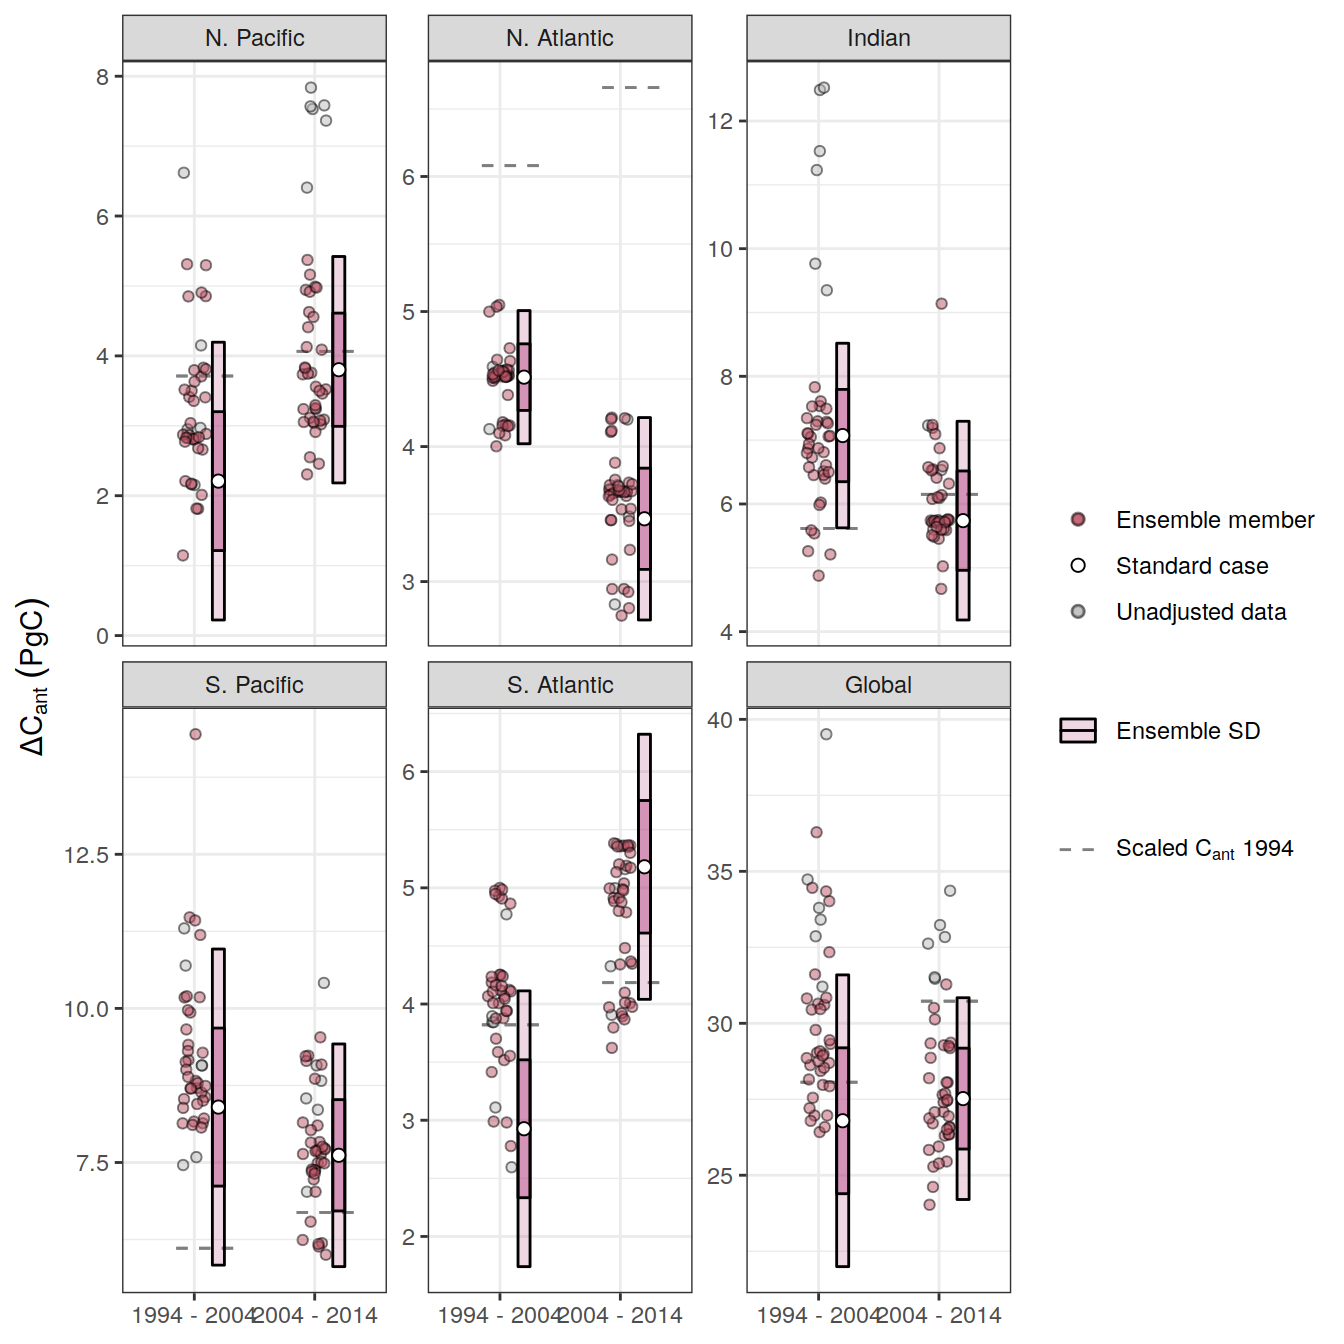
| Version | Author | Date |
|---|---|---|
| 5b77c4f | jens-daniel-mueller | 2022-08-10 |
| a691b29 | jens-daniel-mueller | 2022-08-09 |
| 910f96e | jens-daniel-mueller | 2022-08-08 |
| fea41c1 | jens-daniel-mueller | 2022-07-20 |
| d803308 | jens-daniel-mueller | 2022-07-19 |
| d2ae54c | jens-daniel-mueller | 2022-07-18 |
| 2695085 | jens-daniel-mueller | 2022-07-17 |
| 535196a | jens-daniel-mueller | 2022-07-17 |
| d20faeb | jens-daniel-mueller | 2022-07-17 |
| afb27ad | jens-daniel-mueller | 2022-07-15 |
| b492b46 | jens-daniel-mueller | 2022-07-15 |
| bd24a0f | jens-daniel-mueller | 2022-07-15 |
| 022fd60 | jens-daniel-mueller | 2022-07-14 |
| 17cd1d1 | jens-daniel-mueller | 2022-07-13 |
| 26e9496 | jens-daniel-mueller | 2022-07-12 |
| 8fb595c | jens-daniel-mueller | 2022-07-12 |
| 003b161 | jens-daniel-mueller | 2022-07-12 |
| df21d31 | jens-daniel-mueller | 2022-07-01 |
| 6be73e0 | jens-daniel-mueller | 2022-06-30 |
ggsave(path = here::here("output/publication"),
       filename = "Fig_dcant_budgets_ensemble_member.png",
       height = 6,
       width = 8)


dcant_budget_basin_MLR_all_ensemble %>%
  mutate(ensemble_role = if_else(Version_ID %in% Version_IDs,
                                 "Standard case",
                                 "others")) %>%
  filter(data_source == "obs",
         period != "1994 - 2014") %>%
  ggplot(aes(period, dcant)) +
  scale_fill_brewer(palette = "Dark2", name = "ensemble group") +
  scale_color_manual(values = c("grey", "black", "red"),
                     name = "Ensemble member") +
  geom_boxplot(
    width = .1,
    outlier.shape = NA,
    fill = "grey",
    alpha = 0.7,
    position = position_nudge(x = 0.3)
  ) +
  geom_point(
    data = dcant_budget_basin_MLR_all_no_adj %>%
      mutate(ensemble_role = "no adjustment") %>%
      filter(data_source == "obs",
         period != "1994 - 2014"),
    aes(fill = Version_ID_group,
        col = ensemble_role),
    size = 1.3,
    alpha = .7,
    shape = 21,
    position = position_dodge2(width = 0.3)
  ) +
  geom_point(
    aes(fill = Version_ID_group,
        col = ensemble_role),
    size = 1.3,
    alpha = .7,
    shape = 21,
    position = position_dodge2(width = 0.3)
  ) +
  scale_y_continuous(name = dcant_pgc_label) +
  facet_wrap(~ basin, ncol = 3, scales = "free_y")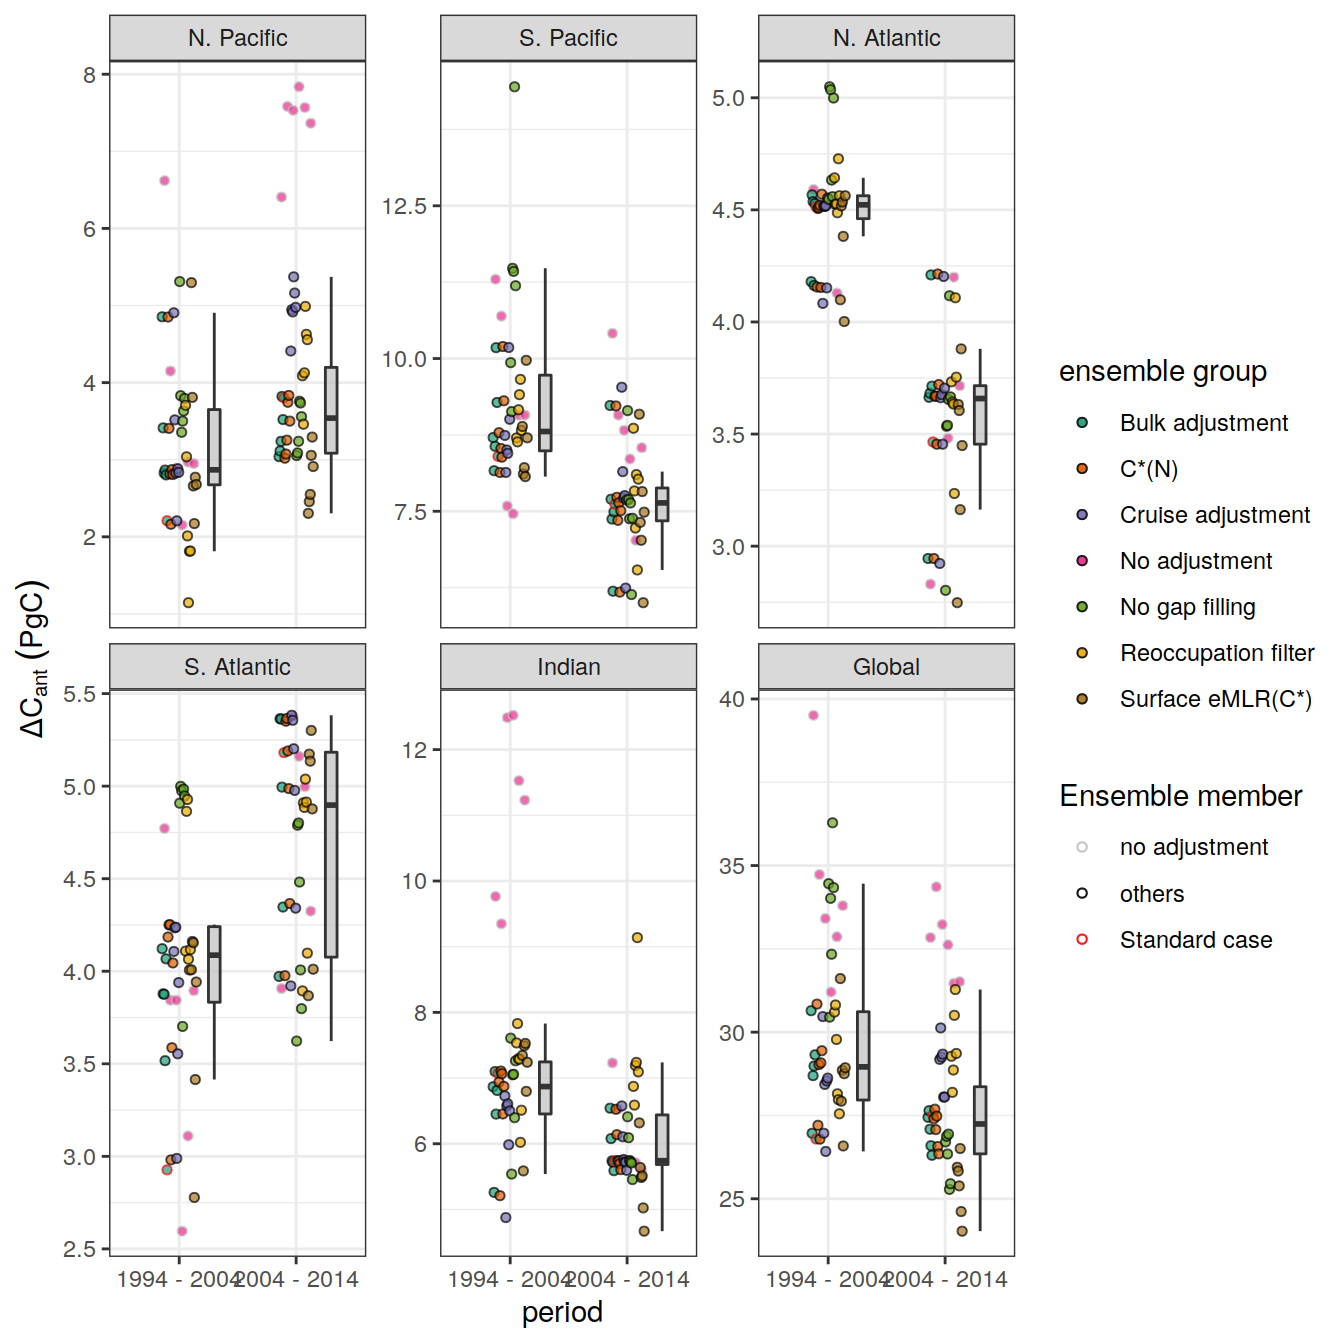
| Version | Author | Date |
|---|---|---|
| a691b29 | jens-daniel-mueller | 2022-08-09 |
| 910f96e | jens-daniel-mueller | 2022-08-08 |
| fea41c1 | jens-daniel-mueller | 2022-07-20 |
| d2ae54c | jens-daniel-mueller | 2022-07-18 |
| 2695085 | jens-daniel-mueller | 2022-07-17 |
| 535196a | jens-daniel-mueller | 2022-07-17 |
| d20faeb | jens-daniel-mueller | 2022-07-17 |
| afb27ad | jens-daniel-mueller | 2022-07-15 |
| b492b46 | jens-daniel-mueller | 2022-07-15 |
| bd24a0f | jens-daniel-mueller | 2022-07-15 |
| 022fd60 | jens-daniel-mueller | 2022-07-14 |
| 17cd1d1 | jens-daniel-mueller | 2022-07-13 |
| 8fb595c | jens-daniel-mueller | 2022-07-12 |
| 003b161 | jens-daniel-mueller | 2022-07-12 |
| 232909e | jens-daniel-mueller | 2022-07-01 |
dcant_budget_basin_MLR_all_ensemble %>%
   mutate(ensemble_role = if_else(Version_ID %in% Version_IDs,
                                 "Standard case",
                                 "others")) %>%
  filter(data_source == "obs",
         period != "1994 - 2014") %>%
  ggplot(aes(period, dcant)) +
  scale_fill_brewer(palette = "Dark2") +
  scale_color_manual(values = c("grey", "red"),
                     name = "Ensemble member") +
  geom_boxplot(
    width = .1,
    outlier.shape = NA,
    fill = "grey",
    alpha = 0.7,
    position = position_nudge(x = 0.3)
  ) +
  geom_point(
    aes(fill = MLR_basins,
        col = ensemble_role),
    size = 1.3,
    alpha = .7,
    shape = 21,
    position = position_dodge2(width = 0.3)
  ) +
  stat_summary(
    fun.data = "mean_sdl",
    fun.args = list(mult = 2),
    position = position_nudge(x = -0.3),
    col = "grey"
  ) +
  stat_summary(
    fun.data = "mean_sdl",
    fun.args = list(mult = 1),
    position = position_nudge(x = -0.3)
  ) +
  scale_y_continuous(name = dcant_pgc_label) +
  facet_wrap(~ basin, ncol = 3, scales = "free_y")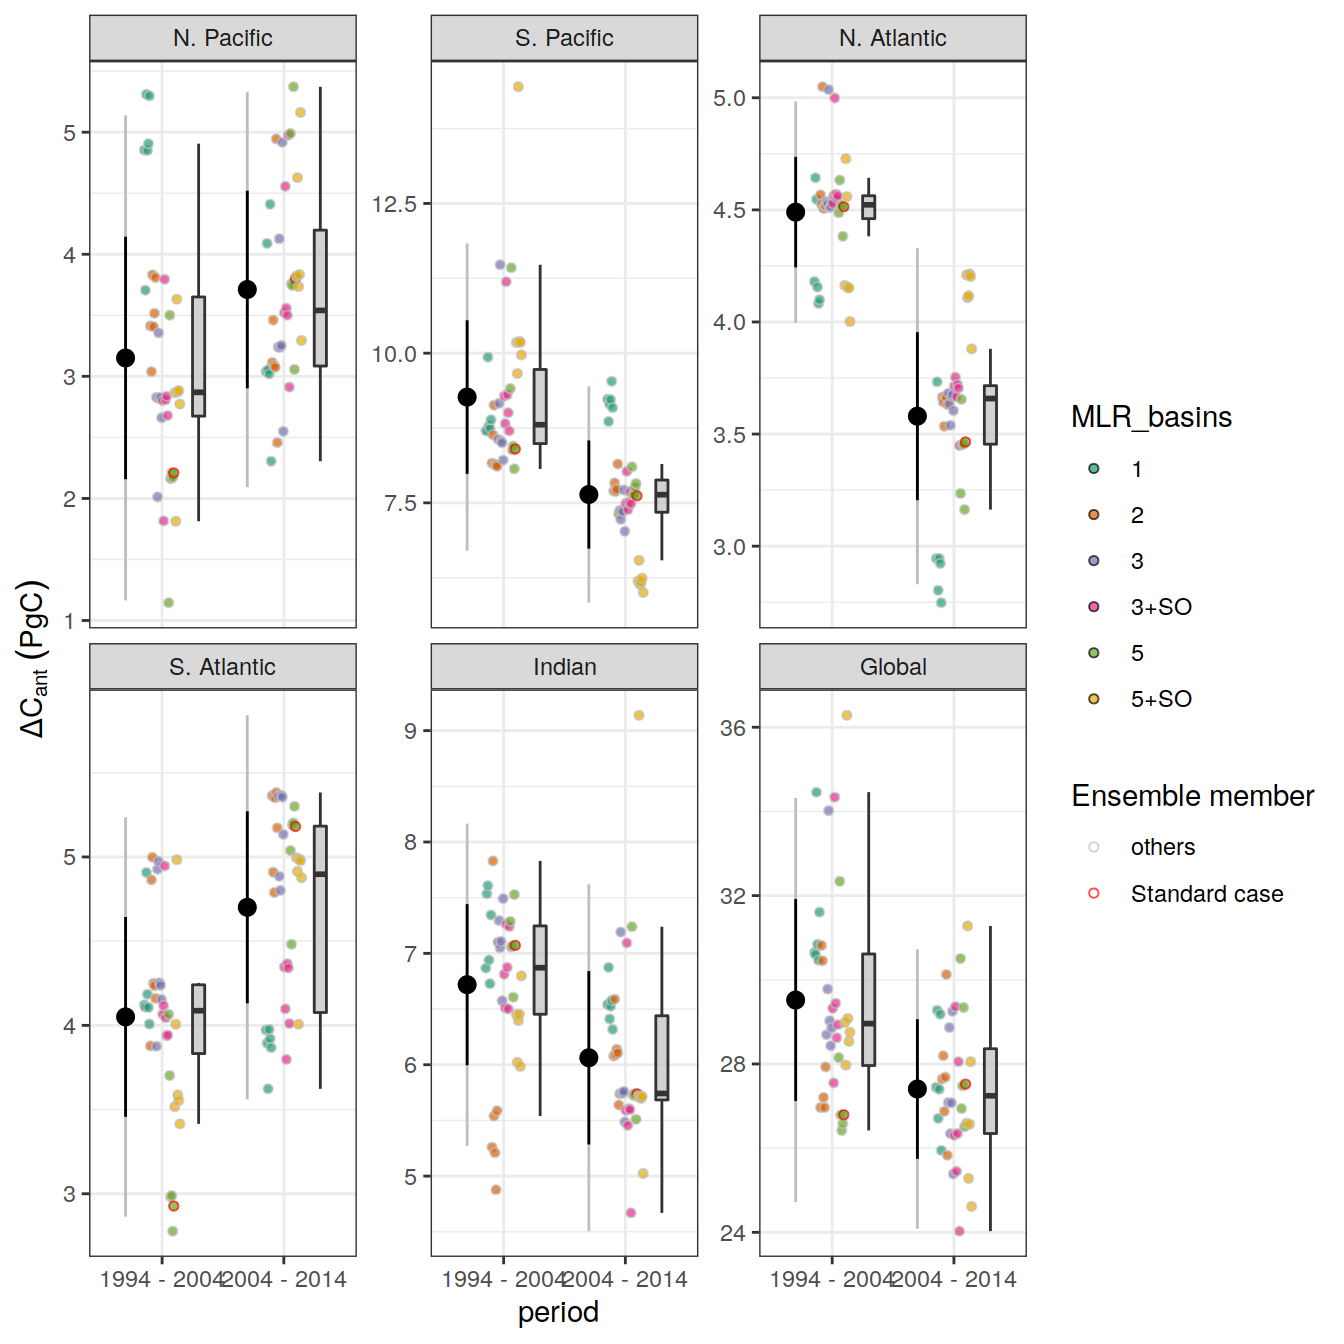
dcant_budget_basin_MLR_all_ensemble_summary <- dcant_budget_basin_MLR_all_ensemble %>%
  group_by(data_source, basin, period) %>%
  summarise(dcant_mean = mean(dcant),
            dcant_sd = sd(dcant)*2) %>%
  ungroup()

dcant_budget_global_all_ensemble_summary <-
  dcant_budget_basin_MLR_all_ensemble %>%
  filter(period != "1994 - 2014") %>%
  group_by(data_source, Version_ID, tref1, tref2, period) %>%
  summarise(dcant = sum(dcant)) %>%
  ungroup() %>%
  group_by(data_source, tref1, tref2, period) %>%
  summarise(dcant_mean = mean(dcant),
            dcant_sd = sd(dcant)*2) %>%
  ungroup() %>%
  filter(data_source == "obs")
beta_budget_basin_MLR_all_no_adj <-
full_join(dcant_budget_basin_MLR_all_no_adj,
delta_pCO2_atm) %>%
mutate(beta = dcant / delta_pCO2)
beta_budget_basin_MLR_all_ensemble <-
full_join(dcant_budget_basin_MLR_all_ensemble,
delta_pCO2_atm) %>%
mutate(beta = dcant / delta_pCO2)
beta_budget_basin_MLR_all_ensemble %>%
mutate(ensemble_role = if_else(Version_ID %in% Version_IDs,
"Standard case",
"others")) %>%
filter(data_source == "obs",
period != "1994 - 2014") %>%
ggplot(aes(period, beta)) +
scale_fill_brewer(palette = "Dark2", name = "ensemble group") +
scale_color_manual(values = c("grey", "black", "red"),
name = "Ensemble member") +
geom_boxplot(
width = .1,
outlier.shape = NA,
fill = "grey",
alpha = 0.7,
position = position_nudge(x = 0.3)
) +
geom_point(
aes(fill = Version_ID_group,
col = ensemble_role),
size = 1.3,
alpha = .7,
shape = 21,
position = position_dodge2(width = 0.3)
) +
scale_y_continuous(name = dcant_pgc_scaled_label) +
facet_wrap(~ basin, ncol = 3, scales = "free_y")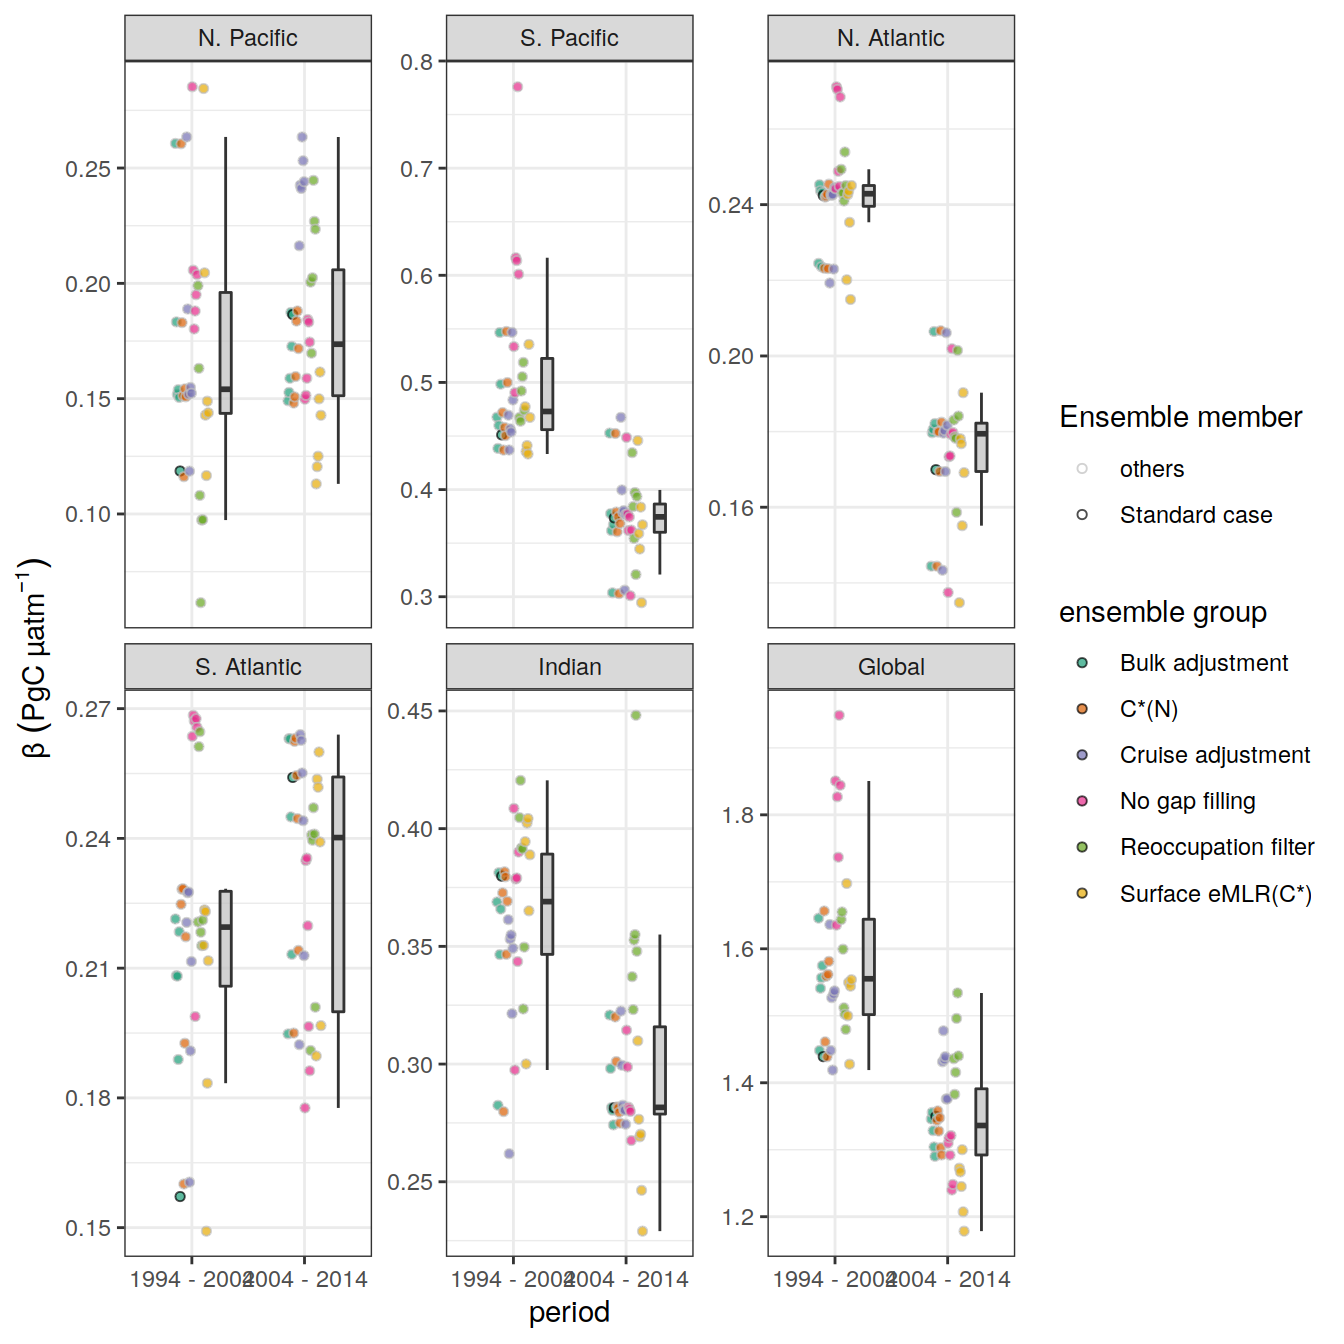
| Version | Author | Date |
|---|---|---|
| fea41c1 | jens-daniel-mueller | 2022-07-20 |
| d2ae54c | jens-daniel-mueller | 2022-07-18 |
| 2695085 | jens-daniel-mueller | 2022-07-17 |
| 535196a | jens-daniel-mueller | 2022-07-17 |
| efa414b | jens-daniel-mueller | 2022-07-16 |
| afb27ad | jens-daniel-mueller | 2022-07-15 |
| b492b46 | jens-daniel-mueller | 2022-07-15 |
| bd24a0f | jens-daniel-mueller | 2022-07-15 |
| 022fd60 | jens-daniel-mueller | 2022-07-14 |
beta_budget_ensemble_stat_KS <-
  beta_budget_basin_MLR_all_ensemble %>%
  filter(data_source == "obs",
         period != "1994 - 2014") %>%
  select(basin, period, dcant, beta, MLR_basins, Version_ID_group) %>%
  pivot_longer(c(dcant, beta),
               values_to = "value",
               names_to = "estimate") %>%
  pivot_wider(names_from = period,
              values_from = value)

beta_budget_ensemble_stat_KS %>%
  group_by(basin, estimate) %>%
  summarise(
    ks_p = ks.test(`2004 - 2014`, `1994 - 2004`)$p.value,
    t_p = t.test(`2004 - 2014`, `1994 - 2004`)$p.value
  ) %>%
  ungroup() %>%
  mutate(ratio_p = ks_p / t_p)
# A tibble: 12 × 5
basin estimate ks_p t_p ratio_p
<fct> <chr> <dbl> <dbl> <dbl>
1 N. Pacific beta 2.11e- 1 2.52e- 1 8.36e-1
2 N. Pacific dcant 6.53e- 4 1.07e- 2 6.10e-2
3 S. Pacific beta 7.06e-13 9.67e-13 7.30e-1
4 S. Pacific dcant 5.41e-11 4.39e- 8 1.23e-3
5 N. Atlantic beta 4.44e-16 7.90e-26 5.62e+9
6 N. Atlantic dcant 5.10e-12 6.53e-18 7.81e+5
7 S. Atlantic beta 3.49e- 3 6.93e- 2 5.04e-2
8 S. Atlantic dcant 8.83e- 5 1.07e- 5 8.27e+0
9 Indian beta 1.37e- 8 1.26e- 9 1.08e+1
10 Indian dcant 8.83e- 5 4.18e- 4 2.11e-1
11 Global beta 6.66e-12 1.69e-13 3.95e+1
12 Global dcant 1.41e- 3 5.21e- 5 2.71e+1beta_budget_ensemble_stat <-
beta_budget_basin_MLR_all_ensemble %>%
filter(data_source == "obs",
period != "1994 - 2014") %>%
select(basin, period, dcant, beta) %>%
pivot_longer(c(dcant, beta),
values_to = "value",
names_to = "estimate") %>%
group_by(period, basin, estimate) %>%
summarise(
# mean = mean(beta),
median = median(value),
sd = sd(value),
n = n()
) %>%
ungroup()
beta_budget_ensemble_stat <-
full_join(
beta_budget_ensemble_stat,
beta_budget_basin_MLR_all_ensemble %>%
filter(
Version_ID %in% Version_IDs,
data_source == "obs",
period != "1994 - 2014"
) %>%
select(period,
basin,
dcant,
beta) %>%
pivot_longer(c(dcant, beta),
values_to = "std_case",
names_to = "estimate")
)
beta_budget_ensemble_significance <- beta_budget_ensemble_stat %>%
pivot_longer(c(median,std_case),
names_to = "case",
values_to = "value") %>%
group_by(estimate, basin, case) %>%
mutate(
delta = value - lag(value),
RSS = sqrt(2 * sd ^ 2 + lag(2 * sd ^ 2)),
RSS_delta_ratio = abs(delta) / RSS,
ttest_p = tsum.test(
mean.x = value,
s.x = sd,
n.x = n,
mean.y = lag(value),
s.y = lag(sd),
n.y = lag(n)
)$p.value
) %>%
ungroup() %>%
drop_na()
beta_budget_ensemble_stat_significance <-
full_join(
beta_budget_ensemble_stat %>%
select(-n) %>%
pivot_wider(
names_from = period,
values_from = median:std_case,
names_sep = " "
),
beta_budget_ensemble_significance %>%
select(basin, estimate, case, delta, RSS, ttest_p) %>%
pivot_wider(names_from = case,
values_from = c(delta, ttest_p))
)
beta_budget_ensemble_stat_significance <-
beta_budget_ensemble_stat_significance %>%
mutate(across(where(is.numeric), signif, 2))
beta_budget_ensemble_stat_significance %>%
kable() %>%
kable_styling() %>%
scroll_box(height = "300px")| basin | estimate | median 1994 - 2004 | median 2004 - 2014 | sd 1994 - 2004 | sd 2004 - 2014 | std_case 1994 - 2004 | std_case 2004 - 2014 | RSS | delta_median | delta_std_case | ttest_p_median | ttest_p_std_case |
|---|---|---|---|---|---|---|---|---|---|---|---|---|
| N. Pacific | beta | 0.15 | 0.17 | 0.053 | 0.040 | 0.12 | 0.19 | 0.094 | 0.020 | 0.068 | 8.3e-02 | 1.0e-07 |
| N. Pacific | dcant | 2.90 | 3.50 | 0.990 | 0.810 | 2.20 | 3.80 | 1.800 | 0.670 | 1.600 | 2.5e-03 | 0.0e+00 |
| S. Pacific | beta | 0.47 | 0.37 | 0.069 | 0.044 | 0.45 | 0.37 | 0.120 | -0.098 | -0.078 | 0.0e+00 | 4.0e-07 |
| S. Pacific | dcant | 8.80 | 7.60 | 1.300 | 0.900 | 8.40 | 7.60 | 2.200 | -1.200 | -0.780 | 3.3e-05 | 4.0e-03 |
| N. Atlantic | beta | 0.24 | 0.18 | 0.013 | 0.018 | 0.24 | 0.17 | 0.032 | -0.063 | -0.072 | 0.0e+00 | 0.0e+00 |
| N. Atlantic | dcant | 4.50 | 3.70 | 0.250 | 0.370 | 4.50 | 3.50 | 0.630 | -0.860 | -1.000 | 0.0e+00 | 0.0e+00 |
| S. Atlantic | beta | 0.22 | 0.24 | 0.032 | 0.028 | 0.16 | 0.25 | 0.060 | 0.021 | 0.097 | 4.6e-03 | 0.0e+00 |
| S. Atlantic | dcant | 4.10 | 4.90 | 0.590 | 0.570 | 2.90 | 5.20 | 1.200 | 0.810 | 2.300 | 1.0e-07 | 0.0e+00 |
| Indian | beta | 0.37 | 0.28 | 0.039 | 0.038 | 0.38 | 0.28 | 0.077 | -0.087 | -0.098 | 0.0e+00 | 0.0e+00 |
| Indian | dcant | 6.90 | 5.70 | 0.720 | 0.780 | 7.10 | 5.70 | 1.500 | -1.100 | -1.300 | 0.0e+00 | 0.0e+00 |
| Global | beta | 1.60 | 1.30 | 0.130 | 0.081 | 1.40 | 1.30 | 0.220 | -0.220 | -0.089 | 0.0e+00 | 8.6e-04 |
| Global | dcant | 29.00 | 27.00 | 2.400 | 1.700 | 27.00 | 28.00 | 4.100 | -1.700 | 0.730 | 8.0e-04 | 1.4e-01 |
beta_budget_ensemble_stat_significance %>%
  ggplot(aes(abs(delta_std_case) / RSS, ttest_p_std_case, col = basin)) +
  geom_vline(xintercept = 1) +
  geom_hline(yintercept = 0.05) +
  geom_point() +
  scale_y_log10() +
  scale_color_brewer(palette = "Dark2") +
  facet_grid(. ~ estimate)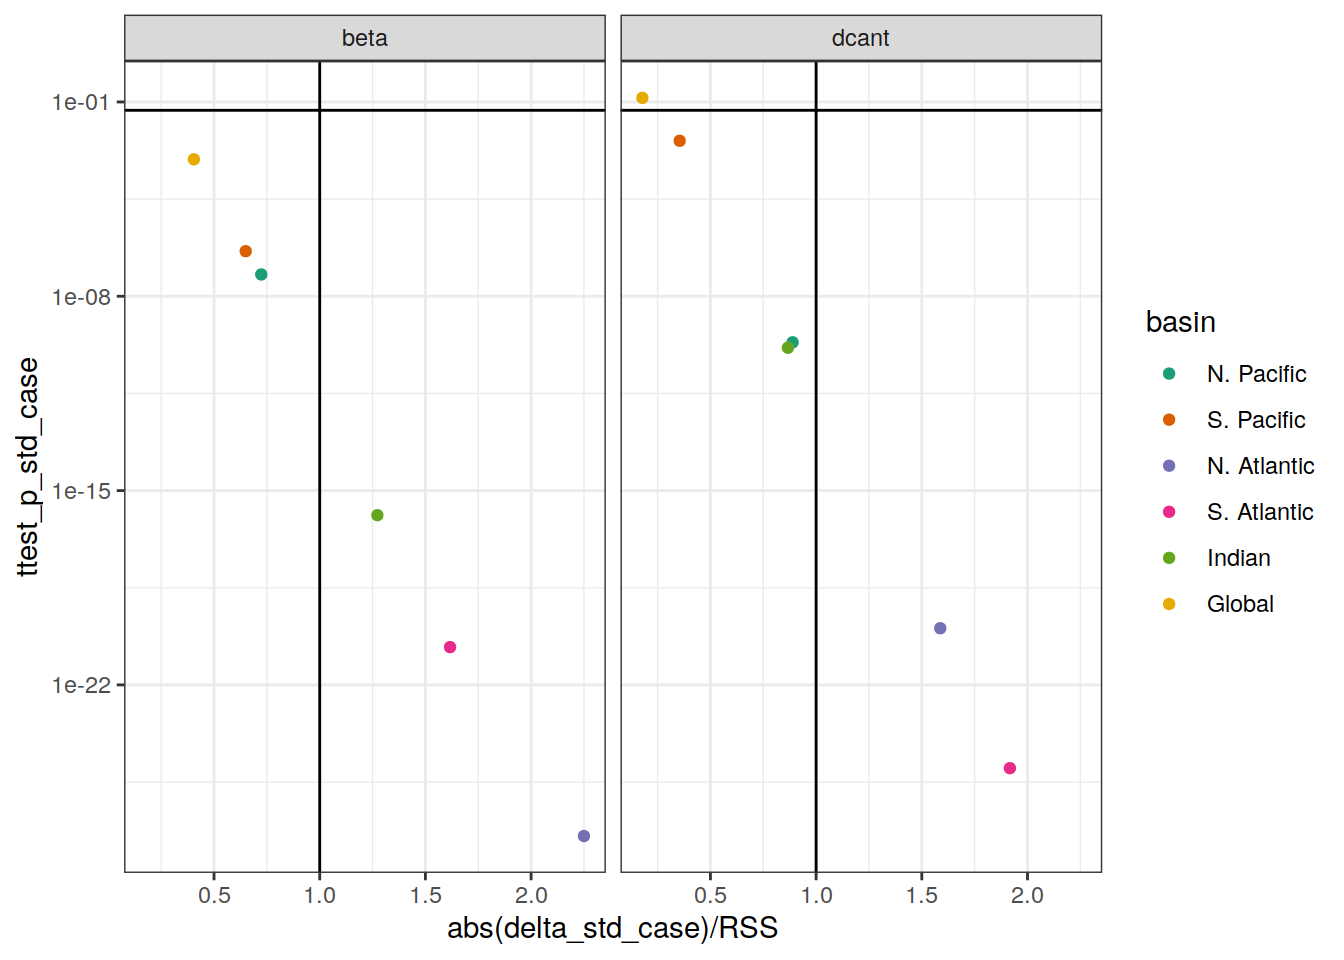
beta_budget_ensemble_stat_significance %>%
  ggplot(aes(abs(delta_median) / RSS, ttest_p_median, col = basin)) +
  geom_vline(xintercept = 1) +
  geom_hline(yintercept = 0.05) +
  geom_point() +
  scale_y_log10() +
  scale_color_brewer(palette = "Dark2") +
  facet_grid(. ~ estimate)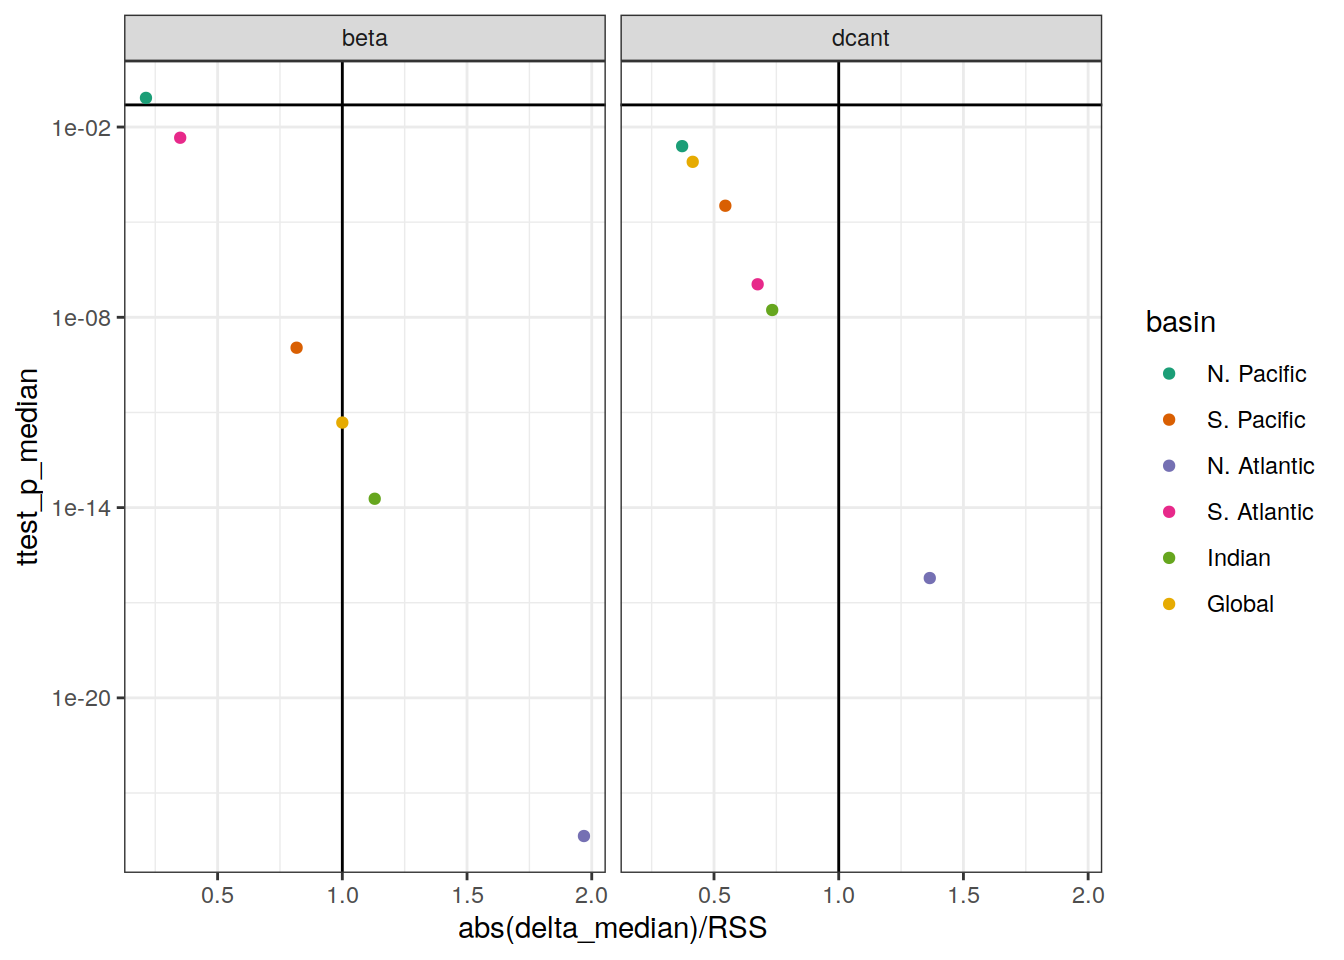
beta_budget_ensemble_stat_significance %>%
  mutate(
    `1994 - 2004` = paste(`std_case 1994 - 2004`, `sd 1994 - 2004`, sep = " ± "),
    `2004 - 2014` = paste(`std_case 2004 - 2014`, `sd 2004 - 2014`, sep = " ± "),
    `Deacadal change` = paste0(delta_std_case, " ± ", RSS, " ", if_else(abs(delta_std_case) > RSS, "*", ""))
  ) %>%
  select(Region = basin,
         Esimate = estimate,
         `1994 - 2004`,
         `2004 - 2014`,
         `Deacadal change`) %>%
  write_csv(here::here("output/publication/Table_budget_stats.csv"))
beta_budget_basin_MLR_all_ensemble %>%
filter(data_source == "obs",
period != "1994 - 2014",
!(Version_ID %in% Version_IDs)) %>%
ggplot(aes(period, beta)) +
geom_errorbar(
data = tcant_budget_basin_MLR %>%
rename(beta = beta_1994),
aes(x = period,
ymax = beta, ymin = beta,
col = "Scaled 1994\nestimate"),
width = 0.5,
linetype = 2,
position = position_nudge(x = 0.1)
) +
geom_jitter(
data = beta_budget_basin_MLR_all_no_adj %>%
filter(data_source == "obs",
period != "1994 - 2014"),
aes(fill = "Unadjusted data",
alpha = "Unadjusted data"),
shape = 21,
position = position_jitter(width = 0.1, height = 0)
) +
geom_point(
aes(fill = "Ensemble member",
alpha = "Ensemble member"),
shape = 21,
position = position_jitter(width = 0.1, height = 0)
) +
geom_crossbar(
data = beta_budget_ensemble_stat %>%
filter(estimate == "beta"),
aes(
x = period,
y = std_case,
ymin = std_case - 2*sd,
ymax = std_case + 2*sd,
linetype = "Ensemble SD"
),
width = 0.1,
fill = "#AA3377",
alpha = 0.2,
position = position_nudge(x = 0.2)
) +
geom_crossbar(
data = beta_budget_ensemble_stat %>%
filter(estimate == "beta"),
aes(
x = period,
y = std_case,
ymin = std_case - sd,
ymax = std_case + sd,
alpha = "Ensemble SD",
),
width = 0.1,
fill = "#AA3377",
alpha = 0.4,
position = position_nudge(x = 0.2)
) +
geom_point(
data = beta_budget_ensemble_stat %>%
filter(estimate == "beta"),
aes(x = period,
y = std_case,
fill = "Standard case",
alpha = "Standard case"),
size = 2,
shape = 21,
position = position_nudge(x = 0.2)
) +
scale_fill_manual(name = "group", values = c("#BB5566", "white", "#BBBBBB")) +
scale_color_manual(values = c("grey50"), label = expression(Scaled~C[ant]~1994)) +
scale_linetype(name = "X") +
scale_alpha_manual(name = "group", values = c(0.5,1,0.5)) +
scale_shape_manual(values = 95) +
scale_y_continuous(name = dcant_pgc_scaled_label) +
guides(
fill = guide_legend(order = 1),
linetype = guide_legend(order = 2),
alpha = guide_legend(order = 1)
) +
facet_wrap(~ basin, ncol = 3, dir = "v", scales = "free_y") +
theme(legend.title = element_blank(),
axis.title.x = element_blank())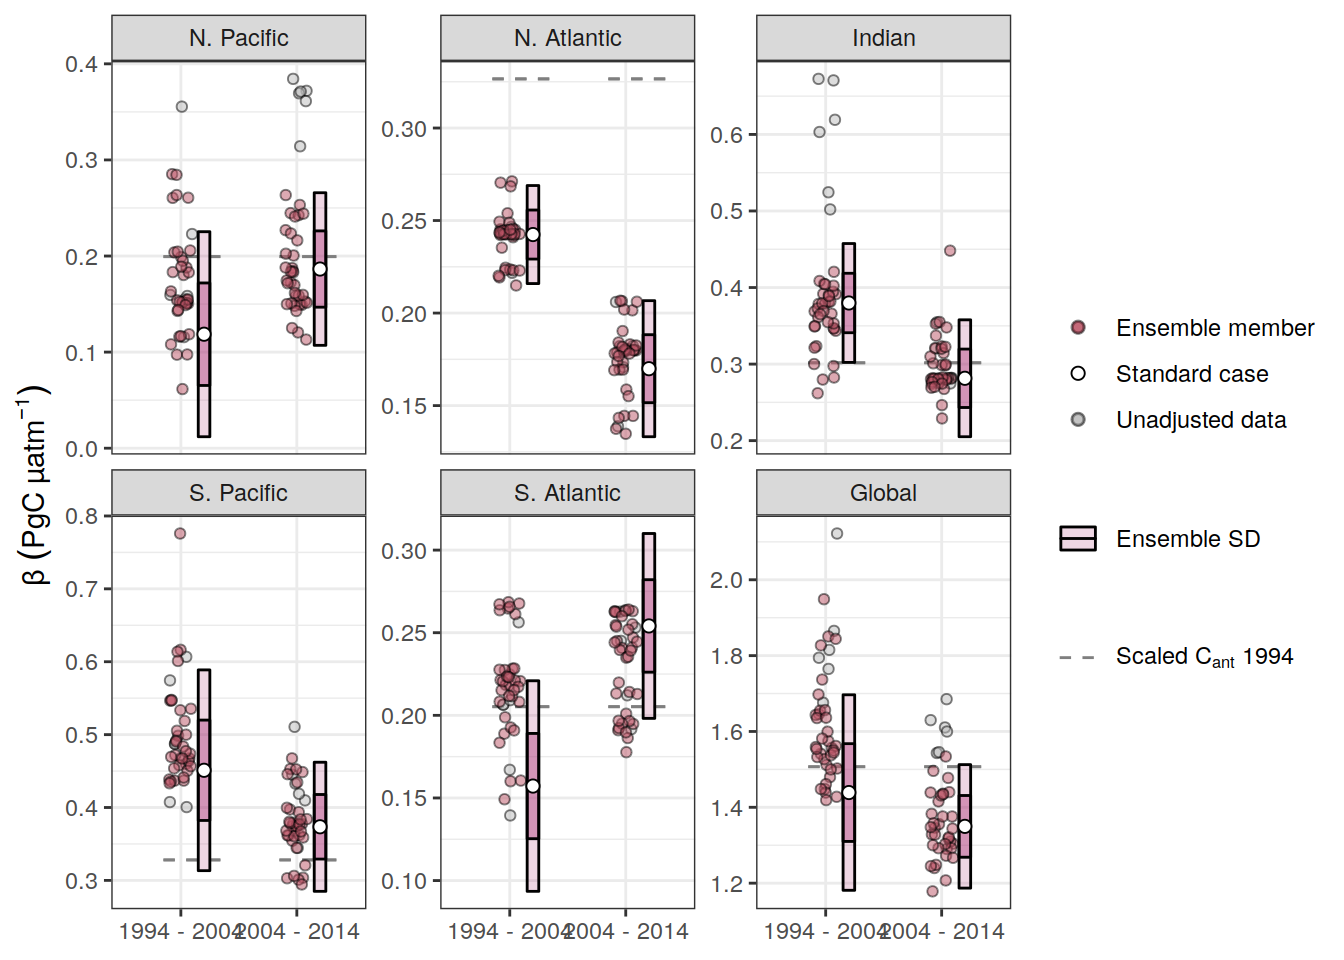
| Version | Author | Date |
|---|---|---|
| 5b77c4f | jens-daniel-mueller | 2022-08-10 |
| a691b29 | jens-daniel-mueller | 2022-08-09 |
| 910f96e | jens-daniel-mueller | 2022-08-08 |
| 0c6db30 | jens-daniel-mueller | 2022-07-20 |
| b18b250 | jens-daniel-mueller | 2022-07-20 |
| a80b59b | jens-daniel-mueller | 2022-07-20 |
| fea41c1 | jens-daniel-mueller | 2022-07-20 |
| d803308 | jens-daniel-mueller | 2022-07-19 |
| d2ae54c | jens-daniel-mueller | 2022-07-18 |
ggsave(path = here::here("output/publication"),
       filename = "FigS_beta_budgets_ensemble_member.png",
       height = 6,
       width = 8)
10.1.3 Biases
dcant_budget_basin_MLR_all_ensemble_bias <-
dcant_budget_basin_MLR_all_ensemble %>%
  filter(data_source %in% c("mod", "mod_truth")) %>%
  pivot_wider(names_from = data_source,
              values_from = dcant) %>%
  mutate(dcant_bias = mod - mod_truth,
         dcant_bias_rel = 100 * dcant_bias / mod_truth)

dcant_budget_basin_MLR_all_ensemble_bias <-
dcant_budget_basin_MLR_all_ensemble_bias %>%
  mutate(ensemble_role = if_else(Version_ID %in% Version_IDs,
                                 "Standard case",
                                 "others"))

dcant_budget_basin_MLR_all_ensemble_bias %>%
  ggplot(aes(period, dcant_bias)) +
  geom_hline(yintercept = 0) +
  geom_point(
    aes(fill = Version_ID_group,
        col = ensemble_role),
    size = 1.3,
    alpha = .7,
    shape = 21,
    position = position_dodge2(width = 0.3)
  ) +
  stat_summary(
    fun.data = "mean_sdl",
    fun.args = list(mult = 2),
    position = position_nudge(x = -0.3),
    col = "grey"
  ) +
  stat_summary(
    fun.data = "mean_sdl",
    fun.args = list(mult = 1),
    position = position_nudge(x = -0.3),
    size = 0.1
  ) +
  scale_fill_brewer(palette = "Dark2") +
    scale_color_manual(values = c("transparent", "black"),
                     name = "Ensemble member") +
  facet_grid(basin ~ .)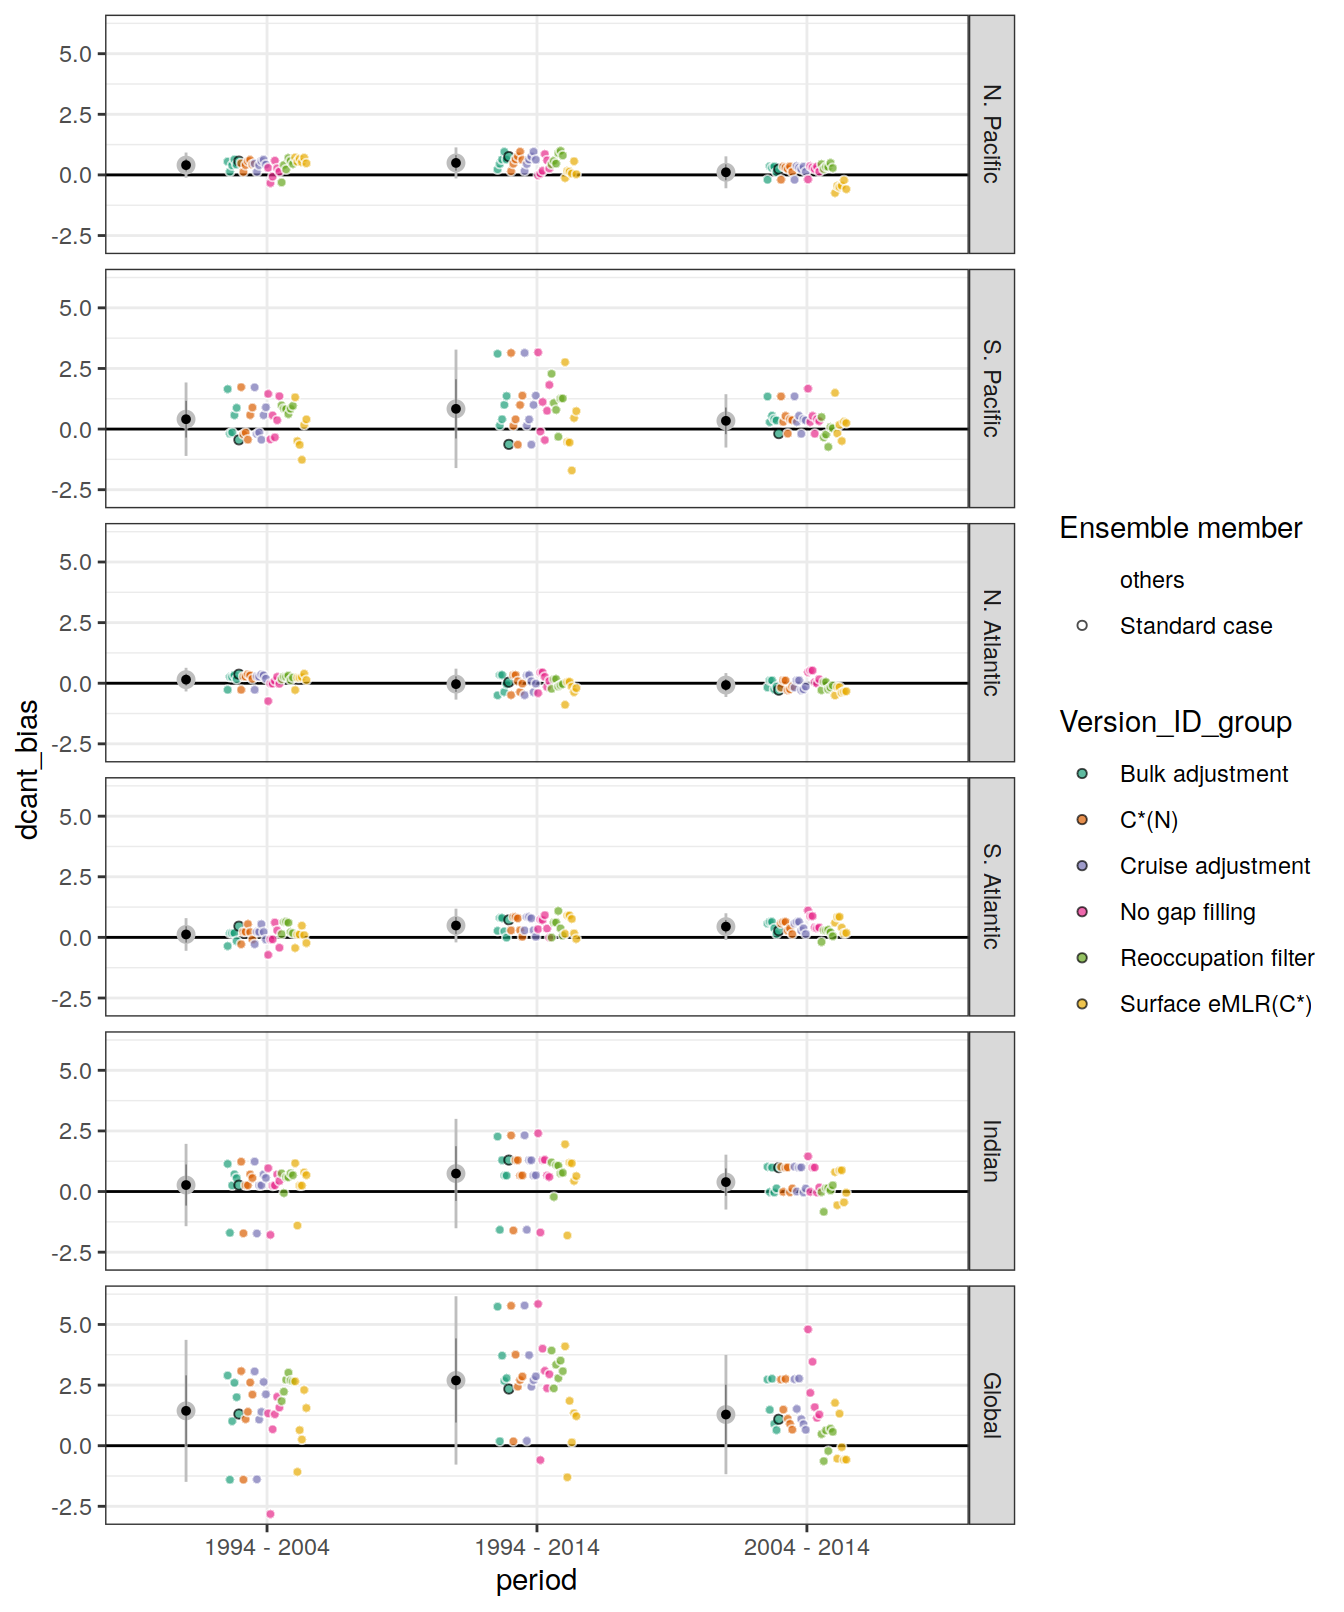
dcant_budget_bias_ensemble_stat <-
  dcant_budget_basin_MLR_all_ensemble_bias %>%
  filter(period != "1994 - 2014") %>%
  group_by(period, basin) %>%
  summarise(
    median = median(dcant_bias),
    sd = sd(dcant_bias),
    n = n()
  ) %>%
  ungroup()


dcant_budget_bias_ensemble_stat <-
  full_join(
    dcant_budget_bias_ensemble_stat,
    dcant_budget_basin_MLR_all_ensemble_bias %>%
        filter(Version_ID %in% Version_IDs,
               period != "1994 - 2014") %>%
        select(period,
               basin,
               std_case = dcant_bias)
  )


dcant_budget_basin_MLR_all_ensemble_bias %>%
  filter(period != "1994 - 2014") %>%
  ggplot(aes(period, dcant_bias)) +
  geom_hline(yintercept = 0) +
  geom_point(
    aes(fill = "Ensemble member",
        alpha = "Ensemble member"),
    shape = 21,
    position = position_jitter(width = 0.1, height = 0)
  ) +
  geom_crossbar(
    data = dcant_budget_bias_ensemble_stat,
    aes(
      x = period,
      y = std_case,
      ymin = std_case - 2 * sd,
      ymax = std_case + 2 * sd,
      linetype = "Ensemble SD"
    ),
    width = 0.1,
    fill = "#AA3377",
    alpha = 0.2,
    position = position_nudge(x = 0.2)
  ) +
  geom_crossbar(
    data = dcant_budget_bias_ensemble_stat,
    aes(
      x = period,
      y = std_case,
      ymin = std_case - sd,
      ymax = std_case + sd,
      alpha = "Ensemble SD",
    ),
    width = 0.1,
    fill = "#AA3377",
    alpha = 0.4,
    position = position_nudge(x = 0.2)
  ) +
  geom_point(
    data = dcant_budget_bias_ensemble_stat,
    aes(
      x = period,
      y = std_case,
      fill = "Standard case",
      alpha = "Standard case"
    ),
    size = 2,
    shape = 21,
    position = position_nudge(x = 0.2)
  )+
  scale_fill_manual(name = "group", values = c("#BB5566", "white", "#BBBBBB")) +
  scale_linetype(name = "X") +
  scale_alpha_manual(name = "group", values = c(0.5,1,0.5)) +
  scale_shape_manual(values = 95) +
  scale_y_continuous(name = dcant_bias_pgc_label) +
  guides(
    fill = guide_legend(order = 1),
    linetype = guide_legend(order = 2),
    alpha = guide_legend(order = 1)
  ) +
  facet_wrap(~ basin, ncol = 3, dir = "v", scales = "free_y") +
  theme(legend.title = element_blank(),
        axis.title.x = element_blank())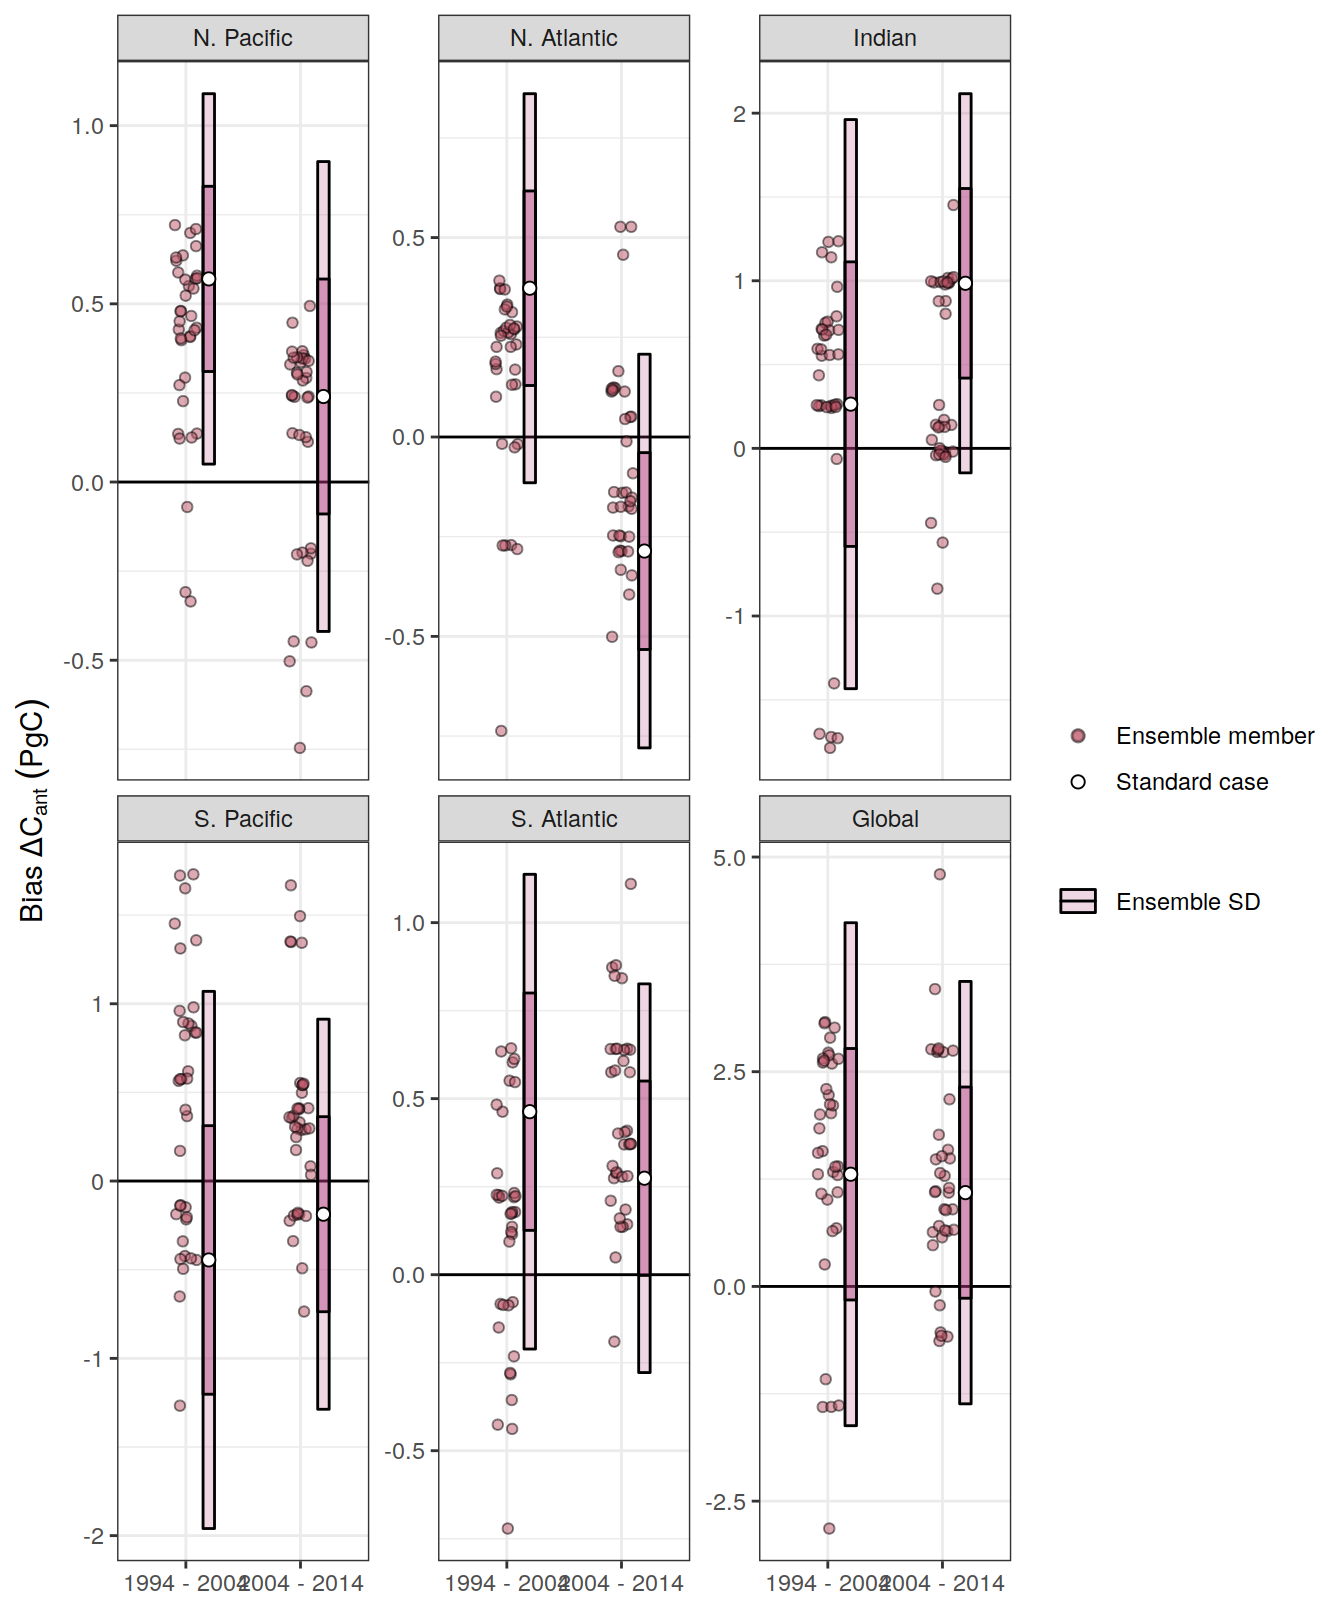
ggsave(path = here::here("output/publication"),
       filename = "FigS_dcant_bias_budgets_ensemble_member.png",
       height = 6,
       width = 8)


dcant_budget_basin_MLR_all_ensemble_bias %>%
  ggplot(aes(period, dcant_bias_rel, col = Version_ID_group)) +
  geom_hline(yintercept = 0) +
  geom_jitter(alpha = 0.5) +
  scale_color_brewer(palette = "Dark2") +
  facet_grid(basin ~ MLR_basins)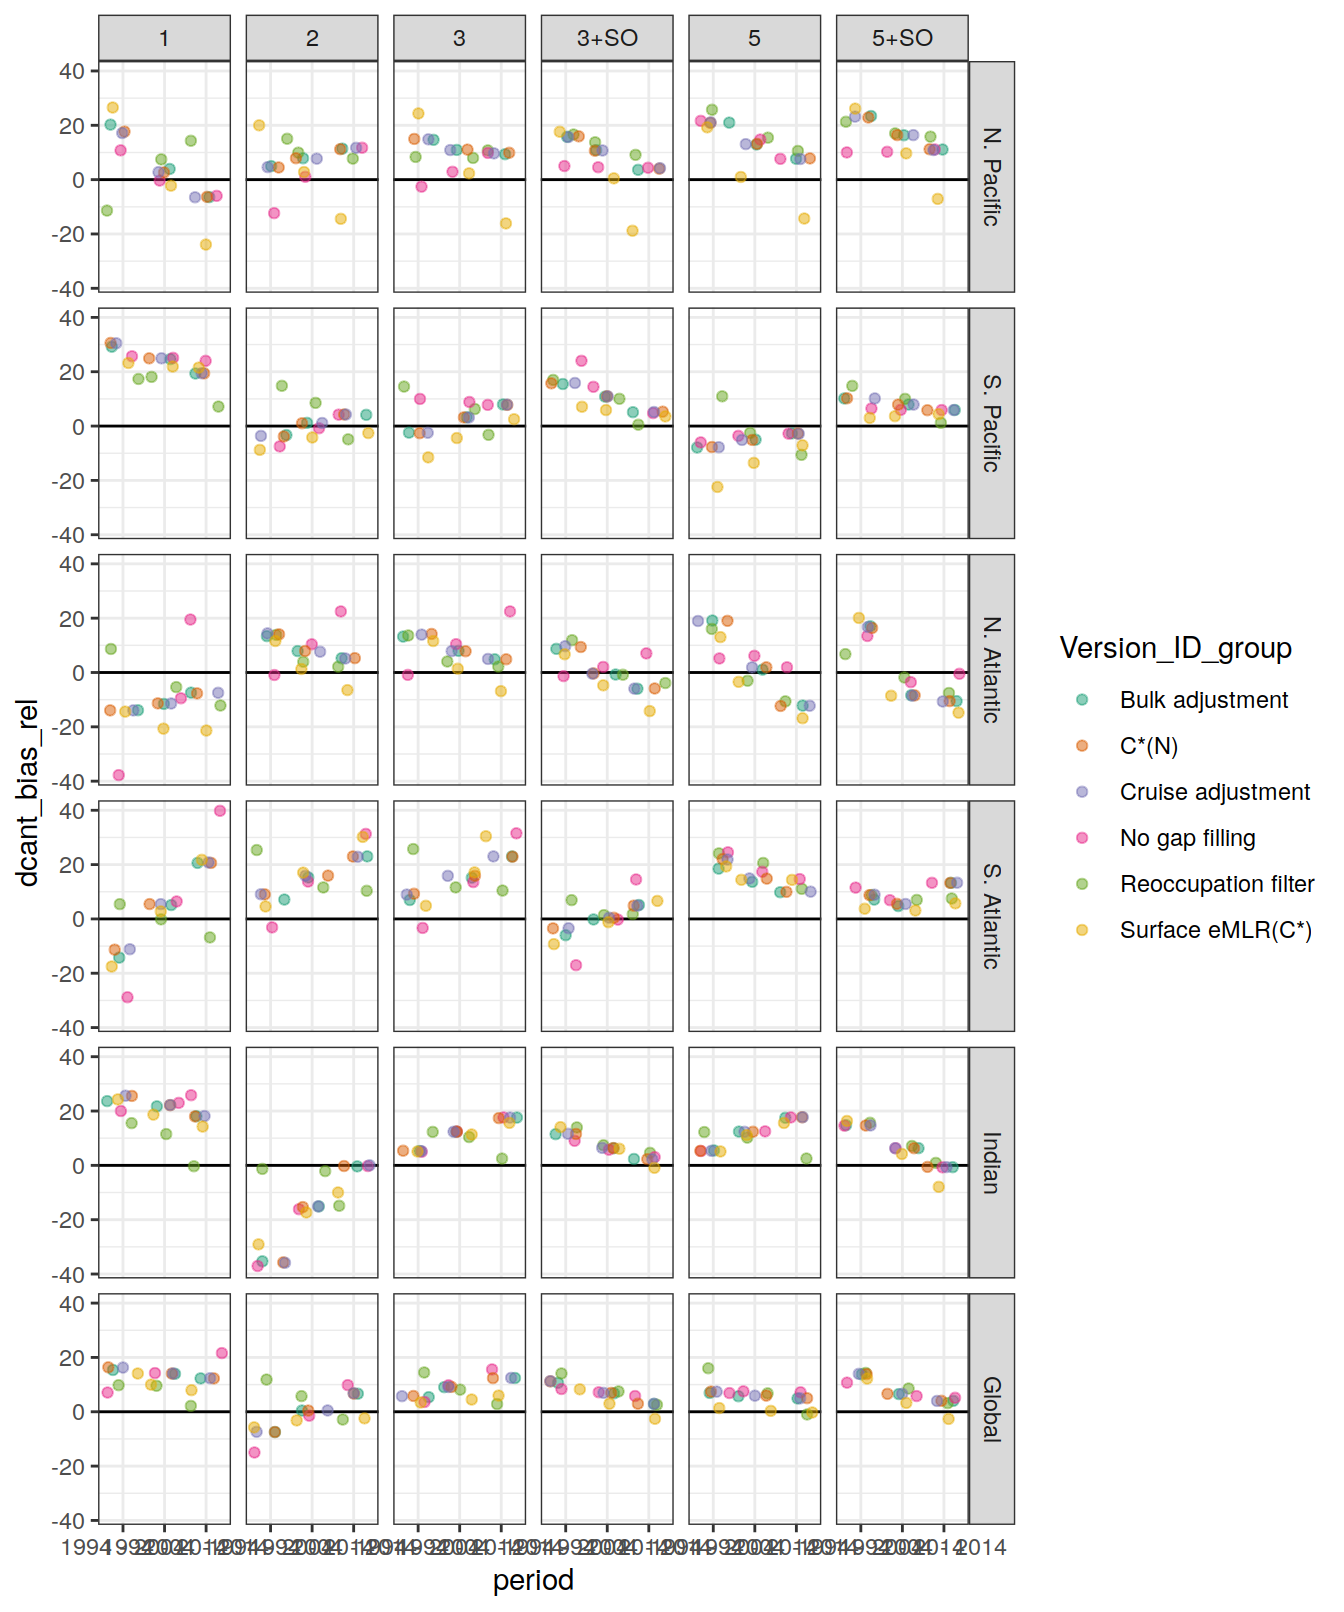
delta_dcant_budget_basin_MLR_all_ensemble <-
dcant_budget_basin_MLR_all_ensemble_bias %>%
  filter(period %in% two_decades) %>%
  select(basin, period, MLR_basins, Version_ID_group, mod, mod_truth, Version_ID) %>%
  pivot_longer(cols = mod:mod_truth,
               names_to = "data_source",
               values_to = "dcant") %>%
  group_by(basin, MLR_basins, Version_ID_group, data_source) %>%
  arrange(period) %>%
  mutate(delta_dcant = dcant - lag(dcant)) %>%
  ungroup() %>%
  drop_na() %>%
  select(-dcant)

delta_dcant_budget_basin_MLR_all_ensemble_bias <-
  delta_dcant_budget_basin_MLR_all_ensemble %>%
  pivot_wider(names_from = data_source,
              values_from = delta_dcant) %>%
  mutate(delta_dcant_bias = mod - mod_truth,
         delta_dcant_bias_rel = 100 * delta_dcant_bias / mod_truth)

delta_dcant_budget_basin_MLR_all_ensemble %>%
  ggplot(aes(data_source, delta_dcant, col = Version_ID_group)) +
  geom_hline(yintercept = 0) +
  geom_jitter(alpha = 0.5) +
  scale_color_brewer(palette = "Dark2") +
  facet_grid(basin ~ MLR_basins)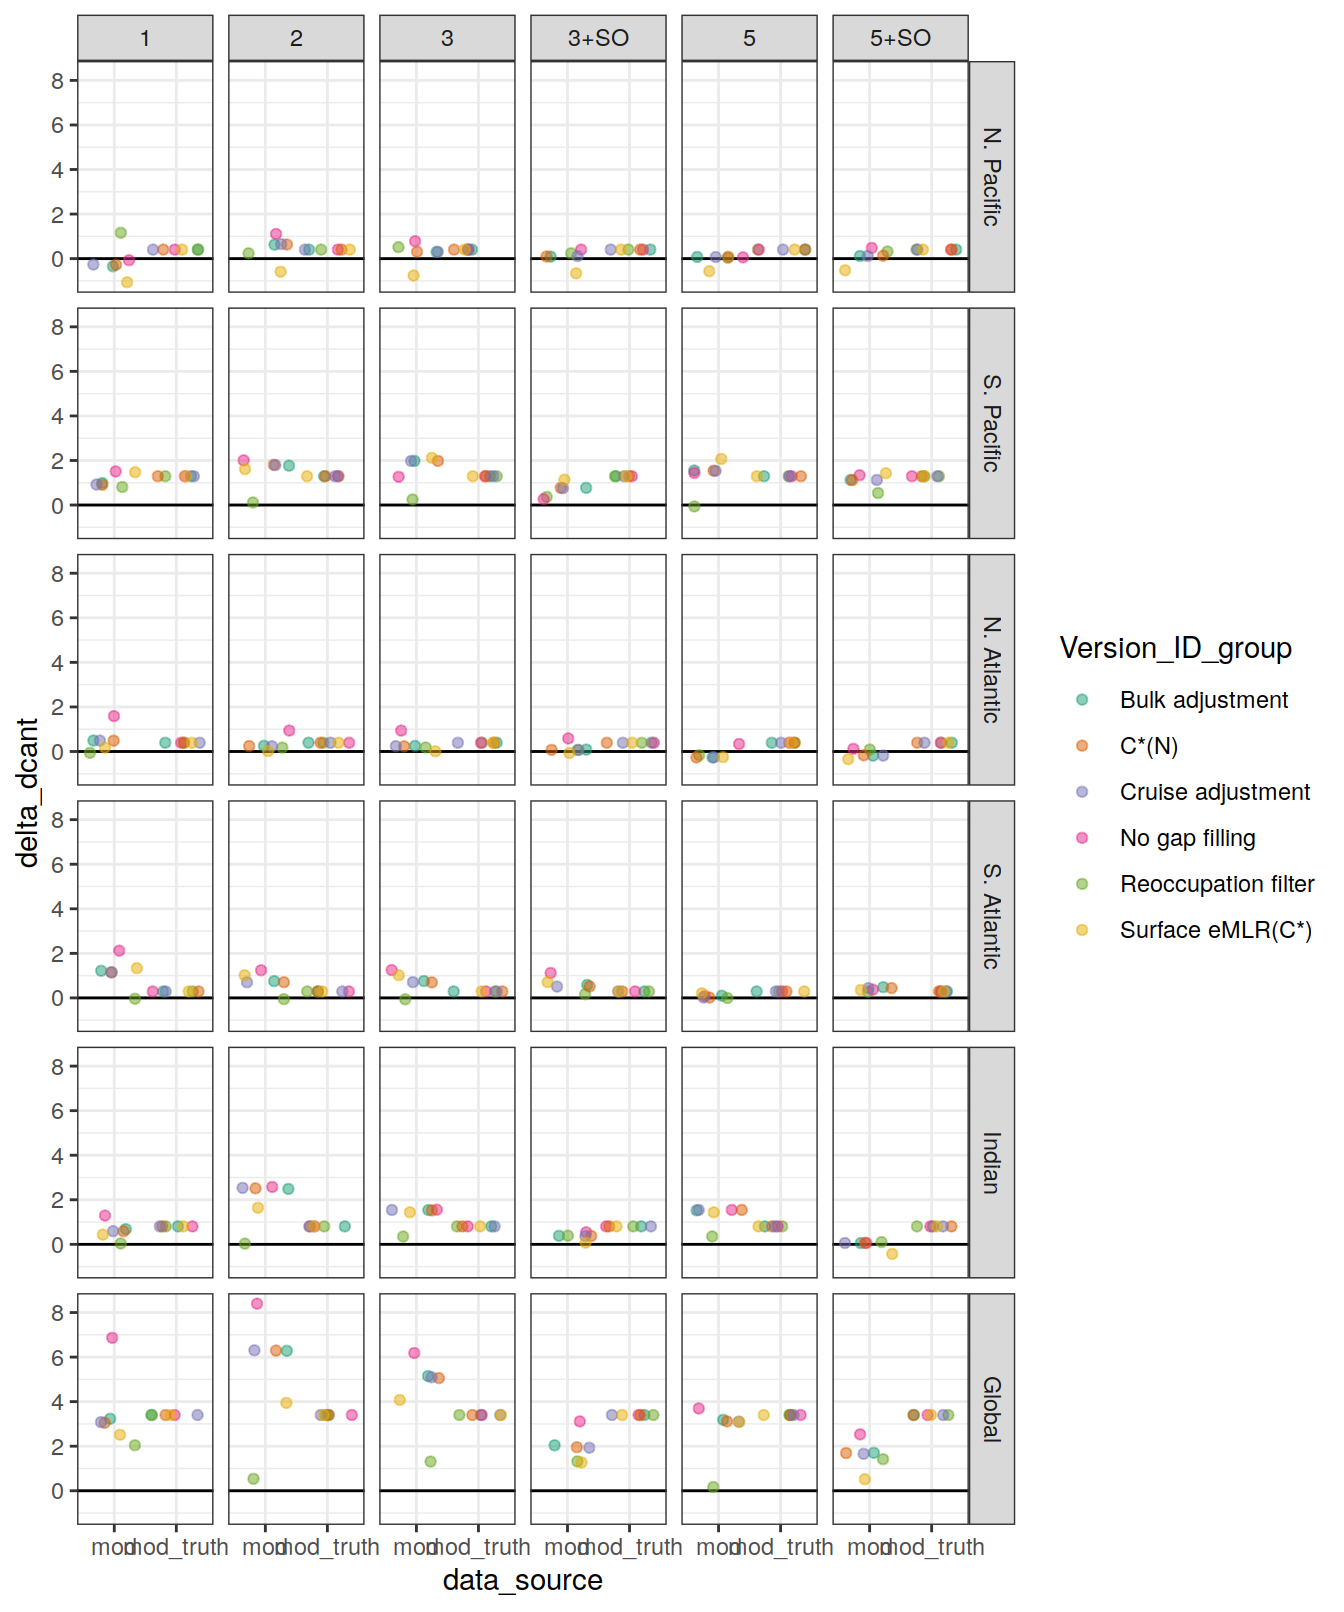
delta_dcant_budget_basin_MLR_all_ensemble_bias %>%
  ggplot(aes(period, delta_dcant_bias, col = Version_ID_group)) +
  geom_hline(yintercept = 0) +
  geom_jitter(alpha = 0.5) +
  scale_color_brewer(palette = "Dark2") +
  facet_grid(basin ~ MLR_basins)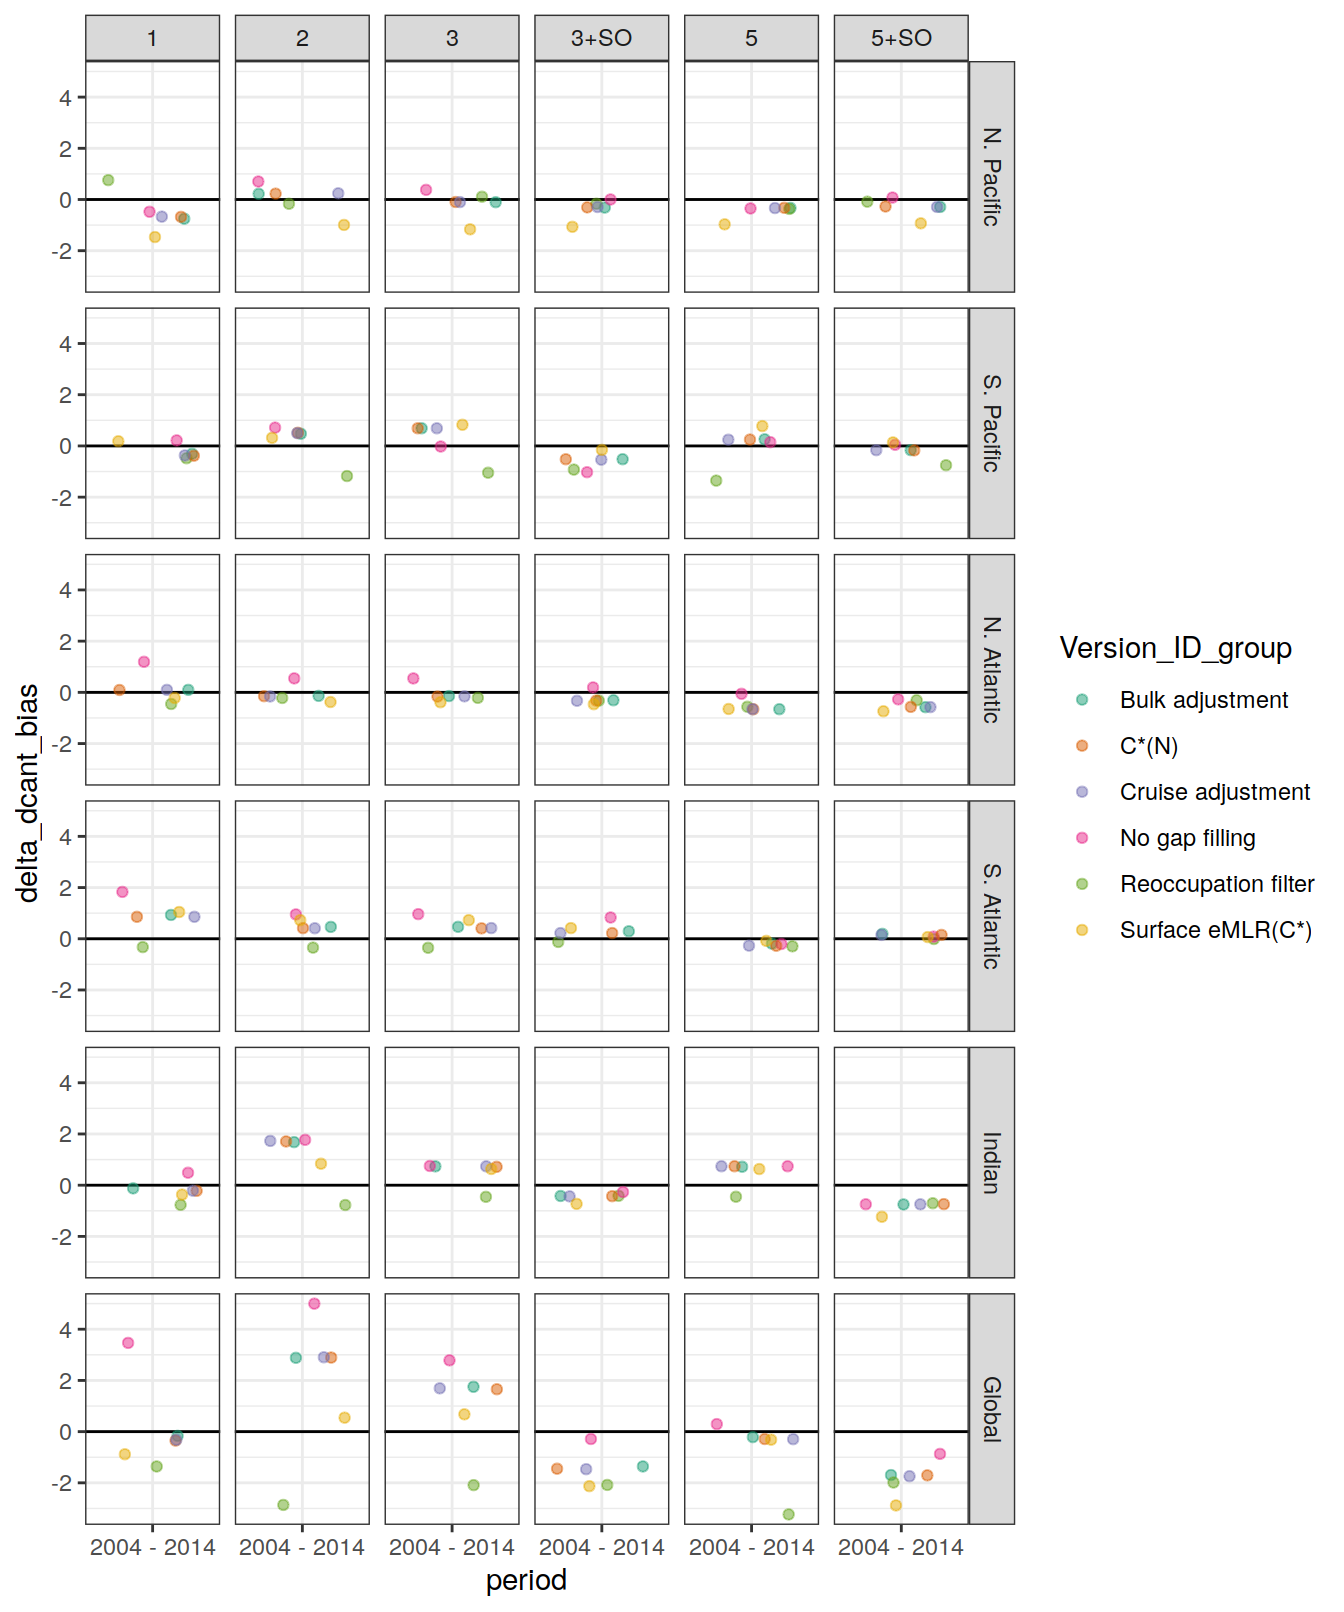
delta_dcant_budget_bias_ensemble_stat <-
  delta_dcant_budget_basin_MLR_all_ensemble_bias %>%
  group_by(basin) %>%
  summarise(
    median = median(delta_dcant_bias),
    sd = sd(delta_dcant_bias),
    n = n()
  ) %>%
  ungroup()


delta_dcant_budget_bias_ensemble_stat <-
  full_join(
    delta_dcant_budget_bias_ensemble_stat,
    delta_dcant_budget_basin_MLR_all_ensemble_bias %>%
        filter(Version_ID %in% Version_IDs,
               period != "1994 - 2014") %>%
        select(period,
               basin,
               std_case = delta_dcant_bias)
  )


delta_dcant_budget_bias_ensemble_stat_RSS <-
  dcant_budget_bias_ensemble_stat %>%
  arrange(period) %>%
  group_by(basin) %>%
  mutate(delta_std_case = std_case - lag(std_case),
         RSS = sqrt(sd^2 + lag(sd)^2)) %>%
  ungroup() %>%
  drop_na()


delta_dcant_budget_basin_MLR_all_ensemble_bias %>%
  ggplot(aes(period, delta_dcant_bias)) +
  geom_hline(yintercept = 0) +
  geom_point(
    aes(fill = "Ensemble member",
        alpha = "Ensemble member"),
    shape = 21,
    position = position_jitter(width = 0.1, height = 0)
  ) +
  # geom_crossbar(
  #   data = delta_dcant_budget_bias_ensemble_stat,
  #   aes(
  #     x = period,
  #     y = std_case,
  #     ymin = std_case - 2 * sd,
  #     ymax = std_case + 2 * sd,
  #     linetype = "Ensemble SD"
  #   ),
  #   width = 0.1,
  #   fill = "#AA3377",
  #   alpha = 0.2,
  #   position = position_nudge(x = 0.2)
  # ) +
  # geom_crossbar(
  #   data = delta_dcant_budget_bias_ensemble_stat,
  #   aes(
  #     x = period,
  #     y = std_case,
  #     ymin = std_case - sd,
  #     ymax = std_case + sd,
  #     alpha = "Ensemble SD",
  #   ),
  #   width = 0.1,
  #   fill = "#AA3377",
  #   alpha = 0.4,
  #   position = position_nudge(x = 0.2)
  # ) +
  geom_crossbar(
    data = delta_dcant_budget_bias_ensemble_stat_RSS,
    aes(
      x = period,
      y = delta_std_case,
      ymin = delta_std_case - 2 * RSS,
      ymax = delta_std_case + 2 * RSS,
      linetype = "RSS"
    ),
    width = 0.1,
    fill = "#AA3377",
    alpha = 0.2,
    position = position_nudge(x = 0.2)
  ) +
  geom_crossbar(
    data = delta_dcant_budget_bias_ensemble_stat_RSS,
    aes(
      x = period,
      y = delta_std_case,
      ymin = delta_std_case - RSS,
      ymax = delta_std_case + RSS,
      alpha = "RSS",
    ),
    width = 0.1,
    fill = "#AA3377",
    alpha = 0.4,
    position = position_nudge(x = 0.2)
  ) +
  geom_point(
    data = delta_dcant_budget_bias_ensemble_stat,
    aes(
      x = period,
      y = std_case,
      fill = "Standard case",
      alpha = "Standard case"
    ),
    size = 2,
    shape = 21,
    position = position_nudge(x = 0.2)
  )+
  scale_fill_manual(name = "group", values = c("#BB5566", "white", "#BBBBBB")) +
  scale_linetype(name = "X") +
  scale_alpha_manual(name = "group", values = c(0.5,1,0.5)) +
  scale_shape_manual(values = 95) +
  scale_y_continuous(name = delta_dcant_bias_pgc_label) +
  guides(
    fill = guide_legend(order = 1),
    linetype = guide_legend(order = 2),
    alpha = guide_legend(order = 1)
  ) +
  facet_wrap(~ basin, ncol = 3, dir = "v", scales = "free_y") +
  theme(legend.title = element_blank(),
        axis.title.x = element_blank(),
        axis.text.x = element_blank(),
        axis.ticks.x = element_blank(),
        panel.grid.major.x = element_blank())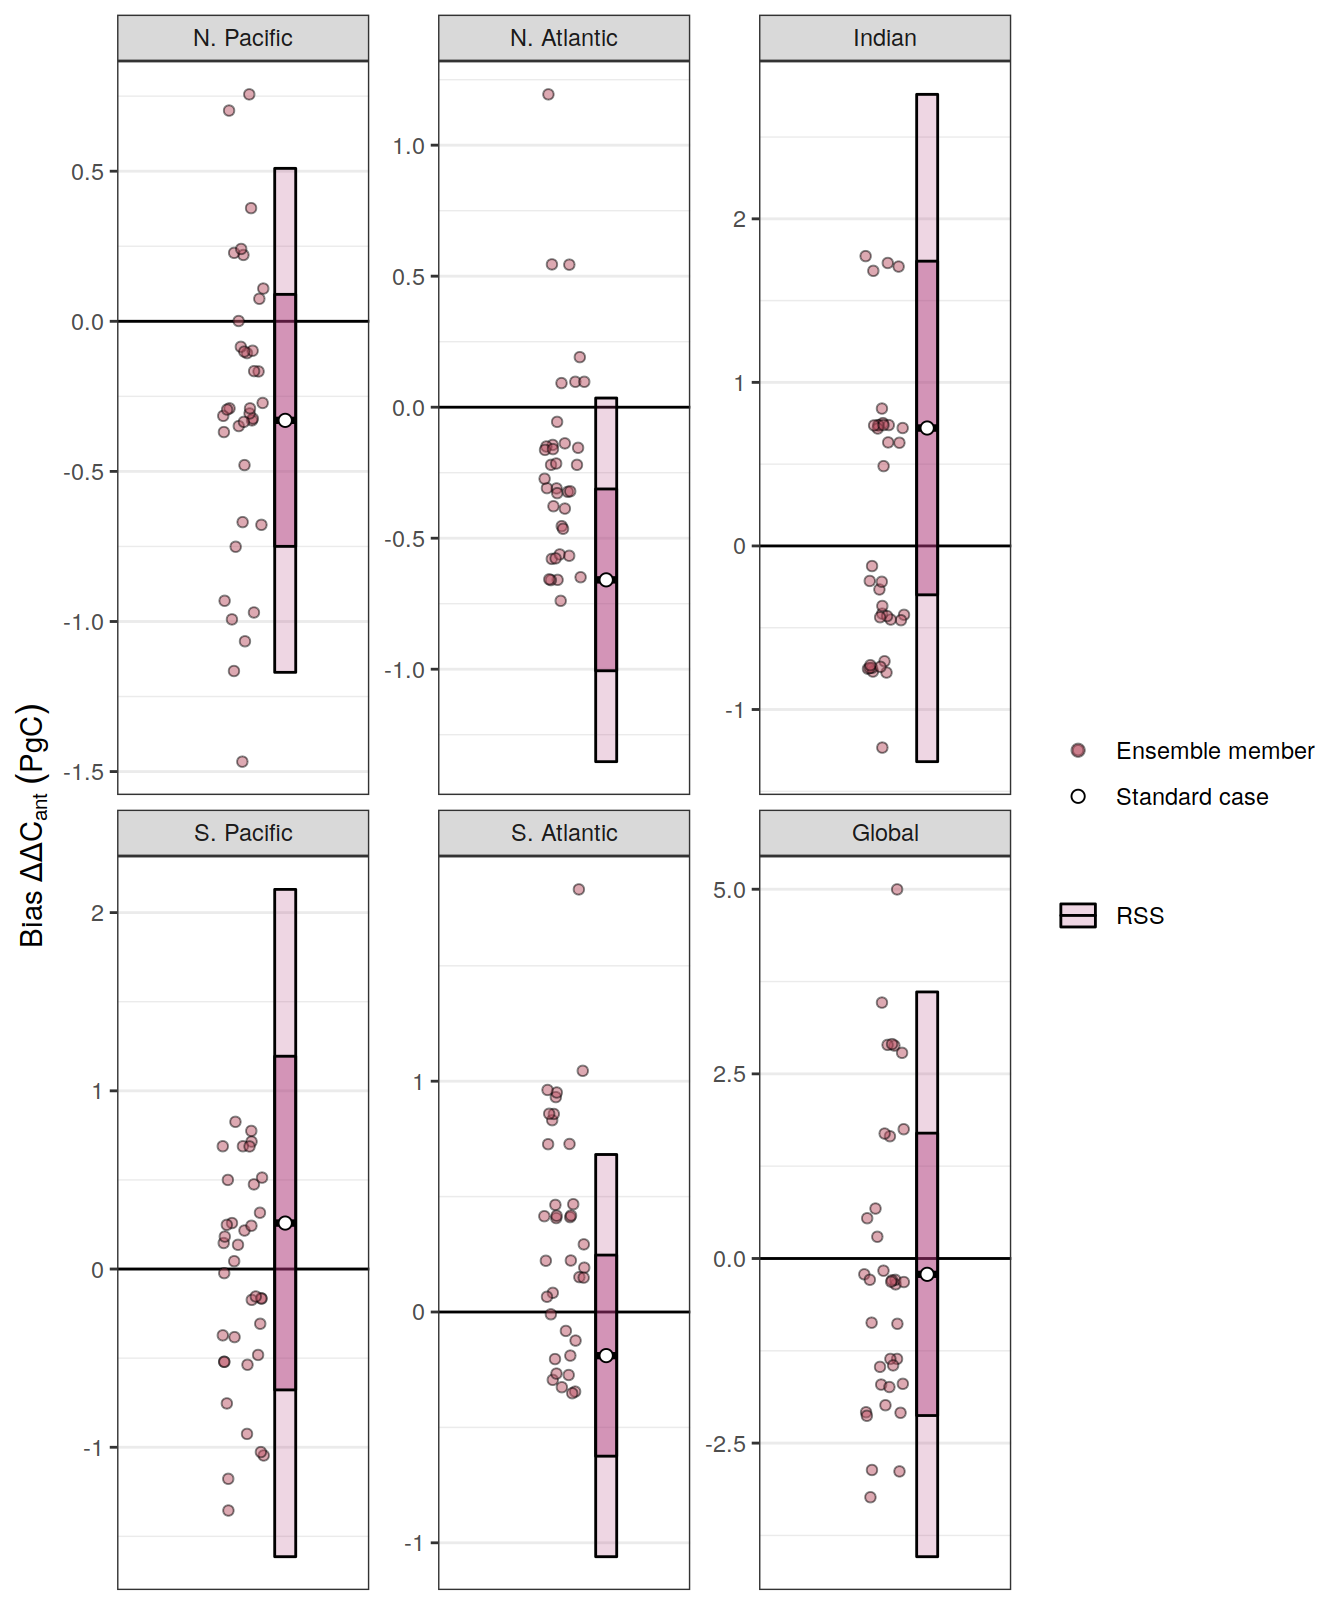
ggsave(path = here::here("output/publication"),
       filename = "FigS_delta_dcant_bias_budgets_ensemble_member.png",
       height = 6,
       width = 6)
10.2 Flow chart
dcant_budget_basin_MLR_all <-
  dcant_budget_basin_MLR_all %>%
  filter(basin != "Global")

dcant_budget_basin_MLR_all <- left_join(dcant_budget_basin_MLR_all,
                           co2_atm %>% rename(tref1 = year,
                                              pCO21 = pCO2))

dcant_budget_basin_MLR_all <- left_join(dcant_budget_basin_MLR_all,
                           co2_atm %>% rename(tref2 = year,
                                              pCO22 = pCO2))


dcant_budget_basin_MLR_all_plot <- dcant_budget_basin_MLR_all %>%
  filter(period != "1994 - 2014",
         data_source == "obs")
tcant_budget_basin_MLR <-
tcant_inv %>%
mutate(method = "layer",
data_source = "obs") %>%
group_by(basin) %>%
nest() %>%
mutate(budget = map(.x = data, ~m_dcant_budget(.x))) %>%
select(-data) %>%
unnest(budget)
tcant_budget_basin_MLR <-
full_join(tcant_budget_basin_MLR,
area_scaling %>% select(basin, scaling_factor)) %>%
mutate(value = value * scaling_factor) %>%
select(-scaling_factor)
tcant_budget_basin_MLR <- tcant_budget_basin_MLR %>%
mutate(pCO21 = 281,
tref1 = 1800,
tref2 = 1994)
tcant_budget_basin_MLR <- left_join(tcant_budget_basin_MLR,
co2_atm %>% rename(tref2 = year,
pCO22 = pCO2))
tcant_budget_basin_MLR <- tcant_budget_basin_MLR %>%
mutate(period = paste(tref1, tref2, sep = " - ")) %>%
filter(estimate == "dcant") %>%
select(-estimate) %>%
rename(dcant = value)
dcant_budget_basin_MLR_all_plot <- bind_rows(
dcant_budget_basin_MLR_all_plot,
tcant_budget_basin_MLR)
dcant_budget_basin_MLR_all_plot <-
left_join(dcant_budget_basin_MLR_all_plot,
dcant_budget_basin_MLR_all_ensemble_summary)10.2.1 Absolute
g1 <- dcant_budget_basin_MLR_all_plot %>%
  filter(period != "1800 - 1994") %>%
  ggplot(aes(
    y = dcant,
    x = period,
    alluvium = basin,
    fill  = basin,
    stratum = basin
  )) +
  stat_alluvium(decreasing = FALSE) +
  stat_stratum(decreasing = FALSE) +
  stat_stratum(geom = "text",
               decreasing = FALSE,
               aes(label = paste(
                 round(after_stat(max-min),1)
                 # 100*round(after_stat(prop), 2), "%"
                 ))) +
  ggrepel::geom_label_repel(
    data = dcant_budget_basin_MLR_all_plot %>% filter(period == "2004 - 2014"),
    stat = "stratum",
    size = 4,
    nudge_x = .5,
    point.padding = 3,
    aes(fill = basin, label = basin),
    decreasing = FALSE
  )+
  scale_fill_brewer(palette = "Paired", guide = "none") +
  scale_y_continuous(limits = c(0, 32), expand = c(0, 0)) +
  labs(y = dcant_pgc_label) +
  theme(axis.text.x = element_text(angle = 45, hjust = 1),
        axis.title.x = element_blank()) +
  theme_classic()


newdat <- tibble(layer_data(g1))

change <-
  newdat %>%
  select(x, alluvium, count) %>%
  pivot_wider(names_from = x,
              values_from = count) %>%
  mutate(dcant_change = round(100*(`2` - `1`) / `1`)) %>%
  select(alluvium, dcant_change)

coord <- newdat %>%
  filter(x == 2) %>%
  select(x, y, alluvium)

new_layer <- full_join(
  change,
  coord
)

new_layer <- new_layer %>%
  mutate(dcant_change = as.character(dcant_change),
         dcant_change = if_else(str_detect(dcant_change, "-"),
                                dcant_change,
                                paste0("+", dcant_change)),
         dcant_change = paste(dcant_change, "%"))

g1 +
  geom_text(data = new_layer,
            aes(
              x = x - 0.3,
              y = y,
              label = dcant_change
            ),
            inherit.aes = FALSE)
| Version | Author | Date |
|---|---|---|
| 318fefe | jens-daniel-mueller | 2022-08-11 |
| 5b77c4f | jens-daniel-mueller | 2022-08-10 |
| 9c3be27 | jens-daniel-mueller | 2022-08-09 |
| a691b29 | jens-daniel-mueller | 2022-08-09 |
| 910f96e | jens-daniel-mueller | 2022-08-08 |
| fea41c1 | jens-daniel-mueller | 2022-07-20 |
| d803308 | jens-daniel-mueller | 2022-07-19 |
| d2ae54c | jens-daniel-mueller | 2022-07-18 |
| d20faeb | jens-daniel-mueller | 2022-07-17 |
| efa414b | jens-daniel-mueller | 2022-07-16 |
| 6be73e0 | jens-daniel-mueller | 2022-06-30 |
| a26a21d | jens-daniel-mueller | 2022-06-27 |
| 748aa43 | jens-daniel-mueller | 2022-06-27 |
| 87e9eb8 | jens-daniel-mueller | 2022-06-27 |
| b52b159 | jens-daniel-mueller | 2022-06-27 |
| 1d73ec9 | jens-daniel-mueller | 2022-05-16 |
| 2ca0109 | jens-daniel-mueller | 2022-05-02 |
| b018a9a | jens-daniel-mueller | 2022-04-29 |
| e09320d | jens-daniel-mueller | 2022-04-12 |
| acad2e2 | jens-daniel-mueller | 2022-04-09 |
| 3d81135 | jens-daniel-mueller | 2022-04-07 |
| a74e341 | jens-daniel-mueller | 2022-04-04 |
| bd9e11d | jens-daniel-mueller | 2022-03-22 |
| 2501978 | jens-daniel-mueller | 2022-03-21 |
| d2191ad | jens-daniel-mueller | 2022-02-04 |
| 5f2aed0 | jens-daniel-mueller | 2022-01-27 |
| 9753eb8 | jens-daniel-mueller | 2022-01-26 |
| b1d7720 | jens-daniel-mueller | 2022-01-21 |
| 4fe7150 | jens-daniel-mueller | 2022-01-21 |
g2 <- dcant_budget_basin_MLR_all_plot %>%
    filter(period != "1800 - 1994") %>%
  ggplot(aes(
    y = dcant,
    x = period,
    alluvium = basin,
    fill  = basin,
    stratum = basin,
    label = basin
  )) +
  geom_alluvium() +
  geom_stratum() +
  stat_stratum(geom = "text",
               aes(label = paste(
                 round(after_stat(count),1)
                 # 100*round(after_stat(prop), 2), "%"
                 ))) +
  ggrepel::geom_label_repel(
    data = dcant_budget_basin_MLR_all_plot %>% filter(period == "2004 - 2014"),
    stat = "stratum",
    size = 4,
    nudge_x = .5,
    point.padding = 3,
    aes(fill = basin)
  )+
  scale_fill_brewer(palette = "Paired", guide = "none") +
  scale_color_brewer(palette = "Paired", guide = "none") +
  scale_y_continuous(limits = c(0, 33), expand = c(0, 0)) +
  guides(y = "none") +
  labs(title = dcant_pgc_label) +
  theme_classic() +
  theme(axis.text.x = element_text(angle = 45, hjust = 1),
        axis.title.x = element_blank(),
        axis.title.y = element_blank(),
        plot.title = element_text(hjust = 0.5))


newdat <- tibble(layer_data(g2))

change_basin <-
  newdat %>%
  select(x, alluvium, count) %>%
  pivot_wider(names_from = x,
              values_from = count) %>%
  mutate(dcant_change = round(100*(`2` - `1`) / `1`)) %>%
  select(alluvium, dcant_change)

coord_basin <- newdat %>%
  filter(x == 2) %>%
  select(x, y, alluvium)

new_layer_basin <- full_join(
  change_basin,
  coord_basin
)

new_layer_basin <- new_layer_basin %>%
  mutate(dcant_change = as.character(dcant_change),
         dcant_change = if_else(str_detect(dcant_change, "-"),
                                dcant_change,
                                paste0("+", dcant_change)),
         dcant_change = paste(dcant_change, "%"))

new_layer_total <-
  newdat %>%
  select(x, alluvium, count) %>%
  group_by(x) %>%
  summarise(dcant_change = sum(count)) %>%
  ungroup()

new_layer_total <- new_layer_total %>%
  mutate(y = dcant_change,
         dcant_change = as.character(round(dcant_change,1)),
         dcant_change = paste("global:",dcant_change))

g2 +
  geom_text(data = new_layer_basin,
            aes(
              x = x - 0.3,
              y = y,
              label = dcant_change
            ),
            inherit.aes = FALSE) +
  geom_label(data = new_layer_total,
            aes(
              x = x,
              y = y + 1,
              label = dcant_change
            ),
            inherit.aes = FALSE)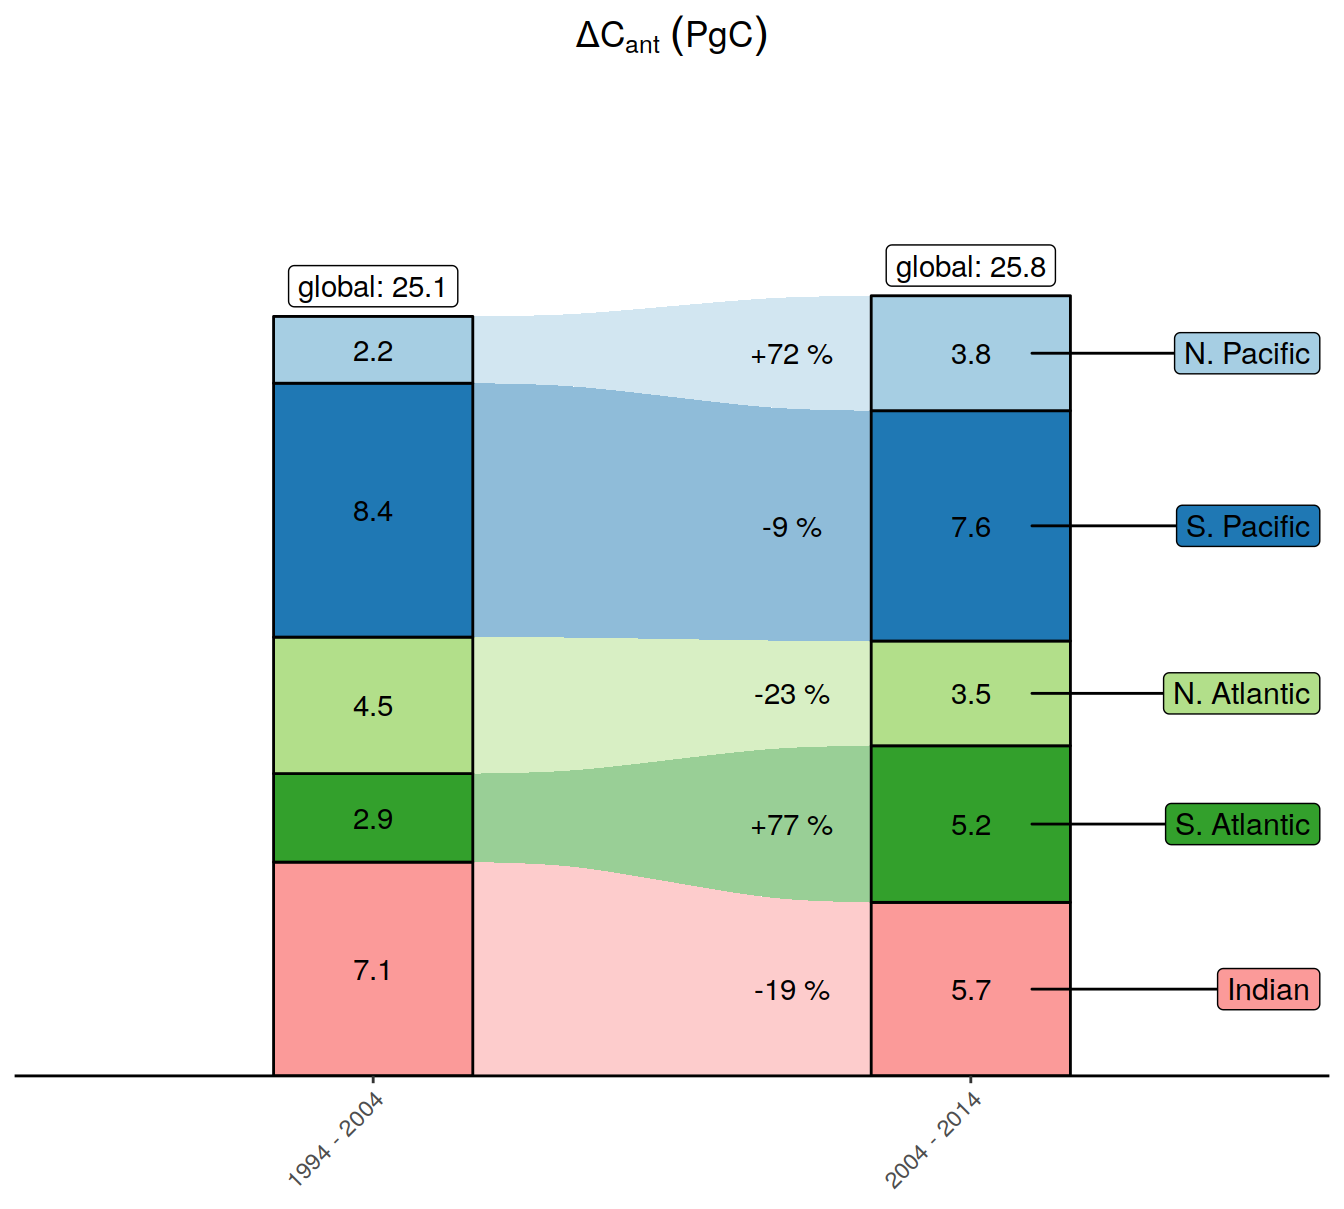
| Version | Author | Date |
|---|---|---|
| 318fefe | jens-daniel-mueller | 2022-08-11 |
| 5b77c4f | jens-daniel-mueller | 2022-08-10 |
| 9c3be27 | jens-daniel-mueller | 2022-08-09 |
| a691b29 | jens-daniel-mueller | 2022-08-09 |
| 910f96e | jens-daniel-mueller | 2022-08-08 |
| fea41c1 | jens-daniel-mueller | 2022-07-20 |
| d803308 | jens-daniel-mueller | 2022-07-19 |
| d2ae54c | jens-daniel-mueller | 2022-07-18 |
| 2695085 | jens-daniel-mueller | 2022-07-17 |
| d20faeb | jens-daniel-mueller | 2022-07-17 |
| efa414b | jens-daniel-mueller | 2022-07-16 |
| 6be73e0 | jens-daniel-mueller | 2022-06-30 |
| a26a21d | jens-daniel-mueller | 2022-06-27 |
| 748aa43 | jens-daniel-mueller | 2022-06-27 |
| 87e9eb8 | jens-daniel-mueller | 2022-06-27 |
| b52b159 | jens-daniel-mueller | 2022-06-27 |
| 1d73ec9 | jens-daniel-mueller | 2022-05-16 |
| 2ca0109 | jens-daniel-mueller | 2022-05-02 |
| b018a9a | jens-daniel-mueller | 2022-04-29 |
| e09320d | jens-daniel-mueller | 2022-04-12 |
| acad2e2 | jens-daniel-mueller | 2022-04-09 |
| 3d81135 | jens-daniel-mueller | 2022-04-07 |
| a74e341 | jens-daniel-mueller | 2022-04-04 |
| bd9e11d | jens-daniel-mueller | 2022-03-22 |
| 2501978 | jens-daniel-mueller | 2022-03-21 |
| d2191ad | jens-daniel-mueller | 2022-02-04 |
| ec7fe7e | jens-daniel-mueller | 2022-01-31 |
| 5f2aed0 | jens-daniel-mueller | 2022-01-27 |
| 9753eb8 | jens-daniel-mueller | 2022-01-26 |
| b1d7720 | jens-daniel-mueller | 2022-01-21 |
| 4fe7150 | jens-daniel-mueller | 2022-01-21 |
10.2.2 Scaled
dcant_budget_basin_MLR_all_plot <- left_join(dcant_budget_basin_MLR_all_plot,
                           co2_atm %>% rename(tref1 = year,
                                              pCO21 = pCO2))

dcant_budget_basin_MLR_all_plot <- left_join(dcant_budget_basin_MLR_all_plot,
                           co2_atm %>% rename(tref2 = year,
                                              pCO22 = pCO2))

dcant_budget_basin_MLR_all_plot <- dcant_budget_basin_MLR_all_plot %>%
  mutate(delta_pCO2 = pCO22 - pCO21,
         beta = dcant / delta_pCO2,
         dcant_sd_scaled = dcant_sd / delta_pCO2) %>%
  select(-starts_with("pCO2"))


dcant_budget_global_all_ensemble_summary <- left_join(dcant_budget_global_all_ensemble_summary,
                           co2_atm %>% rename(tref1 = year,
                                              pCO21 = pCO2))

dcant_budget_global_all_ensemble_summary <- left_join(dcant_budget_global_all_ensemble_summary,
                           co2_atm %>% rename(tref2 = year,
                                              pCO22 = pCO2))

dcant_budget_global_all_ensemble_summary <- dcant_budget_global_all_ensemble_summary %>%
  mutate(delta_pCO2 = pCO22 - pCO21,
         beta = dcant_mean / delta_pCO2,
         dcant_sd_scaled = dcant_sd / delta_pCO2) %>%
  select(-starts_with("pCO2"))
g2 <- dcant_budget_basin_MLR_all_plot %>%
filter(period != "1800 - 1994") %>%
ggplot(aes(
y = beta,
x = period,
alluvium = basin,
fill = basin,
stratum = basin,
label = basin
)) +
geom_alluvium() +
geom_stratum() +
stat_stratum(geom = "text",
aes(label = paste(
round(after_stat(count),2)
# 100*round(after_stat(prop), 2), "%"
))) +
ggrepel::geom_label_repel(
data = dcant_budget_basin_MLR_all_plot %>% filter(period == "2004 - 2014"),
stat = "stratum",
size = 4,
nudge_x = .5,
point.padding = 3,
aes(fill = basin)
)+
scale_fill_brewer(palette = "Paired", guide = "none") +
scale_color_brewer(palette = "Paired", guide = "none") +
# scale_y_continuous(limits = c(0, 33), expand = c(0, 0)) +
guides(y = "none") +
labs(title = dcant_pgc_scaled_label) +
theme_classic() +
theme(axis.text.x = element_text(angle = 45, hjust = 1),
axis.title.x = element_blank(),
axis.title.y = element_blank(),
plot.title = element_text(hjust = 0.5))
newdat <- tibble(layer_data(g2))
change_basin <-
newdat %>%
select(x, alluvium, count) %>%
pivot_wider(names_from = x,
values_from = count) %>%
mutate(dcant_change = round(100*(`2` - `1`) / `1`)) %>%
select(alluvium, dcant_change)
coord_basin <- newdat %>%
filter(x == 2) %>%
select(x, y, alluvium)
new_layer_basin <- full_join(
change_basin,
coord_basin
)
new_layer_basin <- new_layer_basin %>%
mutate(dcant_change = as.character(dcant_change),
dcant_change = if_else(str_detect(dcant_change, "-"),
dcant_change,
paste0("+", dcant_change)),
dcant_change = paste(dcant_change, "%"))
new_layer_total <-
newdat %>%
select(x, alluvium, count) %>%
group_by(x) %>%
summarise(dcant_change = sum(count)) %>%
ungroup()
new_layer_total <- new_layer_total %>%
mutate(y = dcant_change,
dcant_change = as.character(round(dcant_change,2)),
dcant_change = paste("global:",dcant_change))
g2 +
geom_text(data = new_layer_basin,
aes(
x = x - 0.3,
y = y,
label = dcant_change
),
inherit.aes = FALSE) +
geom_label(data = new_layer_total,
aes(
x = x,
y = y + 0.05,
label = dcant_change
),
inherit.aes = FALSE)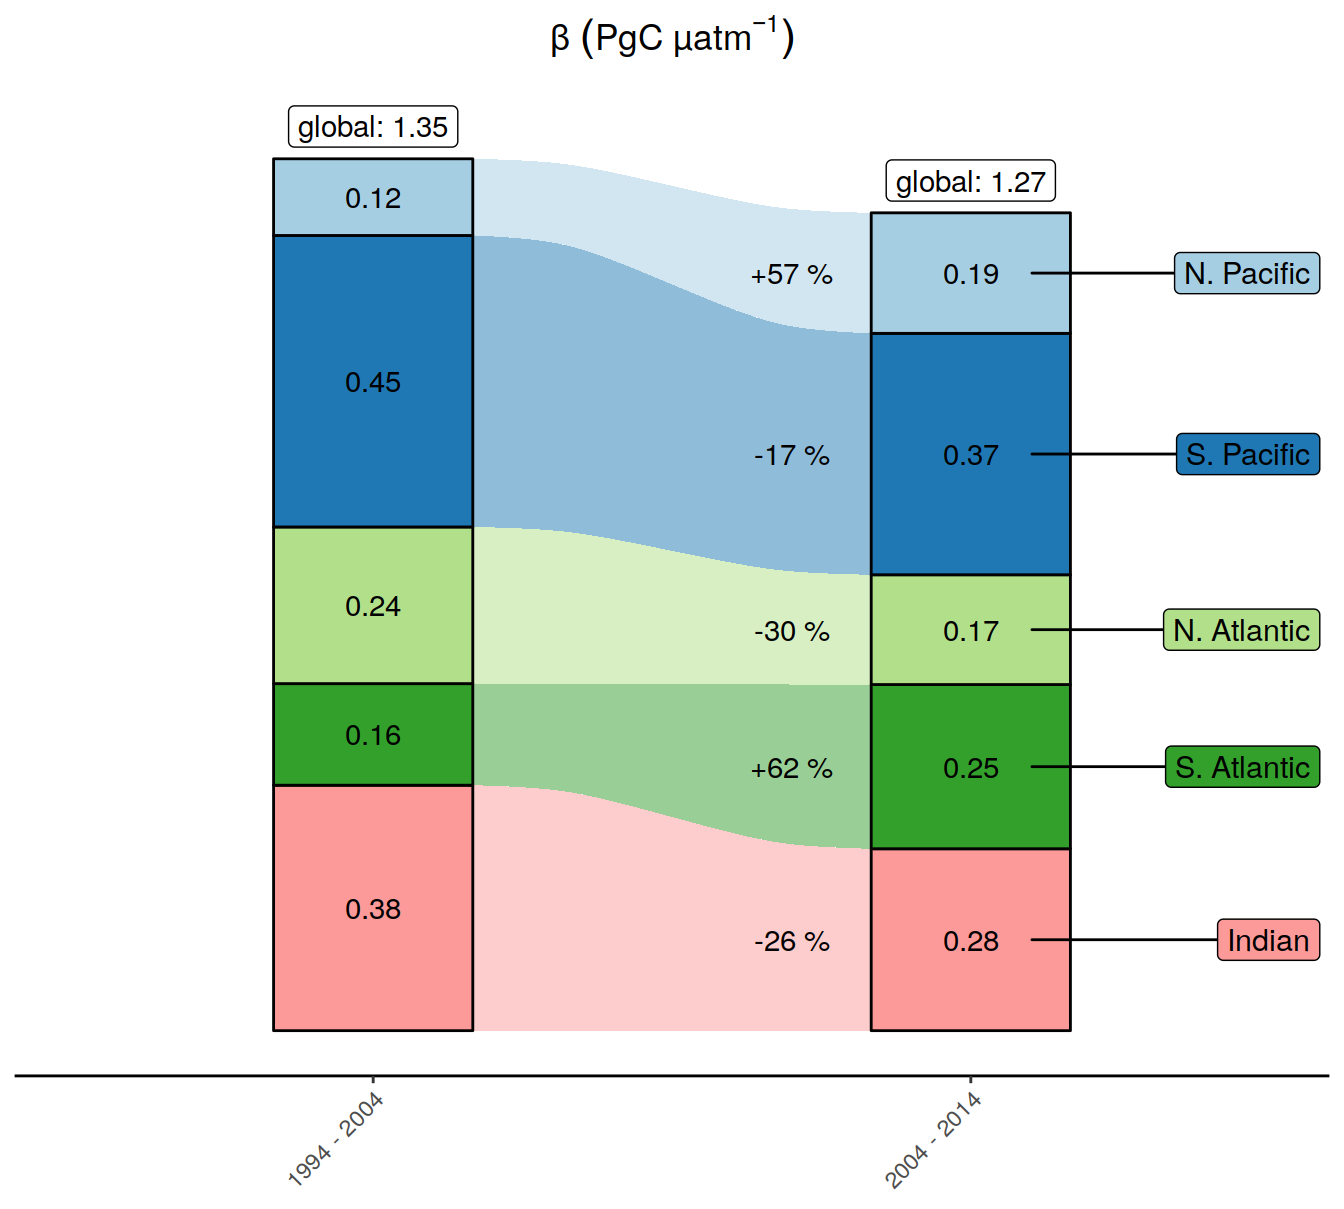
| Version | Author | Date |
|---|---|---|
| 318fefe | jens-daniel-mueller | 2022-08-11 |
| 5b77c4f | jens-daniel-mueller | 2022-08-10 |
| 9c3be27 | jens-daniel-mueller | 2022-08-09 |
| a691b29 | jens-daniel-mueller | 2022-08-09 |
| 910f96e | jens-daniel-mueller | 2022-08-08 |
| fea41c1 | jens-daniel-mueller | 2022-07-20 |
| d803308 | jens-daniel-mueller | 2022-07-19 |
| d2ae54c | jens-daniel-mueller | 2022-07-18 |
| 2695085 | jens-daniel-mueller | 2022-07-17 |
| d20faeb | jens-daniel-mueller | 2022-07-17 |
| efa414b | jens-daniel-mueller | 2022-07-16 |
| 6be73e0 | jens-daniel-mueller | 2022-06-30 |
| a26a21d | jens-daniel-mueller | 2022-06-27 |
| 748aa43 | jens-daniel-mueller | 2022-06-27 |
| 87e9eb8 | jens-daniel-mueller | 2022-06-27 |
| b52b159 | jens-daniel-mueller | 2022-06-27 |
| 1d73ec9 | jens-daniel-mueller | 2022-05-16 |
| 2ca0109 | jens-daniel-mueller | 2022-05-02 |
| b018a9a | jens-daniel-mueller | 2022-04-29 |
| e09320d | jens-daniel-mueller | 2022-04-12 |
| acad2e2 | jens-daniel-mueller | 2022-04-09 |
| 3d81135 | jens-daniel-mueller | 2022-04-07 |
| a74e341 | jens-daniel-mueller | 2022-04-04 |
| bd9e11d | jens-daniel-mueller | 2022-03-22 |
| 2501978 | jens-daniel-mueller | 2022-03-21 |
| 2116dd3 | jens-daniel-mueller | 2022-02-09 |
| d2191ad | jens-daniel-mueller | 2022-02-04 |
| ed903f7 | jens-daniel-mueller | 2022-02-02 |
g2 <- dcant_budget_basin_MLR_all_plot %>%
  ggplot(aes(
    y = beta,
    x = period,
    alluvium = basin,
    fill  = basin,
    stratum = basin,
    label = basin
  )) +
  geom_alluvium() +
  geom_stratum() +
  stat_stratum(geom = "text",
               aes(label = paste(
                 round(after_stat(count),2)
                 # 100*round(after_stat(prop), 2), "%"
                 ))) +
  ggrepel::geom_label_repel(
    data = dcant_budget_basin_MLR_all_plot %>% filter(period == "2004 - 2014"),
    stat = "stratum",
    size = 4,
    nudge_x = .5,
    point.padding = 3,
    aes(fill = basin)
  )+
  scale_fill_brewer(palette = "Paired", guide = "none") +
  scale_color_brewer(palette = "Paired", guide = "none") +
  scale_y_continuous(limits = c(0, 1.7), expand = c(0, 0)) +
  guides(y = "none") +
  labs(title = dcant_pgc_scaled_label) +
  theme_classic() +
  theme(axis.text.x = element_text(angle = 45, hjust = 1),
        axis.title.x = element_blank(),
        axis.title.y = element_blank(),
        plot.title = element_text(hjust = 0.5))


newdat <- tibble(layer_data(g2))

change_basin <-
  newdat %>%
  select(x, alluvium, count) %>%
  group_by(alluvium) %>%
  arrange(x) %>%
  mutate(dcant_change = round(100*(count - lag(count)) / lag(count))) %>%
  ungroup()

coord_basin <- newdat %>%
  select(x, y, alluvium)

new_layer_basin <- left_join(
  change_basin %>% drop_na(),
  coord_basin
)

new_layer_basin <- new_layer_basin %>%
  mutate(dcant_change = as.character(dcant_change),
         dcant_change = if_else(str_detect(dcant_change, "-"),
                                dcant_change,
                                paste0("+", dcant_change)),
         dcant_change = paste(dcant_change, "%"))

new_layer_total <-
  newdat %>%
  select(x, alluvium, count) %>%
  group_by(x) %>%
  summarise(dcant_change = sum(count)) %>%
  ungroup()

new_layer_total <- new_layer_total %>%
  mutate(y = dcant_change,
         dcant_change = as.character(round(dcant_change,2)),
         dcant_change = paste("global:",dcant_change))

g2 +
  geom_text(data = new_layer_basin,
            aes(
              x = x - 0.3,
              y = y,
              label = dcant_change
            ),
            inherit.aes = FALSE) +
  geom_label(data = new_layer_total,
            aes(
              x = x,
              y = y + 0.1,
              label = dcant_change
            ),
            inherit.aes = FALSE)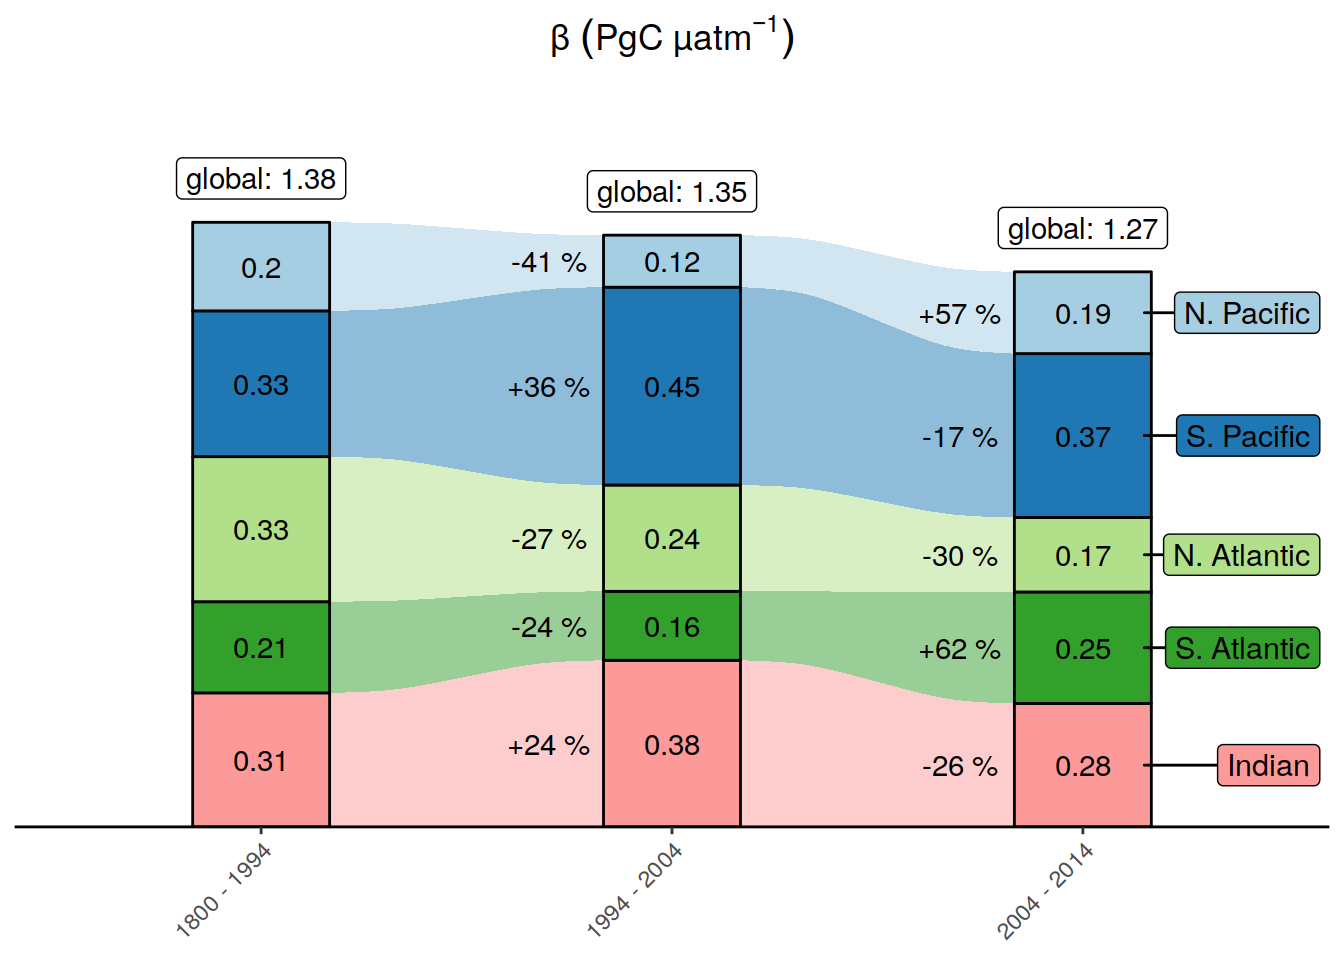
| Version | Author | Date |
|---|---|---|
| 318fefe | jens-daniel-mueller | 2022-08-11 |
| 5b77c4f | jens-daniel-mueller | 2022-08-10 |
| 9c3be27 | jens-daniel-mueller | 2022-08-09 |
| a691b29 | jens-daniel-mueller | 2022-08-09 |
| 910f96e | jens-daniel-mueller | 2022-08-08 |
| fea41c1 | jens-daniel-mueller | 2022-07-20 |
| d803308 | jens-daniel-mueller | 2022-07-19 |
| d2ae54c | jens-daniel-mueller | 2022-07-18 |
| 2695085 | jens-daniel-mueller | 2022-07-17 |
| d20faeb | jens-daniel-mueller | 2022-07-17 |
| efa414b | jens-daniel-mueller | 2022-07-16 |
| 6be73e0 | jens-daniel-mueller | 2022-06-30 |
| a26a21d | jens-daniel-mueller | 2022-06-27 |
| 748aa43 | jens-daniel-mueller | 2022-06-27 |
| 87e9eb8 | jens-daniel-mueller | 2022-06-27 |
| b52b159 | jens-daniel-mueller | 2022-06-27 |
| 1d73ec9 | jens-daniel-mueller | 2022-05-16 |
| 2ca0109 | jens-daniel-mueller | 2022-05-02 |
| b018a9a | jens-daniel-mueller | 2022-04-29 |
| e09320d | jens-daniel-mueller | 2022-04-12 |
| acad2e2 | jens-daniel-mueller | 2022-04-09 |
| 3d81135 | jens-daniel-mueller | 2022-04-07 |
| a74e341 | jens-daniel-mueller | 2022-04-04 |
| b599680 | jens-daniel-mueller | 2022-04-04 |
| bd9e11d | jens-daniel-mueller | 2022-03-22 |
| 2501978 | jens-daniel-mueller | 2022-03-21 |
| 2116dd3 | jens-daniel-mueller | 2022-02-09 |
| d2191ad | jens-daniel-mueller | 2022-02-04 |
| fa46251 | jens-daniel-mueller | 2022-02-02 |
| 7655085 | jens-daniel-mueller | 2022-02-02 |
| 226d67d | jens-daniel-mueller | 2022-02-02 |
g2 <- dcant_budget_basin_MLR_all_plot %>%
  ggplot(aes(
    y = beta,
    x = period,
    alluvium = basin,
    fill  = basin,
    stratum = basin,
    label = basin
  )) +
  geom_alluvium() +
  geom_stratum() +
  ggrepel::geom_label_repel(
    data = dcant_budget_basin_MLR_all_plot %>% filter(period == "2004 - 2014"),
    stat = "stratum",
    size = 4,
    nudge_x = .5,
    point.padding = 3,
    aes(fill = basin)
  )+
  scale_fill_brewer(palette = "Paired", guide = "none") +
  scale_color_brewer(palette = "Paired", guide = "none") +
  scale_y_continuous(limits = c(0, 1.6), expand = c(0, 0)) +
  guides(y = "none") +
  labs(title = dcant_pgc_scaled_label) +
  theme_classic() +
  theme(axis.text.x = element_text(angle = 45, hjust = 1),
        axis.title.x = element_blank(),
        axis.title.y = element_blank(),
        plot.title = element_text(hjust = 0.5))


newdat <- tibble(layer_data(g2))

# construct budget labels

budget_basin <-
  newdat %>%
  select(x, y, alluvium, count)

budget_layer_basin <- budget_basin %>%
  mutate(dcant = as.character(round(count,2)))

# construct uncertainty labels

uncertainty_basin <-
  dcant_budget_basin_MLR_all_plot %>%
  mutate(x = fct_recode(period,
                        "2" = "1994 - 2004",
                        "3" = "2004 - 2014")) %>%
  select(x, alluvium = basin, dcant_sd_scaled) %>%
  drop_na() %>%
  arrange(x, alluvium)


coord_basin <- newdat %>%
  select(x, y, alluvium) %>%
  filter(x != 1)

uncertainty_layer_basin <- bind_cols(
  coord_basin,
  uncertainty_basin %>% select(dcant_sd_scaled),
)

# construct change labels

change_basin <-
  newdat %>%
  select(x, alluvium, count) %>%
  group_by(alluvium) %>%
  arrange(x) %>%
  mutate(dcant_change_abs = count - lag(count),
         dcant_change = round(100*(dcant_change_abs) / lag(count))) %>%
  ungroup()

coord_basin <- newdat %>%
  select(x, y, alluvium)

new_layer_basin <- left_join(
  change_basin %>% drop_na(),
  coord_basin
)

new_layer_basin <- new_layer_basin %>%
  mutate(dcant_change = as.character(dcant_change),
         dcant_change = if_else(str_detect(dcant_change, "-"),
                                dcant_change,
                                paste0("+", dcant_change)),
         dcant_change = paste0(dcant_change, "%"))

# construct global budget labels

new_layer_total <-
  newdat %>%
  select(x, alluvium, count) %>%
  group_by(x) %>%
  summarise(dcant_change = sum(count)) %>%
  ungroup()

dcant_sd_scaled <- round(c(
  0.24,
  dcant_budget_global_all_ensemble_summary %>%
    pull(dcant_sd_scaled)
), 2)

new_layer_total <- bind_cols(new_layer_total, dcant_sd_scaled = dcant_sd_scaled)

new_layer_total <- new_layer_total %>%
  mutate(y = dcant_change,
         dcant_sd_scaled_rel = round(100 * dcant_sd_scaled/dcant_change),
         dcant_change = as.character(round(dcant_change,2)),
         dcant_sd_scaled = round(dcant_sd_scaled,1),
         dcant_change = paste0(dcant_change, "\n(±", dcant_sd_scaled, ")"))

# basin change + uncertainty

budget_layer_basin <- full_join(budget_layer_basin,
                                uncertainty_layer_basin)

budget_layer_basin <-
  budget_layer_basin %>%
  mutate(dcant_sd_scaled_rel = 100*dcant_sd_scaled/count,
         dcant_sd_scaled_rel = as.character(round(dcant_sd_scaled_rel)),
         dcant_sd_scaled_numeric = dcant_sd_scaled,
         dcant_sd_scaled = round(dcant_sd_scaled, 2),
         dcant_sd_scaled = paste0("(±", dcant_sd_scaled, ")"),
         dcant_label = if_else(dcant_sd_scaled != "(±NA)",
                               paste0(dcant, "\n", dcant_sd_scaled),
                               dcant))


# uncertainty changes

uncertainty_changes <- budget_layer_basin %>%
  select(x, alluvium, dcant_sd_scaled = dcant_sd_scaled_numeric) %>%
  group_by(alluvium) %>%
  mutate(dcant_change_uncert = sqrt(dcant_sd_scaled^2 + lag(dcant_sd_scaled)^2)) %>%
  ungroup()


new_layer_basin <- left_join(new_layer_basin, uncertainty_changes) %>%
  mutate(dcant_change_uncert_rel = 100*dcant_change_uncert/abs((count + lag(count))/2),
         dcant_change_label = if_else(!is.na(dcant_change_uncert),
                                      paste0(dcant_change, "\n(±", round(dcant_change_uncert_rel), "%)"),
                                      dcant_change))


g2 +
  geom_text(data = budget_layer_basin,
            aes(
              x = x,
              y = y,
              label = dcant_label
            ),
            size = 3,
            inherit.aes = FALSE) +
  geom_text(data = new_layer_basin,
            aes(
              x = x - 0.3,
              y = y,
              label = dcant_change_label
            ),
            size = 4,
            inherit.aes = FALSE)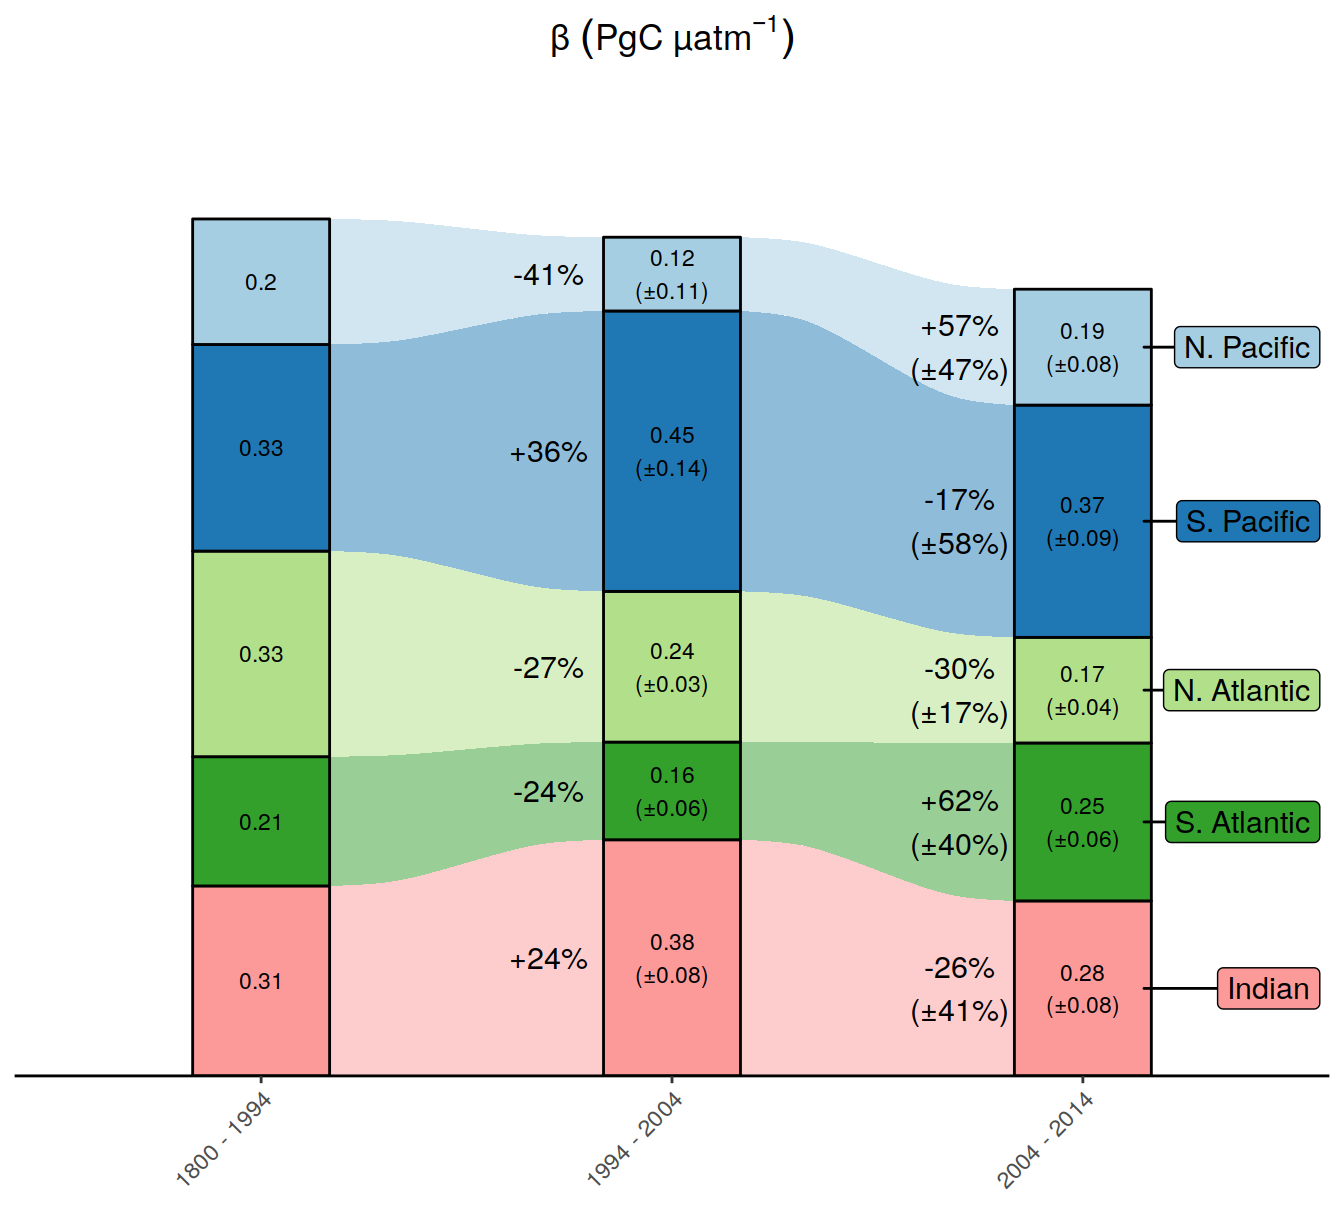
| Version | Author | Date |
|---|---|---|
| 318fefe | jens-daniel-mueller | 2022-08-11 |
| 5b77c4f | jens-daniel-mueller | 2022-08-10 |
| 9c3be27 | jens-daniel-mueller | 2022-08-09 |
| a691b29 | jens-daniel-mueller | 2022-08-09 |
| 910f96e | jens-daniel-mueller | 2022-08-08 |
| fea41c1 | jens-daniel-mueller | 2022-07-20 |
| d803308 | jens-daniel-mueller | 2022-07-19 |
| d2ae54c | jens-daniel-mueller | 2022-07-18 |
| 2695085 | jens-daniel-mueller | 2022-07-17 |
| 535196a | jens-daniel-mueller | 2022-07-17 |
| d20faeb | jens-daniel-mueller | 2022-07-17 |
| efa414b | jens-daniel-mueller | 2022-07-16 |
| afb27ad | jens-daniel-mueller | 2022-07-15 |
| b492b46 | jens-daniel-mueller | 2022-07-15 |
| bd24a0f | jens-daniel-mueller | 2022-07-15 |
| 17cd1d1 | jens-daniel-mueller | 2022-07-13 |
| 8fb595c | jens-daniel-mueller | 2022-07-12 |
| 003b161 | jens-daniel-mueller | 2022-07-12 |
| 6be73e0 | jens-daniel-mueller | 2022-06-30 |
| 8ab4a87 | jens-daniel-mueller | 2022-06-29 |
| 7629c78 | jens-daniel-mueller | 2022-06-29 |
| f6786c8 | jens-daniel-mueller | 2022-06-29 |
| a26a21d | jens-daniel-mueller | 2022-06-27 |
| 748aa43 | jens-daniel-mueller | 2022-06-27 |
| 87e9eb8 | jens-daniel-mueller | 2022-06-27 |
| b52b159 | jens-daniel-mueller | 2022-06-27 |
| 1d73ec9 | jens-daniel-mueller | 2022-05-16 |
| 2ca0109 | jens-daniel-mueller | 2022-05-02 |
| b018a9a | jens-daniel-mueller | 2022-04-29 |
| e09320d | jens-daniel-mueller | 2022-04-12 |
| 8dca96a | jens-daniel-mueller | 2022-04-12 |
| 209c9b6 | jens-daniel-mueller | 2022-04-10 |
| acad2e2 | jens-daniel-mueller | 2022-04-09 |
| 3d81135 | jens-daniel-mueller | 2022-04-07 |
| a74e341 | jens-daniel-mueller | 2022-04-04 |
| b599680 | jens-daniel-mueller | 2022-04-04 |
| bd9e11d | jens-daniel-mueller | 2022-03-22 |
| 2501978 | jens-daniel-mueller | 2022-03-21 |
| 094bfa0 | jens-daniel-mueller | 2022-02-18 |
| 2116dd3 | jens-daniel-mueller | 2022-02-09 |
| a6b33aa | jens-daniel-mueller | 2022-02-04 |
| 4b48475 | jens-daniel-mueller | 2022-02-04 |
| fec5a1e | jens-daniel-mueller | 2022-02-04 |
| d2191ad | jens-daniel-mueller | 2022-02-04 |
| c7b4984 | jens-daniel-mueller | 2022-02-02 |
| 7fb28a2 | jens-daniel-mueller | 2022-02-02 |
| 49097e8 | jens-daniel-mueller | 2022-02-02 |
| fe11bfd | jens-daniel-mueller | 2022-02-02 |
  # geom_label(data = new_layer_total,
  #           aes(
  #             x = x,
  #             y = y + 0.13,
  #             label = dcant_change
  #           ),
  #           size = 4,
  #           inherit.aes = FALSE)


# ggsave(path = here::here("output/publication"),
#        filename = "Fig_budget_beta_basin_hemisphere.png",
#        height = 6,
#        width = 8)
10.3 Depth layer
10.3.1 Global
dcant_budget_change <- dcant_budget_global_layer_all %>%
  filter(estimate == "dcant",
         period != "1994 - 2014",
         inv_depth <= 3000,
         data_source == "obs") %>%
  rename(dcant = value) %>%
  select(-c(tref1, tref2, Version_ID)) %>%
  pivot_wider(names_from = period,
              values_from = dcant) %>%
  mutate(sign = if_else(`2004 - 2014` - `1994 - 2004` > 0,
                        "increase",
                        "decrease"))

dcant_budget_layer <- dcant_budget_global_layer_all %>%
  filter(estimate == "dcant",
         period != "1994 - 2014",
         inv_depth <= 3400,
         data_source == "obs") %>%
  rename(dcant = value) %>%
  group_by(basin, period, data_source) %>%
  mutate(dcant = if_else(is.na(lead(dcant)), 888, dcant),
         dcant = na_if(dcant, 888)) %>%
  fill(dcant) %>%
  ungroup()

dcant_budget_layer %>%
  ggplot() +
  geom_hline(yintercept = 0) +
  geom_rect(
    data = dcant_budget_change,
    aes(
      xmin = inv_depth - 250,
      xmax = inv_depth + 250,
      ymin = `1994 - 2004`,
      ymax = `2004 - 2014`,
      fill = sign
    ),
    alpha = 0.4
  ) +
  geom_step(aes(inv_depth - 250, dcant, col = period), direction = "vh",
            size = 1) +
  coord_flip() +
  scale_x_reverse(breaks = seq(0, 3000, 500)) +
  scale_color_brewer(palette = "Set1", direction = -1, name = "period") +
  scale_fill_brewer(palette = "Set1", direction = -1, name = "") +
  facet_wrap(~ basin, ncol = 3, dir = "v") +
  labs(y = dcant_layer_budget_label,
       x = "Depth (m)") +
      theme(legend.position = c(0.8,0.2))
dcant_budget_change <- dcant_budget_global_layer_all %>%
  filter(estimate == "dcant",
         period != "1994 - 2014",
         inv_depth <= 3000,
         data_source == "obs") %>%
  rename(dcant = value) %>%
  arrange(inv_depth) %>%
  group_by(data_source, basin, period) %>%
  mutate(dcant_cum = cumsum(dcant)) %>%
  ungroup() %>%
  select(-c(tref2, Version_ID, dcant)) %>%
  pivot_wider(names_from = period,
              values_from = dcant_cum) %>%
  mutate(sign = if_else(`2004 - 2014` - `1994 - 2004` > 0,
                        "increase",
                        "decrease"))

dcant_budget_layer <- dcant_budget_global_layer_all %>%
  filter(estimate == "dcant",
         period != "1994 - 2014",
         inv_depth <= 3400,
         data_source == "obs") %>%
  rename(dcant = value) %>%
  arrange(inv_depth) %>%
  group_by(data_source, basin, period) %>%
  mutate(dcant_cum = cumsum(dcant)) %>%
  ungroup() %>%
  group_by(basin, period, data_source) %>%
  mutate(dcant_cum = if_else(is.na(lead(dcant_cum)), 888, dcant_cum),
         dcant_cum = na_if(dcant_cum, 888)) %>%
  fill(dcant_cum) %>%
  ungroup()


dcant_budget_layer %>%
  ggplot() +
  geom_hline(yintercept = 0) +
  geom_rect(
    data = dcant_budget_change,
    aes(
      xmin = inv_depth - 250,
      xmax = inv_depth + 250,
      ymin = `1994 - 2004`,
      ymax = `2004 - 2014`,
      fill = sign
    ),
    alpha = 0.3
  ) +
  geom_step(aes(inv_depth - 250, dcant_cum, col = period), direction = "vh",
            size = 1) +
  coord_flip() +
  scale_x_reverse(breaks = seq(0, 3000, 500)) +
  scale_color_brewer(palette = "Set1",
                     direction = -1,
                     name = "Decade") +
  scale_fill_brewer(palette = "Set1",
                    direction = -1,
                    name = "Decadal change") +

  facet_wrap( ~ basin, ncol = 3, dir = "v") +
  labs(y = dcant_layer_budget_label,
       x = "Depth (m)",
       title = "Cumulative layer inventory change") +
      theme(legend.position = c(0.8,0.2))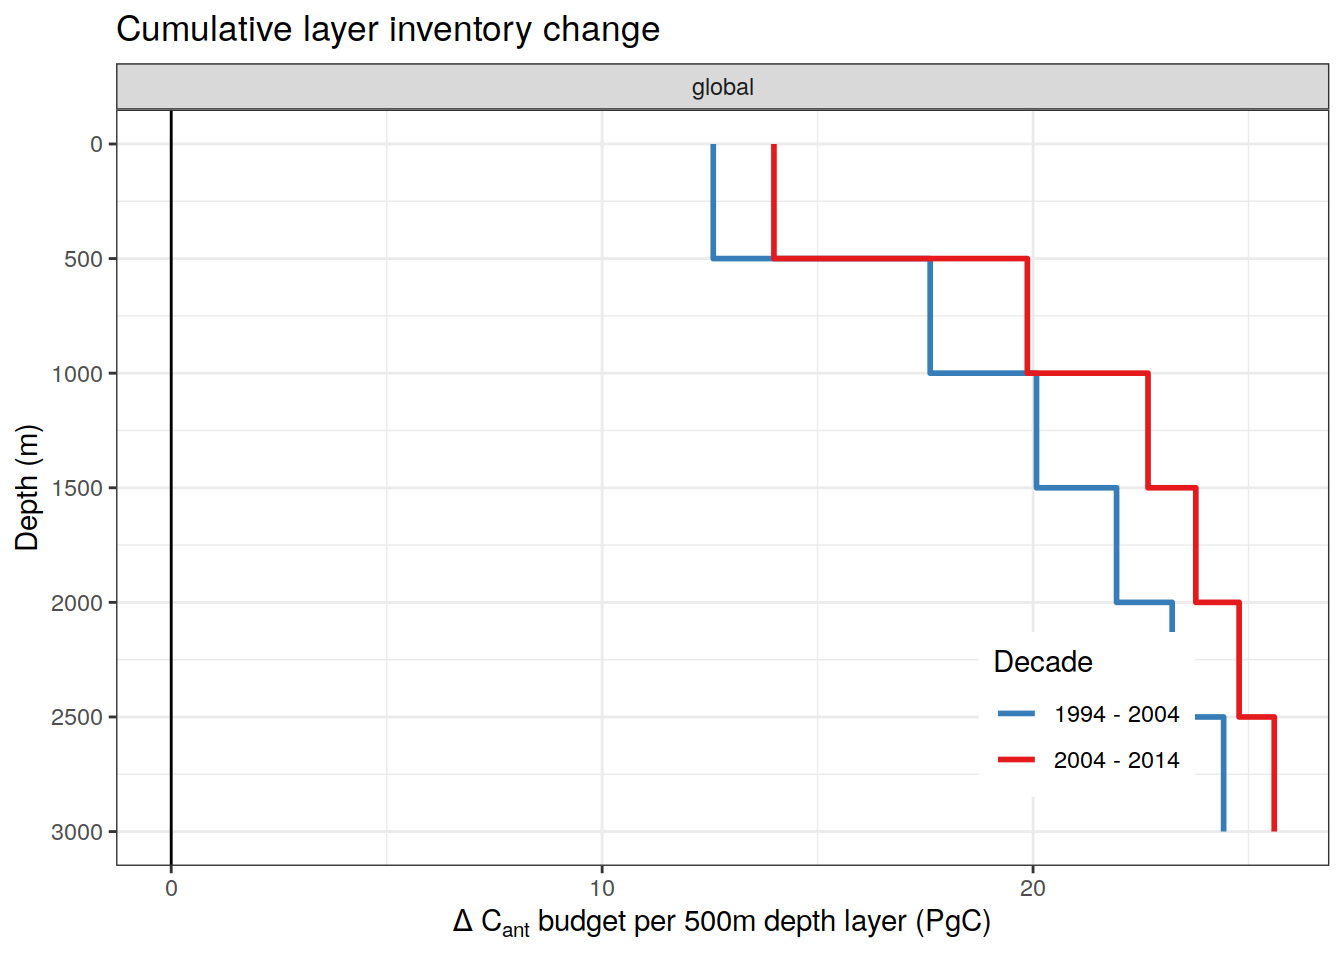
10.3.2 5 basins
dcant_budget_change <- dcant_budget_basin_MLR_layer_all %>%
  filter(estimate == "dcant",
         period != "1994 - 2014",
         inv_depth <= 3000,
         data_source == "obs") %>%
  rename(dcant = value) %>%
  select(-c(tref1, tref2, Version_ID)) %>%
  pivot_wider(names_from = period,
              values_from = dcant) %>%
  mutate(sign = if_else(`2004 - 2014` - `1994 - 2004` > 0,
                        "increase",
                        "decrease"))

dcant_budget_layer <- dcant_budget_basin_MLR_layer_all %>%
  filter(estimate == "dcant",
         period != "1994 - 2014",
         inv_depth <= 3400,
         data_source == "obs") %>%
  rename(dcant = value) %>%
  group_by(basin, period, data_source) %>%
  mutate(dcant = if_else(is.na(lead(dcant)), 888, dcant),
         dcant = na_if(dcant, 888)) %>%
  fill(dcant) %>%
  ungroup()

dcant_budget_layer %>%
  ggplot() +
  geom_hline(yintercept = 0) +
  geom_rect(
    data = dcant_budget_change,
    aes(
      xmin = inv_depth - 250,
      xmax = inv_depth + 250,
      ymin = `1994 - 2004`,
      ymax = `2004 - 2014`,
      fill = sign
    ),
    alpha = 0.4
  ) +
  geom_step(aes(inv_depth - 250, dcant, col = period), direction = "vh",
            size = 1) +
  coord_flip() +
  scale_x_reverse(breaks = seq(0, 3000, 500)) +
  scale_color_brewer(palette = "Set1", direction = -1, name = "period") +
  scale_fill_brewer(palette = "Set1", direction = -1, name = "") +
  facet_wrap(~ basin, ncol = 3, dir = "v") +
  labs(y = dcant_layer_budget_label,
       x = "Depth (m)") +
      theme(legend.position = c(0.8,0.2))
dcant_budget_range <- dcant_budget_basin_MLR_layer_all_ensemble %>%
  filter(estimate == "dcant",
         period != "1994 - 2014",
         inv_depth <= 3000,
         data_source == "obs") %>%
  rename(dcant = value) %>%
  select(-c(tref1, tref2, Version_ID)) %>%
  group_by(basin, inv_depth, period) %>%
  summarise(dcant_sd = sd(dcant)*2) %>%
  ungroup()

dcant_budget_layer <-
  full_join(dcant_budget_range,
            dcant_budget_layer)

p_dcant_budget_depth_layer <-
dcant_budget_layer %>%
  ggplot() +
  geom_hline(yintercept = 0, size = 0.1) +
  geom_vline(xintercept = 1000, size = 0.1) +
  geom_rect(
    aes(
      xmin = inv_depth - 250,
      xmax = inv_depth + 250,
      ymin = dcant - dcant_sd,
      ymax = dcant + dcant_sd,
      fill = period
    ),
    alpha = 0.4
  ) +
  geom_step(aes(inv_depth - 250, dcant, col = period), direction = "vh",
            size = 1) +
  coord_flip() +
  scale_x_reverse(breaks = seq(0, 3000, 500), limits = c(3000, 0)) +
  scale_color_manual(values = c("#EE7733", "#009988"), name = "Mean \u00B1 2 SD") +
  scale_fill_manual(values = c("#EE7733", "#009988"), name = "Mean \u00B1 2 SD") +
  labs(y = dcant_layer_budget_label,
       x = "Depth (m)") +
  facet_wrap(~ basin, ncol = 3, dir = "v", scales = "free_x") +
  theme(legend.position = c(0.9, 0.1))

p_dcant_budget_depth_layer
| Version | Author | Date |
|---|---|---|
| fea41c1 | jens-daniel-mueller | 2022-07-20 |
| d803308 | jens-daniel-mueller | 2022-07-19 |
| b1f7ab3 | jens-daniel-mueller | 2022-07-18 |
| d2ae54c | jens-daniel-mueller | 2022-07-18 |
| 2695085 | jens-daniel-mueller | 2022-07-17 |
| 535196a | jens-daniel-mueller | 2022-07-17 |
| afb27ad | jens-daniel-mueller | 2022-07-15 |
| b492b46 | jens-daniel-mueller | 2022-07-15 |
| bd24a0f | jens-daniel-mueller | 2022-07-15 |
| 17cd1d1 | jens-daniel-mueller | 2022-07-13 |
| 26e9496 | jens-daniel-mueller | 2022-07-12 |
p_dcant_profiles + p_dcant_budget_depth_layer +
  plot_layout(ncol = 1) +
  plot_annotation(tag_levels = 'A')
ggsave(path = here::here("output/publication"),
       filename = "Fig_dcant_profiles_and_depth_layer_budget.png",
       height = 12,
       width = 8)
dcant_budget_layer <- dcant_budget_basin_MLR_layer_all %>%
filter(estimate == "dcant",
period != "1994 - 2014",
inv_depth <= 3400,
data_source != "obs") %>%
rename(dcant = value) %>%
group_by(basin, period, data_source) %>%
mutate(dcant = if_else(is.na(lead(dcant)), 888, dcant),
dcant = na_if(dcant, 888)) %>%
fill(dcant) %>%
ungroup()
dcant_budget_range <- dcant_budget_basin_MLR_layer_all_ensemble %>%
filter(estimate == "dcant",
period != "1994 - 2014",
inv_depth <= 3000,
data_source != "obs") %>%
rename(dcant = value) %>%
select(-c(tref1, tref2, Version_ID)) %>%
group_by(basin, inv_depth, period, data_source) %>%
summarise(dcant_sd = sd(dcant)*2) %>%
ungroup()
dcant_budget_layer <-
full_join(dcant_budget_range,
dcant_budget_layer)
p_dcant_budget_depth_layer_mod <-
dcant_budget_layer %>%
mutate(data_source = case_when(
data_source == "mod" ~ "Reconstruction",
data_source == "mod_truth" ~ "Model truth"
)) %>%
ggplot() +
geom_hline(yintercept = 0, size = 0.1) +
geom_vline(xintercept = 1000, size = 0.1) +
geom_rect(
aes(
xmin = inv_depth - 250,
xmax = inv_depth + 250,
ymin = dcant - dcant_sd,
ymax = dcant + dcant_sd,
fill = data_source
),
alpha = 0.4
) +
geom_step(aes(inv_depth - 250, dcant, col = data_source), direction = "vh",
size = 1) +
coord_flip() +
scale_x_reverse(breaks = seq(0, 3000, 500), limits = c(3000, 0)) +
scale_color_manual(values = c("#009988", "#EE7733"), name = "Mean \u00B1 2 SD") +
scale_fill_manual(values = c("#009988", "#EE7733"), name = "Mean \u00B1 2 SD") +
labs(y = dcant_layer_budget_label,
x = "Depth (m)") +
facet_grid(period ~ basin, scales = "free_x") +
theme(legend.position = "none")
p_dcant_budget_depth_layer_mod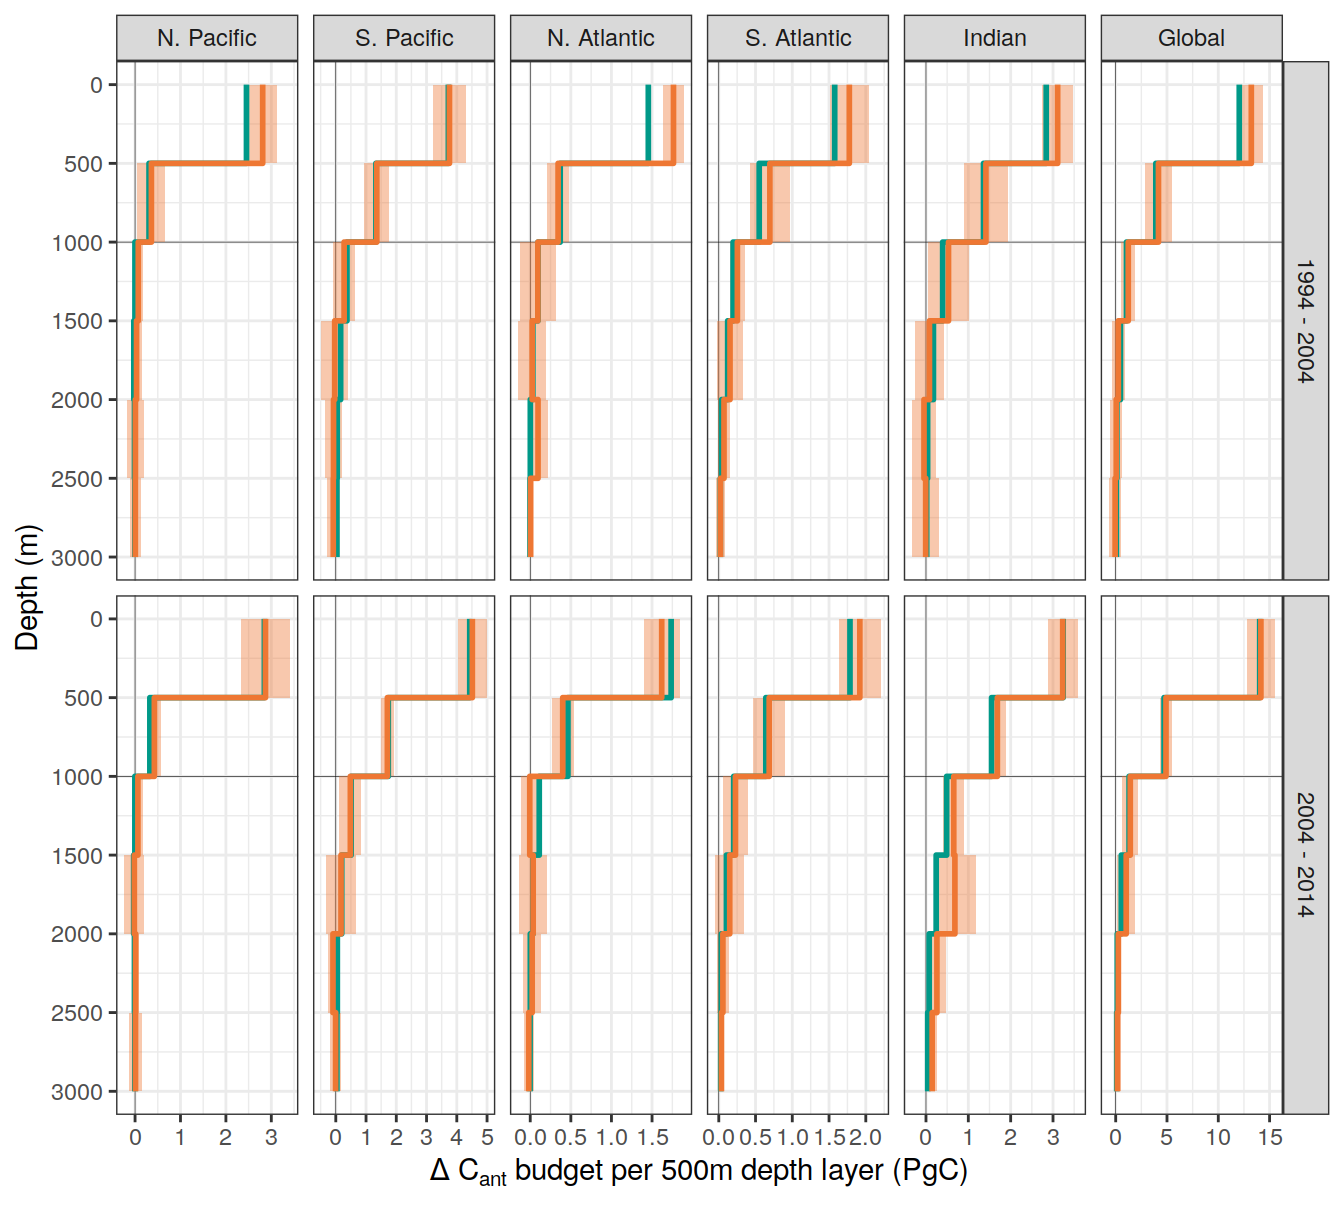
| Version | Author | Date |
|---|---|---|
| 318fefe | jens-daniel-mueller | 2022-08-11 |
p_dcant_profiles_mod + p_dcant_budget_depth_layer_mod +
  plot_layout(ncol = 1) +
  plot_annotation(tag_levels = 'A')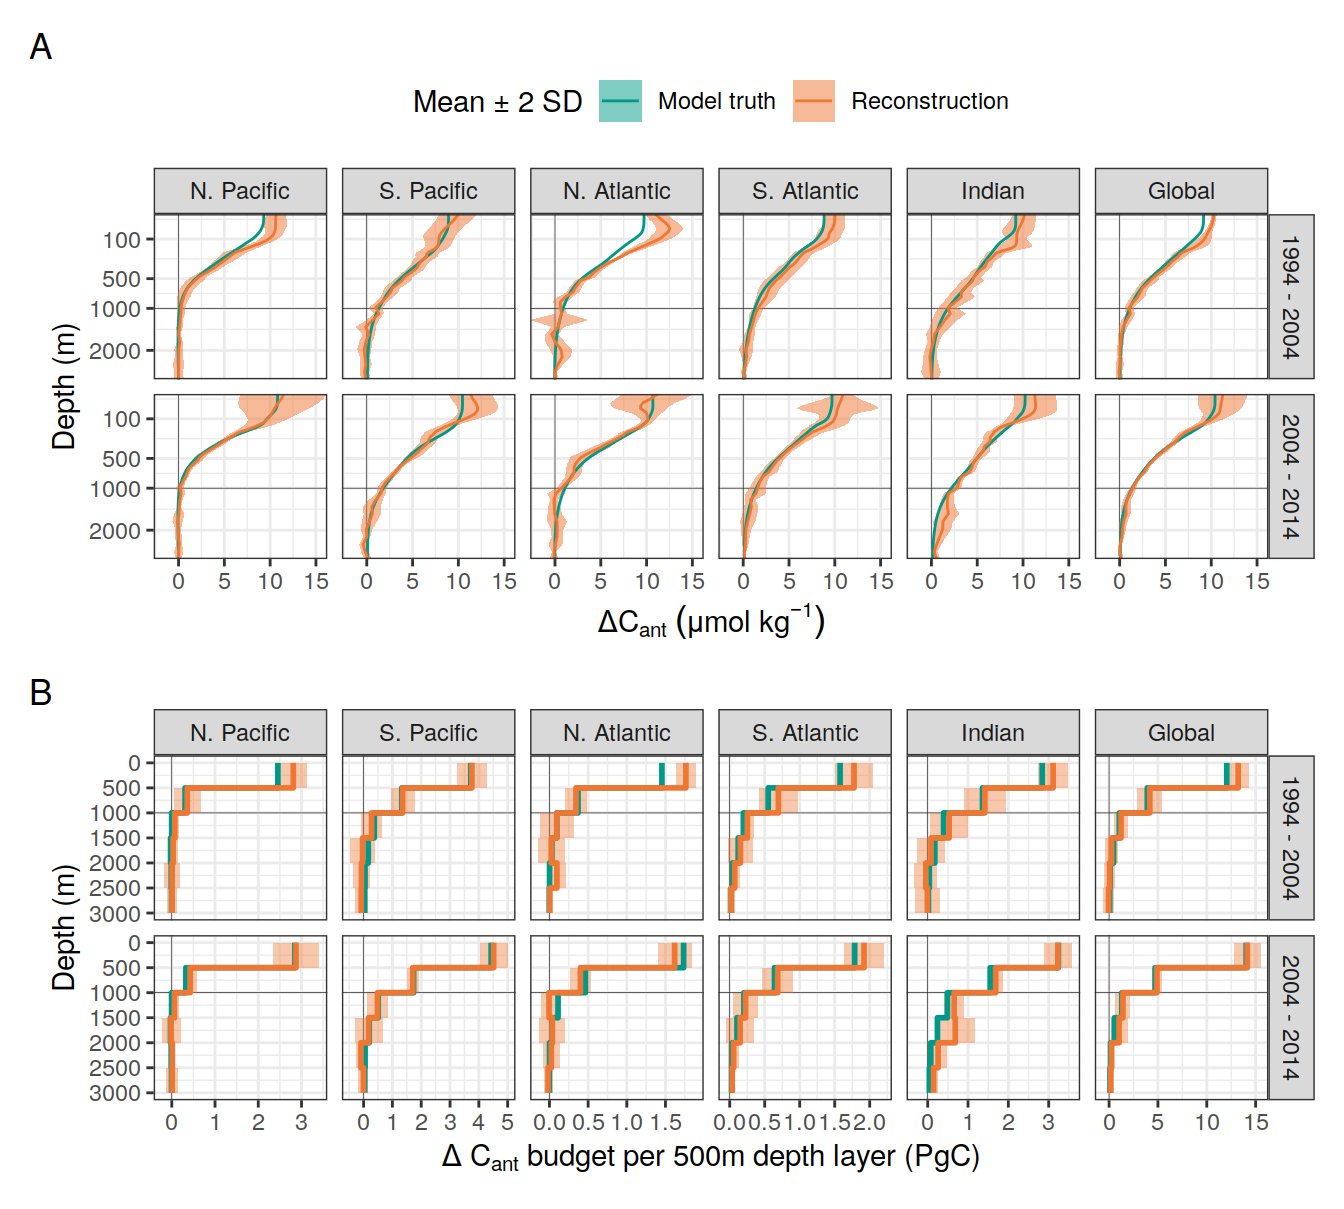
| Version | Author | Date |
|---|---|---|
| 318fefe | jens-daniel-mueller | 2022-08-11 |
ggsave(path = here::here("output/publication"),
       filename = "FigS_dcant_profiles_and_depth_layer_budget_synthetic_data.png",
       height = 10,
       width = 7)
dcant_budget_basin_MLR_layer_all_ensemble_stat <-
dcant_budget_basin_MLR_layer_all_ensemble %>%
filter(estimate == "dcant",
data_source == "obs",
inv_depth < 3000,
period %in% two_decades) %>%
group_by(basin,
period,
inv_depth) %>%
summarise(dcant_sd = sd(value) * 2) %>%
ungroup()
dcant_layer_budget_stat <-
full_join(
dcant_budget_basin_MLR_layer_all %>%
filter(
estimate == "dcant",
data_source == "obs",
inv_depth < 3000,
period %in% two_decades
) %>%
select(basin, period, inv_depth, dcant = value),
dcant_budget_basin_MLR_layer_all_ensemble_stat
)
rm(dcant_budget_basin_MLR_layer_all_ensemble_stat)
dcant_layer_budget_stat %>%
filter(period %in% two_decades) %>%
arrange(period) %>%
group_by(basin, inv_depth) %>%
mutate(delta_dcant = dcant - lag(dcant),
RSS = sqrt(dcant_sd ^ 2 + lag(dcant_sd ^ 2))) %>%
ungroup() %>%
drop_na() %>%
filter(abs(delta_dcant) >= RSS) %>%
select(basin, inv_depth, delta_dcant, RSS) %>%
kable() %>%
kable_styling() %>%
scroll_box(height = "300px")| basin | inv_depth | delta_dcant | RSS |
|---|---|---|---|
| Indian | 1750 | -0.401 | 0.3518036 |
| N. Atlantic | 1750 | -0.581 | 0.2469002 |
| N. Atlantic | 2250 | -0.291 | 0.2060254 |
| N. Atlantic | 2750 | -0.325 | 0.2312763 |
| S. Atlantic | 250 | 0.475 | 0.3500627 |
| S. Atlantic | 750 | 0.553 | 0.4456077 |
| S. Atlantic | 1250 | 0.553 | 0.3265119 |
| S. Atlantic | 1750 | 0.262 | 0.2554222 |
dcant_budget_change <- dcant_budget_basin_MLR_layer_all %>%
  filter(estimate == "dcant",
         period != "1994 - 2014",
         inv_depth <= 3000,
         data_source == "obs") %>%
  rename(dcant = value) %>%
  arrange(inv_depth) %>%
  group_by(data_source, basin, period) %>%
  mutate(dcant_cum = cumsum(dcant)) %>%
  ungroup() %>%
  select(-c(tref2, Version_ID, dcant)) %>%
  pivot_wider(names_from = period,
              values_from = dcant_cum) %>%
  mutate(sign = if_else(`2004 - 2014` - `1994 - 2004` > 0,
                        "increase",
                        "decrease"))

dcant_budget_layer <- dcant_budget_basin_MLR_layer_all %>%
  filter(estimate == "dcant",
         period != "1994 - 2014",
         inv_depth <= 3400,
         data_source == "obs") %>%
  rename(dcant = value) %>%
  arrange(inv_depth) %>%
  group_by(data_source, basin, period) %>%
  mutate(dcant_cum = cumsum(dcant)) %>%
  ungroup() %>%
  group_by(basin, period, data_source) %>%
  mutate(dcant_cum = if_else(is.na(lead(dcant_cum)), 888, dcant_cum),
         dcant_cum = na_if(dcant_cum, 888)) %>%
  fill(dcant_cum) %>%
  ungroup()


dcant_budget_layer %>%
  ggplot() +
  geom_hline(yintercept = 0) +
  geom_rect(
    data = dcant_budget_change,
    aes(
      xmin = inv_depth - 250,
      xmax = inv_depth + 250,
      ymin = `1994 - 2004`,
      ymax = `2004 - 2014`,
      fill = sign
    ),
    alpha = 0.3
  ) +
  geom_step(aes(inv_depth - 250, dcant_cum, col = period), direction = "vh",
            size = 1) +
  coord_flip() +
  scale_x_reverse(breaks = seq(0, 3000, 500)) +
  scale_color_brewer(palette = "Set1",
                     direction = -1,
                     name = "Decade") +
  scale_fill_brewer(palette = "Set1",
                    direction = -1,
                    name = "Decadal change") +

  facet_wrap( ~ basin, ncol = 3, dir = "v") +
  labs(y = dcant_layer_budget_label,
       x = "Depth (m)",
       title = "Cumulative layer inventory change") +
      theme(legend.position = c(0.8,0.2))
| Version | Author | Date |
|---|---|---|
| fea41c1 | jens-daniel-mueller | 2022-07-20 |
| d2ae54c | jens-daniel-mueller | 2022-07-18 |
| 2695085 | jens-daniel-mueller | 2022-07-17 |
| 26e9496 | jens-daniel-mueller | 2022-07-12 |
| 37f56b3 | jens-daniel-mueller | 2022-07-01 |
| df21d31 | jens-daniel-mueller | 2022-07-01 |
| 87e9eb8 | jens-daniel-mueller | 2022-06-27 |
| b52b159 | jens-daniel-mueller | 2022-06-27 |
| 1d73ec9 | jens-daniel-mueller | 2022-05-16 |
| 2ca0109 | jens-daniel-mueller | 2022-05-02 |
| b018a9a | jens-daniel-mueller | 2022-04-29 |
| e09320d | jens-daniel-mueller | 2022-04-12 |
| acad2e2 | jens-daniel-mueller | 2022-04-09 |
| 3d81135 | jens-daniel-mueller | 2022-04-07 |
| a74e341 | jens-daniel-mueller | 2022-04-04 |
| bd9e11d | jens-daniel-mueller | 2022-03-22 |
| 2501978 | jens-daniel-mueller | 2022-03-21 |
| d2191ad | jens-daniel-mueller | 2022-02-04 |
| 32e9682 | jens-daniel-mueller | 2022-02-02 |
| 913e42f | jens-daniel-mueller | 2022-02-01 |
| 189de95 | jens-daniel-mueller | 2022-02-01 |
| ab001eb | jens-daniel-mueller | 2022-01-31 |
| b62308d | jens-daniel-mueller | 2022-01-31 |
| 5f2aed0 | jens-daniel-mueller | 2022-01-27 |
11 Time series
11.1 eMLR only
dcant_budget_global_all_ensemble %>%
  filter(data_source == "obs",
         period != "1994 - 2014") %>%
  ggplot(aes(tref2, dcant, group = interaction(MLR_basins, Version_ID_group),
             col=Version_ID_group)) +
  geom_path() +
  geom_point()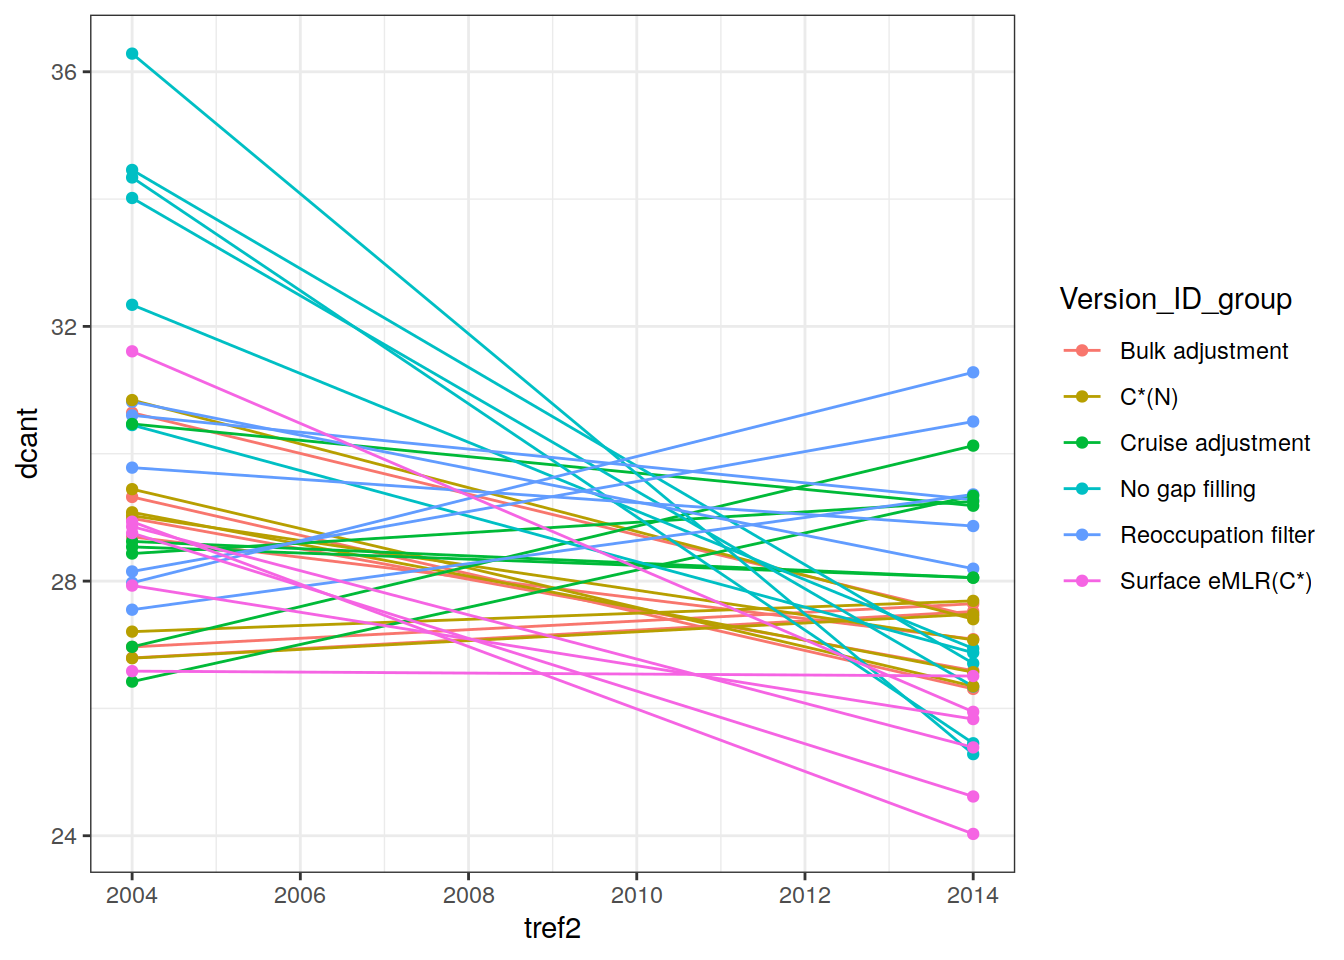
| Version | Author | Date |
|---|---|---|
| fea41c1 | jens-daniel-mueller | 2022-07-20 |
| d2ae54c | jens-daniel-mueller | 2022-07-18 |
| 2695085 | jens-daniel-mueller | 2022-07-17 |
| 535196a | jens-daniel-mueller | 2022-07-17 |
| d20faeb | jens-daniel-mueller | 2022-07-17 |
| afb27ad | jens-daniel-mueller | 2022-07-15 |
| b492b46 | jens-daniel-mueller | 2022-07-15 |
| bd24a0f | jens-daniel-mueller | 2022-07-15 |
| 17cd1d1 | jens-daniel-mueller | 2022-07-13 |
| 8fb595c | jens-daniel-mueller | 2022-07-12 |
| 003b161 | jens-daniel-mueller | 2022-07-12 |
| 232909e | jens-daniel-mueller | 2022-07-01 |
dcant_budget_global_all_ensemble %>%
  filter(data_source == "obs") %>%
  select(MLR_basins, Version_ID_group, period, dcant) %>%
  pivot_wider(names_from = period,
              values_from = dcant) %>%
  ggplot(aes(`1994 - 2004`, `2004 - 2014`,
             col=MLR_basins)) +
  coord_equal() +
  geom_point() +
  facet_wrap(~ Version_ID_group)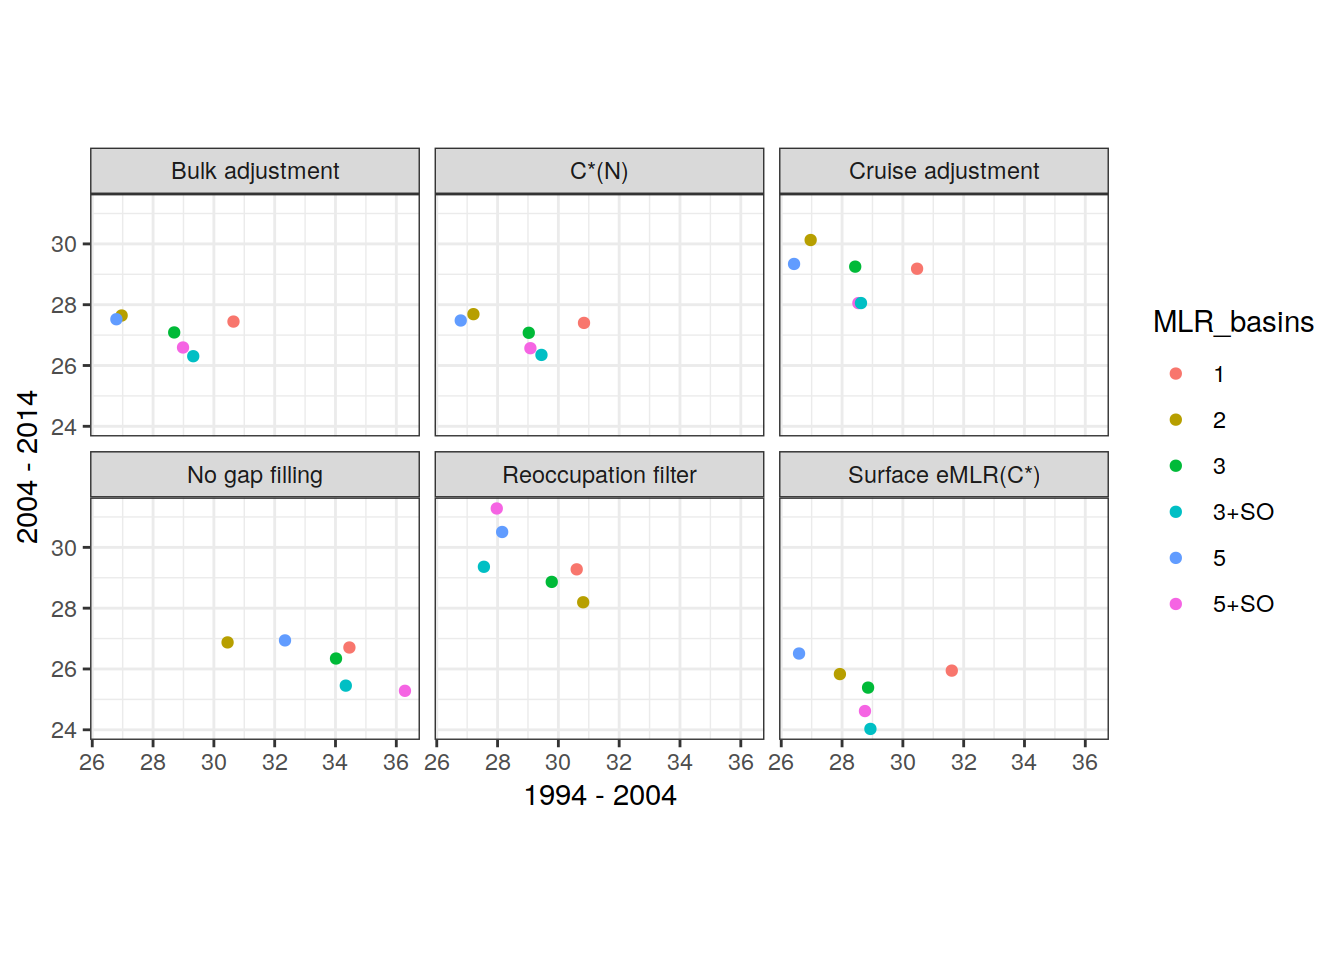
| Version | Author | Date |
|---|---|---|
| fea41c1 | jens-daniel-mueller | 2022-07-20 |
| b1f7ab3 | jens-daniel-mueller | 2022-07-18 |
| d2ae54c | jens-daniel-mueller | 2022-07-18 |
| 2695085 | jens-daniel-mueller | 2022-07-17 |
| 535196a | jens-daniel-mueller | 2022-07-17 |
| d20faeb | jens-daniel-mueller | 2022-07-17 |
| afb27ad | jens-daniel-mueller | 2022-07-15 |
| b492b46 | jens-daniel-mueller | 2022-07-15 |
| bd24a0f | jens-daniel-mueller | 2022-07-15 |
| 17cd1d1 | jens-daniel-mueller | 2022-07-13 |
| 8fb595c | jens-daniel-mueller | 2022-07-12 |
| 003b161 | jens-daniel-mueller | 2022-07-12 |
| 232909e | jens-daniel-mueller | 2022-07-01 |
dcant_budget_global_all_ensemble %>%
  filter(data_source == "obs") %>%
  select(MLR_basins, Version_ID_group, period, dcant) %>%
  pivot_wider(names_from = period,
              values_from = dcant) %>%
  ggplot(aes(`1994 - 2004`, `2004 - 2014`,
             col=Version_ID_group)) +
  coord_equal() +
  geom_point() +
  facet_wrap(~ MLR_basins)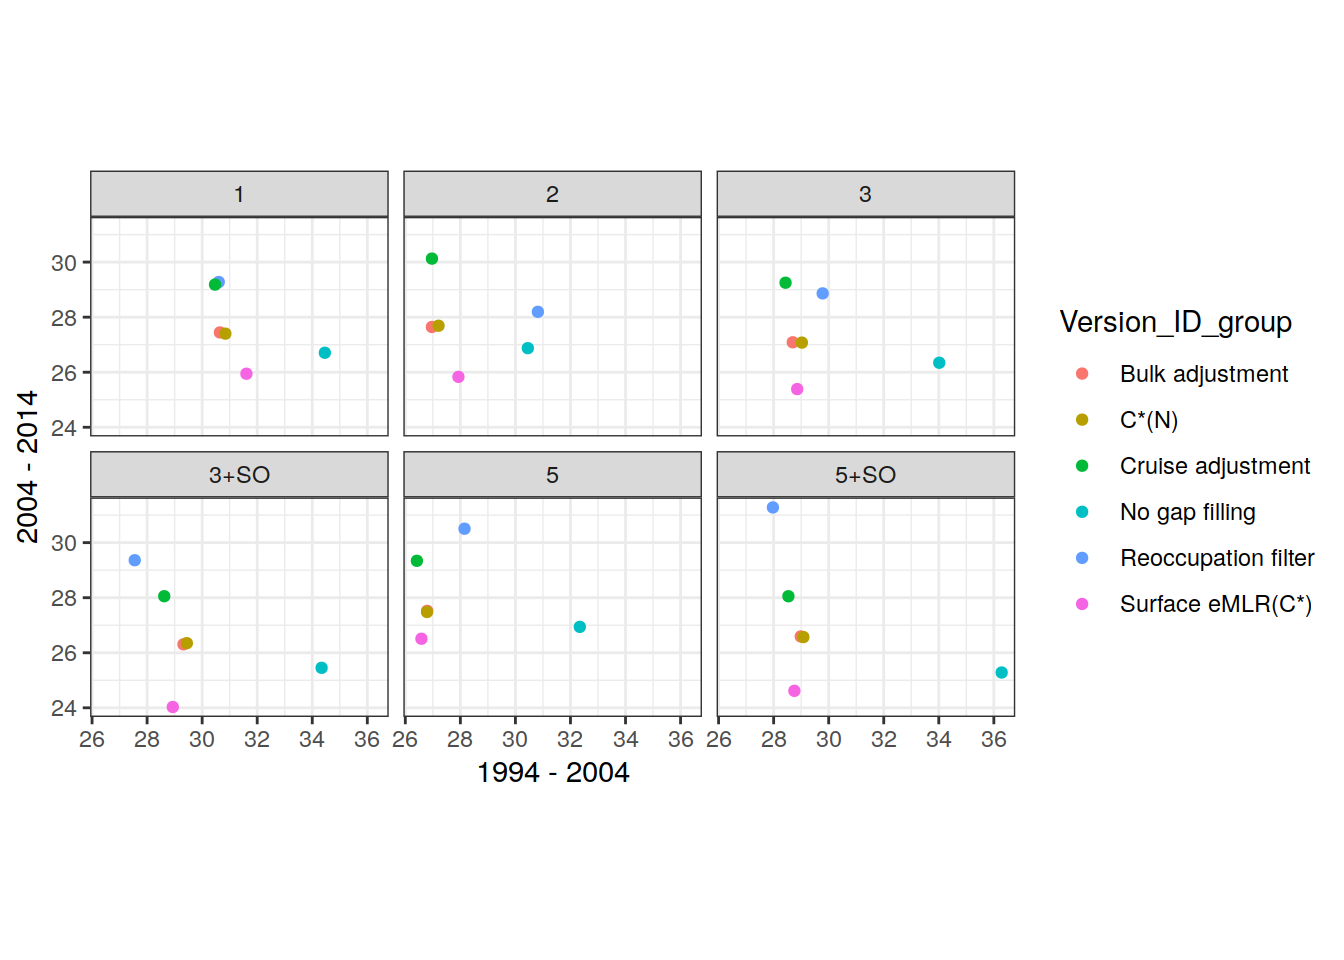
| Version | Author | Date |
|---|---|---|
| fea41c1 | jens-daniel-mueller | 2022-07-20 |
| b1f7ab3 | jens-daniel-mueller | 2022-07-18 |
| d2ae54c | jens-daniel-mueller | 2022-07-18 |
| 2695085 | jens-daniel-mueller | 2022-07-17 |
| 535196a | jens-daniel-mueller | 2022-07-17 |
| d20faeb | jens-daniel-mueller | 2022-07-17 |
| afb27ad | jens-daniel-mueller | 2022-07-15 |
| b492b46 | jens-daniel-mueller | 2022-07-15 |
| bd24a0f | jens-daniel-mueller | 2022-07-15 |
| 17cd1d1 | jens-daniel-mueller | 2022-07-13 |
| 8fb595c | jens-daniel-mueller | 2022-07-12 |
| 003b161 | jens-daniel-mueller | 2022-07-12 |
| 232909e | jens-daniel-mueller | 2022-07-01 |
dcant_budget_global_all_ensemble %>%
  filter(data_source == "obs") %>%
  select(MLR_basins, Version_ID_group, period, dcant) %>%
  pivot_wider(names_from = period,
              values_from = dcant) %>%
  ggplot(aes(`1994 - 2004`, `1994 - 2014`,
             col=Version_ID_group)) +
  coord_equal() +
  geom_point()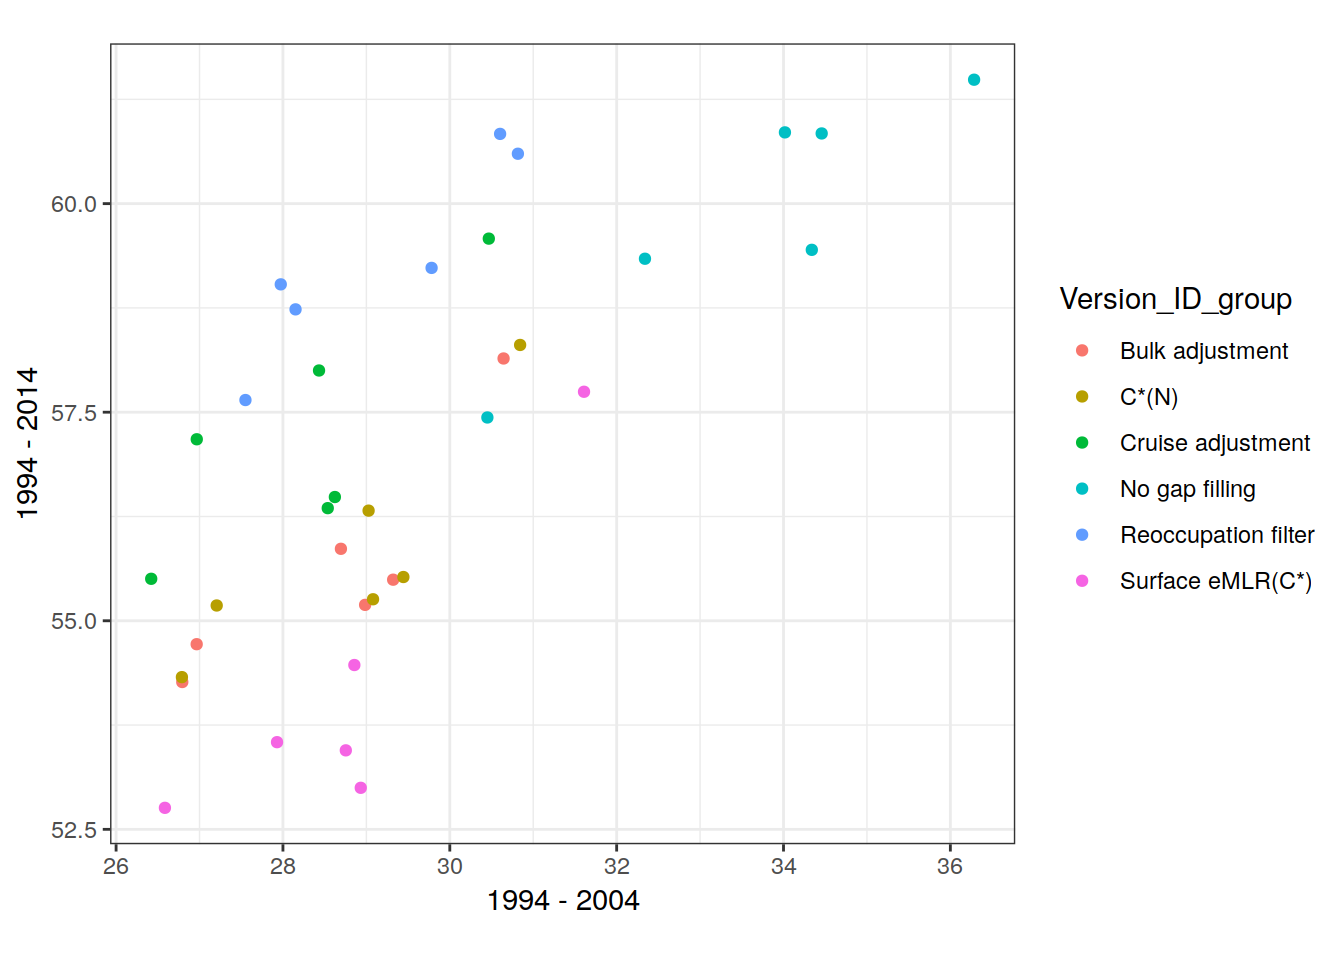
| Version | Author | Date |
|---|---|---|
| fea41c1 | jens-daniel-mueller | 2022-07-20 |
| b1f7ab3 | jens-daniel-mueller | 2022-07-18 |
| d2ae54c | jens-daniel-mueller | 2022-07-18 |
| 2695085 | jens-daniel-mueller | 2022-07-17 |
| 535196a | jens-daniel-mueller | 2022-07-17 |
| d20faeb | jens-daniel-mueller | 2022-07-17 |
| afb27ad | jens-daniel-mueller | 2022-07-15 |
| b492b46 | jens-daniel-mueller | 2022-07-15 |
| bd24a0f | jens-daniel-mueller | 2022-07-15 |
| 17cd1d1 | jens-daniel-mueller | 2022-07-13 |
| 8fb595c | jens-daniel-mueller | 2022-07-12 |
| 003b161 | jens-daniel-mueller | 2022-07-12 |
| 232909e | jens-daniel-mueller | 2022-07-01 |
dcant_budget_global_all_ensemble %>%
  filter(data_source == "obs") %>%
  select(MLR_basins, Version_ID_group, period, dcant) %>%
  pivot_wider(names_from = period,
              values_from = dcant) %>%
  ggplot(aes(`1994 - 2004` + `2004 - 2014`, `1994 - 2014`,
             col=Version_ID_group)) +
  geom_abline(intercept = 0, slope = 1) +
  coord_equal() +
  scale_x_continuous(breaks = seq(0,100,1)) +
  scale_y_continuous(breaks = seq(0,100,1)) +
  geom_point()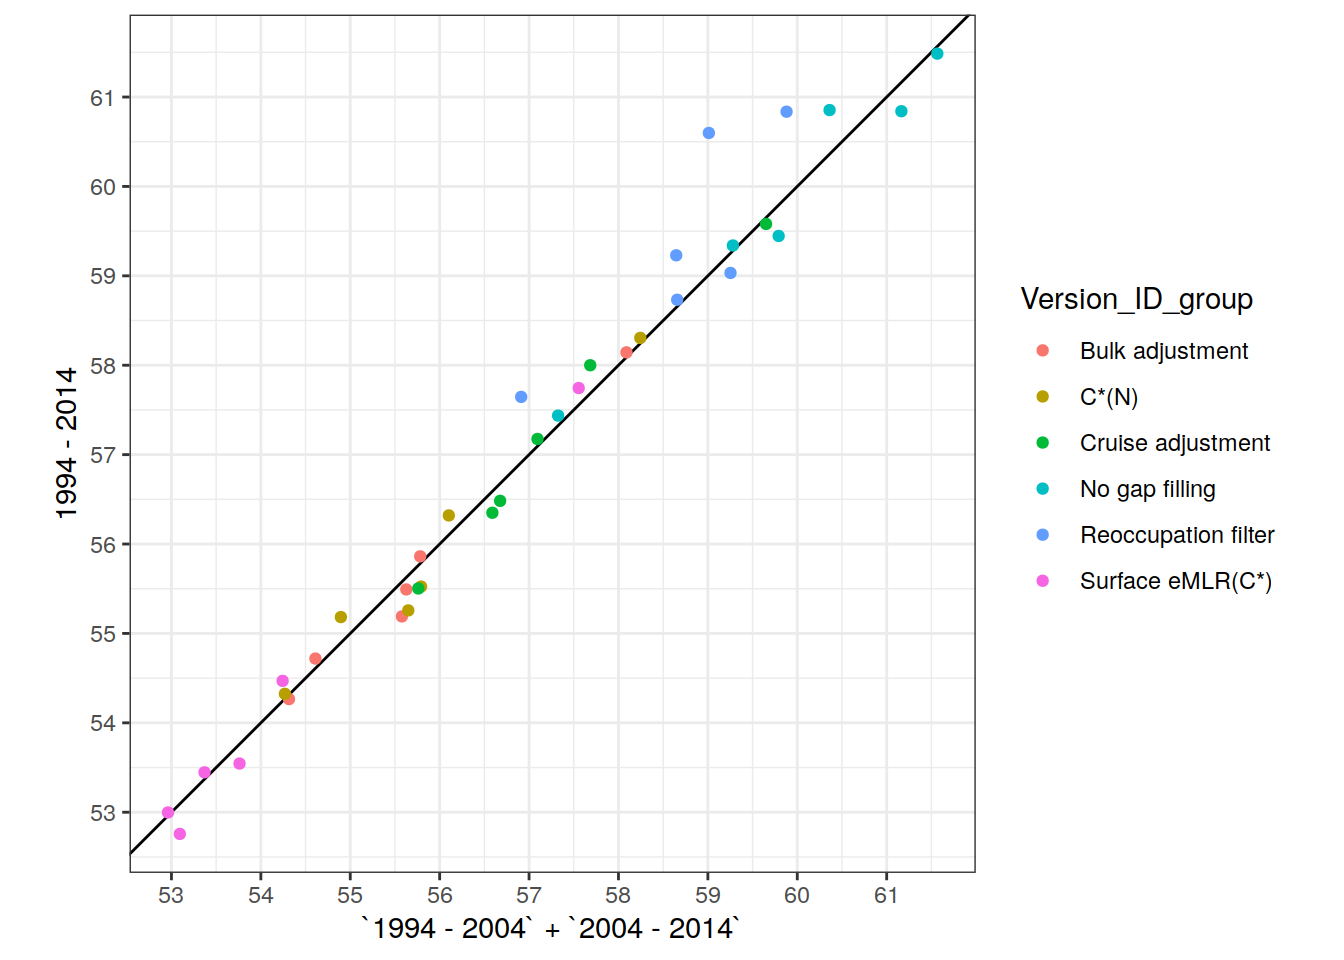
dcant_budget_global_ts <- dcant_budget_global_all %>%
  filter(data_source == "obs",
         period  %in% two_decades) %>%
  select(year = tref2, dcant_mean = dcant)


dcant_budget_global_all_ensemble_summary <-
  dcant_budget_basin_MLR_all_ensemble %>%
  filter(period %in% c("1994 - 2004", "1994 - 2014"),
         data_source == "obs",
         basin == "Global") %>%
  group_by(data_source, tref2, period) %>%
  summarise(#dcant_mean = mean(dcant),
            dcant_sd = sd(dcant)*2) %>%
  ungroup()

dcant_budget_global_ts <- left_join(dcant_budget_global_ts,
                                    dcant_budget_global_all_ensemble_summary %>%
                                      select(year = tref2, dcant_sd))


tcant_S04 <- bind_cols(year = 1994, dcant_mean = 118, dcant_sd = 19)

tcant_ts <- full_join(dcant_budget_global_ts, tcant_S04)

tcant_ts <- left_join(tcant_ts, co2_atm)

co2_atm_pi <- bind_cols(pCO2 = 280, dcant_mean = 0, year = 1800, dcant_sd = NA)

tcant_ts <- full_join(tcant_ts, co2_atm_pi)


tcant_ts <- tcant_ts %>%
  arrange(year) %>%
  mutate(
    tcant = cumsum(dcant_mean),
    tcant_sd = sqrt(dcant_sd ^ 2 + nth(dcant_sd,2) ^ 2)
  ) %>%
  mutate(
    tcant_sd = case_when(
      year == 1800 ~ 0,
      year == 1994 ~ dcant_sd,
      TRUE ~ tcant_sd
    ),
    dcant_sd_int = dcant_sd,
    dcant_sd = case_when(
      year == 1994 ~ 0,
      TRUE ~ dcant_sd
    )
  )

beta <- 1.57
co2_atm_pi_value <- 283
atm_co2_col <- "#009988"
tcant_col <- "black"

p_tcant_year <- tcant_ts %>%
  ggplot(aes(year, tcant)) +
  geom_line(data = co2_atm_reccap2 %>% filter(year > 1790),
            aes(year, (pCO2 - co2_atm_pi_value) * beta),
            col = atm_co2_col) +
  geom_linerange(aes(
    ymin = tcant - dcant_sd_int,
    ymax = tcant + dcant_sd_int,
    col = "Estimate\n±\ninterval\nuncertainty"
  )) +
  geom_point(fill = "white", shape = 21, aes(col = "Estimate\n±\ninterval\nuncertainty")) +
  # geom_text(aes(label = year), nudge_x = -13, nudge_y = 6) +
  scale_y_continuous(name = expression(Total ~ oceanic ~ C[ant] ~ (PgC)),
                     sec.axis = sec_axis( ~ (. / beta + co2_atm_pi_value),
                                          name = expression(Atm. ~ pCO[2] ~ (µatm)))) +
  scale_x_continuous(name = "Year", breaks = seq(1800, 2000, 50)) +
  scale_color_manual(values = tcant_col) +
  theme(
    axis.title.y.right = element_text(color = atm_co2_col),
    axis.text.y.right = element_text(color = atm_co2_col),
    axis.ticks.y.right = element_line(color = atm_co2_col),
    legend.background = element_rect(fill = "transparent"),
    legend.position = c(0.85, 0.2),
    legend.title = element_blank()
  )

p_tcant_year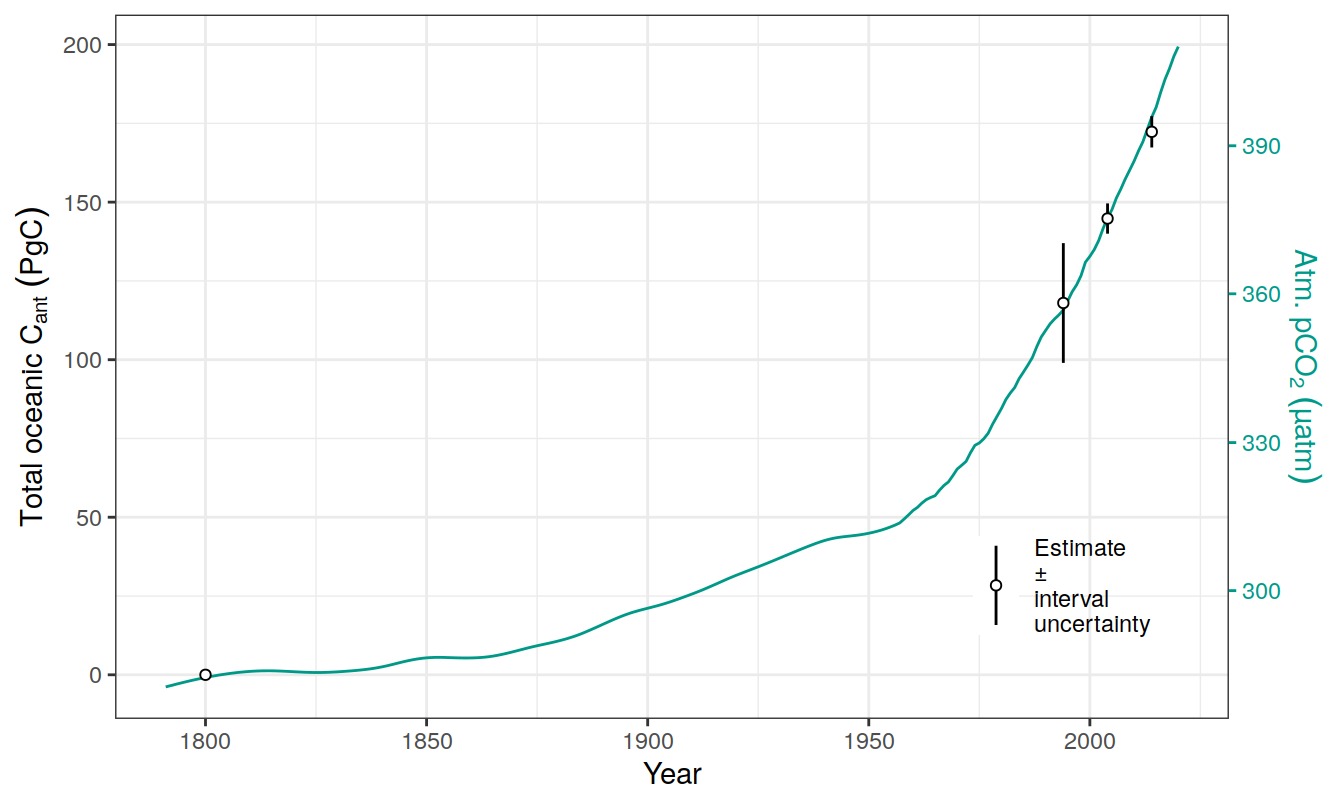
| Version | Author | Date |
|---|---|---|
| 9bbc6a4 | jens-daniel-mueller | 2022-07-20 |
| fea41c1 | jens-daniel-mueller | 2022-07-20 |
| d803308 | jens-daniel-mueller | 2022-07-19 |
| b1f7ab3 | jens-daniel-mueller | 2022-07-18 |
| d2ae54c | jens-daniel-mueller | 2022-07-18 |
| 2695085 | jens-daniel-mueller | 2022-07-17 |
| 535196a | jens-daniel-mueller | 2022-07-17 |
| afb27ad | jens-daniel-mueller | 2022-07-15 |
| b492b46 | jens-daniel-mueller | 2022-07-15 |
| bd24a0f | jens-daniel-mueller | 2022-07-15 |
| 17cd1d1 | jens-daniel-mueller | 2022-07-13 |
| 8fb595c | jens-daniel-mueller | 2022-07-12 |
| 003b161 | jens-daniel-mueller | 2022-07-12 |
| 8ab4a87 | jens-daniel-mueller | 2022-06-29 |
| 7629c78 | jens-daniel-mueller | 2022-06-29 |
| f6786c8 | jens-daniel-mueller | 2022-06-29 |
| 0825298 | jens-daniel-mueller | 2022-06-28 |
| 87e9eb8 | jens-daniel-mueller | 2022-06-27 |
| b52b159 | jens-daniel-mueller | 2022-06-27 |
| 1d73ec9 | jens-daniel-mueller | 2022-05-16 |
| 2ca0109 | jens-daniel-mueller | 2022-05-02 |
| b018a9a | jens-daniel-mueller | 2022-04-29 |
| e09320d | jens-daniel-mueller | 2022-04-12 |
| 8dca96a | jens-daniel-mueller | 2022-04-12 |
| 209c9b6 | jens-daniel-mueller | 2022-04-10 |
| acad2e2 | jens-daniel-mueller | 2022-04-09 |
| 3d81135 | jens-daniel-mueller | 2022-04-07 |
| a74e341 | jens-daniel-mueller | 2022-04-04 |
| 5a6be34 | jens-daniel-mueller | 2022-03-22 |
| bd9e11d | jens-daniel-mueller | 2022-03-22 |
| 2501978 | jens-daniel-mueller | 2022-03-21 |
| 251c7cf | jens-daniel-mueller | 2022-02-17 |
| 565224d | jens-daniel-mueller | 2022-02-17 |
| 2116dd3 | jens-daniel-mueller | 2022-02-09 |
| 6fe70a1 | jens-daniel-mueller | 2022-02-05 |
| a6b33aa | jens-daniel-mueller | 2022-02-04 |
p_tcant_atm_co2 <- tcant_ts %>%
  ggplot(aes(pCO2, tcant)) +
  geom_ribbon(aes(
    ymin = tcant - tcant_sd,
    ymax = tcant + tcant_sd,
    fill = "1800 - 2014"
  ),
  alpha = 0.5) +
  geom_ribbon(aes(
    ymin = tcant - dcant_sd,
    ymax = tcant + dcant_sd,
    fill = "1994 - 2014"
  ),
  alpha = 0.5) +
  geom_line() +
  geom_point(shape = 21, fill = "white") +
  scale_x_continuous(breaks = seq(280, 400, 30)) +
  scale_fill_manual(values = c("grey60", "grey30"), name = "Cumulative\nuncertainty") +
  scale_color_manual(values = "black", name = "") +
  geom_text(aes(label = year), nudge_x = -6, nudge_y = 6) +
  labs(x = expression(Atmospheric ~ pCO[2] ~ (µatm)),
       y = expression(Total ~ oceanic ~ C[ant] ~ (PgC))) +
  theme(
    legend.background = element_rect(fill = "transparent"),
    legend.position = c(0.85, 0.25),
    axis.title.x = element_text(color = atm_co2_col),
    axis.text.x = element_text(color = atm_co2_col),
    axis.ticks.x = element_line(color = atm_co2_col)
  )

p_tcant_year / p_tcant_atm_co2 +
  plot_annotation(tag_levels = 'A')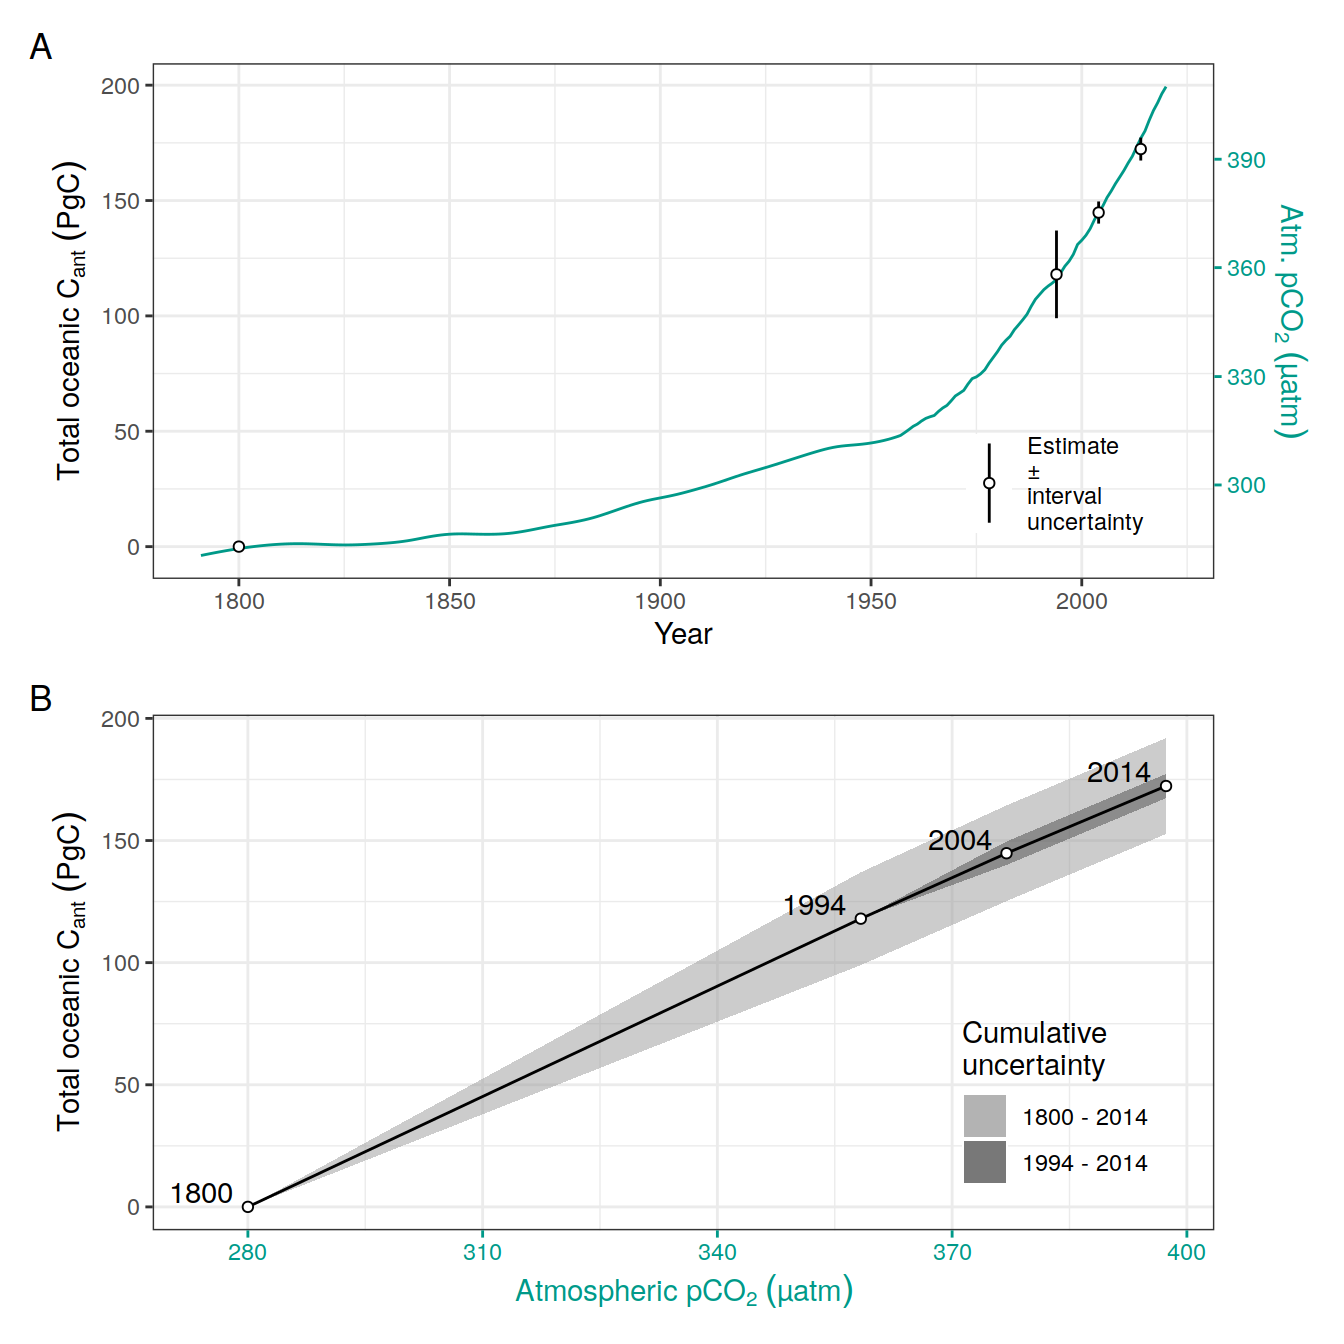
| Version | Author | Date |
|---|---|---|
| 9bbc6a4 | jens-daniel-mueller | 2022-07-20 |
| a80b59b | jens-daniel-mueller | 2022-07-20 |
| fea41c1 | jens-daniel-mueller | 2022-07-20 |
| d803308 | jens-daniel-mueller | 2022-07-19 |
| b1f7ab3 | jens-daniel-mueller | 2022-07-18 |
| d2ae54c | jens-daniel-mueller | 2022-07-18 |
| 2695085 | jens-daniel-mueller | 2022-07-17 |
| 535196a | jens-daniel-mueller | 2022-07-17 |
| afb27ad | jens-daniel-mueller | 2022-07-15 |
| b492b46 | jens-daniel-mueller | 2022-07-15 |
| bd24a0f | jens-daniel-mueller | 2022-07-15 |
| 17cd1d1 | jens-daniel-mueller | 2022-07-13 |
| 8fb595c | jens-daniel-mueller | 2022-07-12 |
| 003b161 | jens-daniel-mueller | 2022-07-12 |
| 8ab4a87 | jens-daniel-mueller | 2022-06-29 |
| 7629c78 | jens-daniel-mueller | 2022-06-29 |
| f6786c8 | jens-daniel-mueller | 2022-06-29 |
| 0825298 | jens-daniel-mueller | 2022-06-28 |
| 87e9eb8 | jens-daniel-mueller | 2022-06-27 |
| b52b159 | jens-daniel-mueller | 2022-06-27 |
| 1d73ec9 | jens-daniel-mueller | 2022-05-16 |
| 2ca0109 | jens-daniel-mueller | 2022-05-02 |
| b018a9a | jens-daniel-mueller | 2022-04-29 |
| e09320d | jens-daniel-mueller | 2022-04-12 |
| 8dca96a | jens-daniel-mueller | 2022-04-12 |
| 209c9b6 | jens-daniel-mueller | 2022-04-10 |
| acad2e2 | jens-daniel-mueller | 2022-04-09 |
| 3d81135 | jens-daniel-mueller | 2022-04-07 |
| a74e341 | jens-daniel-mueller | 2022-04-04 |
| 5a6be34 | jens-daniel-mueller | 2022-03-22 |
| bd9e11d | jens-daniel-mueller | 2022-03-22 |
| 2501978 | jens-daniel-mueller | 2022-03-21 |
| 251c7cf | jens-daniel-mueller | 2022-02-17 |
| 565224d | jens-daniel-mueller | 2022-02-17 |
| 2116dd3 | jens-daniel-mueller | 2022-02-09 |
| 6fe70a1 | jens-daniel-mueller | 2022-02-05 |
| a6b33aa | jens-daniel-mueller | 2022-02-04 |
| d2191ad | jens-daniel-mueller | 2022-02-04 |
| 0d0f790 | jens-daniel-mueller | 2022-02-02 |
| 60727e6 | jens-daniel-mueller | 2022-02-02 |
| c7b4984 | jens-daniel-mueller | 2022-02-02 |
| 7fb28a2 | jens-daniel-mueller | 2022-02-02 |
| 7655085 | jens-daniel-mueller | 2022-02-02 |
| ec7fe7e | jens-daniel-mueller | 2022-01-31 |
ggsave(path = here::here("output/publication"),
       filename = "FigS_dcant_budget_global_vs_atm_pCO2.png",
       height = 6,
       width = 7)

# p_tcant_year_trans / p_tcant_atm_co2
# ggsave(path = here::here("output/publication"),
#        filename = "Fig_global_dcant_budget_vs_atm_pCO2_trans.png",
#        height = 6,
#        width = 7)
tcant_ts %>%
mutate(beta = dcant_mean / (pCO2-lag(pCO2)))# A tibble: 4 × 8
year dcant_mean dcant_sd pCO2 tcant tcant_sd dcant_sd_int beta
<dbl> <dbl> <dbl> <dbl> <dbl> <dbl> <dbl> <dbl>
1 1800 0 NA 280 0 0 NA NA
2 1994 118 0 358. 118 19 19 1.51
3 2004 26.8 4.80 377. 145. 19.6 4.80 1.44
4 2014 27.5 4.97 397. 172. 19.6 4.97 1.3511.2 incl fluxes
Ocean_Sink <- Ocean_Sink %>%
  filter(product != "Watson")
Ocean_Sink_cum_1994 <-
Ocean_Sink %>%
filter(year >= 1994, year <= 2007) %>%
mutate(fgco2_glob = if_else(year == 1994, 0, GtC_yr),
fgco2_glob = fgco2_glob) %>%
arrange(year) %>%
group_by(product, type) %>%
mutate(fgco2_glob_cum = cumsum(fgco2_glob)) %>%
ungroup()
Ocean_Sink_cum_1994 <-
left_join(Ocean_Sink_cum_1994,
co2_atm)
Ocean_Sink_cum_1994 %>%
ggplot(aes(pCO2, fgco2_glob_cum, col = product)) +
geom_line() +
geom_point(shape = 21, fill = "white") +
theme(legend.position = "bottom") +
facet_grid(.~ type)
Ocean_Sink_cum_1994 <- Ocean_Sink_cum_1994 %>%
  mutate(fgco2_glob_cum_total = fgco2_glob_cum + 118) %>%
  select(year, pCO2, product, fgco2_glob_cum, fgco2_glob_cum_total, type)

Ocean_Sink_cum_1994 <- Ocean_Sink_cum_1994 %>%
  mutate(type = case_when(
    type == "data_products" ~ "Observation-based\nsurface flux\nproducts",
    TRUE ~ "Global Ocean\nBiogeochemical Models\n(GOBM)"
  ))

Ocean_Sink_cum_1994 %>%
  filter(year == 2007) %>%
  group_by(type) %>%
  summarise(dcant_sd = sd(fgco2_glob_cum)*2) %>%
  ungroup()
# A tibble: 2 × 2
type dcant_sd
<chr> <dbl>
1 "Global Ocean\nBiogeochemical Models\n(GOBM)" 6.99
2 "Observation-based\nsurface flux\nproducts" 6.63Ocean_Sink_cum_1994 <-
Ocean_Sink %>%
filter(year >= 1994, year <= 2014) %>%
mutate(fgco2_glob = if_else(year == 1994, 0, GtC_yr),
fgco2_glob = fgco2_glob) %>%
arrange(year) %>%
group_by(product, type) %>%
mutate(fgco2_glob_cum = cumsum(fgco2_glob)) %>%
ungroup()
Ocean_Sink_cum_1994 <-
left_join(Ocean_Sink_cum_1994,
co2_atm)
Ocean_Sink_cum_1994 %>%
ggplot(aes(pCO2, fgco2_glob_cum, col = product)) +
geom_line() +
geom_point(shape = 21, fill = "white") +
theme(legend.position = "bottom") +
facet_grid(.~ type)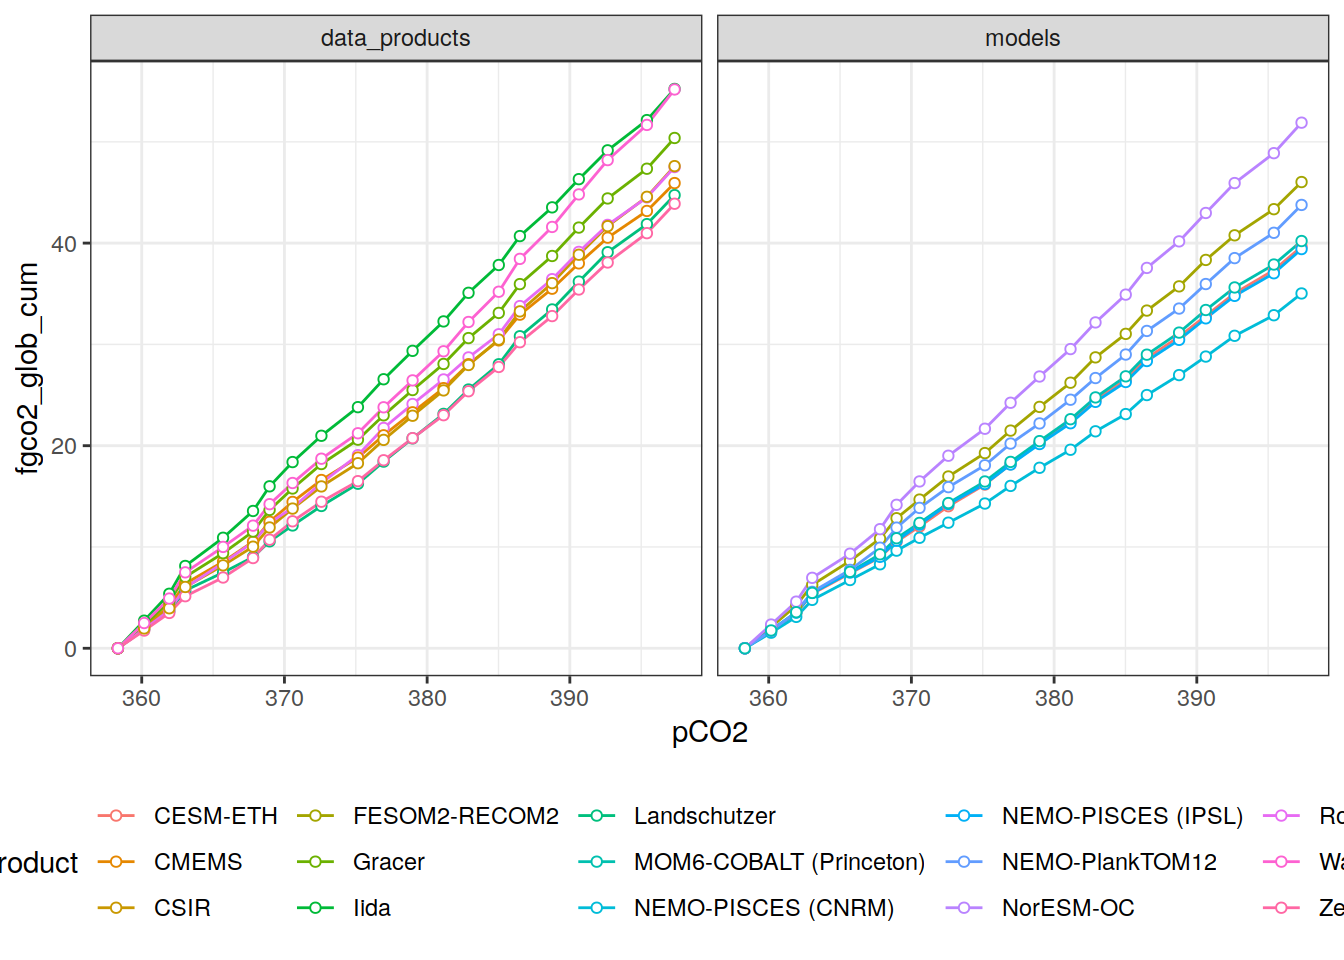
Ocean_Sink_cum_1994 <- Ocean_Sink_cum_1994 %>%
  mutate(fgco2_glob_cum_total = fgco2_glob_cum + 118) %>%
  select(year, pCO2, product, fgco2_glob_cum, fgco2_glob_cum_total, type)

Ocean_Sink_cum_1994 <- Ocean_Sink_cum_1994 %>%
  mutate(type = case_when(
    type == "data_products" ~ "Observation-based\nsurface flux\nproducts",
    TRUE ~ "Global Ocean\nBiogeochemical Models\n(GOBM)"
  ))
tcant_2004 <- tcant_ts %>%
filter(year == 2004) %>%
pull(tcant)
Ocean_Sink_cum_2004 <-
Ocean_Sink %>%
filter(year >= 2004, year <= 2014) %>%
mutate(fgco2_glob = if_else(year == 2004, 0, GtC_yr)) %>%
arrange(year) %>%
group_by(product, type) %>%
mutate(fgco2_glob_cum = cumsum(fgco2_glob)) %>%
ungroup()
Ocean_Sink_cum_2004 <-
left_join(Ocean_Sink_cum_2004,
co2_atm)
Ocean_Sink_cum_2004 %>%
ggplot(aes(pCO2, fgco2_glob_cum, col = product)) +
geom_line() +
geom_point(shape = 21, fill = "white") +
theme(legend.position = "bottom") +
facet_grid(.~ type)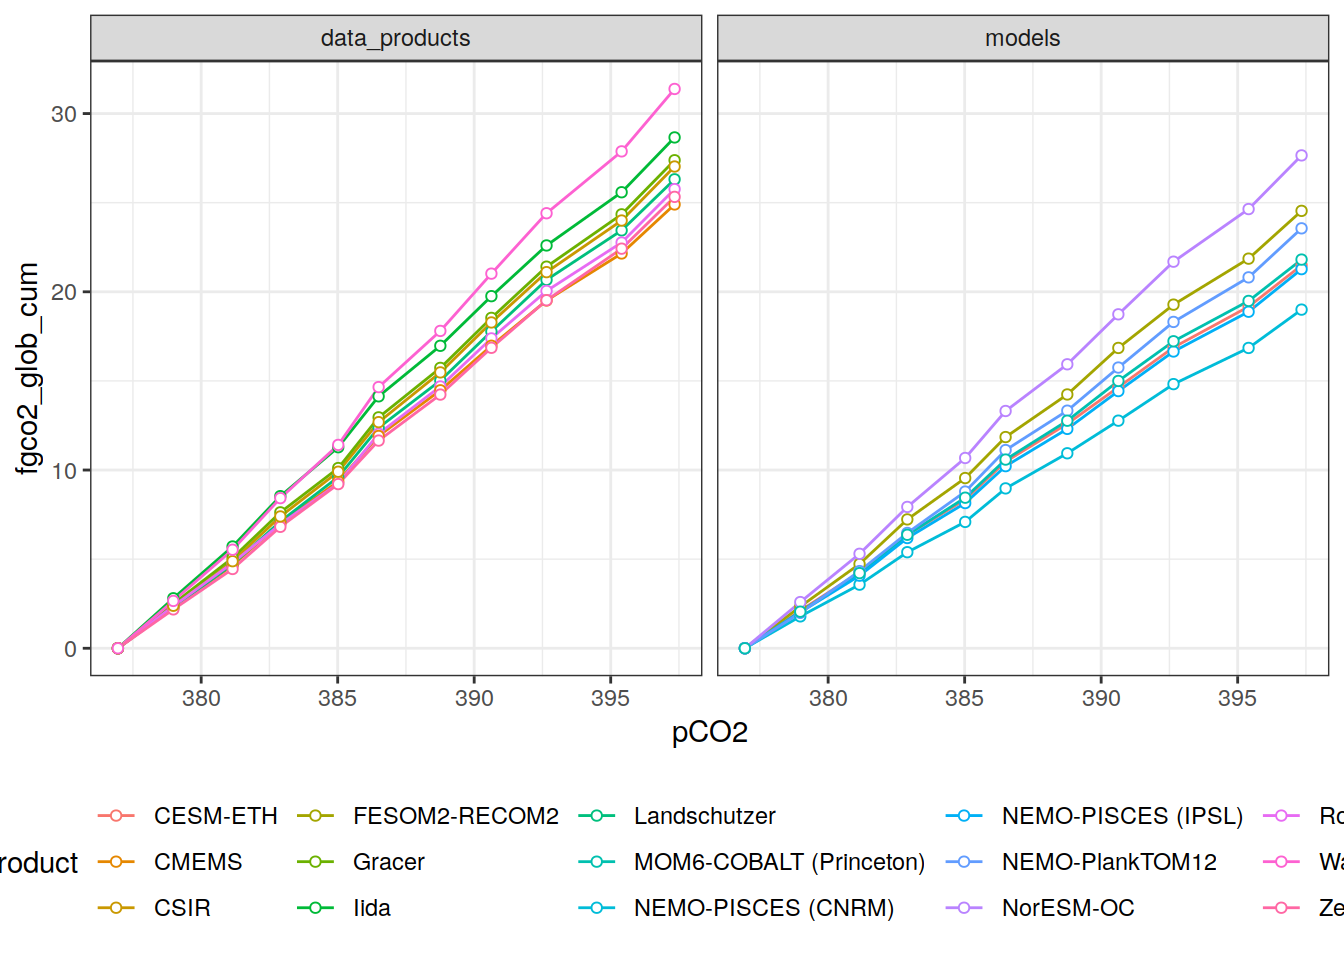
Ocean_Sink_cum_2004 <- Ocean_Sink_cum_2004 %>%
  mutate(fgco2_glob_cum_total = fgco2_glob_cum + tcant_2004) %>%
  select(year, pCO2, product, fgco2_glob_cum, fgco2_glob_cum_total, type)

Ocean_Sink_cum_2004 <- Ocean_Sink_cum_2004 %>%
  mutate(type = case_when(
    type == "data_products" ~ "Observation-based\nsurface flux\nproducts",
    TRUE ~ "Global Ocean\nBiogeochemical Models\n(GOBM)"
  ))
tcant_ts_zoom <- tcant_ts %>%
filter(year != 1800)
tcant_min = tcant_ts_zoom %>% pull(tcant) %>% min()
tcant_max =
tcant_ts_zoom %>% pull(tcant) %>% max() +
tcant_ts_zoom %>% pull(dcant_sd) %>% max() + 0.2
p_tcant_ts_zoom <-
tcant_ts_zoom %>%
ggplot(aes(pCO2, tcant)) +
geom_ribbon(
aes(ymin = tcant - dcant_sd,
ymax = tcant + dcant_sd),
alpha = 0.2,
fill = "#BB5566"
) +
geom_ribbon(
aes(
ymin = tcant - dcant_sd / 2,
ymax = tcant + dcant_sd / 2
),
alpha = 0.3,
fill = "#BB5566"
) +
geom_line(data = Ocean_Sink_cum_1994,
aes(pCO2, fgco2_glob_cum_total, group = product, col = type)) +
geom_point(
data = Ocean_Sink_cum_1994,
aes(pCO2, fgco2_glob_cum_total, group = product, col = type),
size = 0.3
) +
geom_point(
data = Ocean_Sink_cum_1994 %>% filter(year %in% c(2004, 2014)),
aes(
pCO2,
fgco2_glob_cum_total,
group = product,
col = type
),
fill = "white",
shape = 21
) +
geom_line(aes(col = "eMLR(C*)")) +
geom_point(aes(col = "eMLR(C*)"),
shape = 21,
fill = "white") +
geom_text(aes(label = year), nudge_x = -2, nudge_y = 3) +
scale_color_highcontrast(name = "Data source", reverse = TRUE) +
scale_fill_highcontrast(name = "Data source", reverse = TRUE) +
scale_y_continuous(limits = c(tcant_min, tcant_max)) +
labs(x = expression(Atmospheric ~ pCO[2] ~ (µatm)),
y = expression(Total ~ oceanic ~ carbon ~ accumulation ~ since ~ 1800 ~ (PgC))) +
guides(colour = guide_legend(order = 1),
fill = "none") +
theme_classic() +
theme(
legend.background = element_rect(fill = "transparent"),
legend.position = c(0.25, 0.83),
legend.title = element_blank(),
legend.box.just = "top",
legend.box = "horizontal",
legend.key.size = unit(2.5, 'lines'),
panel.grid.major.y = element_line(colour = "black",
size = 0.1)
)
# p_tcant_ts_zoomdcant_type_box <-
bind_rows(
dcant_budget_global_all_ensemble %>%
filter(data_source == "obs") %>%
select(period, dcant) %>%
mutate(type = "eMLR(C*)",
dcant = dcant + 118,
dcant = if_else(period == "2004 - 2014",
dcant + tcant_2004 - 118,
dcant)),
Ocean_Sink_cum_1994 %>%
filter(year %in% c(2004, 2014)) %>%
mutate(period = if_else(year == 2004,
"1994 - 2004",
"1994 - 2014")) %>%
select(period, dcant = fgco2_glob_cum_total, type),
Ocean_Sink_cum_2004 %>%
filter(year %in% c(2014)) %>%
mutate(period = if_else(year == 2014,
"2004 - 2014",
"other")) %>%
select(period, dcant = fgco2_glob_cum_total, type)
)
dcant_type_box_stat <- dcant_type_box %>%
group_by(period, type) %>%
summarise(dcant_mean = mean(dcant),
dcant_sd = sd(dcant)) %>%
ungroup()
dcant_type_box_stat <-
left_join(
dcant_type_box_stat,
dcant_budget_global_all %>%
filter(data_source == "obs") %>%
mutate(
dcant = dcant + 118,
dcant = if_else(period == "2004 - 2014",
dcant + tcant_2004 - 118,
dcant)
) %>%
select(period, dcant_st_case = dcant)
)
dcant_type_box_stat <- dcant_type_box_stat %>%
mutate(dcant_mean = if_else(type == "eMLR(C*)",
dcant_st_case,
dcant_mean)) %>%
select(-dcant_st_case)
p_tcant_box <-
dcant_type_box %>%
filter(period == "1994 - 2014") %>%
ggplot(aes(period, dcant)) +
geom_crossbar(
data = dcant_type_box_stat %>%
filter(period == "1994 - 2014"),
position = position_dodge(width = 1),
aes(
x = period,
y = dcant_mean,
ymin = dcant_mean - dcant_sd,
ymax = dcant_mean + dcant_sd,
col = type,
fill = type
), width = 0.7, alpha = 0.4
) +
geom_crossbar(
data = dcant_type_box_stat %>%
filter(period == "1994 - 2014"),
position = position_dodge(width = 1),
aes(
x = period,
y = dcant_mean,
ymin = dcant_mean - dcant_sd*2,
ymax = dcant_mean + dcant_sd*2,
col = type,
fill = type
), width = 0.7, alpha = 0.2
) +
geom_point(aes(fill = type),
position = position_jitterdodge(
dodge.width = 1,
jitter.width = 0.1),
shape = 21,
alpha = 0.5) +
scale_fill_highcontrast(
reverse = TRUE,
name = "Data source",
guide = "none"
) +
scale_color_highcontrast(
reverse = TRUE,
name = "Data source",
guide = "none"
) +
scale_y_continuous(limits = c(tcant_min, tcant_max)) +
labs(x = "20yr period") +
theme_classic() +
theme(
axis.line.y.left = element_blank(),
axis.text.y = element_blank(),
axis.ticks.y = element_blank(),
axis.title.y = element_blank(),
panel.grid.major.y = element_line(colour = "black",
size = 0.1)
)
p_tcant_box_10 <-
dcant_type_box %>%
filter(period != "1994 - 2014") %>%
ggplot(aes(period, dcant)) +
geom_crossbar(
data = dcant_type_box_stat %>%
filter(period != "1994 - 2014"),
position = position_dodge(width = 1),
aes(
x = period,
y = dcant_mean,
ymin = dcant_mean - dcant_sd,
ymax = dcant_mean + dcant_sd,
col = type,
fill = type
), width = 0.7, alpha = 0.4
) +
geom_crossbar(
data = dcant_type_box_stat %>%
filter(period != "1994 - 2014"),
position = position_dodge(width = 1),
aes(
x = period,
y = dcant_mean,
ymin = dcant_mean - dcant_sd*2,
ymax = dcant_mean + dcant_sd*2,
col = type,
fill = type
), width = 0.7, alpha = 0.2
) +
geom_point(aes(fill = type),
position = position_jitterdodge(
dodge.width = 1,
jitter.width = 0.1),
shape = 21,
alpha = 0.5) +
scale_fill_highcontrast(
reverse = TRUE,
name = "Data source",
guide = "none"
) +
scale_color_highcontrast(
reverse = TRUE,
name = "Data source",
guide = "none"
) +
scale_y_continuous(limits = c(tcant_min, tcant_max)) +
labs(x = "10yr periods") +
theme_classic() +
theme(
axis.line.y.left = element_blank(),
axis.text.y = element_blank(),
axis.ticks.y = element_blank(),
axis.title.y = element_blank(),
panel.grid.major.y = element_line(colour = "black",
size = 0.1)
)
p_tcant_ts_zoom + p_tcant_box + p_tcant_box_10 +
plot_layout(ncol = 3, widths = c(6,1,1.8)) +
plot_annotation(tag_levels = 'A')
| Version | Author | Date |
|---|---|---|
| 318fefe | jens-daniel-mueller | 2022-08-11 |
| 5b77c4f | jens-daniel-mueller | 2022-08-10 |
| 9c3be27 | jens-daniel-mueller | 2022-08-09 |
| a691b29 | jens-daniel-mueller | 2022-08-09 |
| 910f96e | jens-daniel-mueller | 2022-08-08 |
| f68fcfa | jens-daniel-mueller | 2022-07-26 |
| f2615fb | jens-daniel-mueller | 2022-07-26 |
| 4af29f9 | jens-daniel-mueller | 2022-07-24 |
| b18b250 | jens-daniel-mueller | 2022-07-20 |
| a80b59b | jens-daniel-mueller | 2022-07-20 |
| fea41c1 | jens-daniel-mueller | 2022-07-20 |
| d803308 | jens-daniel-mueller | 2022-07-19 |
| b1f7ab3 | jens-daniel-mueller | 2022-07-18 |
| d2ae54c | jens-daniel-mueller | 2022-07-18 |
| 2695085 | jens-daniel-mueller | 2022-07-17 |
| 535196a | jens-daniel-mueller | 2022-07-17 |
| d20faeb | jens-daniel-mueller | 2022-07-17 |
| afb27ad | jens-daniel-mueller | 2022-07-15 |
| b492b46 | jens-daniel-mueller | 2022-07-15 |
| bd24a0f | jens-daniel-mueller | 2022-07-15 |
| 17cd1d1 | jens-daniel-mueller | 2022-07-13 |
| 26e9496 | jens-daniel-mueller | 2022-07-12 |
| 8fb595c | jens-daniel-mueller | 2022-07-12 |
| 003b161 | jens-daniel-mueller | 2022-07-12 |
| 8ab4a87 | jens-daniel-mueller | 2022-06-29 |
| 7629c78 | jens-daniel-mueller | 2022-06-29 |
| f6786c8 | jens-daniel-mueller | 2022-06-29 |
| 9393c07 | jens-daniel-mueller | 2022-06-28 |
| 0825298 | jens-daniel-mueller | 2022-06-28 |
ggsave(path = here::here("output/publication"),
       filename = "Fig_dcant_budget_global_vs_GCB_ocean_sink.png",
       height = 6,
       width = 9)

dcant_type_significance <- dcant_type_box_stat %>%
  mutate(dcant_mean = dcant_mean - 118,
         dcant_mean = if_else(period == "2004 - 2014",
                         dcant_mean - (tcant_2004 - 118),
                         dcant_mean),
         dcant_sd = dcant_sd * 2) %>%
  group_by(period) %>%
  mutate(
    dcant_diff = dcant_mean - first(dcant_mean),
    dcant_diff_rel = 100 * dcant_diff / first(dcant_mean),
    dcant_diff_sd = sqrt(dcant_sd ^ 2 + first(dcant_sd) ^ 2),
    dcant_diff_sd_comparison = dcant_diff_sd - abs(dcant_diff)
  ) %>%
  ungroup()

dcant_type_significance %>%
  kable() %>%
  kable_styling() %>%
scroll_box(height = "300px")| period | type | dcant_mean | dcant_sd | dcant_diff | dcant_diff_rel | dcant_diff_sd | dcant_diff_sd_comparison |
|---|---|---|---|---|---|---|---|
| 1994 - 2004 | eMLR(C*) | 26.79321 | 4.799487 | 0.000000 | 0.000000 | 6.787499 | 6.787499 |
| 1994 - 2004 | Global Ocean Biogeochemical Models (GOBM) | 19.52578 | 5.403004 | -7.267428 | -27.124143 | 7.226862 | -0.040566 |
| 1994 - 2004 | Observation-based surface flux products | 21.71168 | 5.448186 | -5.081530 | -18.965740 | 7.260703 | 2.179173 |
| 1994 - 2014 | eMLR(C*) | 54.26581 | 4.972849 | 0.000000 | 0.000000 | 7.032670 | 7.032670 |
| 1994 - 2014 | Global Ocean Biogeochemical Models (GOBM) | 42.28477 | 10.974456 | -11.981043 | -22.078436 | 12.048564 | 0.067521 |
| 1994 - 2014 | Observation-based surface flux products | 48.80475 | 8.824335 | -5.461062 | -10.063539 | 10.129073 | 4.668011 |
| 2004 - 2014 | eMLR(C*) | 27.52167 | 3.319445 | 0.000000 | 0.000000 | 4.694404 | 4.694404 |
| 2004 - 2014 | Global Ocean Biogeochemical Models (GOBM) | 22.75899 | 5.576053 | -4.762678 | -17.305191 | 6.489305 | 1.726627 |
| 2004 - 2014 | Observation-based surface flux products | 27.09308 | 4.225215 | -0.428594 | -1.557297 | 5.373188 | 4.944594 |
12 Revelle changes
delta_revelle <- co2_atm %>%
  mutate(revelle = seacarb::buffer(24,
                                   pCO2,
                                   2300 * 1e-6)$BetaD,
         DIC = seacarb::carb(24,
                                   pCO2,
                                   2300 * 1e-6)$DIC,
         delta_DIC = (1/pCO2) * DIC * (1/revelle) *1e6,
         delta_DIC_rel = delta_DIC / mean(delta_DIC),
         delta_DIC_rel_cum = delta_DIC_rel - first(delta_DIC_rel),
         delta_year = year - first(year))


delta_revelle %>%
  ggplot(aes(delta_year,delta_DIC_rel_cum)) +
  geom_smooth(method = "lm", aes(col="lm"), se = FALSE) +
  geom_path() +
  geom_point()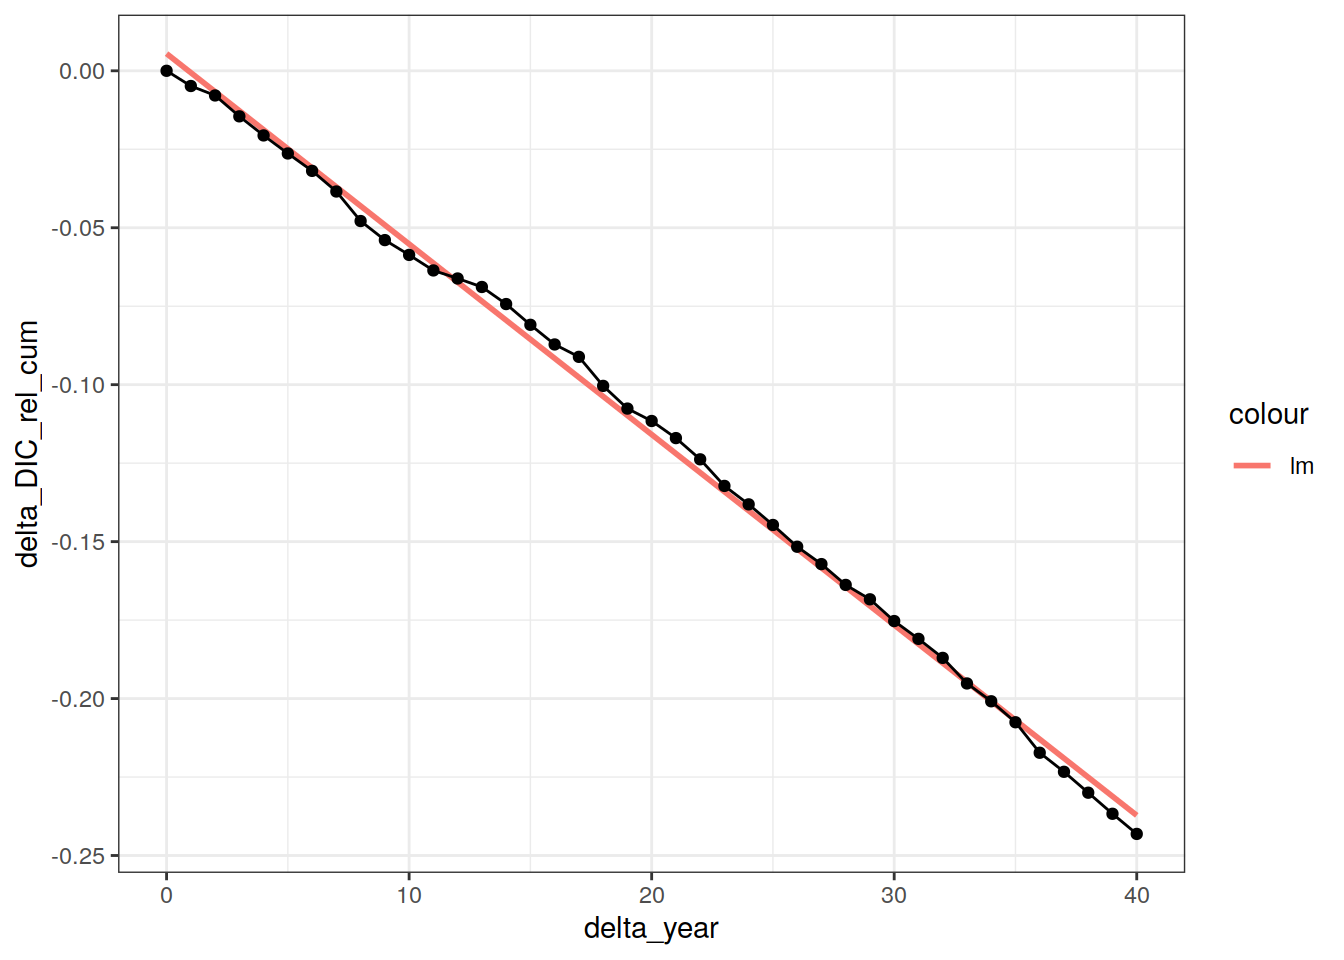
| Version | Author | Date |
|---|---|---|
| fea41c1 | jens-daniel-mueller | 2022-07-20 |
min(delta_revelle$delta_DIC_rel_cum / max(delta_revelle$delta_year))[1] -0.00607817613 Emission removal
GCB_Cant_emissions <- Global_Carbon_Budget %>%
  mutate(year = cut(year, c(1994, 2004, 2014), c("2004", "2014")),
         year = as.numeric(as.character(year))) %>%
  drop_na() %>%
  filter(estimate %in% c(
    "fossil emissions excluding carbonation",
    "land-use change emissions"
  )) %>%
  group_by(year) %>%
  summarise(cant_emissions = sum(GtC_yr)) %>%
  ungroup()

left_join(GCB_Cant_emissions,
          tcant_ts_zoom) %>%
  mutate(
    dcant_per_emission = 100 * dcant_mean / cant_emissions,
    dcant_per_emission_sd = 100 * dcant_sd / cant_emissions
  ) %>%
  kable() %>%
  kable_styling() %>%
scroll_box(height = "300px")| year | cant_emissions | dcant_mean | dcant_sd | pCO2 | tcant | tcant_sd | dcant_sd_int | dcant_per_emission | dcant_per_emission_sd |
|---|---|---|---|---|---|---|---|---|---|
| 2004 | 82.66365 | 26.79321 | 4.799487 | 376.95 | 144.7932 | 19.59681 | 4.799487 | 32.41232 | 5.806042 |
| 2014 | 101.81399 | 27.52167 | 4.972849 | 397.34 | 172.3149 | 19.63999 | 4.972849 | 27.03132 | 4.884249 |
13.0.0.1 Map test color palettes
breaks <- c(-Inf, seq(0, 16, 2), Inf)

legend_title <- expression(atop(Delta * C["ant"],
                                (mol ~ m ^ {
                                  -2
                                })))

breaks_n <- length(breaks) - 1

dcant_inv_all_color_test <- dcant_inv_all %>%
  filter(data_source %in% c("obs"),
         period == "2004 - 2014") %>%
  mutate(dcant_int = cut(dcant,
                         breaks,
                         right = FALSE))

scico_continous_palettes <- c(
  "acton",
  "bamako",
  "batlow",
  "bilbao",
  "buda",
  "davos",
  "devon",
  "grayC",
  "hawaii",
  "imola",
  "lajolla",
  "lapaz",
  "nuuk",
  "oslo",
  "tokyo",
  "turku"
)

p_test_scico <- function(df, i_palette) {
  p_reg <- map +
    geom_raster(data = df,
                aes(lon, lat, fill = dcant_int)) +
    scale_fill_scico_d(
      palette = i_palette,
      drop = FALSE,
      name = legend_title,
      guide = "none"
    ) +
    labs(title = i_palette) +
    theme(axis.text = element_blank(),
          axis.ticks = element_blank())

  p_rev <- map +
    geom_raster(data = df,
              aes(lon, lat, fill = dcant_int)) +
    scale_fill_scico_d(
      palette = i_palette,
      drop = FALSE,
      name = legend_title,
      direction = -1,
      guide = "none"
    ) +
    labs(title = paste(i_palette, "rev")) +
    theme(axis.text = element_blank(),
          axis.ticks = element_blank())

  p_comb <- p_reg / p_rev

  return(p_comb)
}


all_plots_scico <- scico_continous_palettes %>%
  # head(1) %>%
  map(~p_test_scico(df = dcant_inv_all_color_test,
                      i_palette = .x))

viridis_continous_palettes <- c(
  "viridis",
  "magma",
  "inferno",
  "plasma"
)

p_test_viridis <- function(df, i_palette) {
  p_reg <- map +
    geom_raster(data = df,
                aes(lon, lat, fill = dcant_int)) +
    scale_fill_viridis_d(
      option = i_palette,
      drop = FALSE,
      name = legend_title,
      guide = "none"
    ) +
    labs(title = i_palette) +
    theme(axis.text = element_blank(),
          axis.ticks = element_blank())

  p_rev <- map +
    geom_raster(data = df,
              aes(lon, lat, fill = dcant_int)) +
    scale_fill_viridis_d(
      option = i_palette,
      drop = FALSE,
      name = legend_title,
      direction = -1,
      guide = "none"
    ) +
    labs(title = paste(i_palette, "rev")) +
    theme(axis.text = element_blank(),
          axis.ticks = element_blank())

  p_comb <- p_reg / p_rev

  return(p_comb)
}

all_plots_viridis <- viridis_continous_palettes %>%
  # head(1) %>%
  map(~p_test_viridis(df = dcant_inv_all_color_test,
                      i_palette = .x))


library(colorspace)

colorspace_continous_palettes <- c(
  # "Purple - Blue",
  # "Red - Purple",
  # "Blue - Yellow",
  # "Heat",
  # "Heat 2",
  "Rocket"
  # "Mako",
  # "Dark",
  # "Mint",
  # "Mint",
  # "BluGrn",
  # "Teal",
  # "Sunset",
  # "SunsetDark",
  # "ag_Sunset",
  # "YlOrRd",
  # "YlGnBu",
  # "RdPu"
)

p_test_colorspace <- function(df, i_palette) {

  i_palette <<- i_palette

  p_reg <- map +
    geom_raster(data = df,
                aes(lon, lat, fill = dcant_int)) +
    scale_fill_discrete_sequential(
      palette = i_palette,
      drop = FALSE,
      name = legend_title,
      guide = "none"
    ) +
    labs(title = i_palette) +
    theme(axis.text = element_blank(),
          axis.ticks = element_blank())

  p_rev <- map +
    geom_raster(data = df,
                aes(lon, lat, fill = dcant_int)) +
    scale_fill_discrete_sequential(
      palette = i_palette,
      drop = FALSE,
      name = legend_title,
      rev = FALSE,
      guide = "none"
    ) +
    labs(title = paste(i_palette, "rev")) +
    theme(axis.text = element_blank(),
          axis.ticks = element_blank())

  p_comb <- p_reg / p_rev

  return(p_comb)
  rm(i_palette)

}

all_plots_colorspace <- colorspace_continous_palettes %>%
  # head(2) %>%
  map(~p_test_colorspace(df = dcant_inv_all_color_test,
                           i_palette = .x))

all_plots_colorspace

all_plots <- c(all_plots_colorspace, all_plots_viridis, all_plots_scico)

pdf(here::here("output/publication/test_color_scales.pdf"),
    width = 4, height = 4)
all_plots
dev.off()
sessionInfo()R version 4.1.2 (2021-11-01)
Platform: x86_64-pc-linux-gnu (64-bit)
Running under: openSUSE Leap 15.3
Matrix products: default
BLAS: /usr/local/R-4.1.2/lib64/R/lib/libRblas.so
LAPACK: /usr/local/R-4.1.2/lib64/R/lib/libRlapack.so
locale:
[1] LC_CTYPE=en_US.UTF-8 LC_NUMERIC=C
[3] LC_TIME=en_US.UTF-8 LC_COLLATE=en_US.UTF-8
[5] LC_MONETARY=en_US.UTF-8 LC_MESSAGES=en_US.UTF-8
[7] LC_PAPER=en_US.UTF-8 LC_NAME=C
[9] LC_ADDRESS=C LC_TELEPHONE=C
[11] LC_MEASUREMENT=en_US.UTF-8 LC_IDENTIFICATION=C
attached base packages:
[1] stats graphics grDevices utils datasets methods base
other attached packages:
[1] ggh4x_0.2.1 khroma_1.9.0 BSDA_1.2.1 lattice_0.20-45
[5] kableExtra_1.3.4 ggdist_3.1.1 ggalluvial_0.12.3 geomtextpath_0.1.0
[9] colorspace_2.0-2 marelac_2.1.10 shape_1.4.6 ggforce_0.3.3
[13] metR_0.11.0 scico_1.3.0 patchwork_1.1.1 collapse_1.7.0
[17] forcats_0.5.1 stringr_1.4.0 dplyr_1.0.7 purrr_0.3.4
[21] readr_2.1.1 tidyr_1.1.4 tibble_3.1.6 ggplot2_3.3.5
[25] tidyverse_1.3.1 workflowr_1.7.0
loaded via a namespace (and not attached):
[1] readxl_1.3.1 backports_1.4.1 Hmisc_4.6-0
[4] systemfonts_1.0.3 splines_4.1.2 digest_0.6.29
[7] htmltools_0.5.2 fansi_1.0.2 magrittr_2.0.1
[10] checkmate_2.0.0 cluster_2.1.2 tzdb_0.2.0
[13] modelr_0.1.8 vroom_1.5.7 svglite_2.0.0
[16] jpeg_0.1-9 rvest_1.0.2 ggrepel_0.9.1
[19] textshaping_0.3.6 haven_2.4.3 xfun_0.29
[22] callr_3.7.0 crayon_1.4.2 jsonlite_1.7.3
[25] survival_3.2-13 zoo_1.8-9 glue_1.6.0
[28] polyclip_1.10-0 gtable_0.3.0 webshot_0.5.2
[31] distributional_0.3.0 scales_1.1.1 DBI_1.1.2
[34] Rcpp_1.0.8 isoband_0.2.5 viridisLite_0.4.0
[37] htmlTable_2.4.0 foreign_0.8-82 bit_4.0.4
[40] proxy_0.4-26 Formula_1.2-4 htmlwidgets_1.5.4
[43] httr_1.4.2 seacarb_3.3.0 RColorBrewer_1.1-2
[46] ellipsis_0.3.2 pkgconfig_2.0.3 farver_2.1.0
[49] nnet_7.3-17 sass_0.4.0 dbplyr_2.1.1
[52] utf8_1.2.2 here_1.0.1 tidyselect_1.1.1
[55] labeling_0.4.2 rlang_1.0.2 later_1.3.0
[58] munsell_0.5.0 cellranger_1.1.0 tools_4.1.2
[61] cli_3.1.1 generics_0.1.1 broom_0.7.11
[64] evaluate_0.14 fastmap_1.1.0 yaml_2.2.1
[67] oce_1.5-0 processx_3.5.2 knitr_1.37
[70] bit64_4.0.5 fs_1.5.2 nlme_3.1-155
[73] whisker_0.4 xml2_1.3.3 compiler_4.1.2
[76] rstudioapi_0.13 png_0.1-7 e1071_1.7-9
[79] reprex_2.0.1 tweenr_1.0.2 bslib_0.3.1
[82] stringi_1.7.6 highr_0.9 ps_1.6.0
[85] Matrix_1.4-0 vctrs_0.3.8 pillar_1.6.4
[88] lifecycle_1.0.1 jquerylib_0.1.4 gsw_1.0-6
[91] data.table_1.14.2 httpuv_1.6.5 R6_2.5.1
[94] latticeExtra_0.6-29 promises_1.2.0.1 gridExtra_2.3
[97] MASS_7.3-55 assertthat_0.2.1 rprojroot_2.0.2
[100] withr_2.4.3 SolveSAPHE_2.1.0 mgcv_1.8-38
[103] parallel_4.1.2 hms_1.1.1 grid_4.1.2
[106] rpart_4.1-15 class_7.3-20 rmarkdown_2.11
[109] git2r_0.29.0 getPass_0.2-2 lubridate_1.8.0
[112] base64enc_0.1-3