E. coli K12 analysis
Last updated: 2023-01-13
Checks: 7 0
Knit directory: G000204_duplex/
This reproducible R Markdown analysis was created with workflowr (version 1.6.2). The Checks tab describes the reproducibility checks that were applied when the results were created. The Past versions tab lists the development history.
Great! Since the R Markdown file has been committed to the Git repository, you know the exact version of the code that produced these results.
Great job! The global environment was empty. Objects defined in the global environment can affect the analysis in your R Markdown file in unknown ways. For reproduciblity it’s best to always run the code in an empty environment.
The command set.seed(20210916) was run prior to running
the code in the R Markdown file. Setting a seed ensures that any results
that rely on randomness, e.g. subsampling or permutations, are
reproducible.
Great job! Recording the operating system, R version, and package versions is critical for reproducibility.
Nice! There were no cached chunks for this analysis, so you can be confident that you successfully produced the results during this run.
Great job! Using relative paths to the files within your workflowr project makes it easier to run your code on other machines.
Great! You are using Git for version control. Tracking code development and connecting the code version to the results is critical for reproducibility.
The results in this page were generated with repository version cf4738a. See the Past versions tab to see a history of the changes made to the R Markdown and HTML files.
Note that you need to be careful to ensure that all relevant files for
the analysis have been committed to Git prior to generating the results
(you can use wflow_publish or
wflow_git_commit). workflowr only checks the R Markdown
file, but you know if there are other scripts or data files that it
depends on. Below is the status of the Git repository when the results
were generated:
Ignored files:
    Ignored:    .DS_Store
    Ignored:    .Rapp.history
    Ignored:    .Rhistory
    Ignored:    .Rproj.user/
    Ignored:    analysis/.DS_Store
    Ignored:    data/.DS_Store
    Ignored:    scripts/

Untracked files:
    Untracked:  ._.DS_Store
    Untracked:  ._rare-mutation-detection.Rproj
    Untracked:  DOCNAME
    Untracked:  analysis/._.DS_Store
    Untracked:  analysis/._ecoli_spikeins.Rmd
    Untracked:  analysis/cache/
    Untracked:  analysis/calc_nanoseq_metrics.Rmd
    Untracked:  data/._.DS_Store
    Untracked:  data/._metrics.rds
    Untracked:  data/ecoli/
    Untracked:  data/ecoli_k12_metrics.rds
    Untracked:  data/metadata/
    Untracked:  data/metrics_efficiency_nossc.rds
    Untracked:  data/metrics_spikeins.rds
    Untracked:  data/mixtures
    Untracked:  data/ref/
    Untracked:  drop_out_rate.pdf
    Untracked:  efficiency.pdf
    Untracked:  prototype_code/
    Untracked:  stats.csv

Unstaged changes:
    Modified:   analysis/ecoli_spikeins.Rmd
    Modified:   analysis/model.Rmd
Note that any generated files, e.g. HTML, png, CSS, etc., are not included in this status report because it is ok for generated content to have uncommitted changes.
These are the previous versions of the repository in which changes were
made to the R Markdown (analysis/ecoli_K12.Rmd) and HTML
(docs/ecoli_K12.html) files. If you’ve configured a remote
Git repository (see ?wflow_git_remote), click on the
hyperlinks in the table below to view the files as they were in that
past version.
| File | Version | Author | Date | Message |
|---|---|---|---|---|
| Rmd | cf4738a | mcmero | 2023-01-13 | Added coverage efficiency comparison |
| html | c80b470 | mcmero | 2023-01-12 | Build site. |
| Rmd | 336d137 | mcmero | 2023-01-12 | Fix textual error |
| html | f6d66ce | mcmero | 2023-01-12 | Build site. |
| Rmd | 403354f | mcmero | 2023-01-12 | Fix formatting |
| html | 217f414 | mcmero | 2023-01-12 | Build site. |
| Rmd | 89ad7d8 | mcmero | 2023-01-12 | Added efficiency estimation experiments |
| html | bec5375 | Marek Cmero | 2022-11-18 | Build site. |
| Rmd | 23f67a5 | Marek Cmero | 2022-11-18 | Fixed experiment table |
| html | fb1a29c | Marek Cmero | 2022-11-10 | Build site. |
| Rmd | f2ecd7b | Marek Cmero | 2022-11-10 | Added experimental setup table, paired T-test, plots for poster. |
| html | 55d7990 | Marek Cmero | 2022-09-13 | Build site. |
| Rmd | 22dbb2c | Marek Cmero | 2022-09-13 | Added raw variant call comparison for xGEN-xGEN samples |
| html | 10ee194 | Marek Cmero | 2022-09-08 | Build site. |
| Rmd | 2803c25 | Marek Cmero | 2022-09-08 | Minor dimension update |
| html | f4000d4 | Marek Cmero | 2022-09-08 | Build site. |
| Rmd | c5835c8 | Marek Cmero | 2022-09-08 | Plot updates |
| html | e1c0c28 | Marek Cmero | 2022-09-06 | Build site. |
| Rmd | 5cbe59d | Marek Cmero | 2022-09-06 | Plot fixes; added more family metrics |
| html | f90d40a | Marek Cmero | 2022-08-18 | Build site. |
| Rmd | 7ff227e | Marek Cmero | 2022-08-18 | Added downsampling experiments and some presentation-only plots. |
| html | 22d32ef | Marek Cmero | 2022-05-31 | Build site. |
| Rmd | e722dc0 | Marek Cmero | 2022-05-31 | Fix typo, minor code update |
| html | b524238 | Marek Cmero | 2022-05-26 | Build site. |
| Rmd | afd79e5 | Marek Cmero | 2022-05-26 | Added revised model, in silico mixtures redone with 1 supporting read, added input cell estimates |
| html | 491e97d | Marek Cmero | 2022-05-19 | Build site. |
| Rmd | 434e8b9 | Marek Cmero | 2022-05-19 | Added in silico mixtures to navigation |
| html | faf9130 | Marek Cmero | 2022-05-18 | Build site. |
| Rmd | aacf423 | Marek Cmero | 2022-05-18 | Add coverage & variant results without requiring SSC |
| html | 4da2244 | Marek Cmero | 2022-05-11 | Build site. |
| Rmd | 71e857b | Marek Cmero | 2022-05-11 | Summary plot with all experimental factors |
| html | cc380cc | Marek Cmero | 2022-05-11 | Build site. |
| Rmd | 48b6d2e | Marek Cmero | 2022-05-11 | Added statistical tests with xGen rep 1 outlier removed |
| html | 7c4f403 | Marek Cmero | 2022-04-25 | Build site. |
| Rmd | 30f532f | Marek Cmero | 2022-04-25 | Include all samples in variant upset plot |
| html | fcb6578 | Marek Cmero | 2022-04-11 | Build site. |
| Rmd | 6f2c2bb | Marek Cmero | 2022-04-11 | Add family stats, boxplot fixes |
| html | a2f0a4a | Marek Cmero | 2022-04-08 | Build site. |
| Rmd | bffbb7e | Marek Cmero | 2022-04-08 | Repeat variant analysis without filtering strand bias |
| html | c246dc2 | Marek Cmero | 2022-04-07 | Build site. |
| Rmd | e10a166 | Marek Cmero | 2022-04-07 | Added variant call upset plot |
| html | a860101 | Marek Cmero | 2022-04-06 | Build site. |
| Rmd | 5dcf0e9 | Marek Cmero | 2022-04-06 | Added relationship plots |
| html | 81272b2 | Marek Cmero | 2022-04-05 | Build site. |
| Rmd | 43c95e3 | Marek Cmero | 2022-04-05 | Fix figures |
| html | f13e13a | Marek Cmero | 2022-04-05 | Build site. |
| Rmd | db75aa7 | Marek Cmero | 2022-04-05 | Added statistical tests |
| html | def2130 | Marek Cmero | 2022-04-05 | Build site. |
| Rmd | 1e5e696 | Marek Cmero | 2022-04-05 | Added descriptions for metrics. General plot improvements. |
| html | 953b83e | Marek Cmero | 2022-03-31 | Build site. |
| html | 05412f6 | Marek Cmero | 2022-03-28 | Build site. |
| Rmd | ea0ad82 | Marek Cmero | 2022-03-28 | Added singleton comparison + facet summary plots |
| html | 51aba0e | Marek Cmero | 2022-03-25 | Build site. |
| Rmd | a3895f7 | Marek Cmero | 2022-03-25 | Bug fix |
| html | ea4faf4 | Marek Cmero | 2022-03-25 | Build site. |
| Rmd | 5964f14 | Marek Cmero | 2022-03-25 | Added more comparison plots for ecoli K12 data |
| html | e5b39ad | Marek Cmero | 2022-03-25 | Build site. |
| Rmd | 1926d3d | Marek Cmero | 2022-03-25 | added K12 ecoli metrics |
Metrics for E. coli K12 data
Experimental setup
| End-prep | Mung Bean nuclease units | S1 Nuclease units | Protocol | PCR | Samples | Key |
|---|---|---|---|---|---|---|
| MB1 | 1 | 0 | NanoSeq | limited | 2 | 1+0 |
| MB2 | 2 | 0 | NanoSeq | limited | 2 | 2+0 |
| MB3 | 3 | 0 | Nanoseq | limited | 2 | 3+0 |
| MB-S1 | 2 | 1 | Nanoseq | limited | 2 | 2+1 |
| MB1 | 1 | 0 | xGEN | limited | 2 | 1+0 |
| MB2 | 2 | 0 | xGEN | limited | 2 | 2+0 |
| MB3 | 3 | 0 | xGEN | limited | 2 | 3+0 |
| MB-S1 | 2 | 1 | xGEN | limited | 2 | 2+1 |
| xGEN | 0 | 0 | xGEN | limited | 2 | 0+0 |
| xGEN | 0 | 0 | xGEN | unlimited | 1 | 0+0 |
MultiQC reports:
- AGRF_CAGRF22029764_HJK2GDSX3 MultiQC pre-duplex
- AGRF_CAGRF22029764_HJK2GDSX3 MultiQC duplex
- AGRF_CAGRF22029764_HJK2GDSX3 MultiQC duplex without SSCs
library(ggplot2)
library(data.table)
library(dplyr)
library(here)
library(tibble)
library(stringr)
library(Rsamtools)
library(GenomicRanges)
library(seqinr)
library(parallel)
library(readxl)
library(patchwork)
library(RColorBrewer)
library(UpSetR)
library(vcfR)
source(here('code/load_data.R'))
source(here('code/plot.R'))
source(here('code/efficiency_nanoseq_functions.R'))# Ecoli genome max size
# genome_max <- 4528118
genome_max <- c('2e914854fabb46b9_1' = 4661751,
'2e914854fabb46b9_2' = 67365)
cores = 8genomeFile <- here('data/ref/Escherichia_coli_ATCC_10798.fasta')
rinfo_dir <- here('data/ecoli/AGRF_CAGRF22029764_HJK2GDSX3/QC/read_info')
markdup_dir <- here('data/ecoli/AGRF_CAGRF22029764_HJK2GDSX3/QC/mark_duplicates')
qualimap_dir <- here('data/ecoli/AGRF_CAGRF22029764_HJK2GDSX3/QC/qualimap')
qualimap_cons_dir <- here('data/ecoli/AGRF_CAGRF22029764_HJK2GDSX3/QC/consensus/qualimap')
qualimap_cons_nossc_dir <- here('data/ecoli/AGRF_CAGRF22029764_HJK2GDSX3/QC/consensus/qualimap_nossc')
metadata_file <- here('data/metadata/NovaSeq data E coli.xlsx')
variant_dir <- here('data/ecoli/AGRF_CAGRF22029764_HJK2GDSX3/variants')
variant_nossc_dir <- here('data/ecoli/AGRF_CAGRF22029764_HJK2GDSX3/variants_nossc')
variant_raw_dir <- here('data/ecoli/variant_calling')sample_names <- list.files(rinfo_dir) %>%
str_split('\\.txt.gz') %>%
lapply(., dplyr::first) %>%
unlist() %>%
str_split('_') %>%
lapply(., head, 2) %>%
lapply(., paste, collapse='-') %>%
unlist()
# load variant data
var_df <- load_variants(variant_dir, sample_names)
var_df_nossc <- load_variants(variant_nossc_dir, sample_names[-9])
var_df_raw <- tmp <- load_variants(variant_raw_dir, c('xGEN-xGENRep1_default_filter', 'xGEN-xGENRep1_minimal_filter'))
# load and fetch duplicate rate from MarkDuplicates output
mdup <- load_markdup_data(markdup_dir, sample_names)
# get mean coverage for pre and post-consensus reads
qmap_cov <- get_qmap_coverage(qualimap_dir, sample_names)
qmap_cons_cov <- get_qmap_coverage(qualimap_cons_dir, sample_names)
qmap_cons_cov_nossc <- get_qmap_coverage(qualimap_cons_nossc_dir, sample_names[-9])
# # uncomment below to calculate metrics
# # calculate metrics for nanoseq
# rlen <- 151; skips <- 5
# metrics_nano <- calc_metrics_new_rbs(rinfo_dir, pattern = 'Nano', cores = cores)
#
# # calculate metrics for xGen
# rlen <- 151; skips <- 8
# metrics_xgen <- calc_metrics_new_rbs(rinfo_dir, pattern = 'xGEN', cores = cores)
#
# metrics <- c(metrics_nano, metrics_xgen) %>% bind_rows()
# metrics$duplicate_rate <- as.numeric(mdup)
# metrics$duplex_coverage_ratio <- qmap_cov$coverage / qmap_cons_cov$coverage
# metrics$duplex_coverage_ratio[qmap_cons_cov$coverage < 1] <- 0 # fix when < 1 duplex cov
# metrics$sample <- gsub('-HJK2GDSX3', '', sample_names)
# cache metrics object
# saveRDS(metrics, file = here('data/ecoli_k12_metrics.rds'))
metrics <- readRDS(here('data/ecoli_k12_metrics.rds'))
metrics$single_family_fraction <- metrics$single_families / metrics$total_families
# load metadata
metadata <- read_excel(metadata_file)
metadata$`sample name` <- gsub('_', '-', metadata$`sample name`)
# prepare for plotting
mm <- data.frame(melt(metrics))
mm$protocol <- 'NanoSeq'
mm$protocol[grep('xGEN', mm$sample)] <- 'xGen'
mm <- inner_join(mm, metadata, by=c('sample' = 'sample name'))
colnames(mm)[2] <- 'metric'
mm$nuclease <- paste(mm$`Mung bean unit`, mm$`S1 unit`, sep='+')Metric comparison plots
Duplicate rate
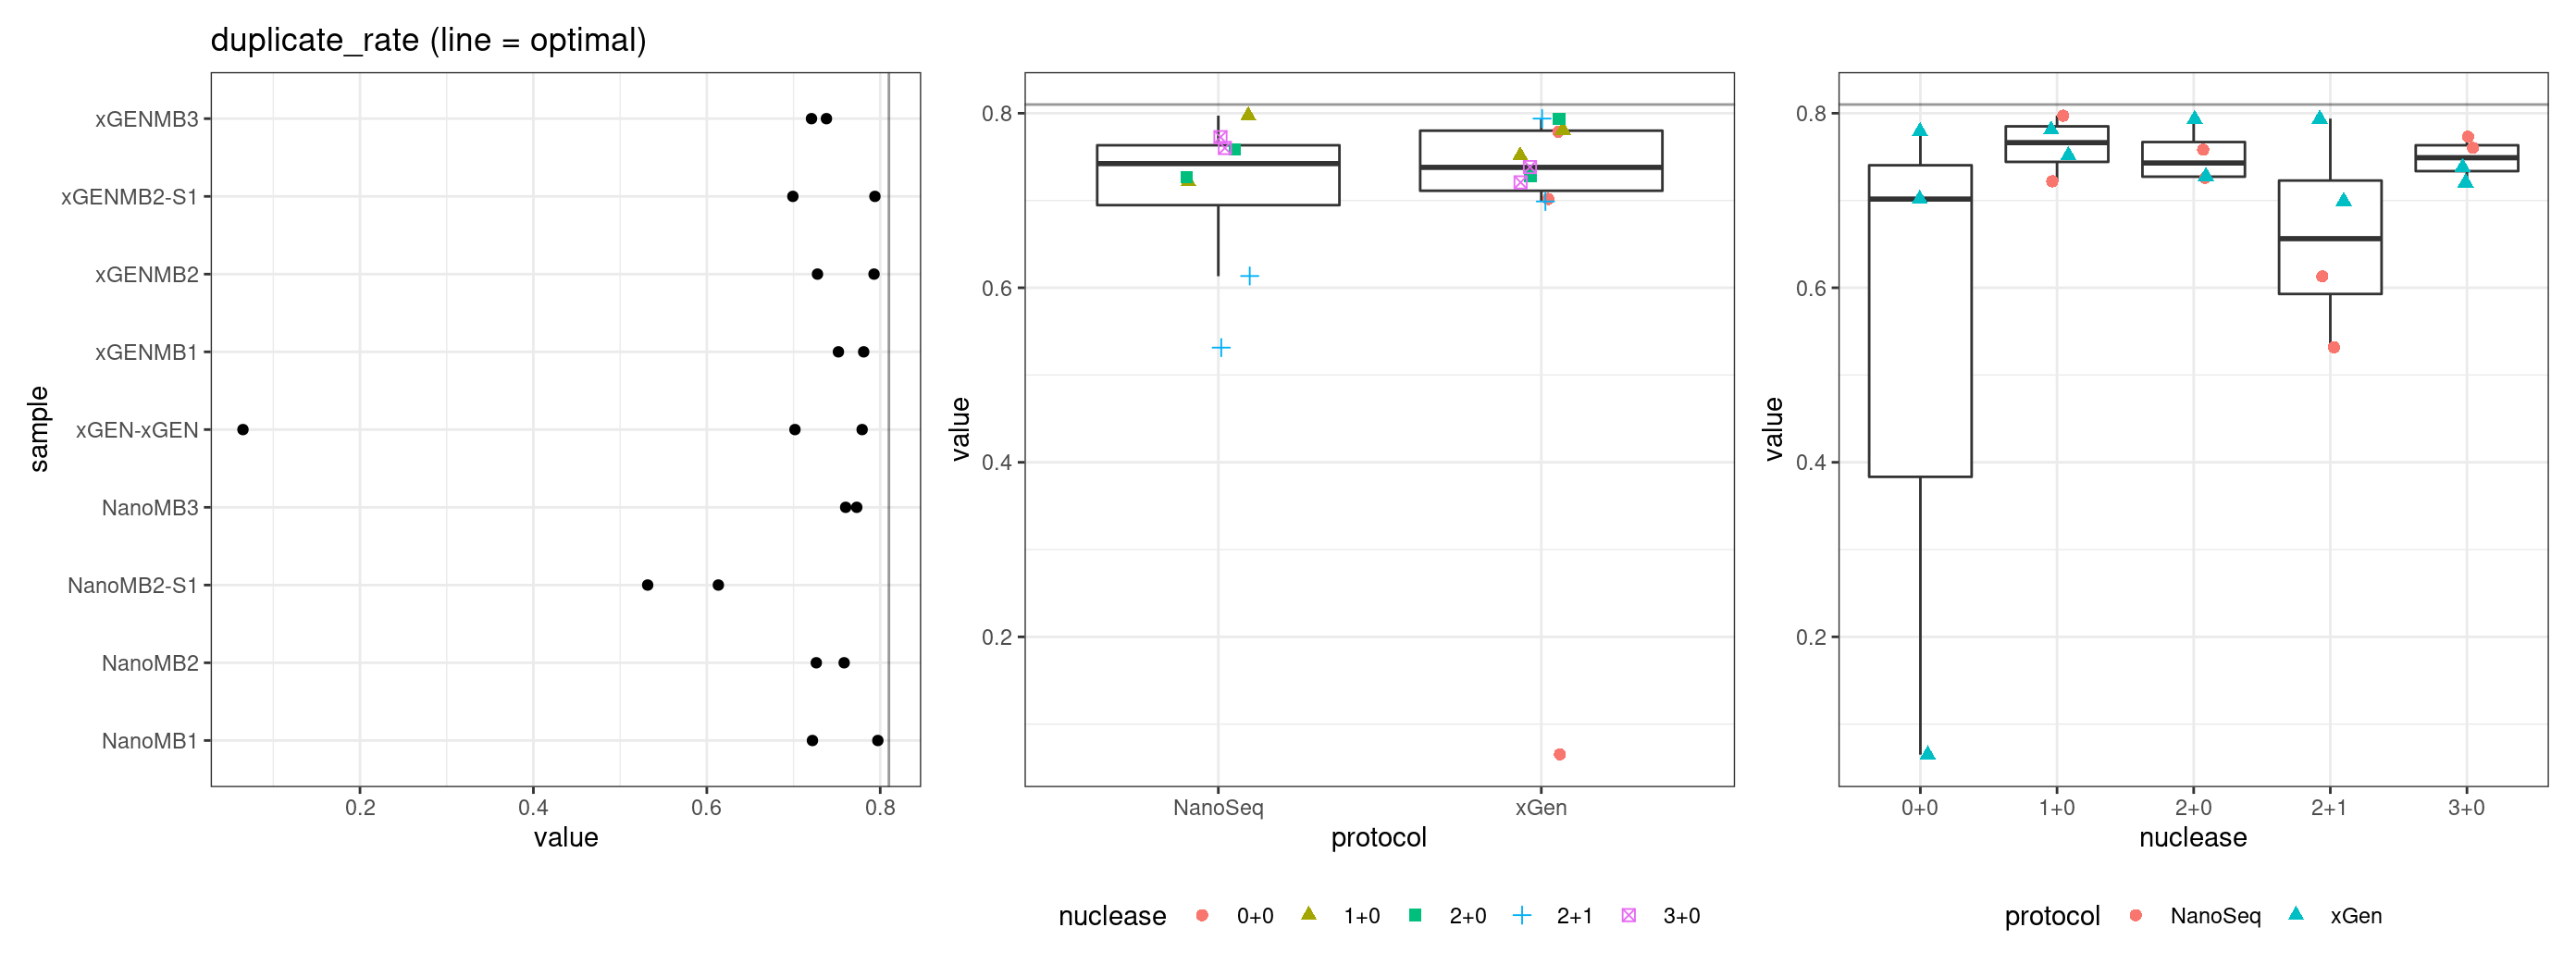
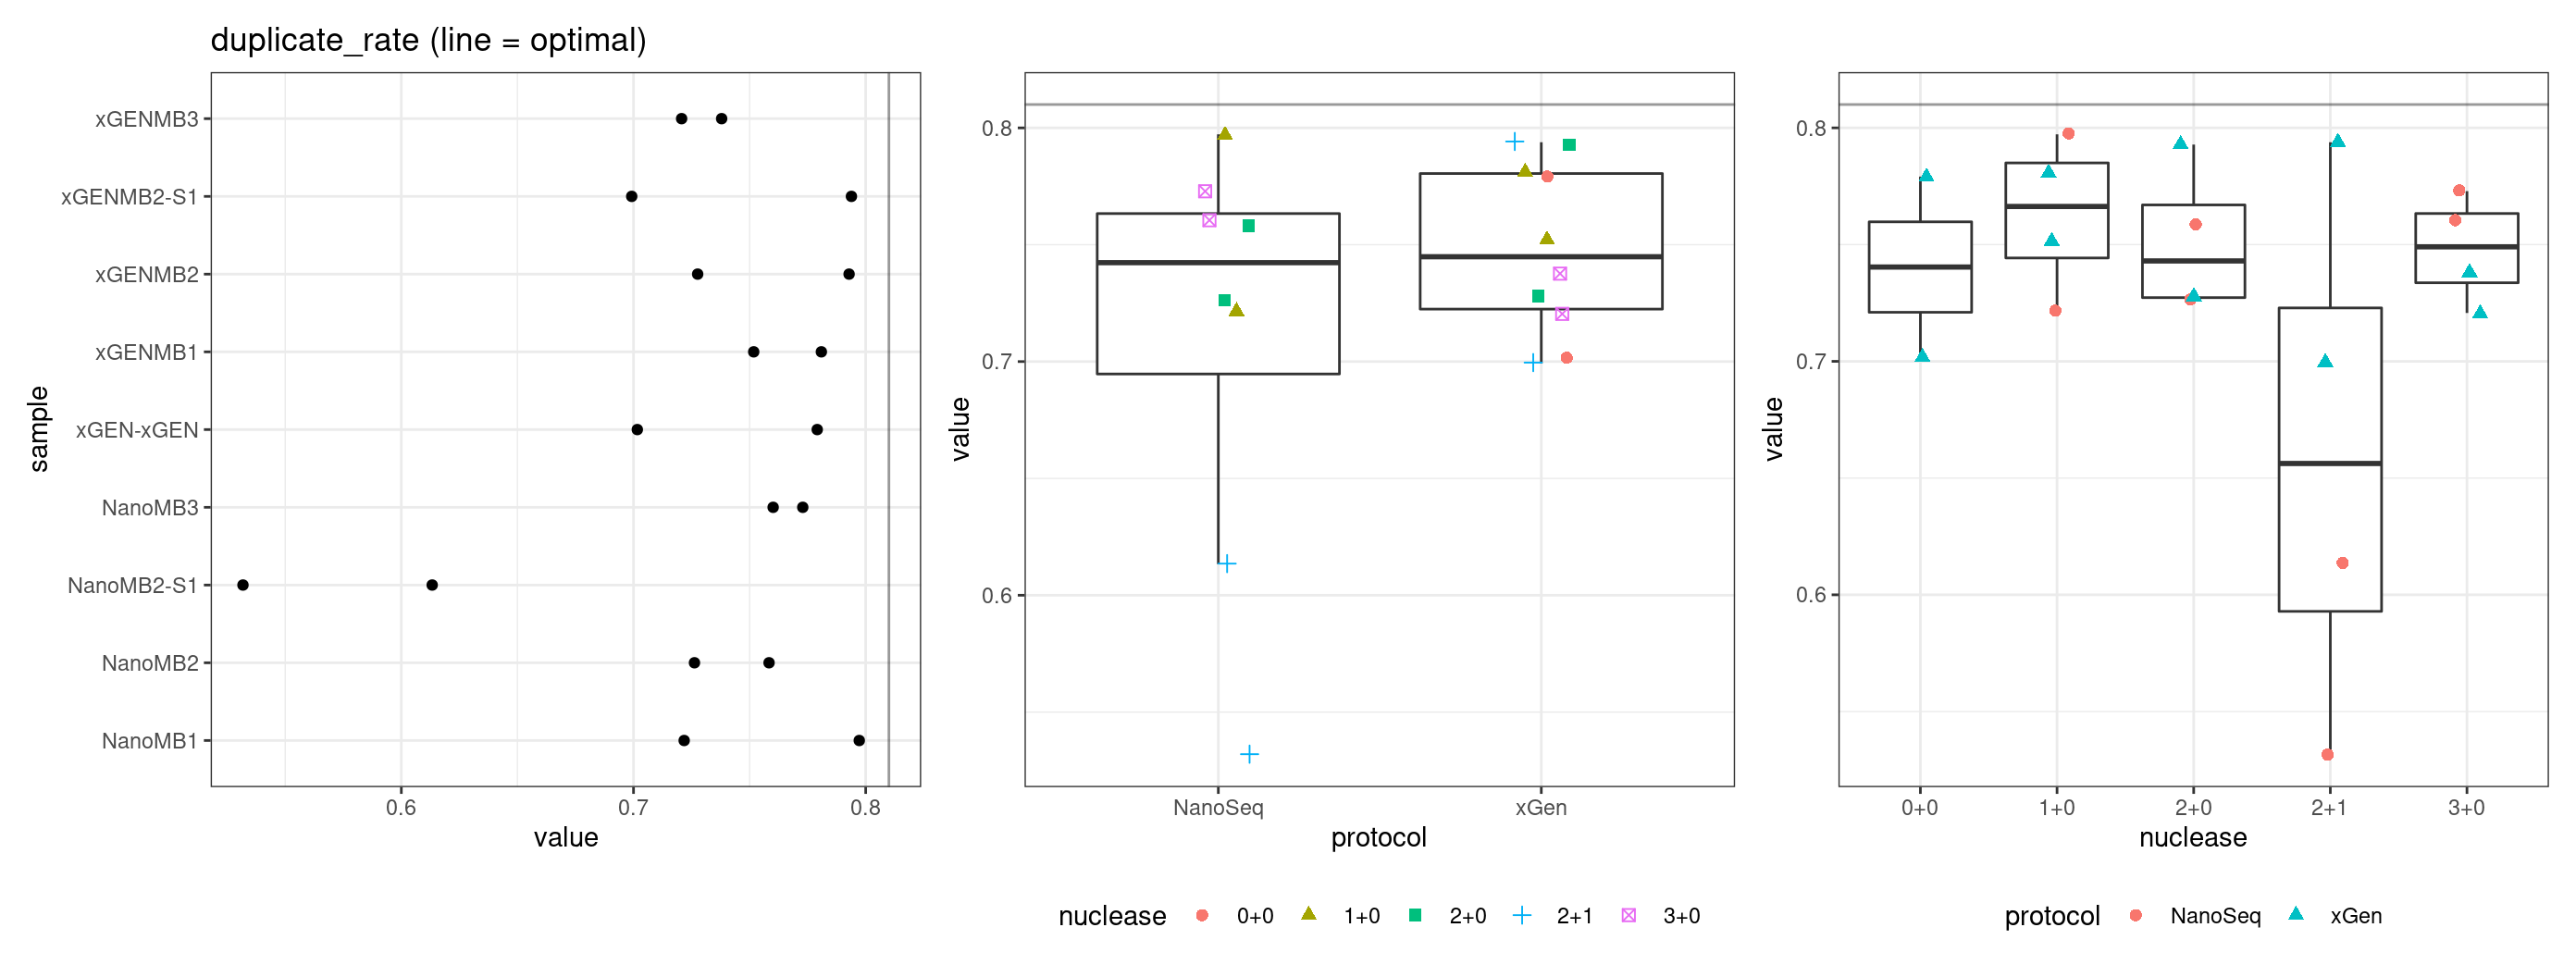
Fraction of duplicate reads calculated by Picard’s MarkDuplicates. This is based on barcode-aware aligned duplicates mapping to the same 5’ positions for both read pairs. The NanoSeq Analysis pipeline states the optimal empirical duplicate rate is 75-76% (marked in the plot).
metric <- 'duplicate_rate'
ggplot(mm[mm$metric == metric,], aes(sample, value)) +
        geom_histogram(stat = 'identity', position = 'dodge') +
        theme_bw() +
        coord_flip() +
        geom_hline(yintercept = 0.81, alpha = 0.4)  +
        ggtitle(metric)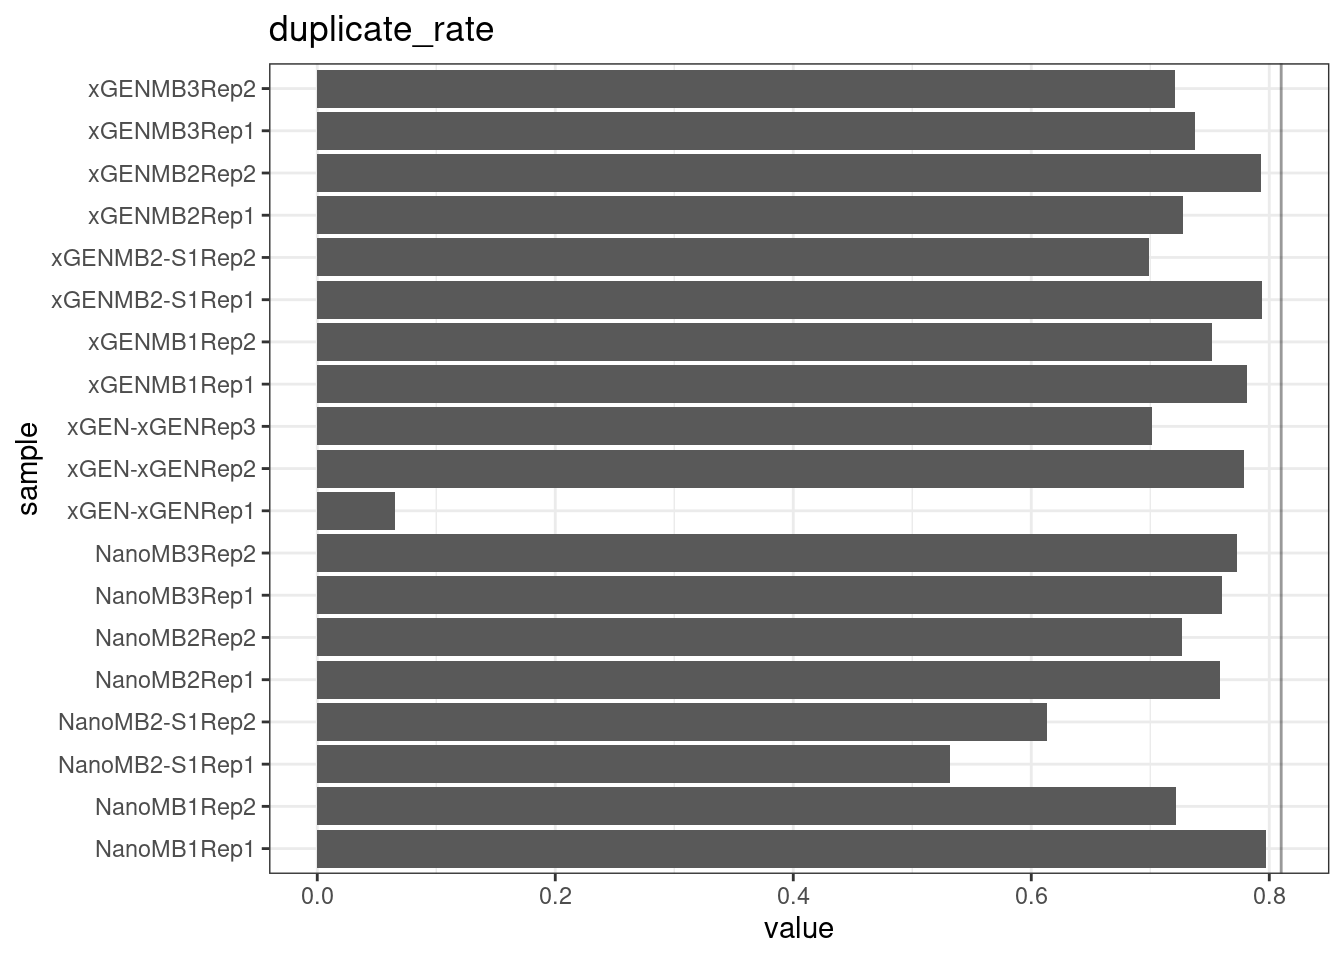
Fraction of singleton reads
Shows the number of single-read families divided by the total number of reads. As suggested by Stoler et al. 2016, this metric can server as a proxy for error rate, as (uncorrected) barcode mismatches will manifest as single-read families. The lower the fraction of singletons, the better.
metric <- 'frac_singletons'
ggplot(mm[mm$metric == metric,], aes(sample, value)) +
        geom_histogram(stat = 'identity', position = 'dodge') +
        theme_bw() +
        coord_flip() +
        ggtitle(metric)
Single family fraction
Similar to traction of singletons, this is the number of single read families, divided by the total families.
metric <- 'single_family_fraction'
ggplot(mm[mm$metric == metric,], aes(sample, value)) +
        geom_histogram(stat = 'identity', position = 'dodge') +
        theme_bw() +
        coord_flip() +
        ggtitle(metric)
| Version | Author | Date |
|---|---|---|
| e1c0c28 | Marek Cmero | 2022-09-06 |
| 22d32ef | Marek Cmero | 2022-05-31 |
| b524238 | Marek Cmero | 2022-05-26 |
| cc380cc | Marek Cmero | 2022-05-11 |
| 7c4f403 | Marek Cmero | 2022-04-25 |
| fcb6578 | Marek Cmero | 2022-04-11 |
| a2f0a4a | Marek Cmero | 2022-04-08 |
| c246dc2 | Marek Cmero | 2022-04-07 |
| a860101 | Marek Cmero | 2022-04-06 |
| 81272b2 | Marek Cmero | 2022-04-05 |
| f13e13a | Marek Cmero | 2022-04-05 |
| def2130 | Marek Cmero | 2022-04-05 |
| 953b83e | Marek Cmero | 2022-03-31 |
| 05412f6 | Marek Cmero | 2022-03-28 |
Drop-out rate
This is the same calculation as F-EFF in the NanoSeq Analysis pipeline:
“This shows the fraction of read bundles missing one of the two original strands beyond what would be expected under random sampling (assuming a binomial process). Good values are between 0.10-0.30, and larger values are likely due to DNA damage such as modified bases or internal nicks that prevent amplification of one of the two strands. Larger values do not impact the quality of the results, just reduce the efficiency of the protocol.”
This is similar to the singleton fraction, but taking into account loss of pairs due to sampling. The optimal range is shown by the lines.
metric <- 'drop_out_rate'
ggplot(mm[mm$metric == metric,], aes(sample, value)) +
        geom_histogram(stat = 'identity', position = 'dodge') +
        theme_bw() +
        coord_flip() +
        geom_hline(yintercept = c(0.1, 0.3), alpha = 0.4)  +
        ggtitle(metric)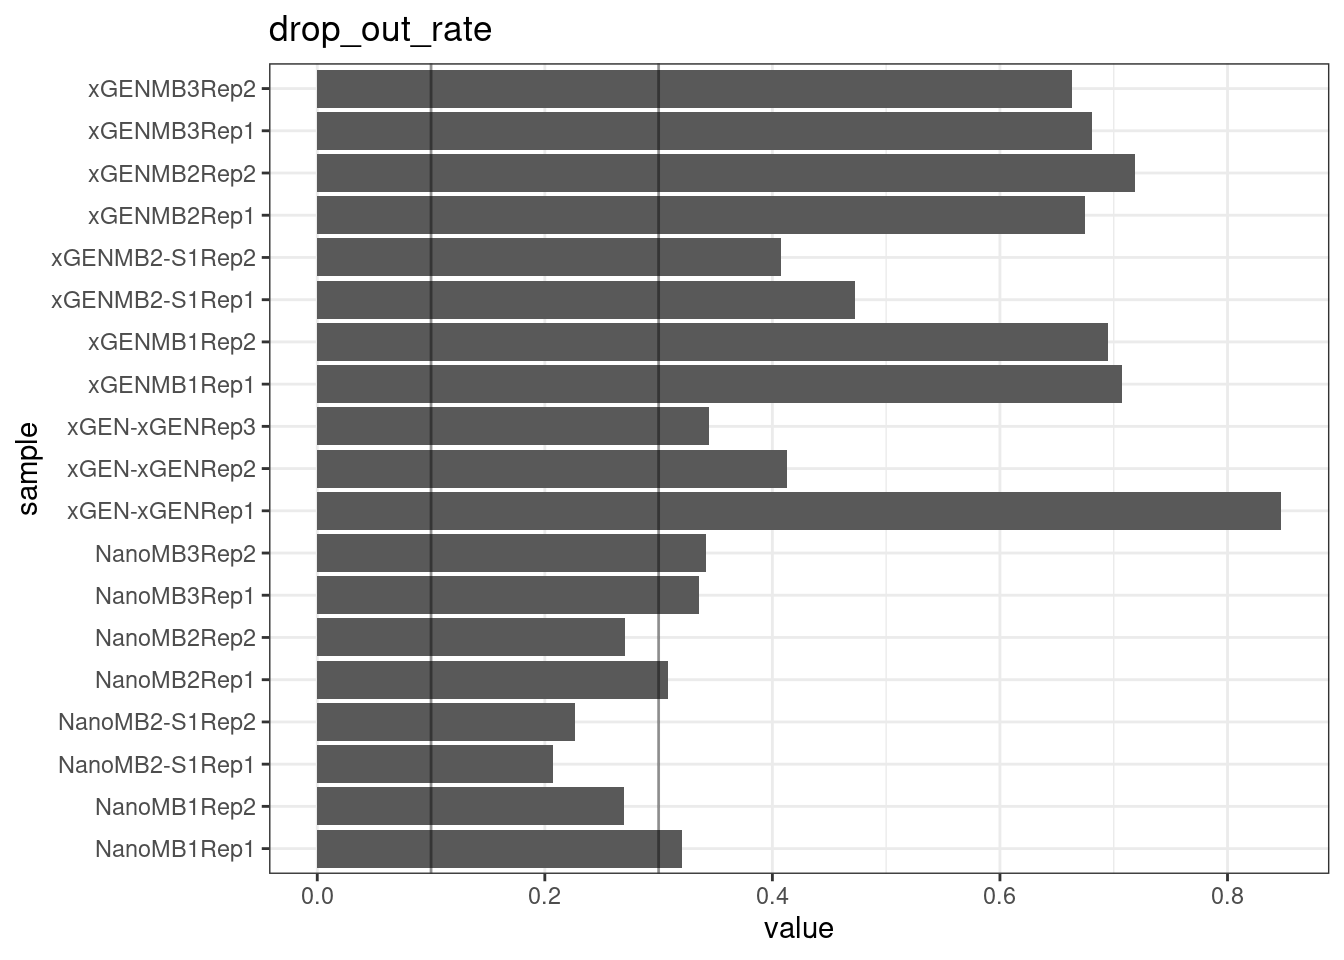
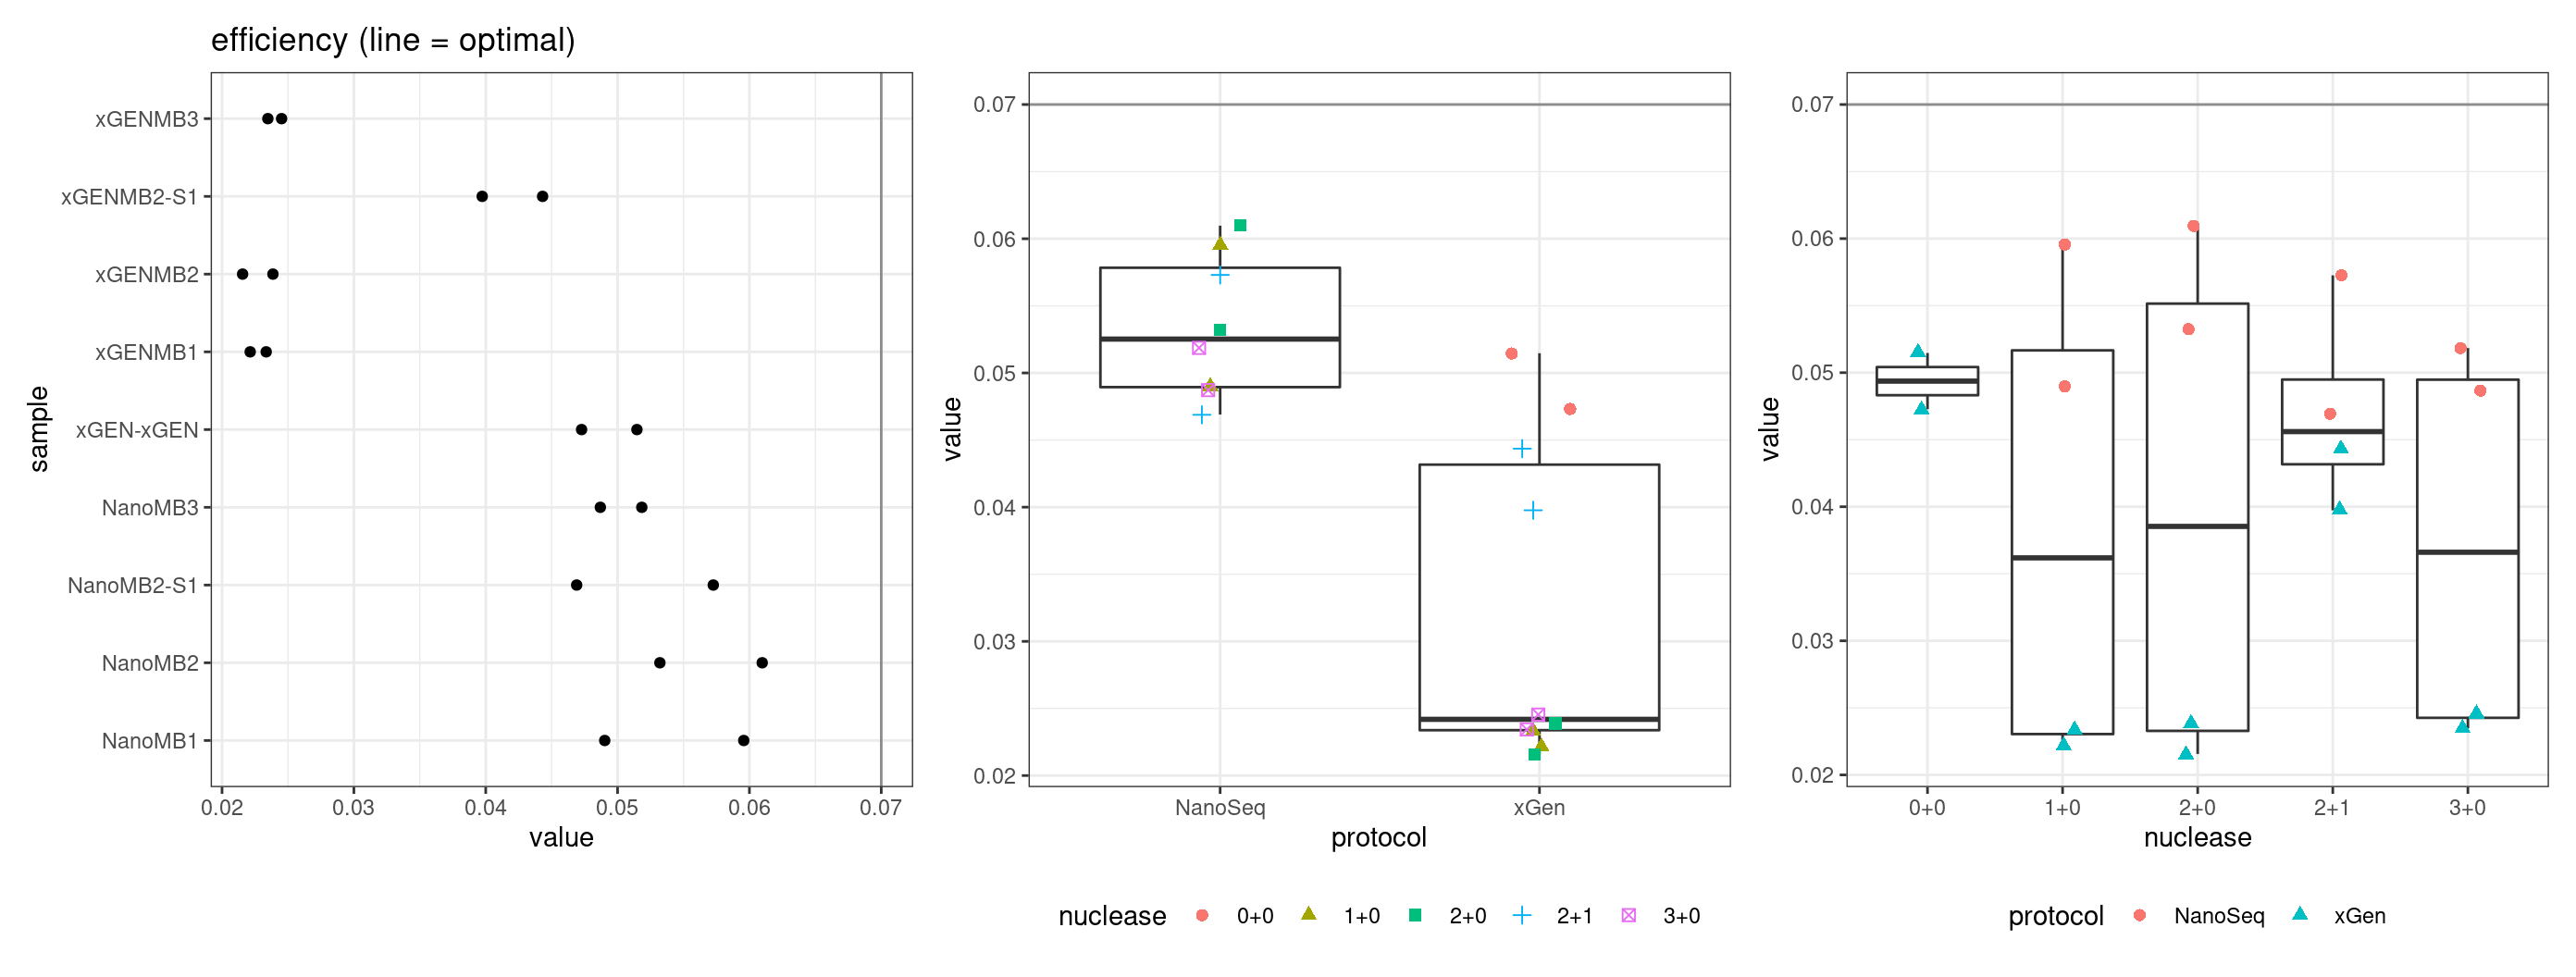
Efficiency
Efficiency is the number of duplex bases divided by the number of sequenced bases. According the NanoSeq Analysis pipeline, this value is maximised at ~0.07 when duplicate rates and strand drop-outs are optimal.
metric <- 'efficiency'
ggplot(mm[mm$metric == metric,], aes(sample, value)) +
        geom_histogram(stat = 'identity', position = 'dodge') +
        theme_bw() +
        coord_flip() +
        geom_hline(yintercept = c(0.07), alpha = 0.4)  +
        ggtitle(metric)
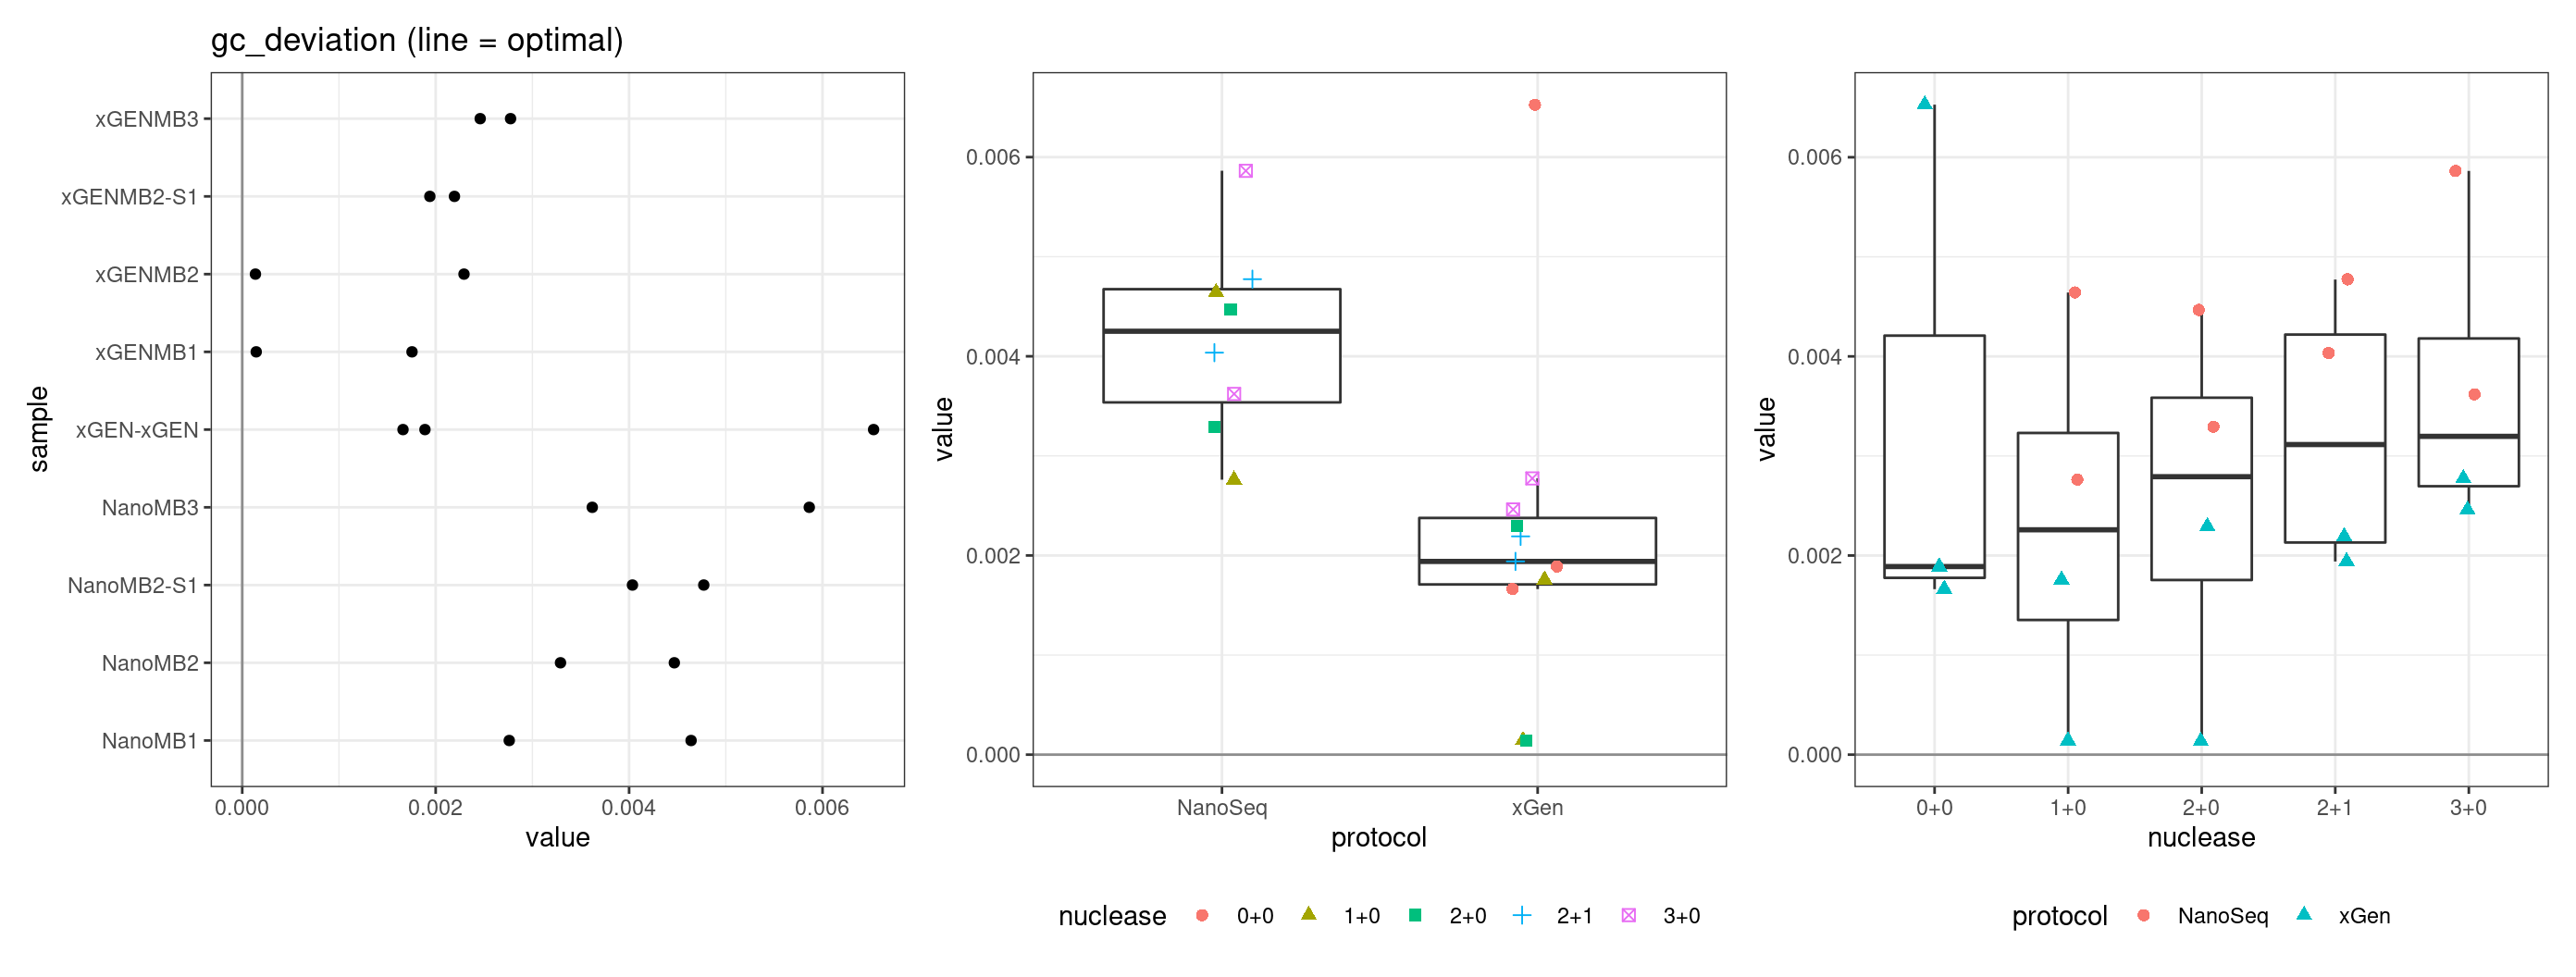
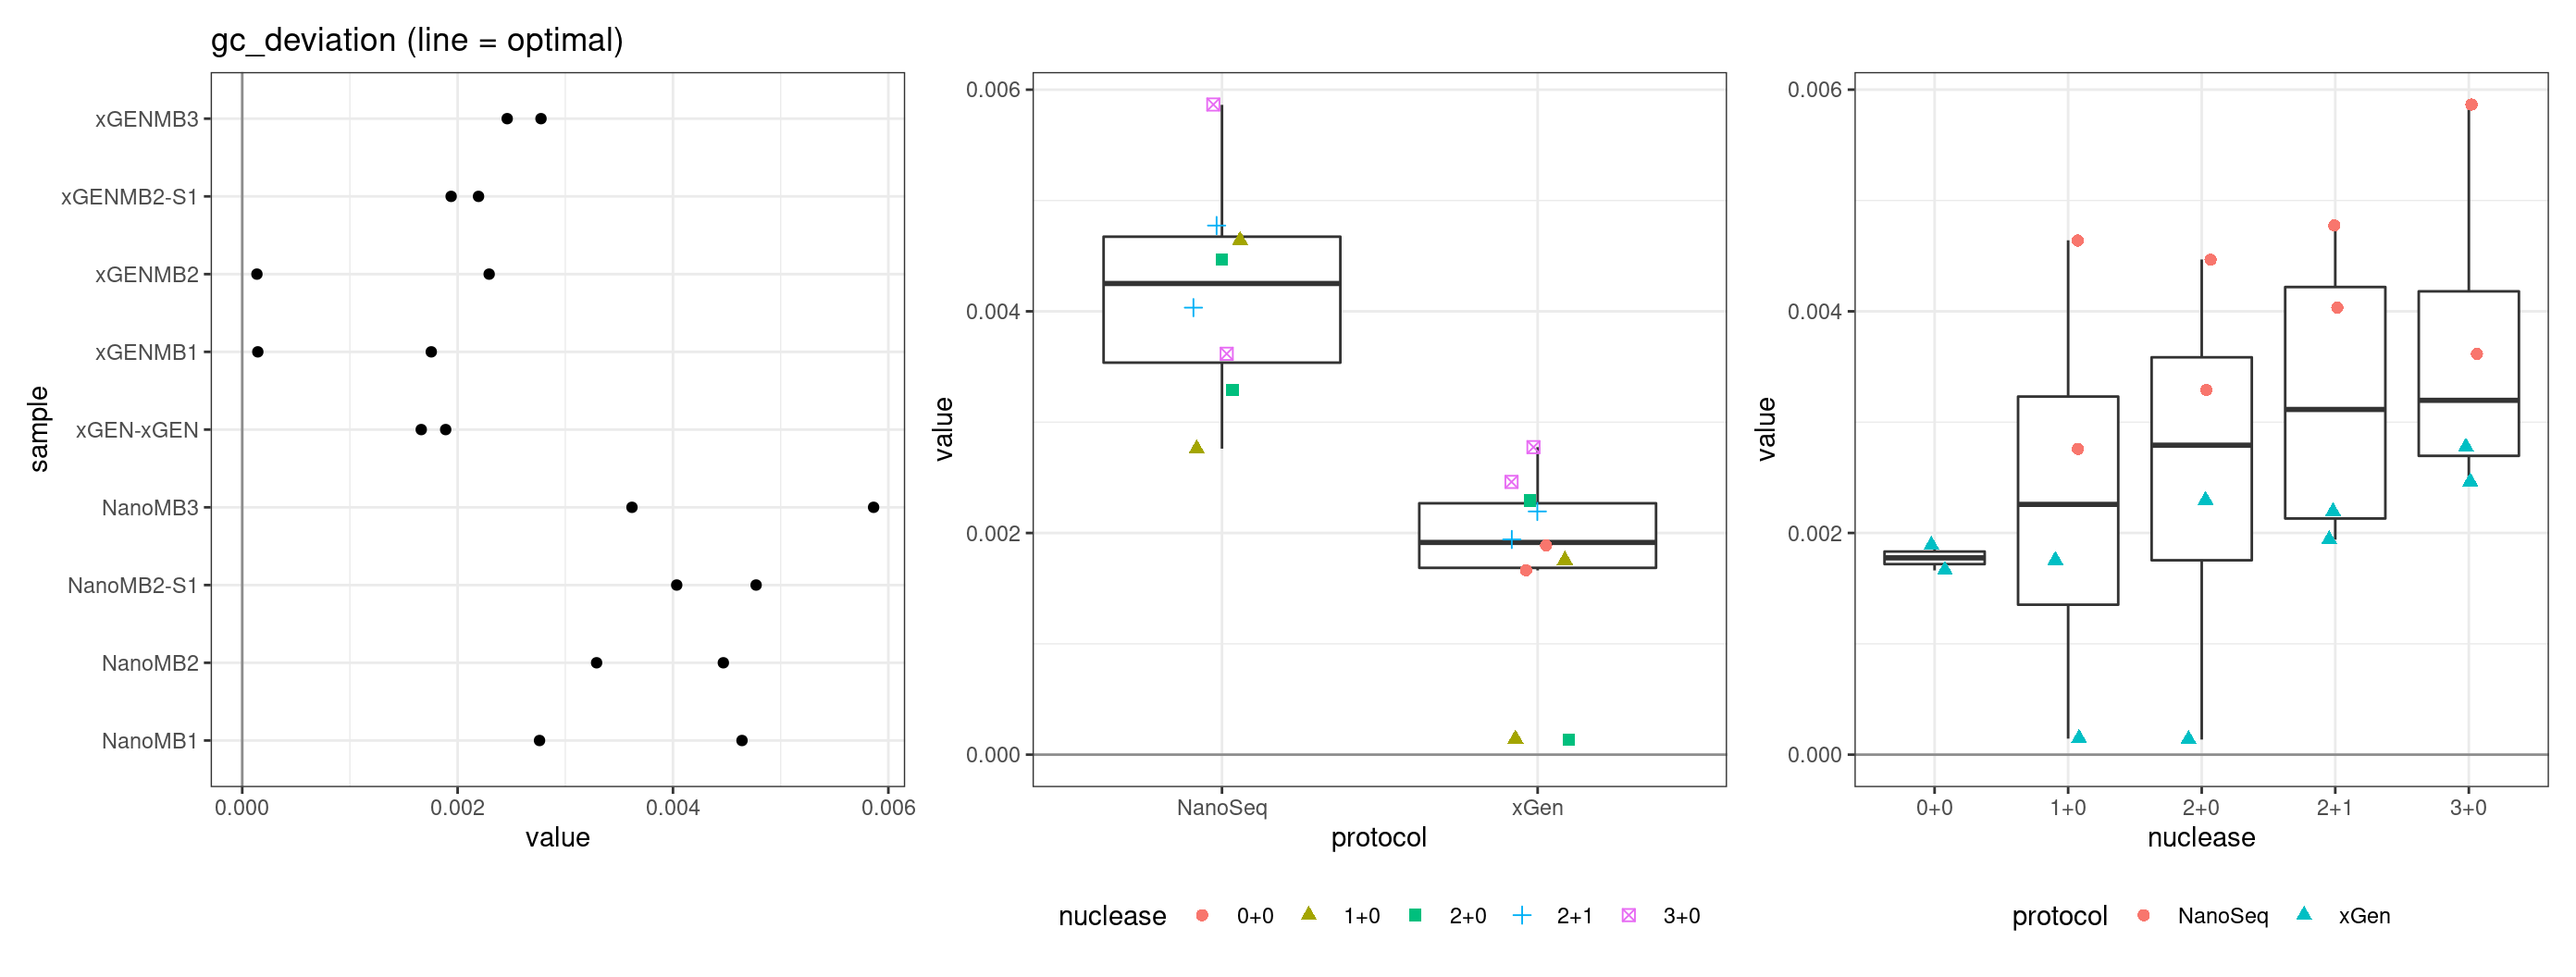
GC deviation
GC deviation is the absolute difference between GC_BOTH
and GC_SINGLE calculated by the NanoSeq Analysis
pipeline. The lower this deviation, the better.
“GC_BOTH and GC_SINGLE: the GC content of RBs with both strands and with just one strand. The two values should be similar between them and similar to the genome average. If there are large deviations that is possibly due to biases during PCR amplification. If GC_BOTH is substantially larger than GC_SINGLE, DNA denaturation before dilution may have taken place.”
metric <- 'gc_deviation'
ggplot(mm[mm$metric == metric,], aes(sample, value)) +
        geom_histogram(stat = 'identity', position = 'dodge') +
        theme_bw() +
        coord_flip() +
        ggtitle(metric)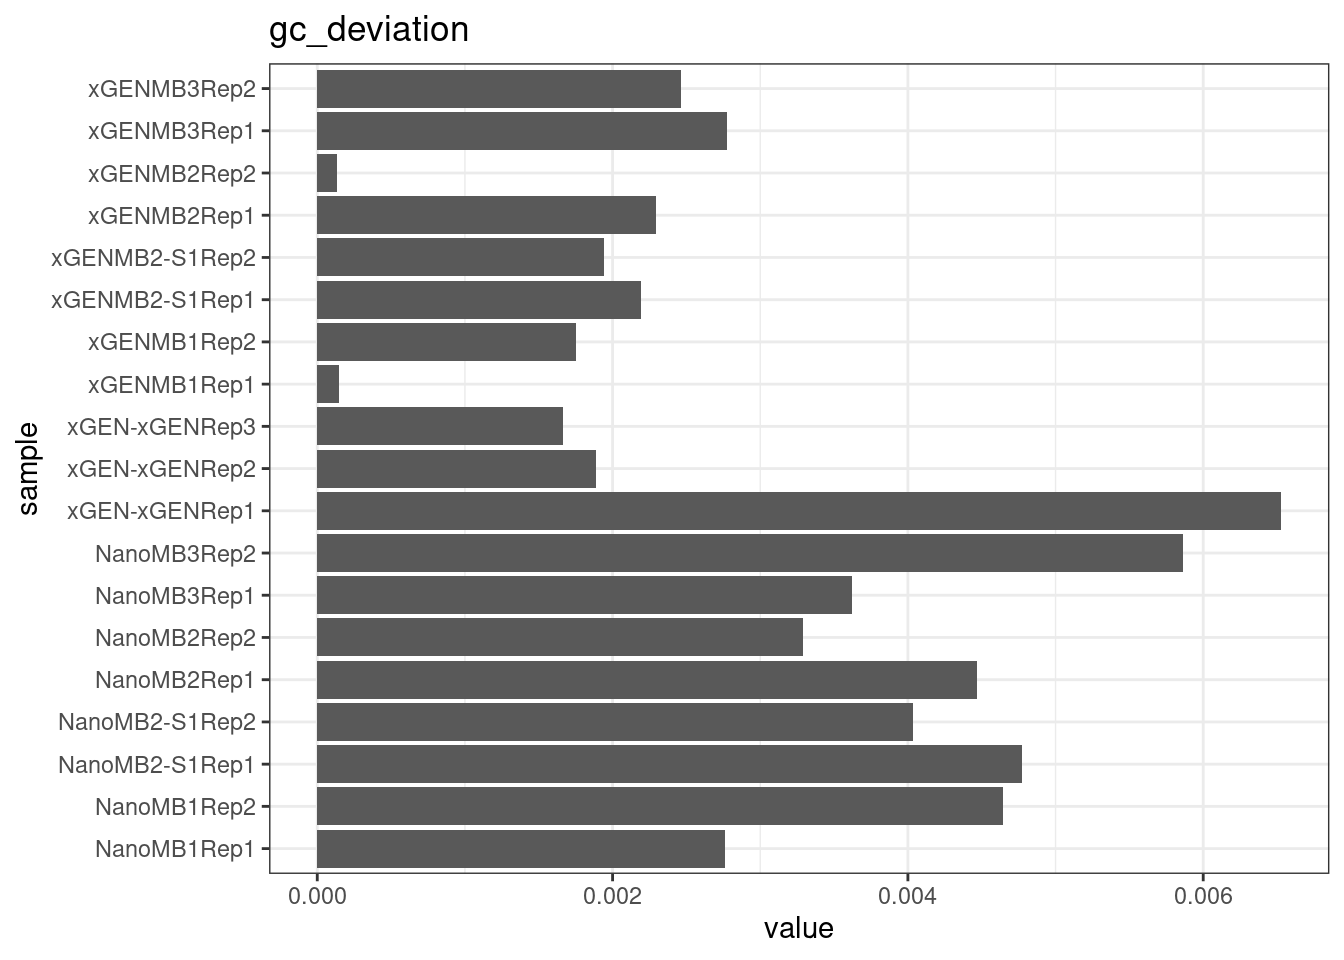
| Version | Author | Date |
|---|---|---|
| e1c0c28 | Marek Cmero | 2022-09-06 |
| faf9130 | Marek Cmero | 2022-05-18 |
| 4da2244 | Marek Cmero | 2022-05-11 |
| cc380cc | Marek Cmero | 2022-05-11 |
| 7c4f403 | Marek Cmero | 2022-04-25 |
| fcb6578 | Marek Cmero | 2022-04-11 |
| a2f0a4a | Marek Cmero | 2022-04-08 |
| c246dc2 | Marek Cmero | 2022-04-07 |
| a860101 | Marek Cmero | 2022-04-06 |
| 81272b2 | Marek Cmero | 2022-04-05 |
| f13e13a | Marek Cmero | 2022-04-05 |
| def2130 | Marek Cmero | 2022-04-05 |
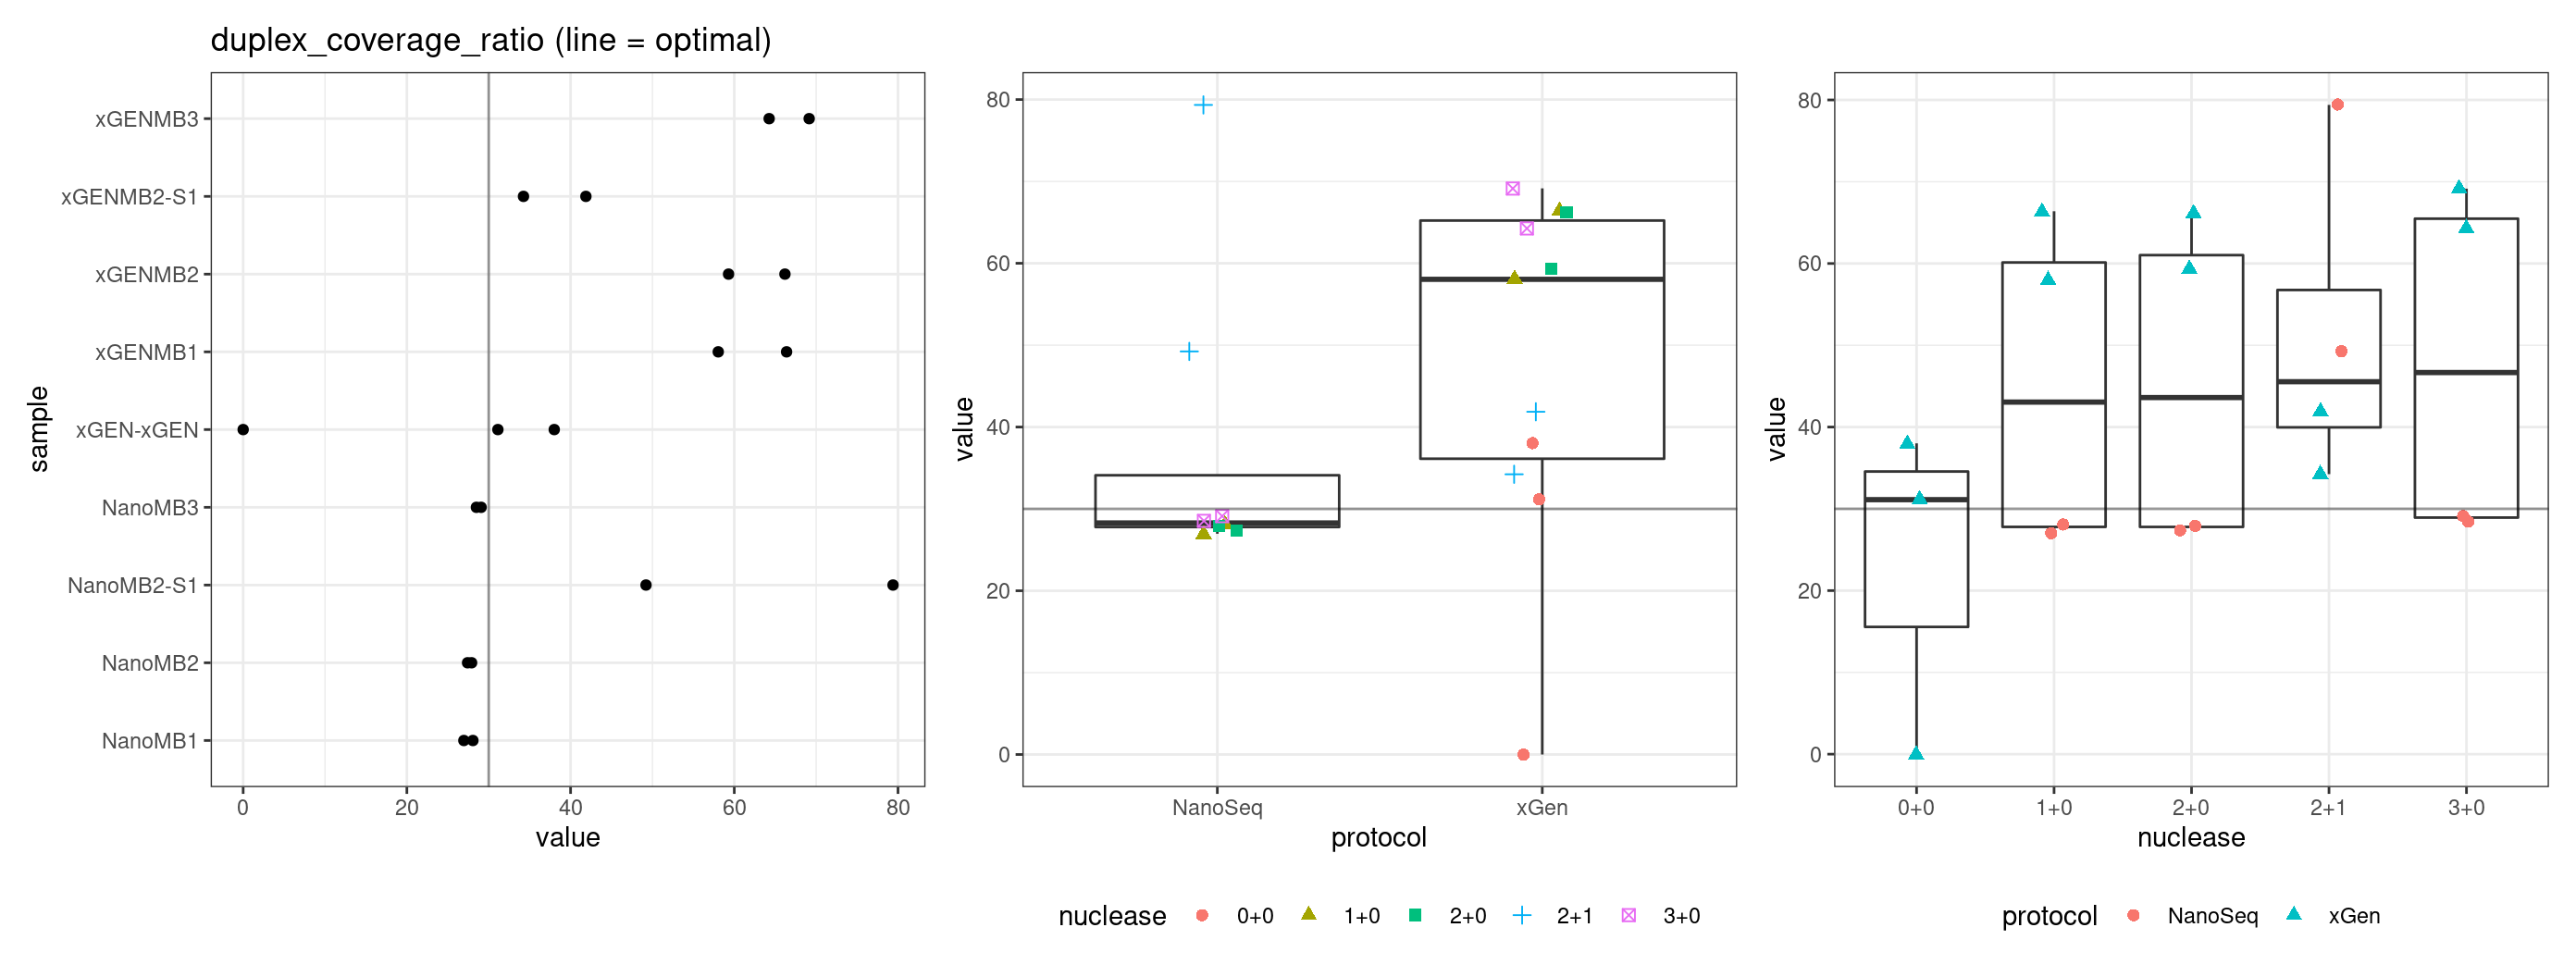
Duplex Coverage ratio
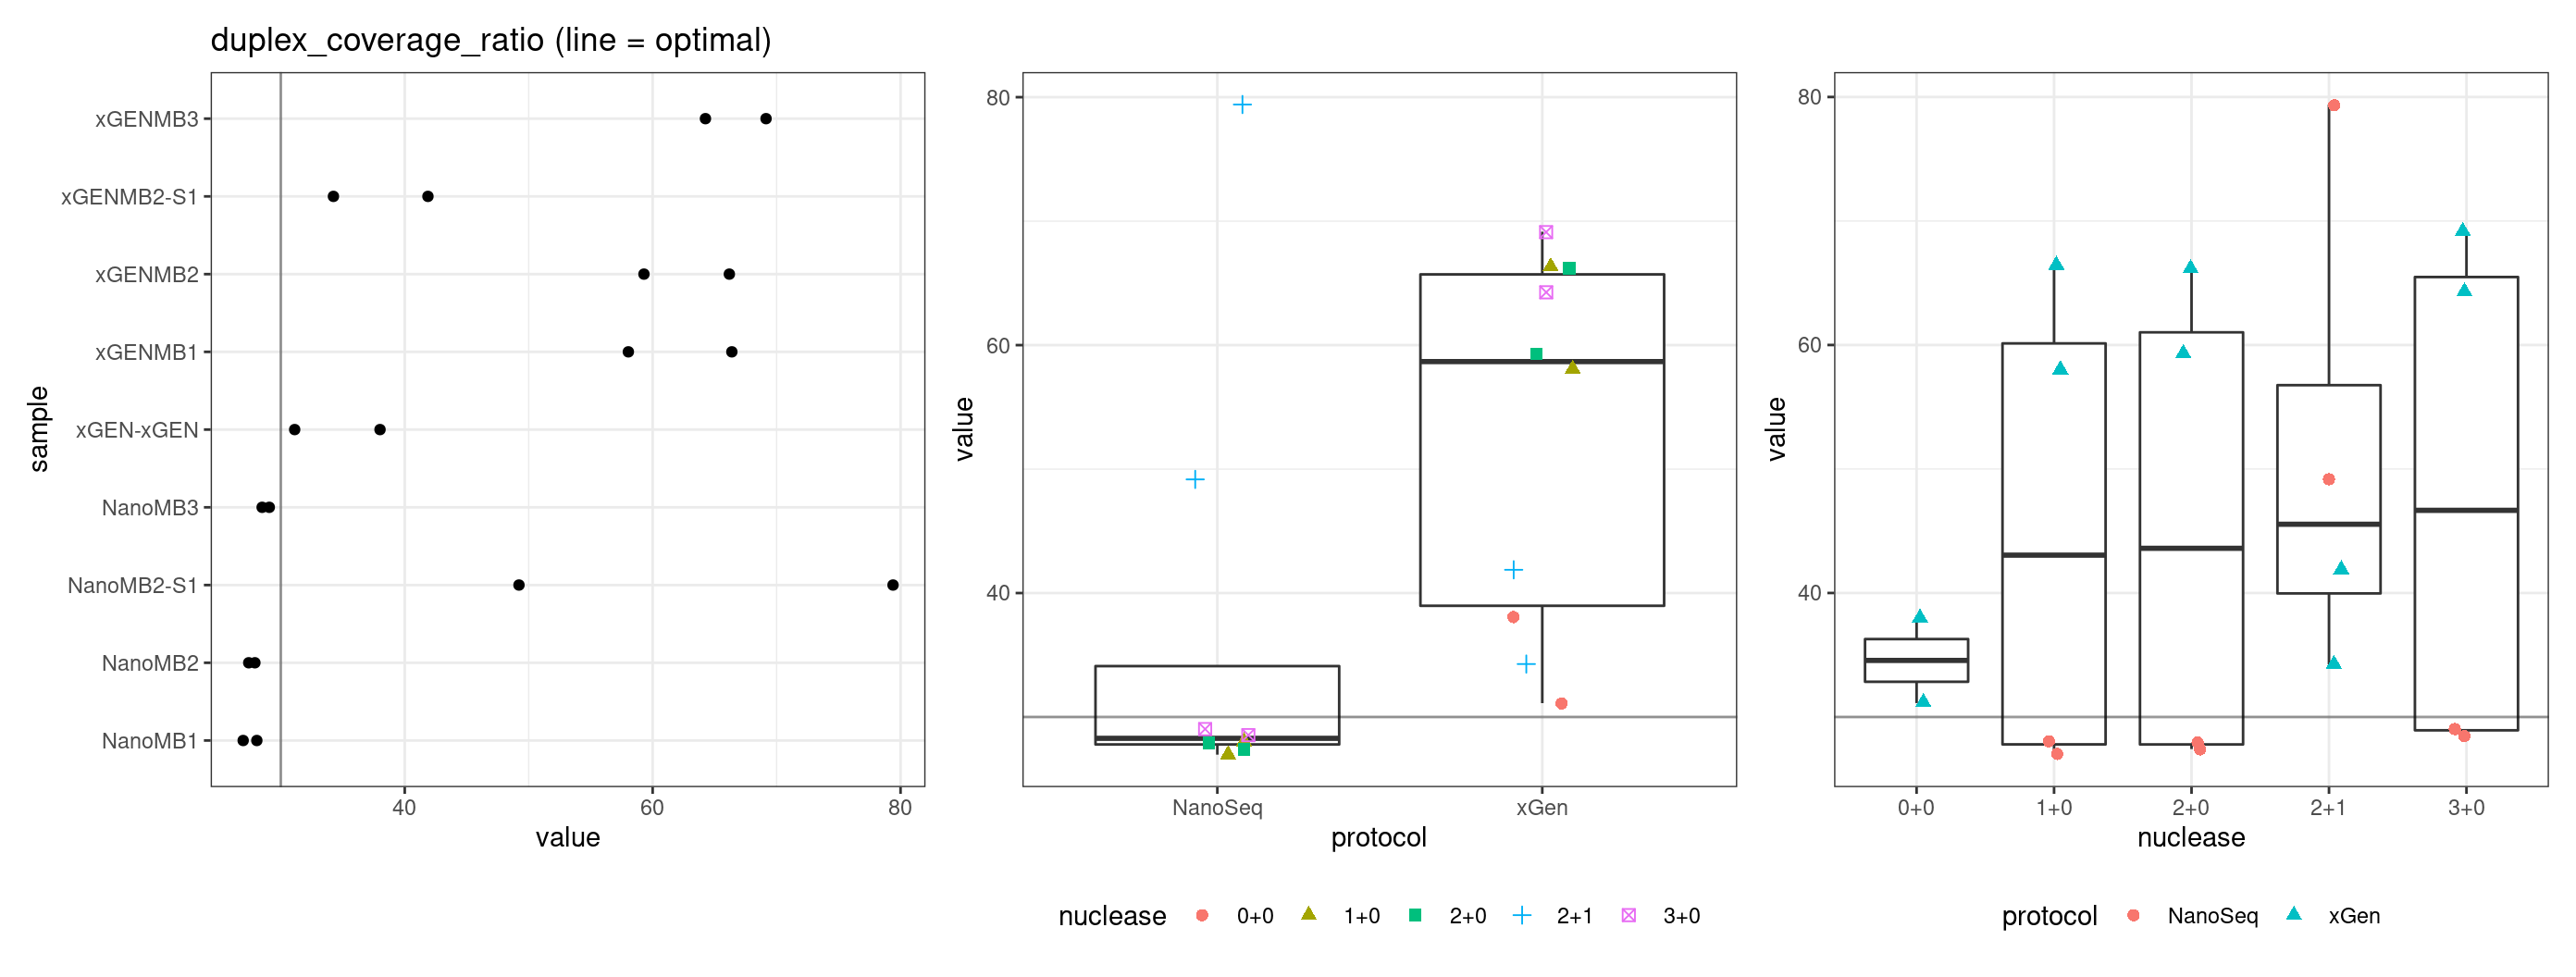
The mean sequence (pre-duplex) coverage divided by mean duplex coverage. Indicates the yield of how much duplex coverage we get at each sample’s sequence coverage. Abascal et al. report that their yield was approximately 30x (marked on the plot).
metric <- 'duplex_coverage_ratio'
ggplot(mm[mm$metric == metric,], aes(sample, value)) +
        geom_histogram(stat = 'identity', position = 'dodge') +
        theme_bw() +
        coord_flip() +
        geom_hline(yintercept = 30, alpha = 0.4)  +
        ggtitle(metric)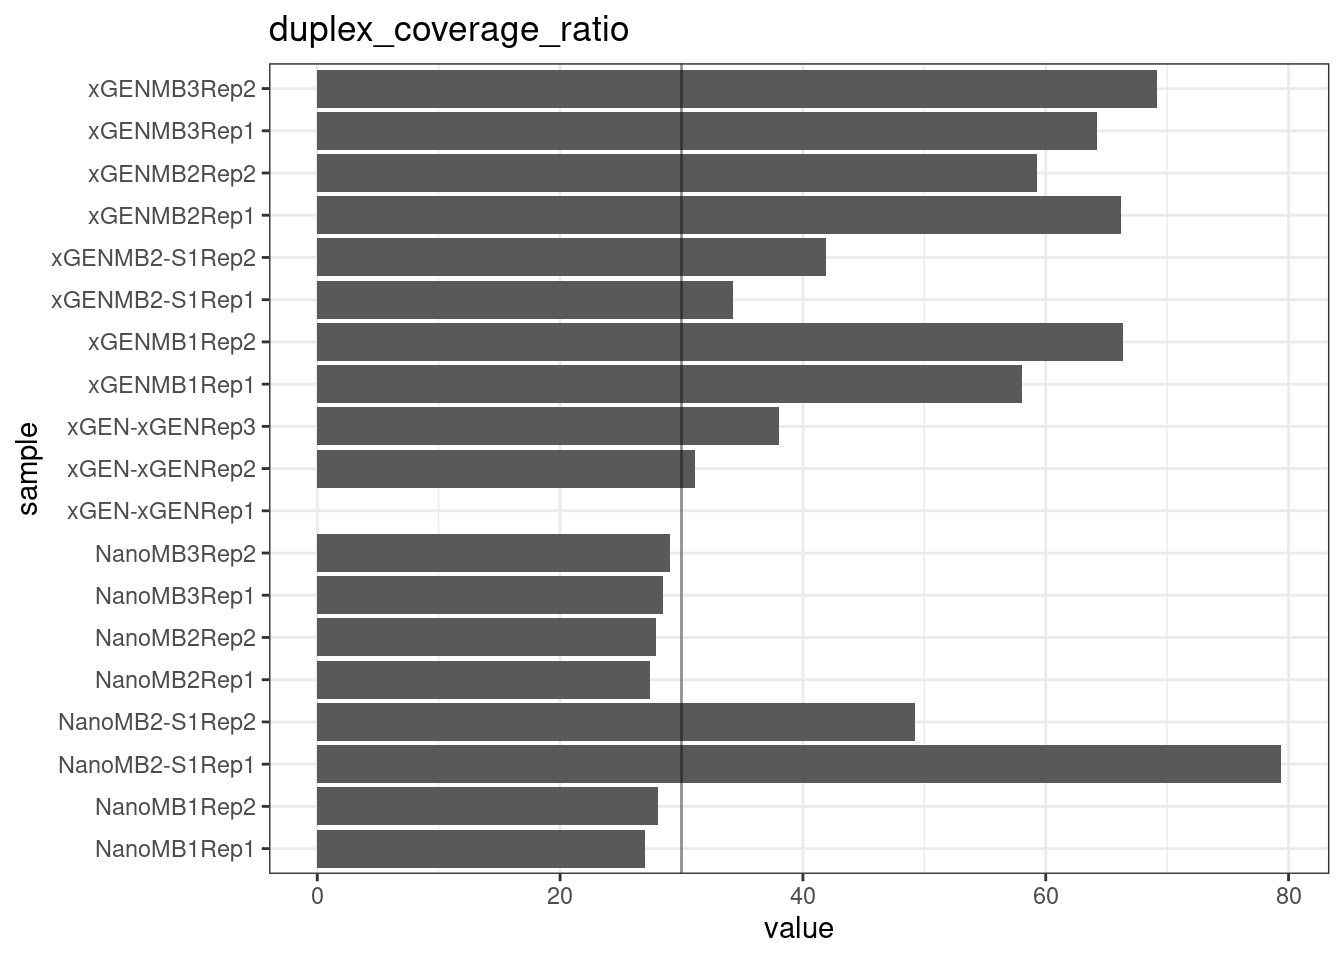
Family statistics
Comparison of family pair sizes between samples (these are calculated from total reads of paired AB and BA families).
ggplot(mm[mm$metric %like% 'family', ], aes(value, sample, colour = metric)) +
        geom_point() +
        coord_trans(x='log2') +
        scale_x_continuous(breaks=seq(0, 94, 8)) +
        theme(axis.text.x = element_text(size=5)) +
        theme_bw() +
        ggtitle('Family pair sizes')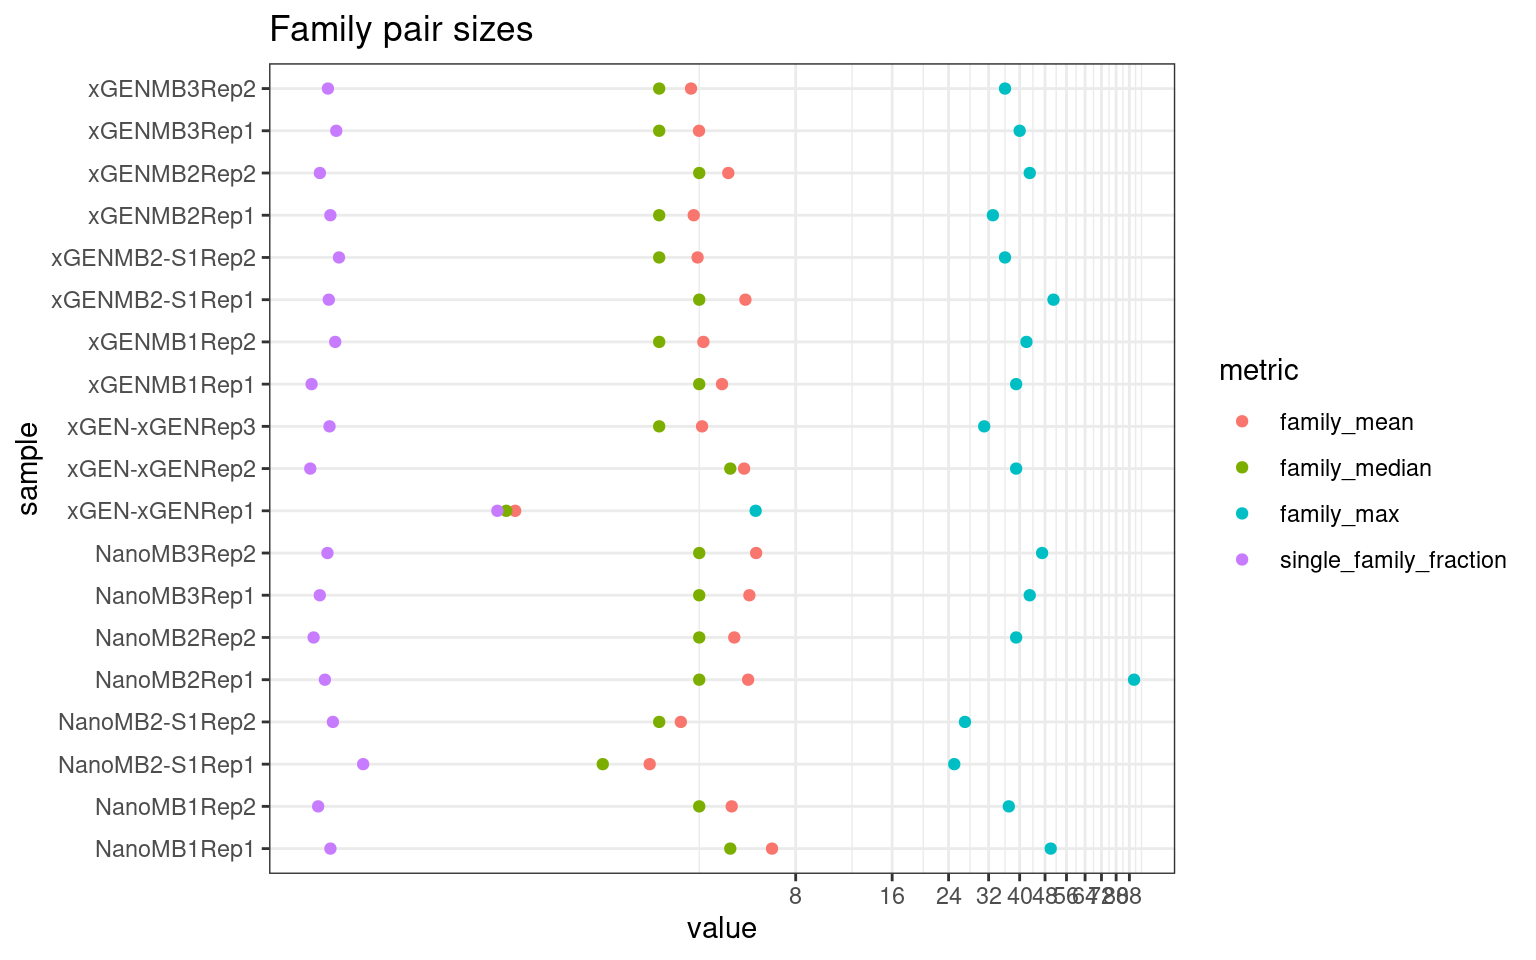
The following plot shows:
- families_gt1: number of family pairs where at least one family (AB or BA) has > 1 reads.
- single_families: number of single-read families.
- paired_families: number of family pairs where both families (AB and BA) have > 0 reads.
- paired_and_gt1: number of family pairs where both families (AB and BA) have > 1 reads.
tmp <- data.table(mm)[,list(meanval = mean(value), minval = min(value), maxval= max(value)), by=c('sample', 'metric')] %>% data.frame()
tmp <- left_join(mm, tmp, by = c('sample', 'metric'))

ggplot(tmp[tmp$metric %like% 'pair|gt1|single_families', ], aes(sample, meanval, fill = metric)) +
        geom_bar(stat='identity', position='dodge') +
        geom_errorbar( aes(x = sample, ymin = minval, ymax = maxval), position = 'dodge', colour = 'grey') +
        theme_bw() +
        coord_flip() +
        scale_fill_brewer(palette = 'Dark2') +
        theme(legend.position = 'right')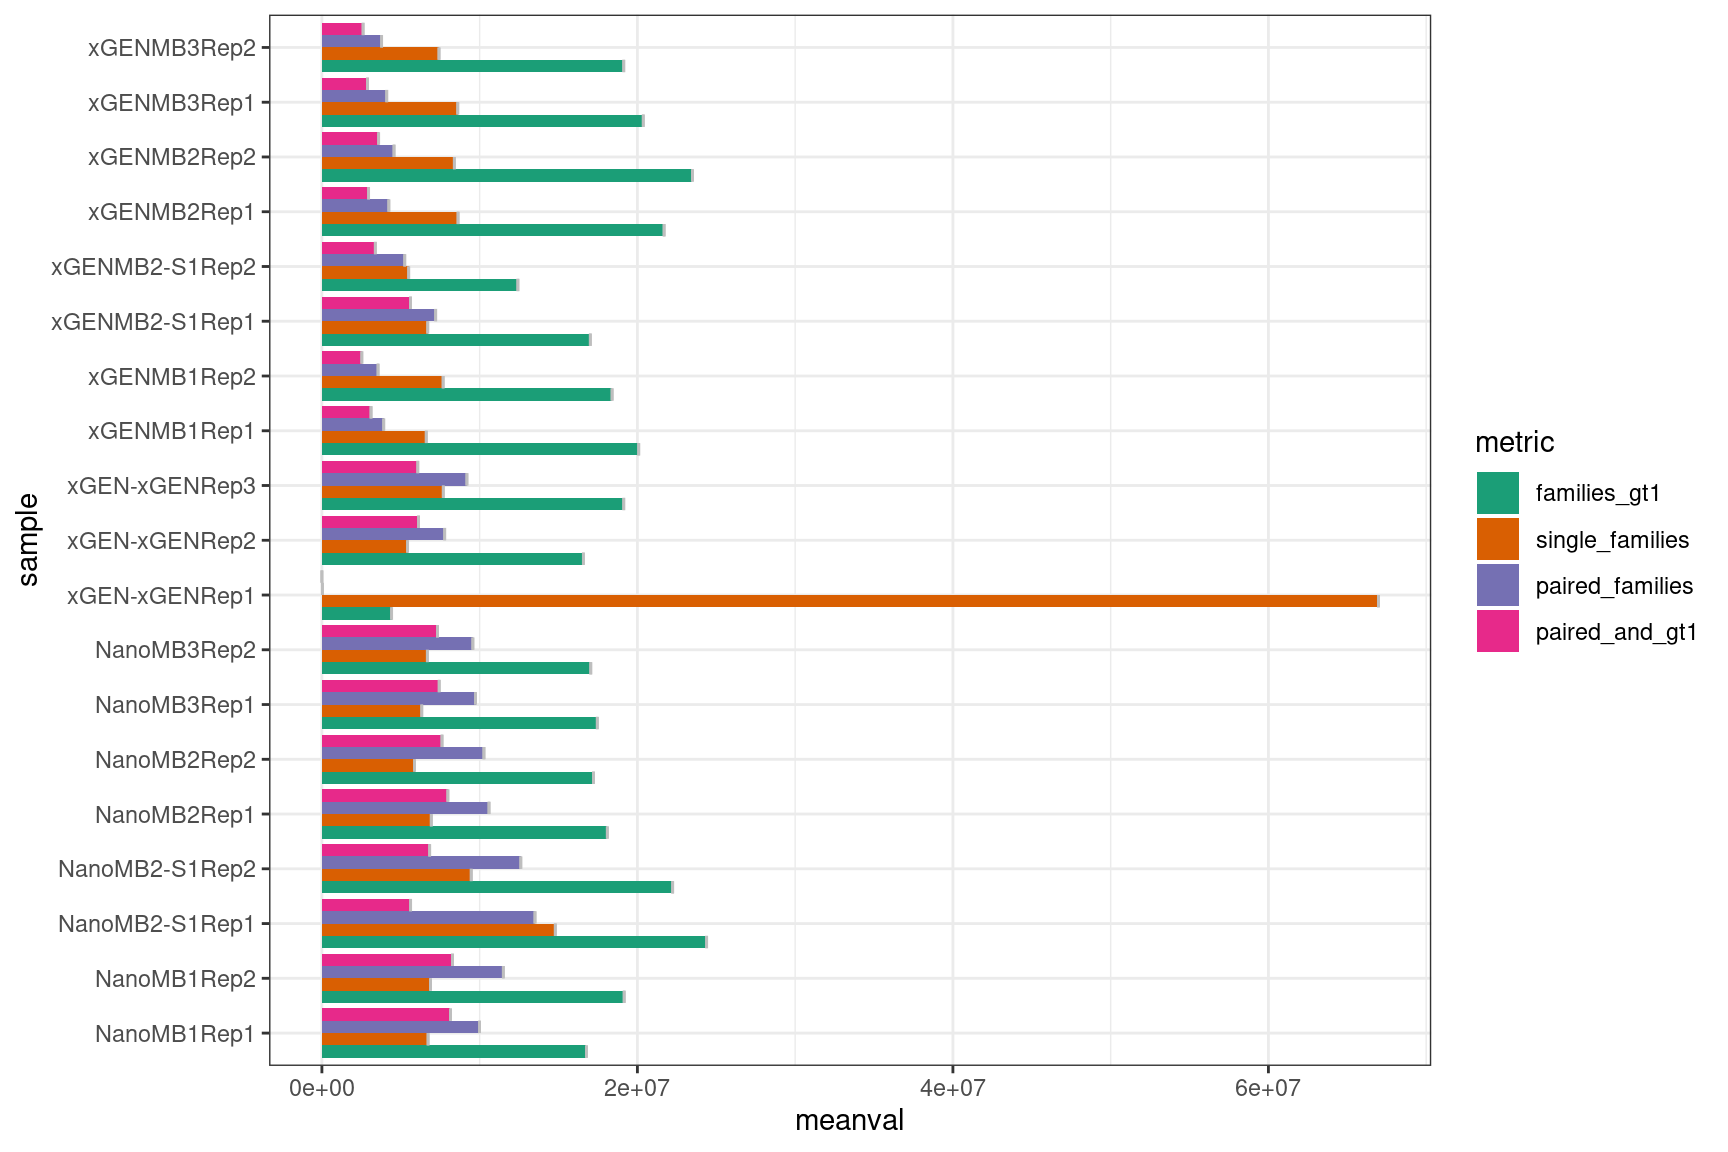
Compare metrics side-by-side
Compare protocols and nucleases directly, the first plot includes the outlier sample and the second removes it.
metric_optimals <- list('duplicate_rate' = 0.81,
                        'frac_singletons' = 0,
                        'drop_out_rate' = c(0.1, 0.3),
                        'efficiency' = 0.07,
                        'gc_deviation' = 0,
                        'duplex_coverage_ratio' = 30)

gg_prot <- list(geom_boxplot(outlier.shape = NA),
                geom_jitter(width = 0.1, size = 2, aes(colour = nuclease, shape = nuclease)),
                theme_bw(),
                theme(legend.position = 'bottom'))
gg_nuc <- list(geom_boxplot(outlier.shape = NA),
               geom_jitter(width = 0.1, size = 2, aes(colour = protocol, shape = protocol)),
               theme_bw(),
               theme(legend.position = 'bottom'))

mmt <- mm
mmt$replicate <- str_split(mmt$sample, 'Rep') %>% lapply(., dplyr::last) %>% unlist() %>% as.numeric()
mmt$sample <- str_split(mmt$sample, 'Rep') %>% lapply(., dplyr::first) %>% unlist()

for(metric in names(metric_optimals)) {
    # plot all samples
    threshold <- metric_optimals[metric][[1]]
    tmp <- mmt[mmt$metric %in% metric,]
    p1 <- ggplot(tmp, aes(sample, value)) +
        geom_point() +
        theme_bw() +
        coord_flip() +
        geom_hline(yintercept = threshold, alpha = 0.4) +
        ggtitle(paste(metric, '(line = optimal)'))

    p2 <- ggplot(tmp, aes(protocol, value)) +
        gg_prot + geom_hline(yintercept = threshold, alpha = 0.4)

    p3 <- ggplot(tmp, aes(nuclease, value)) +
        gg_nuc + geom_hline(yintercept = threshold, alpha = 0.4)

    show(p1 + p2 + p3)

    # repeat with removed outlier
    tmp <- mmt[mmt$metric %in% metric & !(mmt$sample %in% 'xGEN-xGEN' & mmt$replicate == 1),]
    p1 <- ggplot(tmp, aes(sample, value)) +
        geom_point() +
        theme_bw() +
        coord_flip() +
        geom_hline(yintercept = threshold, alpha = 0.4) +
        ggtitle(paste(metric, '(line = optimal)'))

    p2 <- ggplot(tmp, aes(protocol, value)) +
        gg_prot + geom_hline(yintercept = threshold, alpha = 0.4)

    p3 <- ggplot(tmp, aes(nuclease, value)) +
        gg_nuc + geom_hline(yintercept = threshold, alpha = 0.4)

    show(p1 + p2 + p3)
}
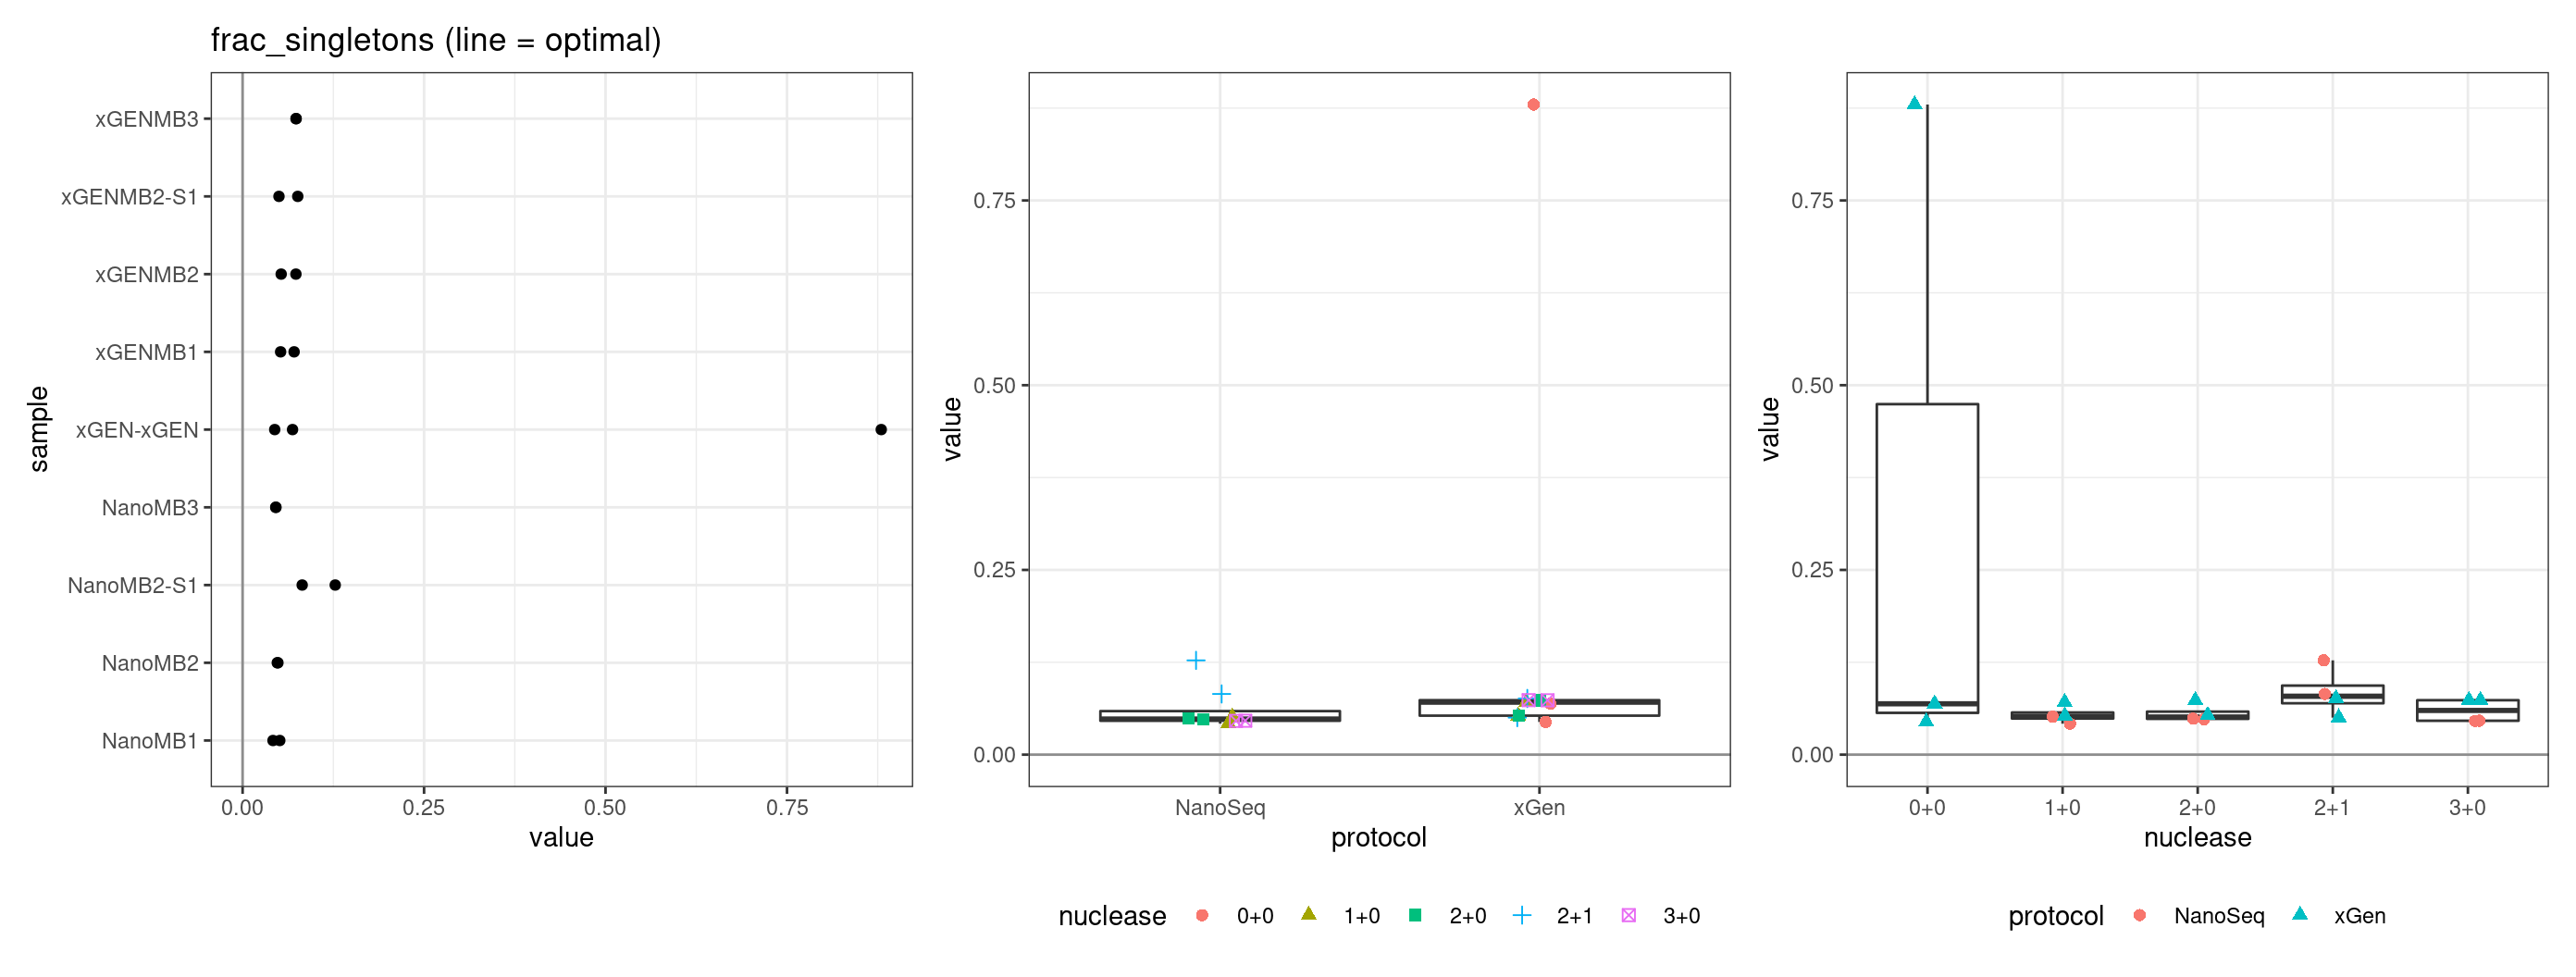

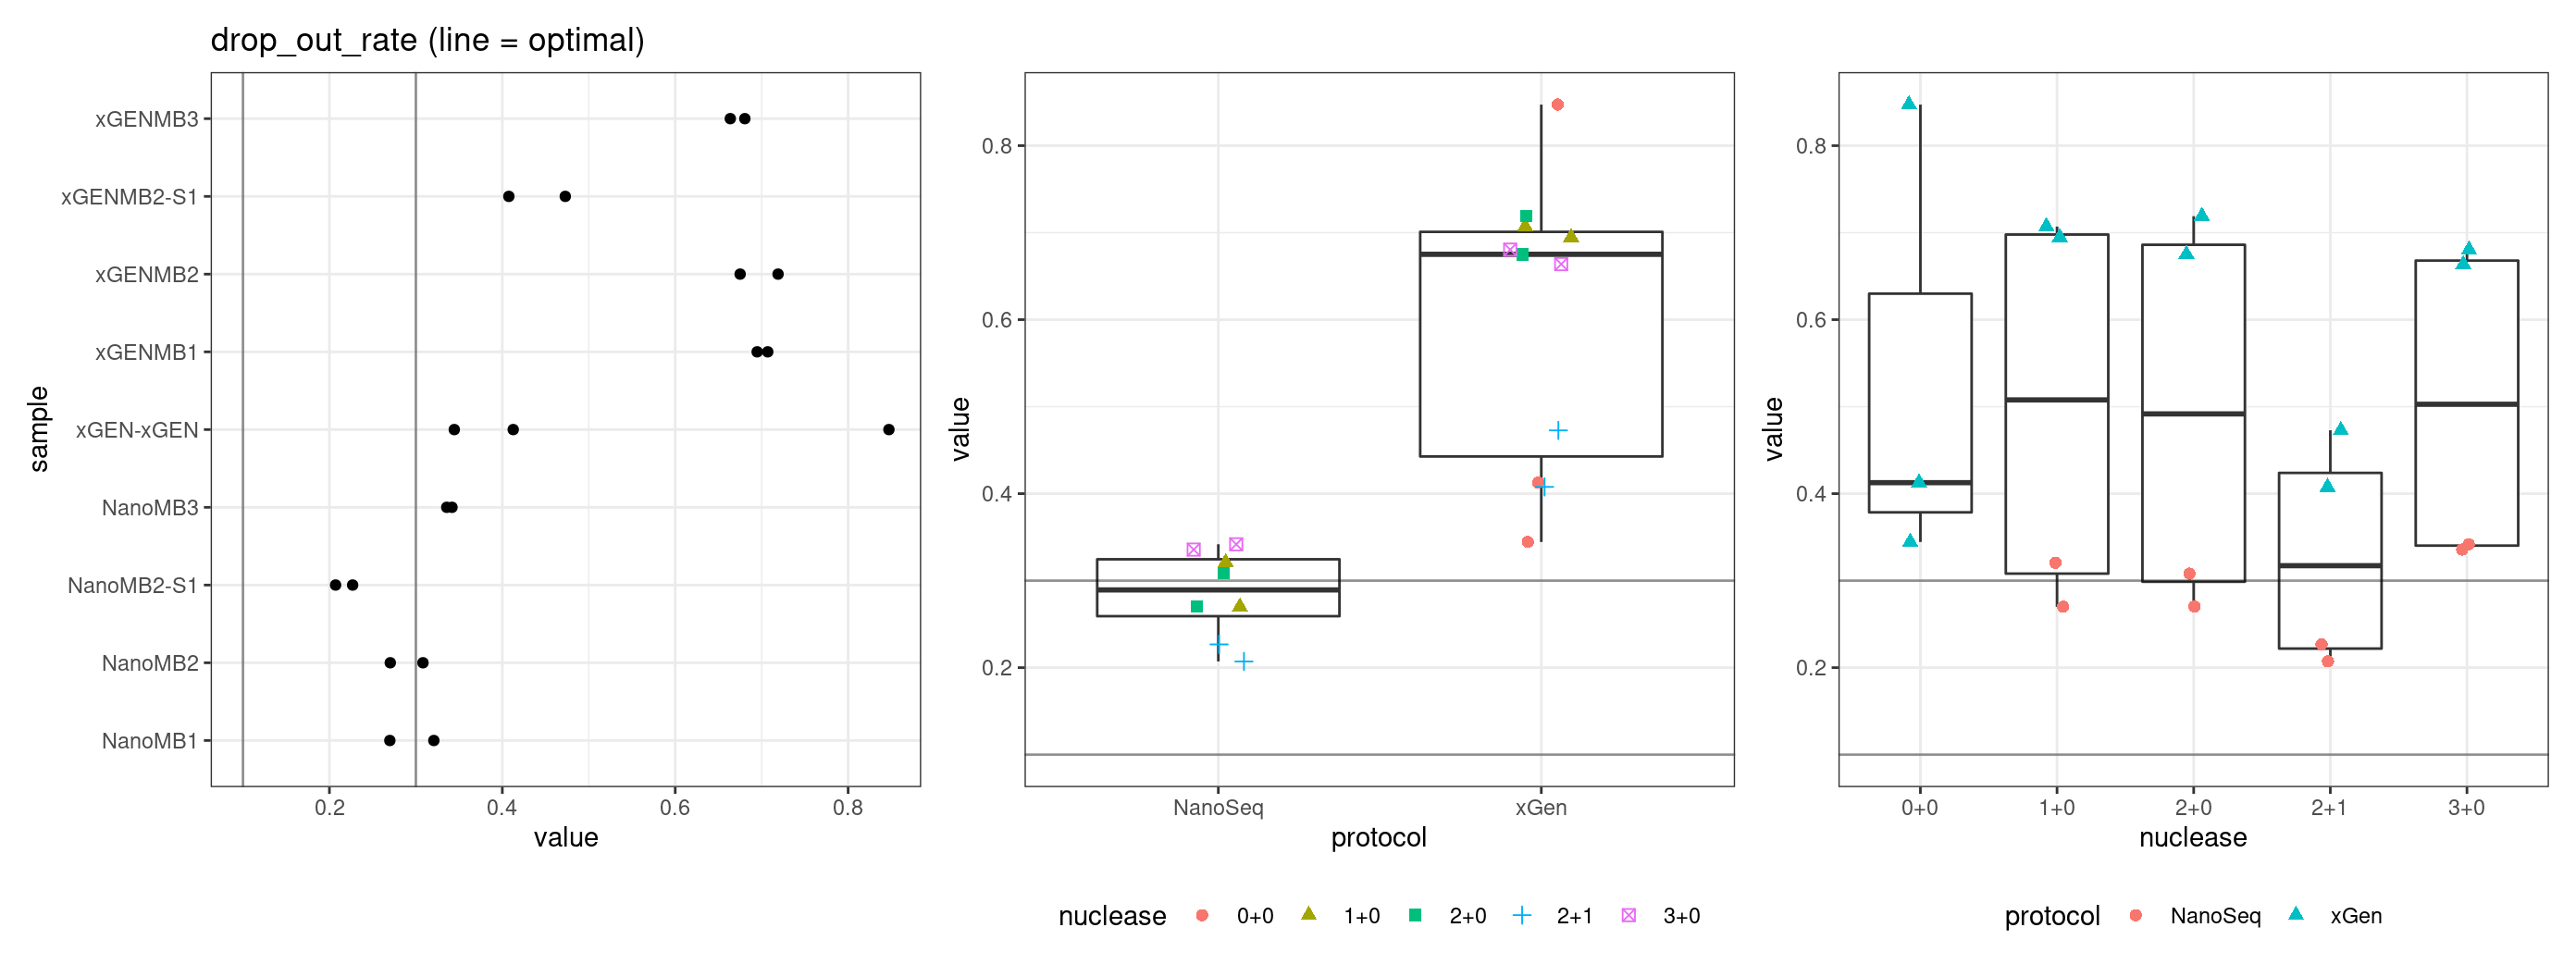
| Version | Author | Date |
|---|---|---|
| 10ee194 | Marek Cmero | 2022-09-08 |
| f4000d4 | Marek Cmero | 2022-09-08 |
| e1c0c28 | Marek Cmero | 2022-09-06 |
| faf9130 | Marek Cmero | 2022-05-18 |
| 4da2244 | Marek Cmero | 2022-05-11 |
| cc380cc | Marek Cmero | 2022-05-11 |
| 7c4f403 | Marek Cmero | 2022-04-25 |
| fcb6578 | Marek Cmero | 2022-04-11 |
| a2f0a4a | Marek Cmero | 2022-04-08 |
| c246dc2 | Marek Cmero | 2022-04-07 |
| a860101 | Marek Cmero | 2022-04-06 |
| 81272b2 | Marek Cmero | 2022-04-05 |
| f13e13a | Marek Cmero | 2022-04-05 |
| def2130 | Marek Cmero | 2022-04-05 |
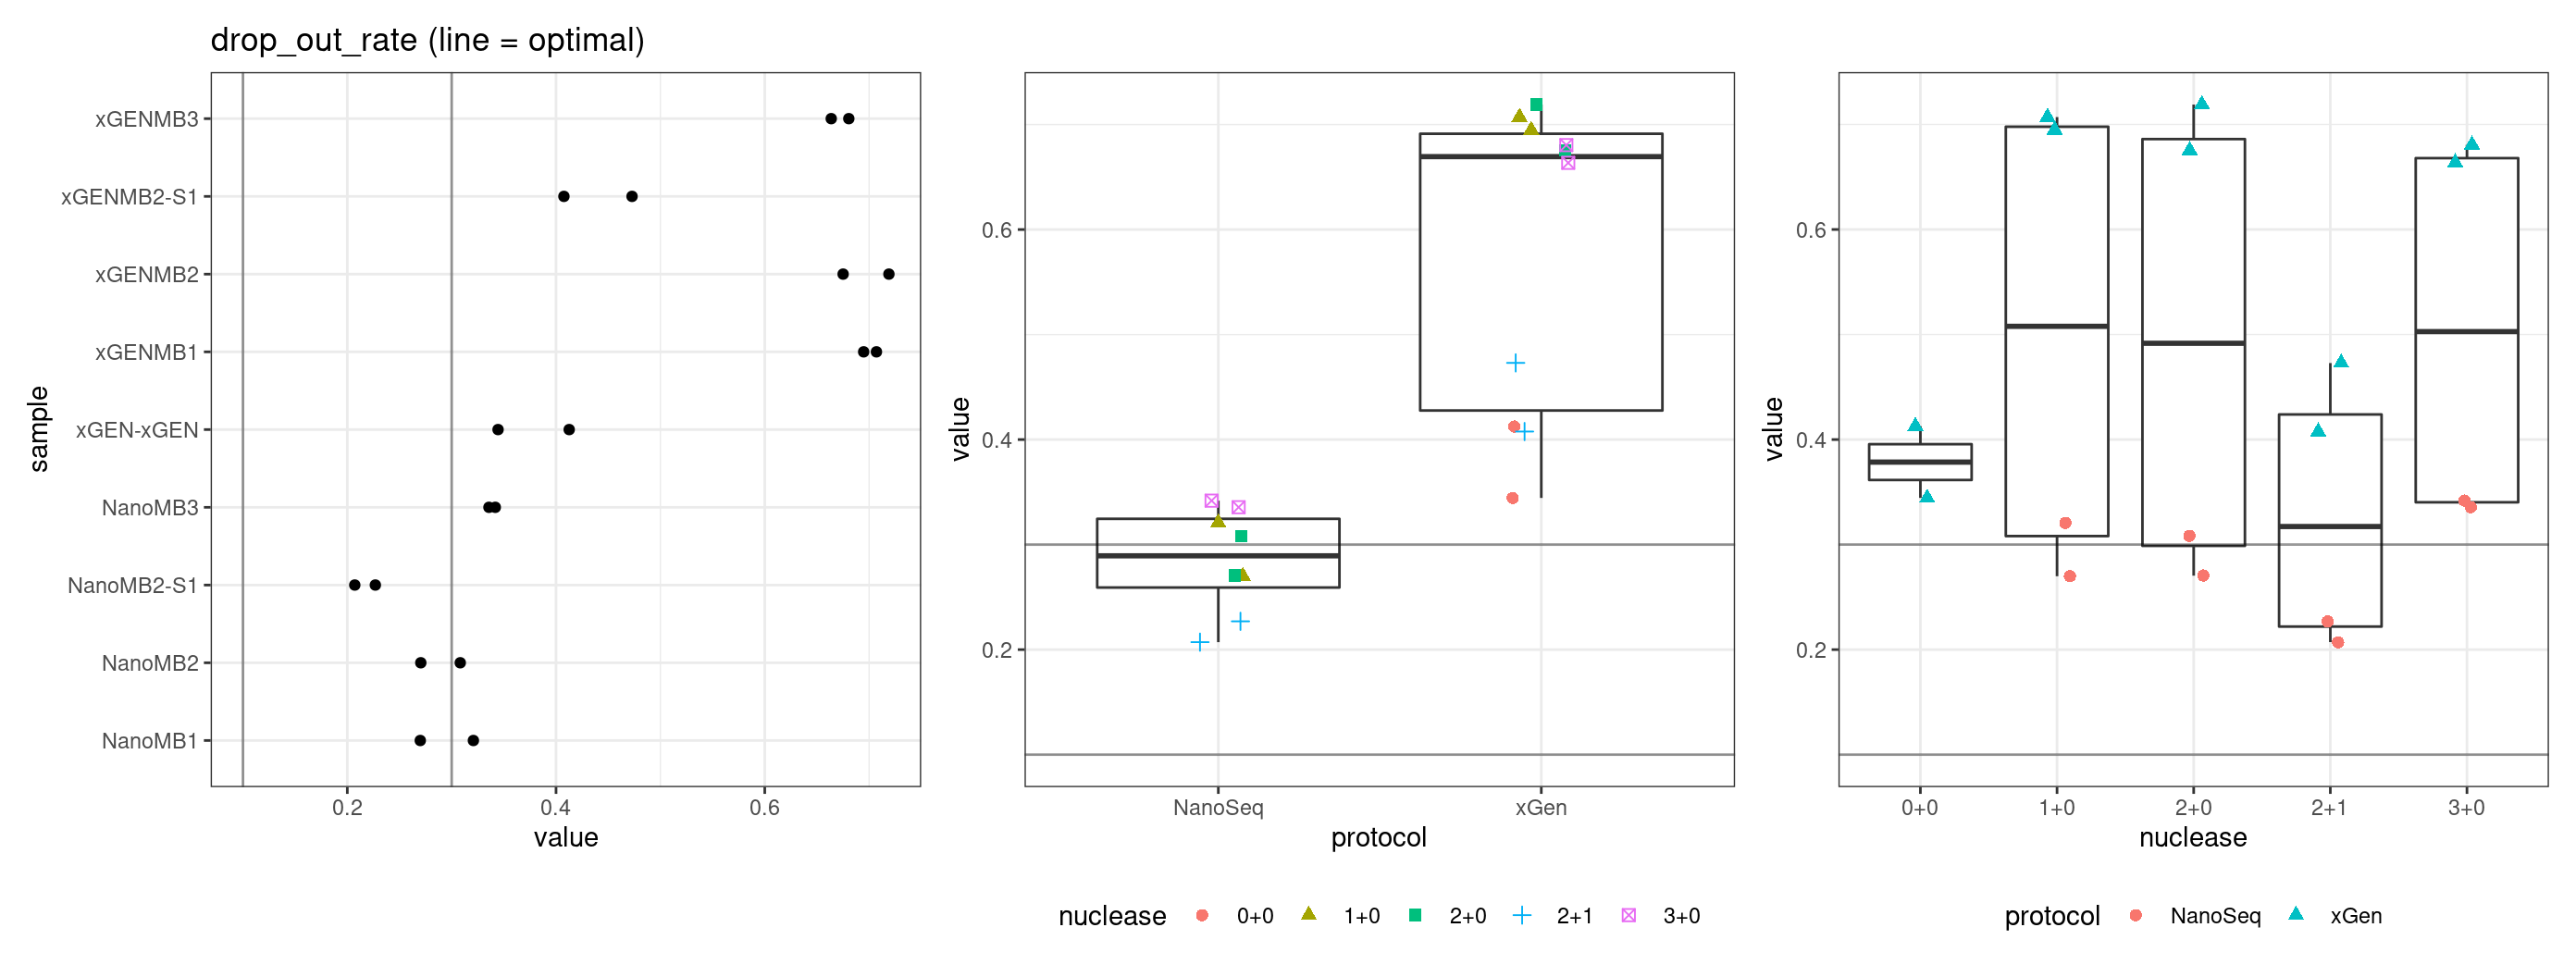
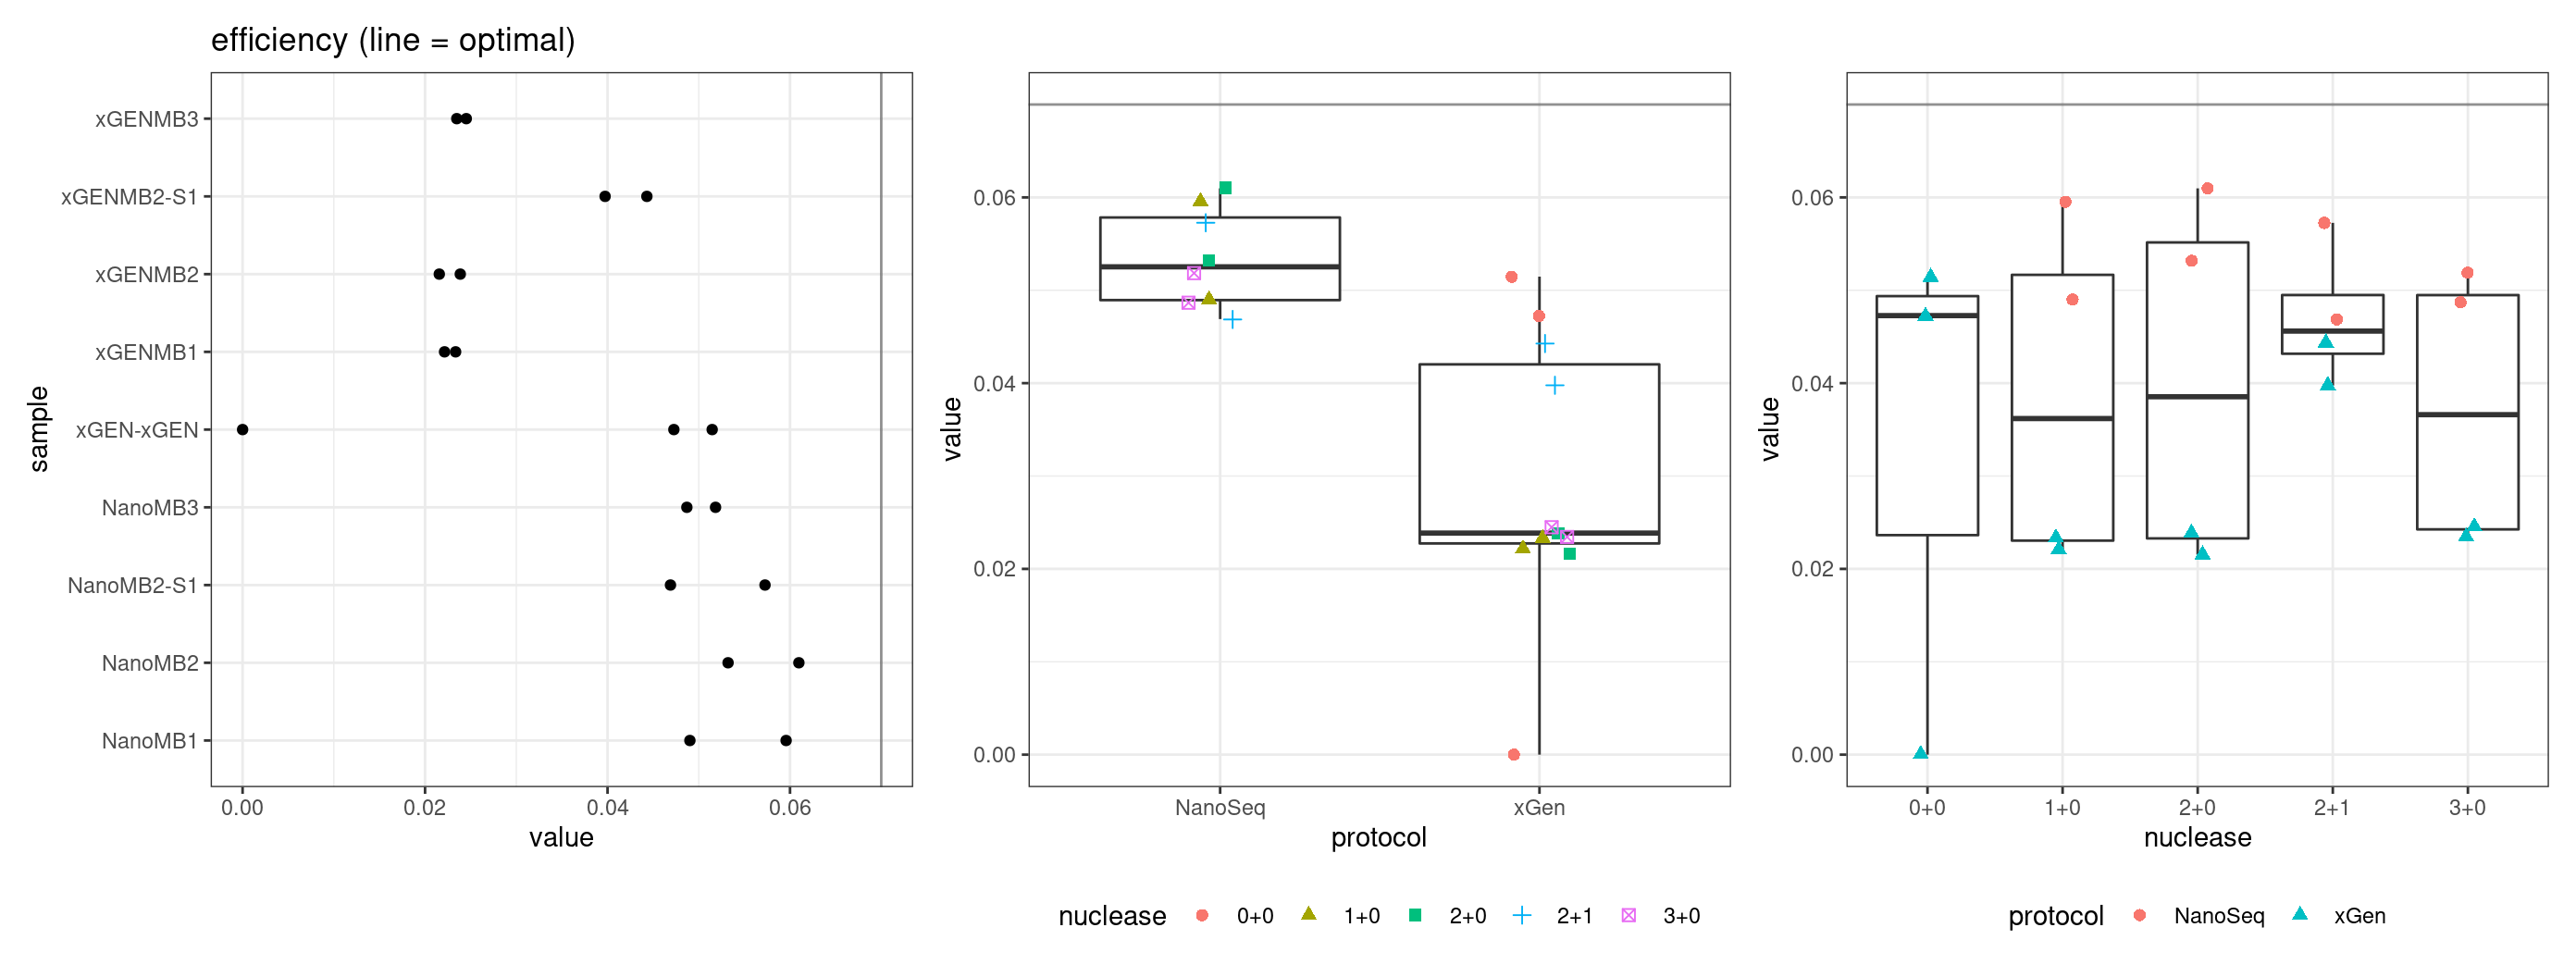
Facet summary plots
Facet boxplots by nuclease and protocol to show overall results.
ggplot(mm, aes(protocol, value)) +
    geom_boxplot() +
    theme_bw() +
    facet_wrap(~metric, scales = 'free') +
    ggtitle('by protocol')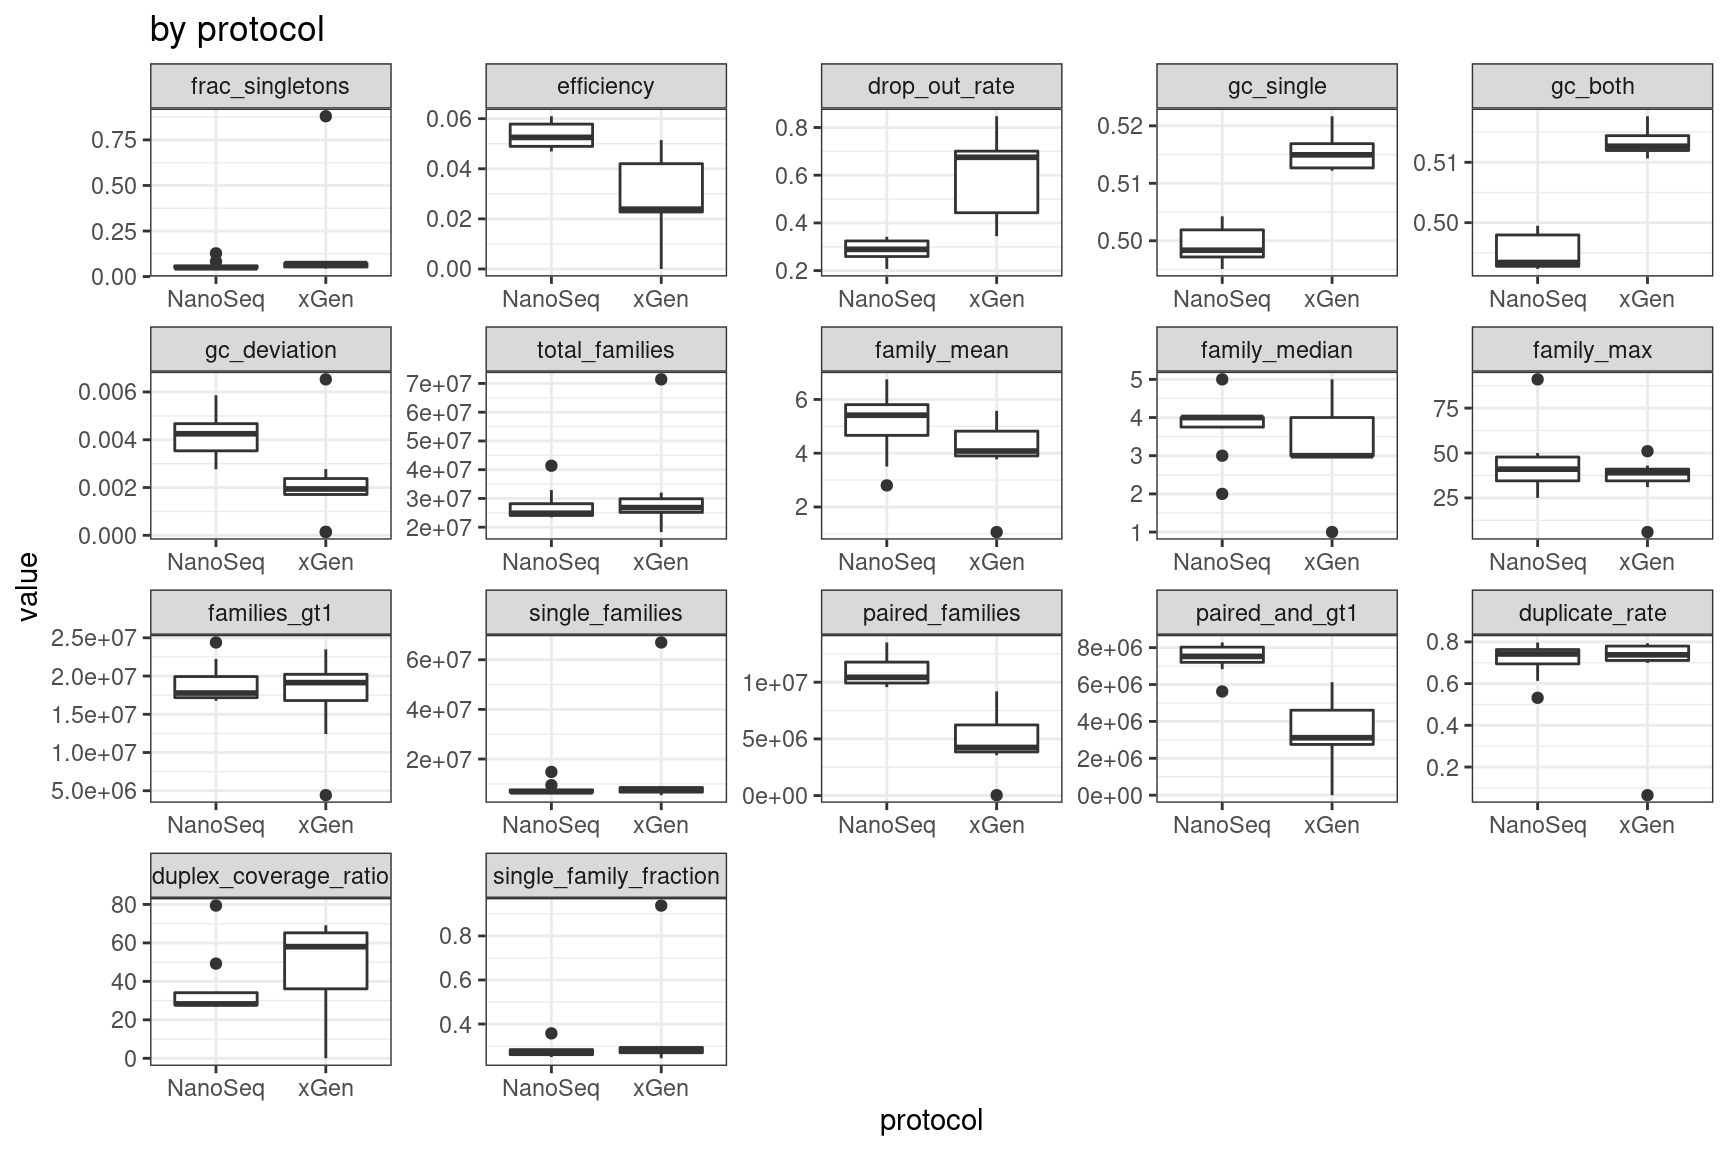
ggplot(mm, aes(nuclease, value)) +
    geom_boxplot() +
    theme_bw() +
    facet_wrap(~metric, scales = 'free') +
    ggtitle('by nuclease')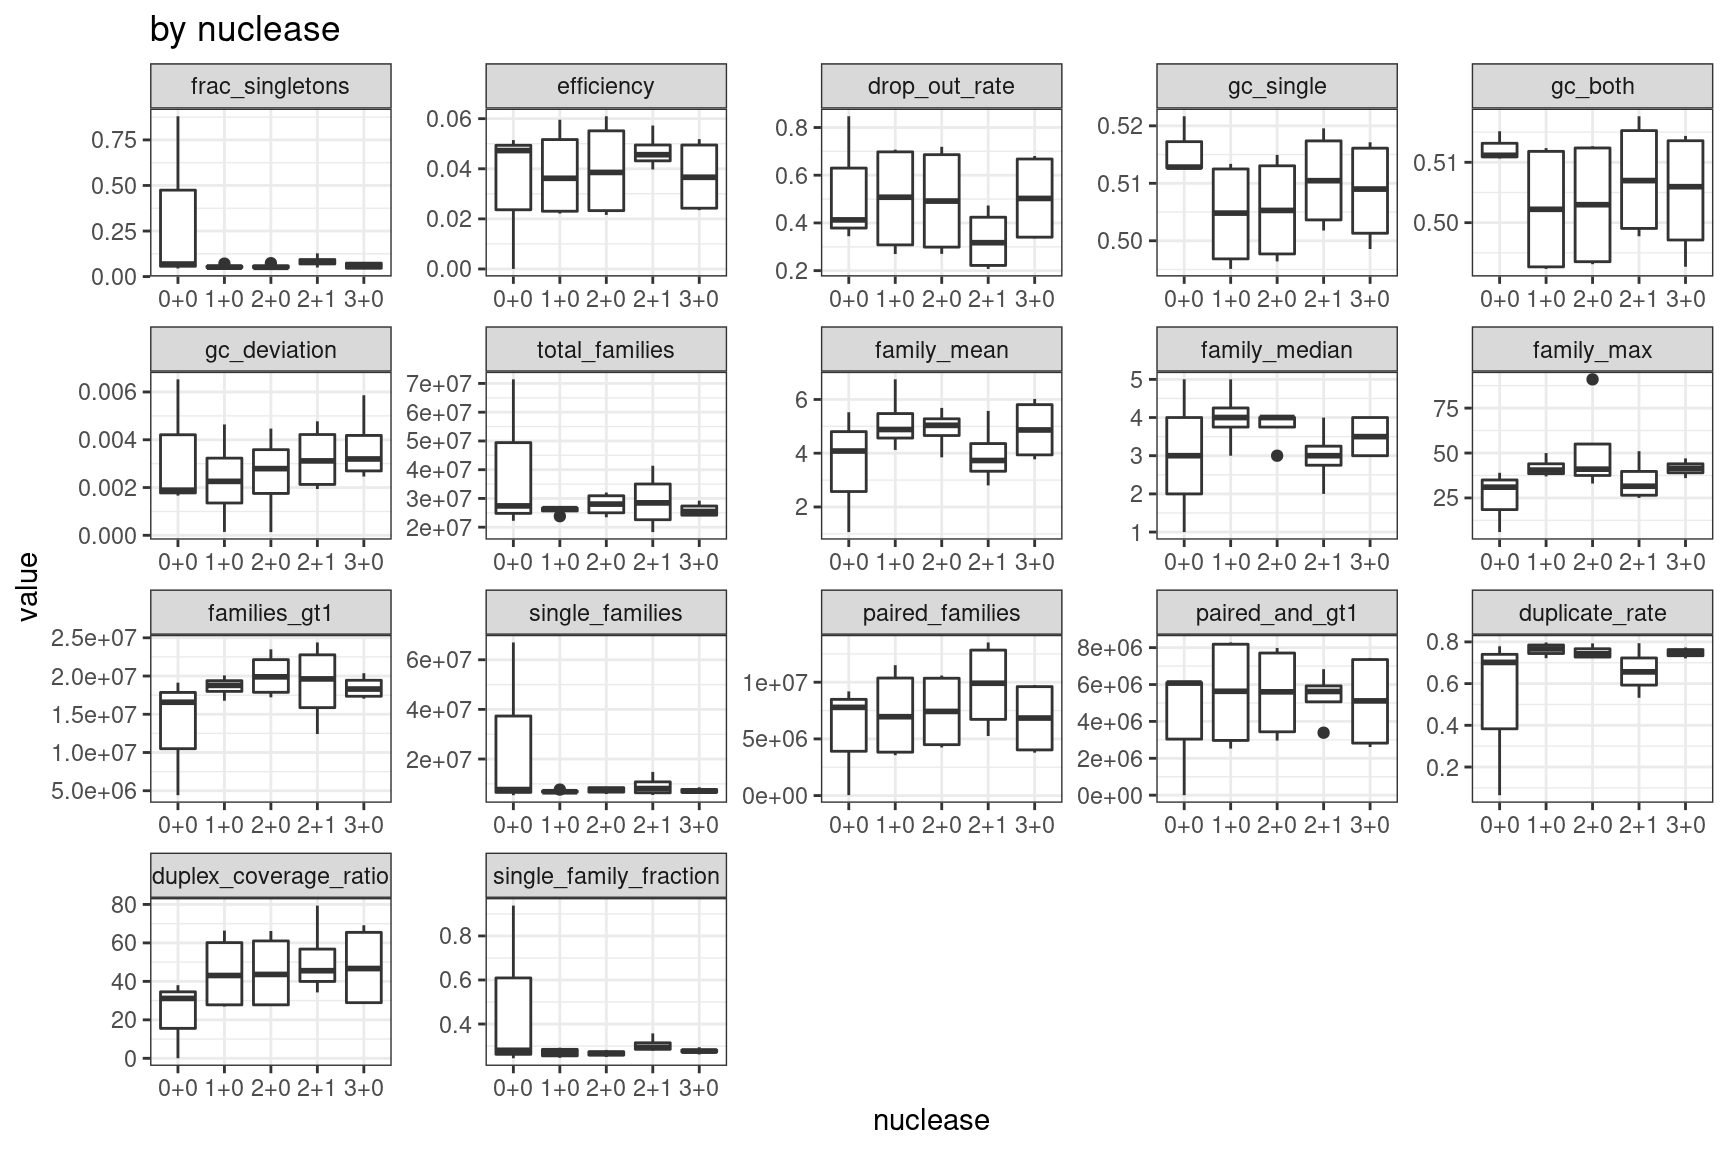
Plots again removing the outlier xGEN rep 1.
mmo <- mm[mm$sample != 'xGEN-xGENRep1',]
mmo$replicate <- str_split(mmo$sample, 'Rep') %>% lapply(., dplyr::last) %>% unlist() %>% as.numeric()
mmo$sample <- str_split(mmo$sample, 'Rep') %>% lapply(., dplyr::first) %>% unlist()

ggplot(mmo, aes(protocol, value)) +
    geom_boxplot() +
    theme_bw() +
    facet_wrap(~metric, scales = 'free') +
    ggtitle('by protocol')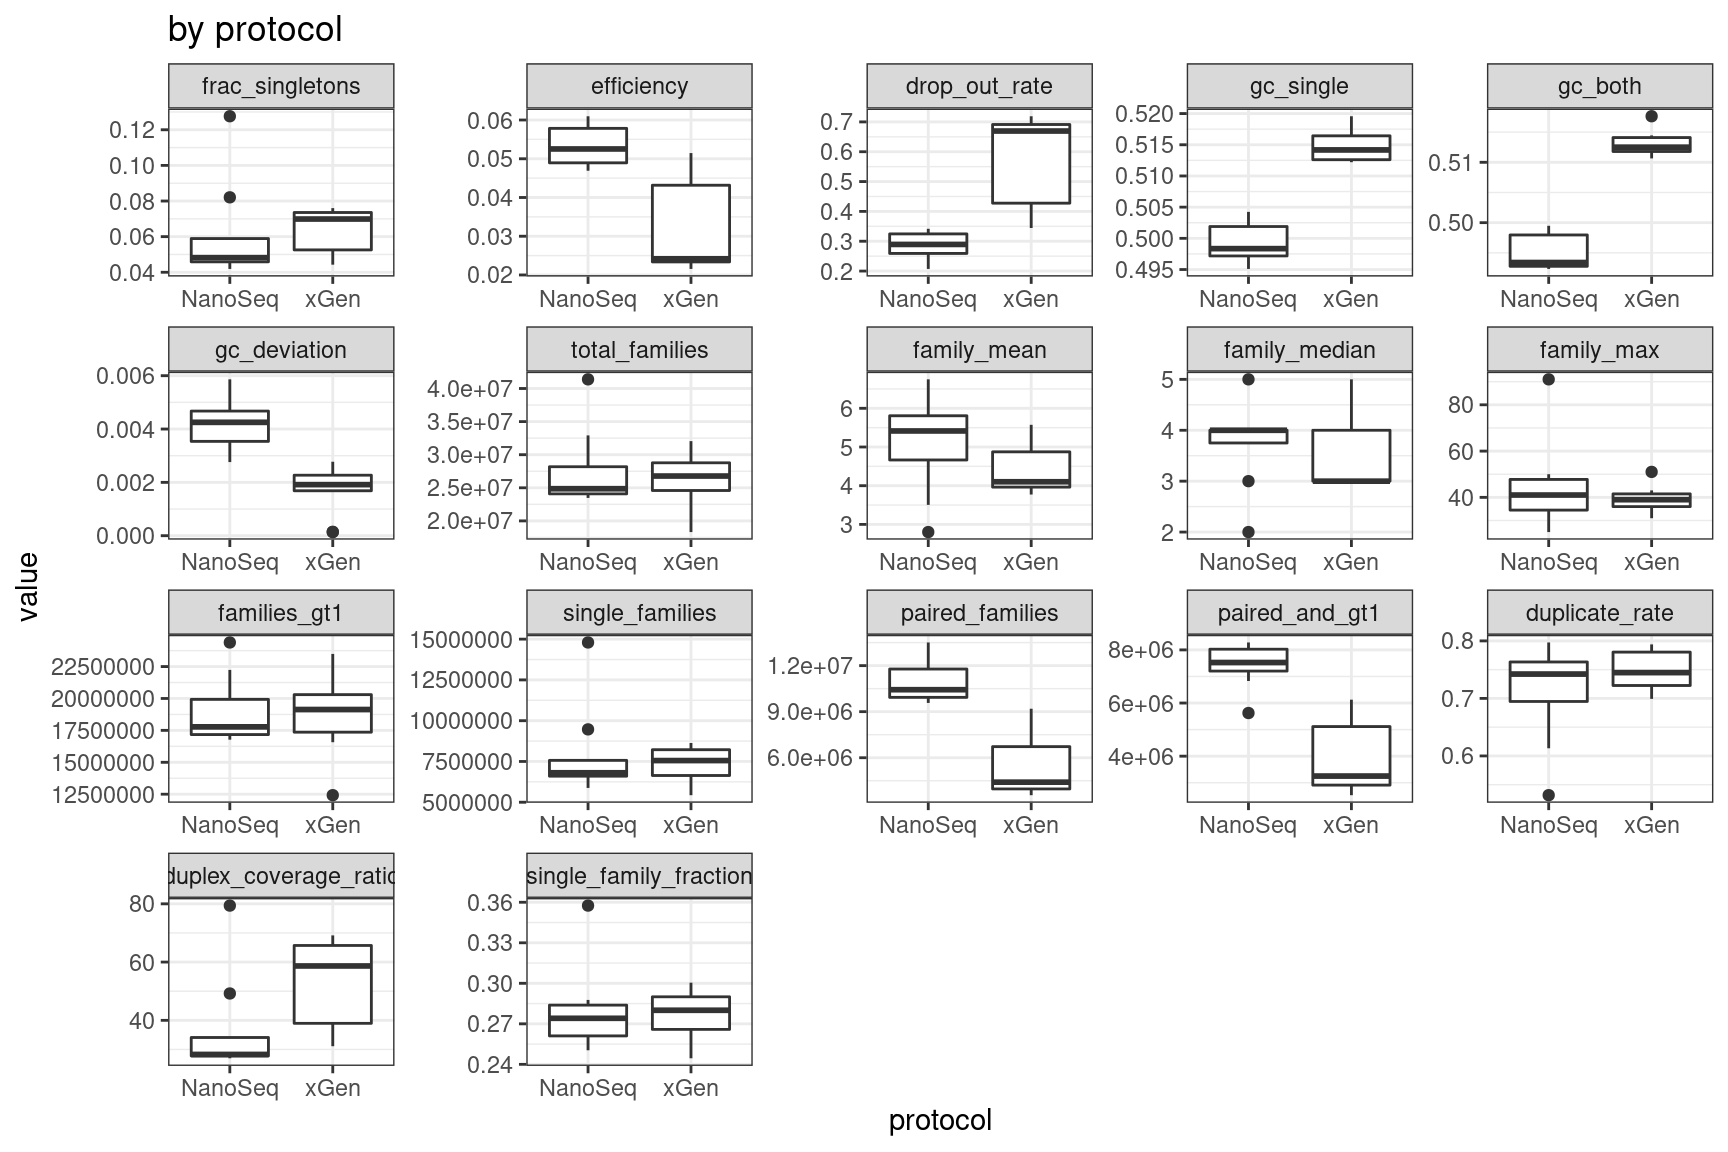
ggplot(mmo, aes(nuclease, value)) +
    geom_boxplot() +
    theme_bw() +
    facet_wrap(~metric, scales = 'free') +
    ggtitle('by nuclease')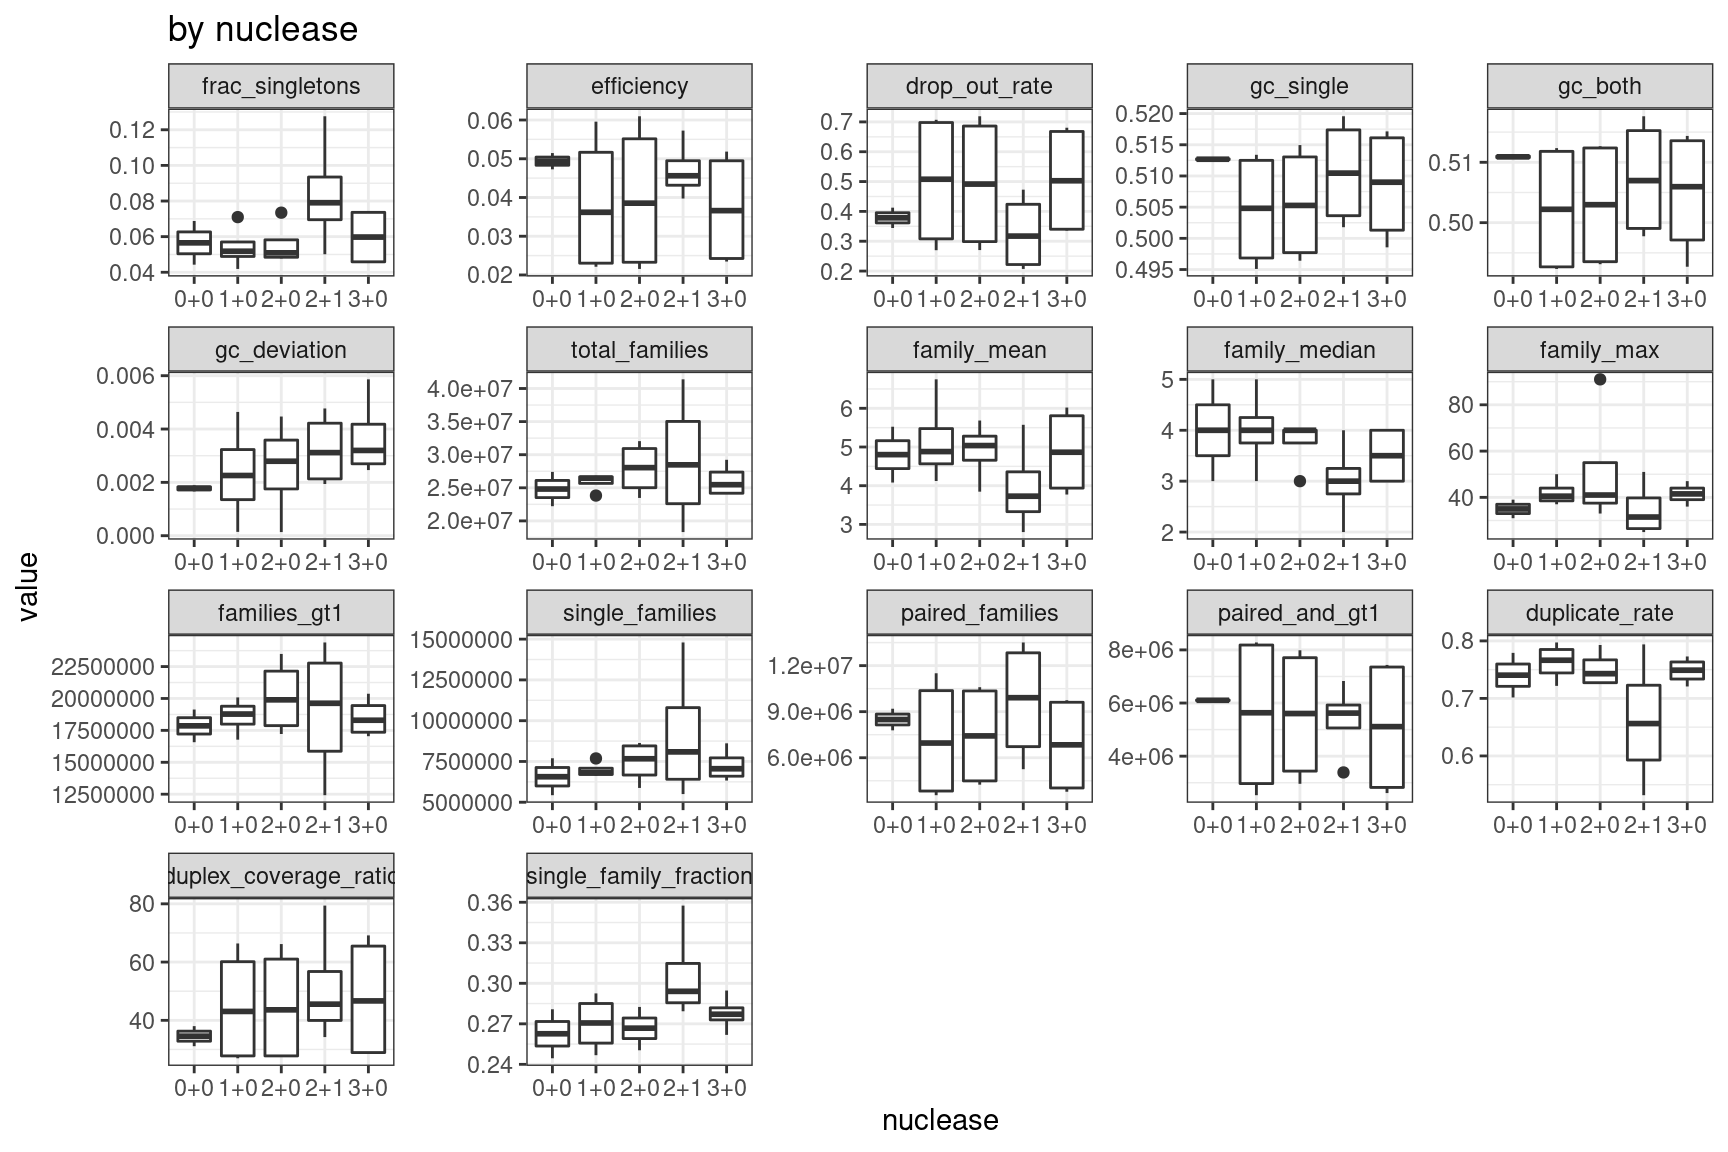
Summary plot including separated by all experimental factors.
ggplot(mmo, aes(sample, value, colour = protocol, shape = nuclease)) +
    geom_point() +
    theme_bw() +
    theme(axis.text.x = element_text(angle = 90)) +
    facet_wrap(~metric, scales = 'free') +
    scale_colour_brewer(palette = 'Dark2') +
    ggtitle('by protocol')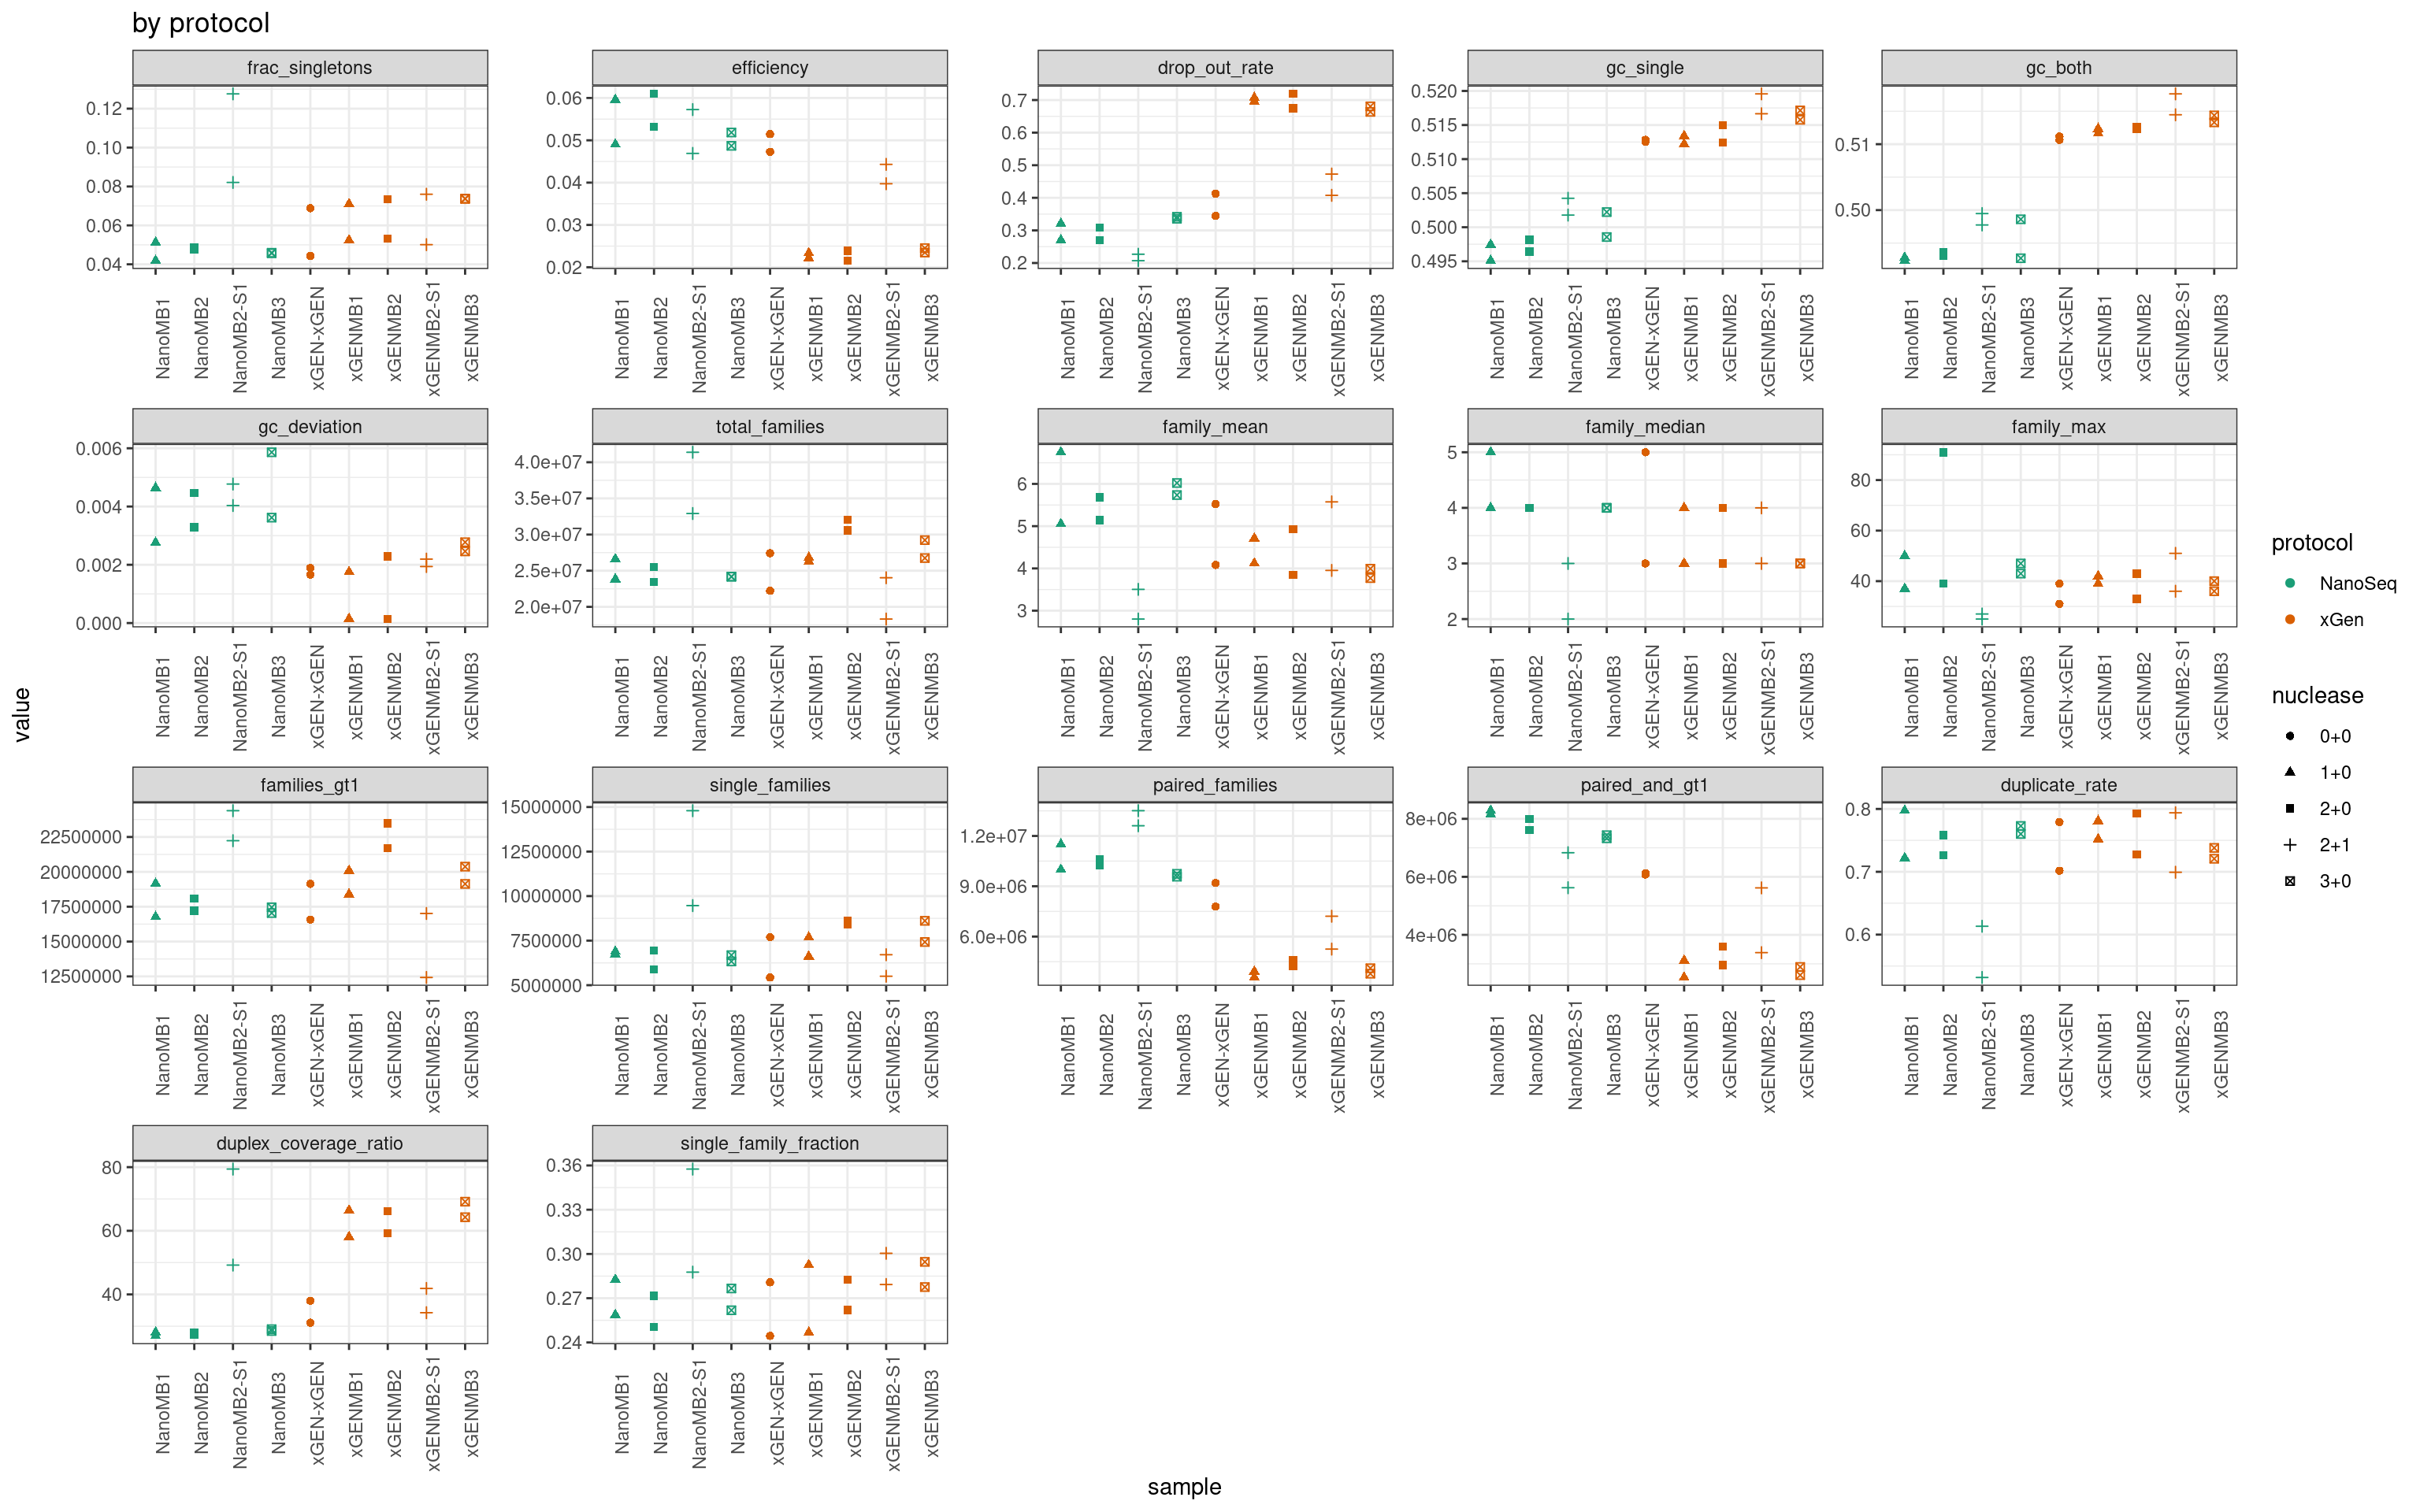
Statistical test results by protocol
For each metric, take the average of each replicate and perform a two-sided, unpaired T-test between protocols.
stats <- NULL
metric_names <- unique(mmo$metric) %>% as.character()
for(metric_name in metric_names) {
    nano <- mmo[mmo$metric == metric_name & mmo$protocol == 'NanoSeq',]
    xgen <- mmo[mmo$metric == metric_name & mmo$protocol == 'xGen',]
    nano_vals <- data.table(nano)[, mean(value), by = nuclease]$V1
    xgen_vals <- data.table(xgen)[, mean(value), by = nuclease]$V1
    wtest <- t.test(nano_vals, xgen_vals)
    stats <- rbind(stats,
                   data.frame(metric = metric_name, pvalue = wtest$p.value))
}
stats$significant <- stats$pvalue < 0.05
print(stats)
metric pvalue significant
1 frac_singletons 8.856688e-01 FALSE
2 efficiency 1.762439e-02 TRUE
3 drop_out_rate 1.080330e-02 TRUE
4 gc_single 2.282058e-04 TRUE
5 gc_both 6.467558e-05 TRUE
6 gc_deviation 3.656097e-04 TRUE
7 total_families 7.121985e-01 FALSE
8 family_mean 4.081459e-01 FALSE
9 family_median 6.178040e-01 FALSE
10 family_max 5.178585e-01 FALSE
11 families_gt1 9.146511e-01 FALSE
12 single_families 6.628176e-01 FALSE
13 paired_families 1.878931e-03 TRUE
14 paired_and_gt1 2.903205e-03 TRUE
15 duplicate_rate 4.691898e-01 FALSE
16 duplex_coverage_ratio 2.145076e-01 FALSE
17 single_family_fraction 7.668823e-01 FALSEPaired T-test (pairing nucleases, removing standard xGEN).
stats <- NULL
metric_names <- unique(mmo$metric) %>% as.character()
for(metric_name in metric_names) {
    nano <- mmo[mmo$metric == metric_name & mmo$protocol == 'NanoSeq',]
    xgen <- mmo[mmo$metric == metric_name & mmo$protocol == 'xGen' & mmo$nuclease != '0+0',]
    nano_vals <- data.table(nano)[, mean(value), by = nuclease]$V1
    xgen_vals <- data.table(xgen)[, mean(value), by = nuclease]$V1
    wtest <- t.test(nano_vals, xgen_vals, paired=TRUE)
    stats <- rbind(stats,
                   data.frame(metric = metric_name, pvalue = wtest$p.value))
}
stats$significant <- stats$pvalue < 0.05
print(stats)
metric pvalue significant
1 frac_singletons 8.105516e-01 FALSE
2 efficiency 1.819141e-02 TRUE
3 drop_out_rate 4.226603e-03 TRUE
4 gc_single 1.825631e-05 TRUE
5 gc_both 3.123511e-05 TRUE
6 gc_deviation 4.471721e-04 TRUE
7 total_families 8.563265e-01 FALSE
8 family_mean 4.336622e-01 FALSE
9 family_median 4.860036e-01 FALSE
10 family_max 6.300620e-01 FALSE
11 families_gt1 9.925513e-01 FALSE
12 single_families 8.008165e-01 FALSE
13 paired_families 2.554397e-04 TRUE
14 paired_and_gt1 1.494647e-02 TRUE
15 duplicate_rate 4.454420e-01 FALSE
16 duplex_coverage_ratio 2.816812e-01 FALSE
17 single_family_fraction 9.071651e-01 FALSERerun tests removing outlier (xGEN rep1). The results are similar.
stats <- NULL
for(metric_name in metric_names) {
    nano <- mmo[mmo$metric == metric_name & mmo$protocol == 'NanoSeq',]
    xgen <- mmo[mmo$metric == metric_name & mmo$protocol == 'xGen',]
    nano_vals <- data.table(nano)[, mean(value), by = nuclease]$V1
    xgen_vals <- data.table(xgen)[, mean(value), by = nuclease]$V1
    wtest <- t.test(nano_vals, xgen_vals)
    stats <- rbind(stats,
                   data.frame(metric = metric_name, pvalue = wtest$p.value))
}
stats$significant <- stats$pvalue < 0.05
print(stats)
metric pvalue significant
1 frac_singletons 8.856688e-01 FALSE
2 efficiency 1.762439e-02 TRUE
3 drop_out_rate 1.080330e-02 TRUE
4 gc_single 2.282058e-04 TRUE
5 gc_both 6.467558e-05 TRUE
6 gc_deviation 3.656097e-04 TRUE
7 total_families 7.121985e-01 FALSE
8 family_mean 4.081459e-01 FALSE
9 family_median 6.178040e-01 FALSE
10 family_max 5.178585e-01 FALSE
11 families_gt1 9.146511e-01 FALSE
12 single_families 6.628176e-01 FALSE
13 paired_families 1.878931e-03 TRUE
14 paired_and_gt1 2.903205e-03 TRUE
15 duplicate_rate 4.691898e-01 FALSE
16 duplex_coverage_ratio 2.145076e-01 FALSE
17 single_family_fraction 7.668823e-01 FALSETwo-way ANOVA analysis
We consider a two-way ANOVA, modelling the protocol, Mung Bean Unit and S1 Unit variables, as well as the interaction effect between the units and the protocol.
stats <- NULL
metric_names <- unique(mm$metric) %>% as.character()
for(metric_name in metric_names) {
    x <- mm[mm$metric == metric_name,]
    x$MungBeanUnit <- as.factor(x$`Mung bean unit`)
    x$S1Unit <- as.factor(x$`S1 unit`)
    x <- x[,c('MungBeanUnit', 'S1Unit', 'protocol', 'nuclease', 'value')]
    x_aov <- aov(value ~ MungBeanUnit * protocol + S1Unit * protocol, data = x) %>% summary() %>% dplyr::first()
    stats <- rbind(stats,
                   data.frame(metric = metric_name,
                              variable = rownames(x_aov)[1:5],
                              pvalue = x_aov[['Pr(>F)']][1:5]))
}
stats$q <- p.adjust(stats$pvalue, method = 'BH')
stats$significant <- stats$q < 0.05
print(stats)
metric variable pvalue q
1 frac_singletons MungBeanUnit 3.179448e-01 8.125140e-01
2 frac_singletons protocol 9.702279e-01 9.917902e-01
3 frac_singletons S1Unit 8.553539e-01 9.917902e-01
4 frac_singletons MungBeanUnit:protocol 9.858376e-01 9.917902e-01
5 frac_singletons protocol:S1Unit 8.540793e-01 9.917902e-01
6 efficiency MungBeanUnit 6.743589e-01 9.917902e-01
7 efficiency protocol 3.377609e-03 3.588710e-02
8 efficiency S1Unit 4.674623e-01 9.417809e-01
9 efficiency MungBeanUnit:protocol 8.509683e-01 9.917902e-01
10 efficiency protocol:S1Unit 2.278366e-01 8.069213e-01
11 drop_out_rate MungBeanUnit 4.118682e-01 8.976615e-01
12 drop_out_rate protocol 2.566346e-04 5.453485e-03
13 drop_out_rate S1Unit 9.042622e-02 4.270127e-01
14 drop_out_rate MungBeanUnit:protocol 8.387882e-01 9.917902e-01
15 drop_out_rate protocol:S1Unit 3.182162e-01 8.125140e-01
16 gc_single MungBeanUnit 2.845364e-03 3.455085e-02
17 gc_single protocol 4.201084e-07 1.785461e-05
18 gc_single S1Unit 2.691266e-02 1.759674e-01
19 gc_single MungBeanUnit:protocol 9.742888e-01 9.917902e-01
20 gc_single protocol:S1Unit 7.452944e-01 9.917902e-01
21 gc_both MungBeanUnit 3.374303e-04 5.736315e-03
22 gc_both protocol 3.194918e-09 2.715681e-07
23 gc_both S1Unit 9.138191e-03 6.898391e-02
24 gc_both MungBeanUnit:protocol 8.678217e-01 9.917902e-01
25 gc_both protocol:S1Unit 5.614184e-01 9.544114e-01
26 gc_deviation MungBeanUnit 6.443318e-01 9.917902e-01
27 gc_deviation protocol 9.738905e-03 6.898391e-02
28 gc_deviation S1Unit 5.442060e-01 9.544114e-01
29 gc_deviation MungBeanUnit:protocol 9.592822e-01 9.917902e-01
30 gc_deviation protocol:S1Unit 8.839586e-01 9.917902e-01
31 total_families MungBeanUnit 4.304880e-01 9.147871e-01
32 total_families protocol 8.735318e-01 9.917902e-01
33 total_families S1Unit 8.883185e-01 9.917902e-01
34 total_families MungBeanUnit:protocol 8.394811e-01 9.917902e-01
35 total_families protocol:S1Unit 2.211659e-01 8.069213e-01
36 family_mean MungBeanUnit 3.721341e-01 8.549028e-01
37 family_mean protocol 2.541551e-01 8.125140e-01
38 family_mean S1Unit 2.914712e-01 8.125140e-01
39 family_mean MungBeanUnit:protocol 2.723545e-01 8.125140e-01
40 family_mean protocol:S1Unit 1.501251e-01 6.380316e-01
41 family_median MungBeanUnit 6.347858e-01 9.917902e-01
42 family_median protocol 4.810155e-01 9.417809e-01
43 family_median S1Unit 3.250056e-01 8.125140e-01
44 family_median MungBeanUnit:protocol 4.997581e-01 9.439876e-01
45 family_median protocol:S1Unit 3.250056e-01 8.125140e-01
46 family_max MungBeanUnit 3.849415e-01 8.610533e-01
47 family_max protocol 5.270992e-01 9.544114e-01
48 family_max S1Unit 1.424842e-01 6.374291e-01
49 family_max MungBeanUnit:protocol 9.819906e-01 9.917902e-01
50 family_max protocol:S1Unit 6.056582e-02 3.107792e-01
51 families_gt1 MungBeanUnit 1.793349e-01 7.258795e-01
52 families_gt1 protocol 9.876271e-01 9.917902e-01
53 families_gt1 S1Unit 6.881757e-01 9.917902e-01
54 families_gt1 MungBeanUnit:protocol 6.170001e-01 9.917902e-01
55 families_gt1 protocol:S1Unit 3.016320e-02 1.831337e-01
56 single_families MungBeanUnit 3.440723e-01 8.356042e-01
57 single_families protocol 9.487606e-01 9.917902e-01
58 single_families S1Unit 8.838445e-01 9.917902e-01
59 single_families MungBeanUnit:protocol 9.818450e-01 9.917902e-01
60 single_families protocol:S1Unit 7.210495e-01 9.917902e-01
61 paired_families MungBeanUnit 3.217762e-01 8.125140e-01
62 paired_families protocol 2.319573e-04 5.453485e-03
63 paired_families S1Unit 1.990511e-01 7.690611e-01
64 paired_families MungBeanUnit:protocol 9.226482e-01 9.917902e-01
65 paired_families protocol:S1Unit 8.092464e-01 9.917902e-01
66 paired_and_gt1 MungBeanUnit 6.527043e-01 9.917902e-01
67 paired_and_gt1 protocol 7.082361e-04 1.003334e-02
68 paired_and_gt1 S1Unit 8.872835e-01 9.917902e-01
69 paired_and_gt1 MungBeanUnit:protocol 5.304734e-01 9.544114e-01
70 paired_and_gt1 protocol:S1Unit 2.688706e-01 8.125140e-01
71 duplicate_rate MungBeanUnit 3.209744e-01 8.125140e-01
72 duplicate_rate protocol 6.617113e-01 9.917902e-01
73 duplicate_rate S1Unit 4.855983e-01 9.417809e-01
74 duplicate_rate MungBeanUnit:protocol 8.160371e-01 9.917902e-01
75 duplicate_rate protocol:S1Unit 5.516726e-01 9.544114e-01
76 duplex_coverage_ratio MungBeanUnit 5.159691e-02 2.923825e-01
77 duplex_coverage_ratio protocol 5.999337e-03 5.099436e-02
78 duplex_coverage_ratio S1Unit 4.875101e-01 9.417809e-01
79 duplex_coverage_ratio MungBeanUnit:protocol 6.215584e-02 3.107792e-01
80 duplex_coverage_ratio protocol:S1Unit 4.129184e-03 3.899785e-02
81 single_family_fraction MungBeanUnit 3.655666e-01 8.549028e-01
82 single_family_fraction protocol 9.875561e-01 9.917902e-01
83 single_family_fraction S1Unit 7.565118e-01 9.917902e-01
84 single_family_fraction MungBeanUnit:protocol 9.917902e-01 9.917902e-01
85 single_family_fraction protocol:S1Unit 8.631941e-01 9.917902e-01
significant
1 FALSE
2 FALSE
3 FALSE
4 FALSE
5 FALSE
6 FALSE
7 TRUE
8 FALSE
9 FALSE
10 FALSE
11 FALSE
12 TRUE
13 FALSE
14 FALSE
15 FALSE
16 TRUE
17 TRUE
18 FALSE
19 FALSE
20 FALSE
21 TRUE
22 TRUE
23 FALSE
24 FALSE
25 FALSE
26 FALSE
27 FALSE
28 FALSE
29 FALSE
30 FALSE
31 FALSE
32 FALSE
33 FALSE
34 FALSE
35 FALSE
36 FALSE
37 FALSE
38 FALSE
39 FALSE
40 FALSE
41 FALSE
42 FALSE
43 FALSE
44 FALSE
45 FALSE
46 FALSE
47 FALSE
48 FALSE
49 FALSE
50 FALSE
51 FALSE
52 FALSE
53 FALSE
54 FALSE
55 FALSE
56 FALSE
57 FALSE
58 FALSE
59 FALSE
60 FALSE
61 FALSE
62 TRUE
63 FALSE
64 FALSE
65 FALSE
66 FALSE
67 TRUE
68 FALSE
69 FALSE
70 FALSE
71 FALSE
72 FALSE
73 FALSE
74 FALSE
75 FALSE
76 FALSE
77 FALSE
78 FALSE
79 FALSE
80 TRUE
81 FALSE
82 FALSE
83 FALSE
84 FALSE
85 FALSEWe remove the outlier xGEN rep 1 and test again.
stats <- NULL
metric_names <- unique(mmo$metric) %>% as.character()
for(metric_name in metric_names) {
    x <- mmo[mmo$metric == metric_name,]
    x$MungBeanUnit <- as.factor(x$`Mung bean unit`)
    x$S1Unit <- as.factor(x$`S1 unit`)
    x <- x[,c('MungBeanUnit', 'S1Unit', 'protocol', 'nuclease', 'value')]
    # x_aov <- aov(value ~ MungBeanUnit * protocol + S1Unit * protocol, data = x) %>% summary() %>% dplyr::first()
    x_aov <- aov(value ~ MungBeanUnit * S1Unit * protocol, data = x) %>% summary() %>% dplyr::first()
    stats <- rbind(stats,
                   data.frame(metric = metric_name,
                              variable = rownames(x_aov)[1:5],
                              pvalue = x_aov[['Pr(>F)']][1:5]))
}
stats$q <- p.adjust(stats$pvalue, method = 'BH')
stats$significant <- stats$q < 0.05
print(stats)
metric variable pvalue q
1 frac_singletons MungBeanUnit 3.747242e-01 5.137348e-01
2 frac_singletons S1Unit 2.820185e-02 8.878361e-02
3 frac_singletons protocol 6.061218e-01 6.869380e-01
4 frac_singletons MungBeanUnit:protocol 1.145001e-01 2.211933e-01
5 frac_singletons S1Unit:protocol 2.714409e-02 8.874030e-02
6 efficiency MungBeanUnit 2.943575e-02 8.935853e-02
7 efficiency S1Unit 4.375525e-02 1.162249e-01
8 efficiency protocol 8.567087e-07 1.213671e-05
9 efficiency MungBeanUnit:protocol 2.583454e-01 4.116694e-01
10 efficiency S1Unit:protocol 3.175014e-03 1.420401e-02
11 drop_out_rate MungBeanUnit 4.996962e-04 3.861289e-03
12 drop_out_rate S1Unit 2.501322e-05 3.037320e-04
13 drop_out_rate protocol 2.459532e-09 1.584214e-07
14 drop_out_rate MungBeanUnit:protocol 9.115253e-02 1.986658e-01
15 drop_out_rate S1Unit:protocol 1.679681e-03 8.622677e-03
16 gc_single MungBeanUnit 1.711519e-03 8.622677e-03
17 gc_single S1Unit 1.523577e-03 8.622677e-03
18 gc_single protocol 9.159550e-09 2.595206e-07
19 gc_single MungBeanUnit:protocol 9.253752e-01 9.476734e-01
20 gc_single S1Unit:protocol 5.774184e-01 6.632508e-01
21 gc_both MungBeanUnit 1.770799e-03 8.622677e-03
22 gc_both S1Unit 4.828938e-03 1.954570e-02
23 gc_both protocol 3.727562e-09 1.584214e-07
24 gc_both MungBeanUnit:protocol 8.295304e-01 8.925327e-01
25 gc_both S1Unit:protocol 5.064090e-01 6.062643e-01
26 gc_deviation MungBeanUnit 1.765974e-01 3.127028e-01
27 gc_deviation S1Unit 3.553090e-01 5.045955e-01
28 gc_deviation protocol 7.986248e-04 5.221777e-03
29 gc_deviation MungBeanUnit:protocol 9.053297e-01 9.440000e-01
30 gc_deviation S1Unit:protocol 8.214325e-01 8.925327e-01
31 total_families MungBeanUnit 2.929023e-01 4.526672e-01
32 total_families S1Unit 5.556673e-01 6.559961e-01
33 total_families protocol 5.053171e-01 6.062643e-01
34 total_families MungBeanUnit:protocol 8.844339e-02 1.978339e-01
35 total_families S1Unit:protocol 3.593070e-04 3.393455e-03
36 family_mean MungBeanUnit 4.646379e-01 6.062643e-01
37 family_mean S1Unit 1.077790e-01 2.211933e-01
38 family_mean protocol 8.429941e-02 1.936608e-01
39 family_mean MungBeanUnit:protocol 6.294463e-02 1.528655e-01
40 family_mean S1Unit:protocol 3.389191e-02 9.602708e-02
41 family_median MungBeanUnit 4.629868e-01 6.062643e-01
42 family_median S1Unit 1.678507e-01 3.035597e-01
43 family_median protocol 3.164774e-01 4.764120e-01
44 family_median MungBeanUnit:protocol 2.615312e-01 4.116694e-01
45 family_median S1Unit:protocol 1.678507e-01 3.035597e-01
46 family_max MungBeanUnit 8.985047e-01 9.440000e-01
47 family_max S1Unit 1.144701e-01 2.211933e-01
48 family_max protocol 4.901973e-01 6.062643e-01
49 family_max MungBeanUnit:protocol 9.783491e-01 9.783491e-01
50 family_max S1Unit:protocol 4.537604e-02 1.168777e-01
51 families_gt1 MungBeanUnit 4.921202e-01 6.062643e-01
52 families_gt1 S1Unit 3.554965e-01 5.045955e-01
53 families_gt1 protocol 9.709211e-01 9.783491e-01
54 families_gt1 MungBeanUnit:protocol 1.121914e-01 2.211933e-01
55 families_gt1 S1Unit:protocol 2.152397e-04 2.286922e-03
56 single_families MungBeanUnit 3.561851e-01 5.045955e-01
57 single_families S1Unit 1.446431e-01 2.732148e-01
58 single_families protocol 5.002377e-01 6.062643e-01
59 single_families MungBeanUnit:protocol 1.802640e-01 3.127028e-01
60 single_families S1Unit:protocol 3.538918e-03 1.504040e-02
61 paired_families MungBeanUnit 1.158679e-02 4.282076e-02
62 paired_families S1Unit 1.825979e-03 8.622677e-03
63 paired_families protocol 2.650844e-08 5.633044e-07
64 paired_families MungBeanUnit:protocol 4.727076e-01 6.062643e-01
65 paired_families S1Unit:protocol 4.522724e-01 6.062643e-01
66 paired_and_gt1 MungBeanUnit 3.715875e-01 5.137348e-01
67 paired_and_gt1 S1Unit 7.110938e-01 7.849737e-01
68 paired_and_gt1 protocol 4.877137e-07 8.291133e-06
69 paired_and_gt1 MungBeanUnit:protocol 4.055773e-02 1.112067e-01
70 paired_and_gt1 S1Unit:protocol 1.317773e-02 4.667114e-02
71 duplicate_rate MungBeanUnit 2.028567e-01 3.448563e-01
72 duplicate_rate S1Unit 1.519542e-02 5.166443e-02
73 duplicate_rate protocol 9.553308e-02 2.030078e-01
74 duplicate_rate MungBeanUnit:protocol 7.348826e-02 1.735139e-01
75 duplicate_rate S1Unit:protocol 3.151836e-02 9.238141e-02
76 duplex_coverage_ratio MungBeanUnit 2.480884e-01 4.055291e-01
77 duplex_coverage_ratio S1Unit 3.194763e-01 4.764120e-01
78 duplex_coverage_ratio protocol 6.668694e-04 4.723659e-03
79 duplex_coverage_ratio MungBeanUnit:protocol 1.030421e-02 3.981170e-02
80 duplex_coverage_ratio S1Unit:protocol 4.306854e-04 3.660826e-03
81 single_family_fraction MungBeanUnit 5.636520e-01 6.563071e-01
82 single_family_fraction S1Unit 4.704794e-02 1.176199e-01
83 single_family_fraction protocol 9.106823e-01 9.440000e-01
84 single_family_fraction MungBeanUnit:protocol 6.635184e-01 7.420929e-01
85 single_family_fraction S1Unit:protocol 2.340365e-01 3.900609e-01
significant
1 FALSE
2 FALSE
3 FALSE
4 FALSE
5 FALSE
6 FALSE
7 FALSE
8 TRUE
9 FALSE
10 TRUE
11 TRUE
12 TRUE
13 TRUE
14 FALSE
15 TRUE
16 TRUE
17 TRUE
18 TRUE
19 FALSE
20 FALSE
21 TRUE
22 TRUE
23 TRUE
24 FALSE
25 FALSE
26 FALSE
27 FALSE
28 TRUE
29 FALSE
30 FALSE
31 FALSE
32 FALSE
33 FALSE
34 FALSE
35 TRUE
36 FALSE
37 FALSE
38 FALSE
39 FALSE
40 FALSE
41 FALSE
42 FALSE
43 FALSE
44 FALSE
45 FALSE
46 FALSE
47 FALSE
48 FALSE
49 FALSE
50 FALSE
51 FALSE
52 FALSE
53 FALSE
54 FALSE
55 TRUE
56 FALSE
57 FALSE
58 FALSE
59 FALSE
60 TRUE
61 TRUE
62 TRUE
63 TRUE
64 FALSE
65 FALSE
66 FALSE
67 FALSE
68 TRUE
69 FALSE
70 TRUE
71 FALSE
72 FALSE
73 FALSE
74 FALSE
75 FALSE
76 FALSE
77 FALSE
78 TRUE
79 TRUE
80 TRUE
81 FALSE
82 FALSE
83 FALSE
84 FALSE
85 FALSERelationships between variables
tmp <- mmo[,c('sample', 'metric', 'value', 'protocol', 'nuclease', 'replicate')]
dm <- reshape2::dcast(mmo, sample + protocol + nuclease + replicate ~ metric)

cols <- c(brewer.pal(5, 'Greens')[2:5],
          brewer.pal(6, 'Blues')[2:6])
names(cols) <- as.factor(dm$sample) %>% levels()

ggplot(dm, aes(frac_singletons, drop_out_rate, colour=sample)) +
    geom_point() +
    theme_bw() +
    scale_colour_manual(values = cols) +
    ggtitle('Singletons vs. drop-out rate')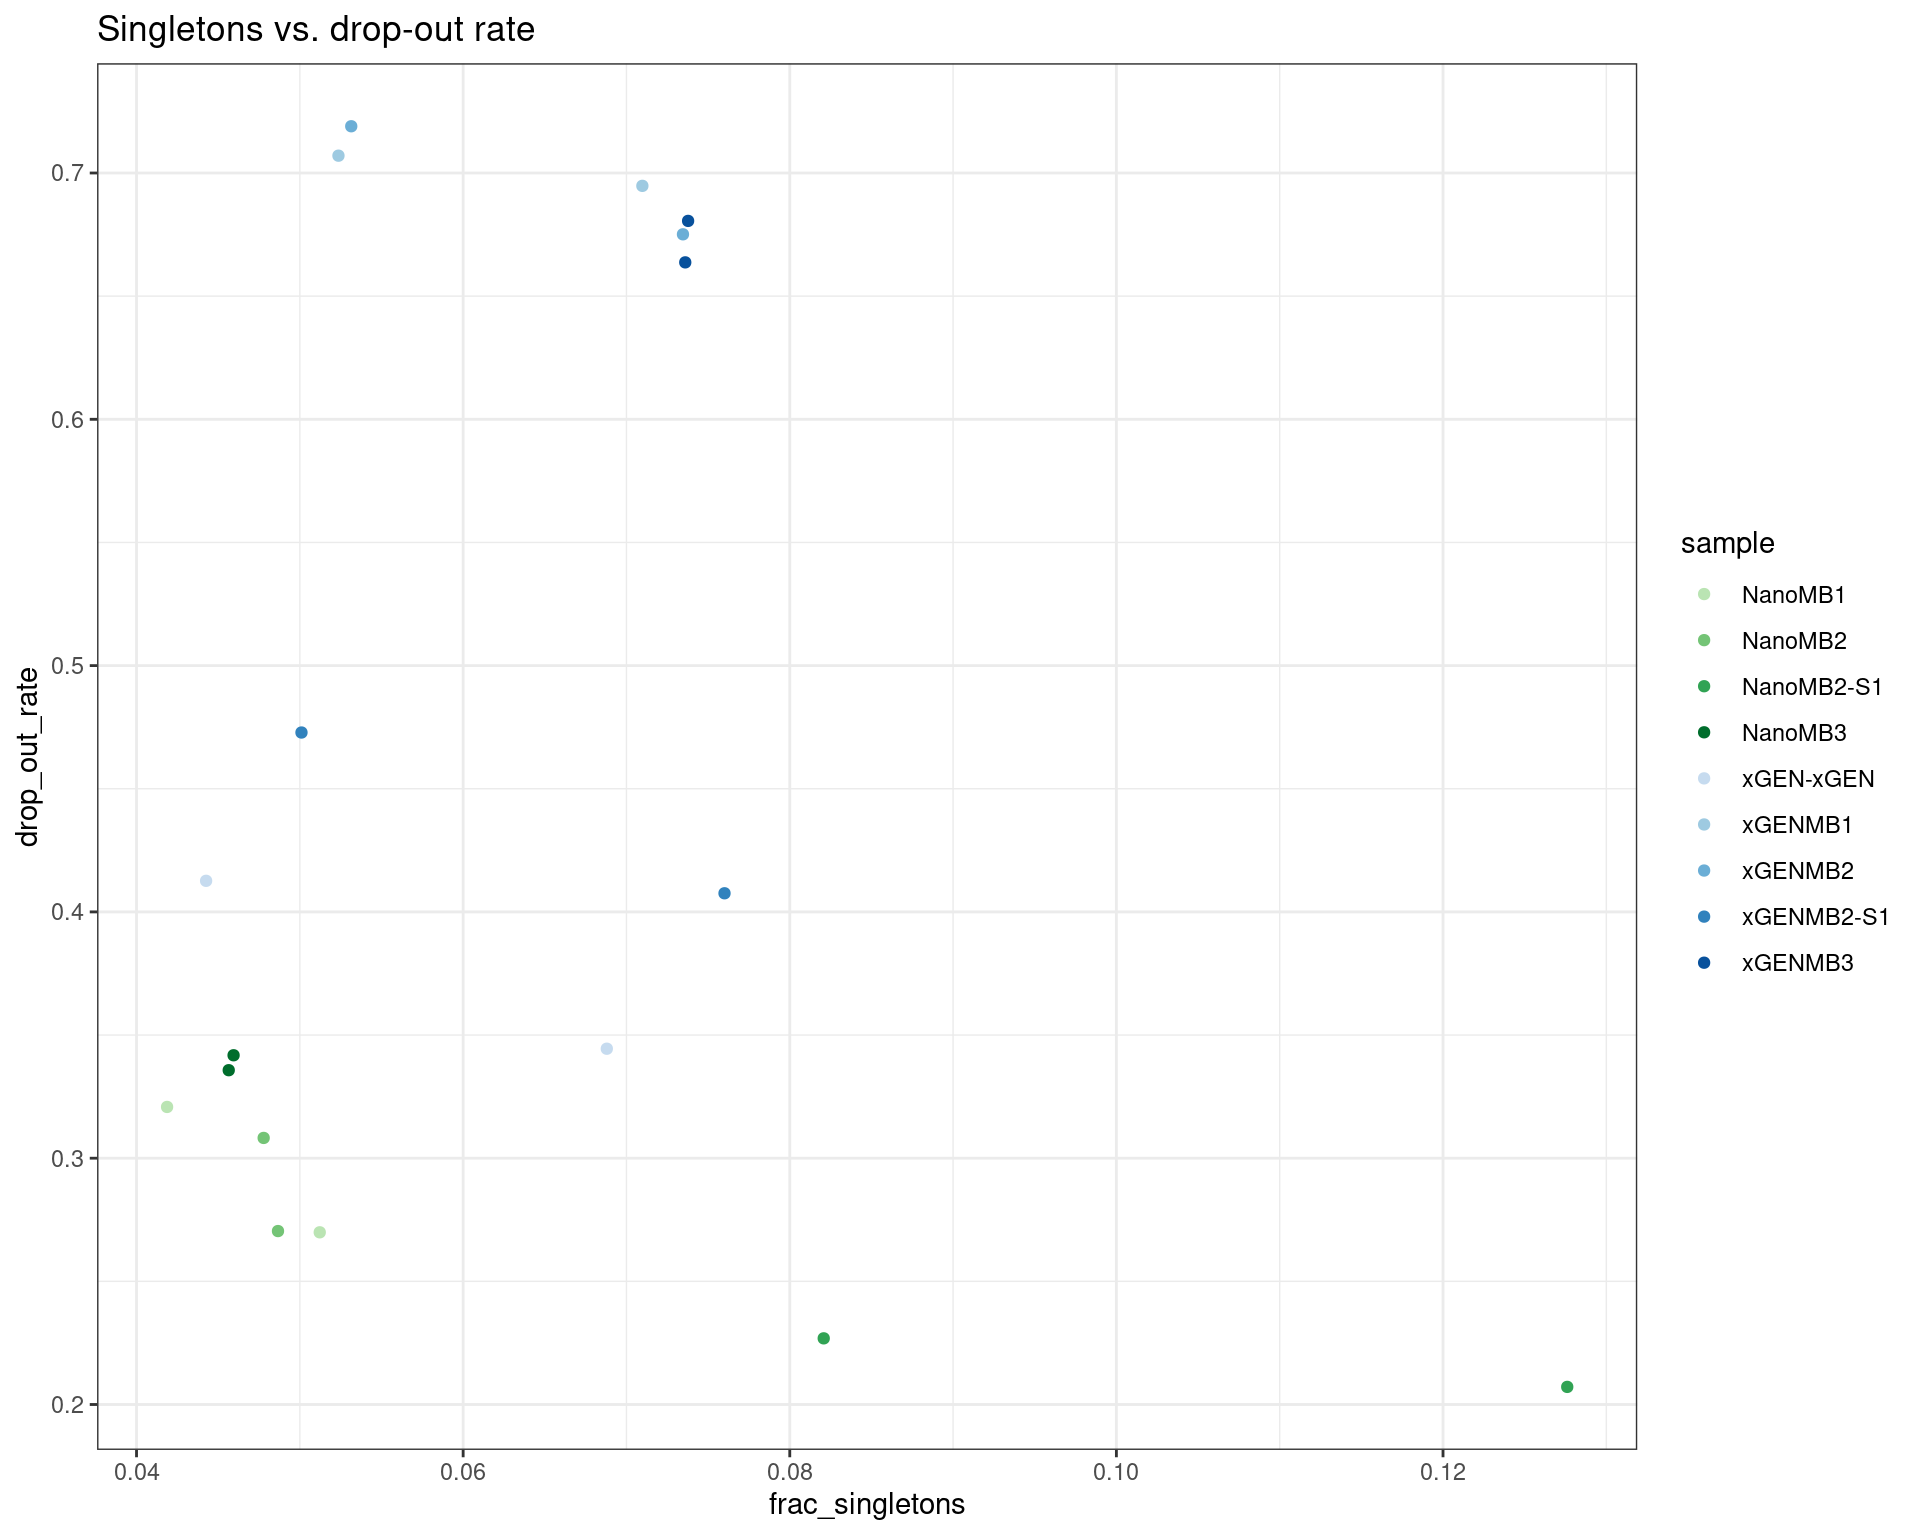
ggplot(dm, aes(efficiency, duplicate_rate, colour=sample)) +
    geom_point() +
    theme_bw() +
    scale_colour_manual(values = cols) +
    ggtitle('Efficiency vs. duplicate rate')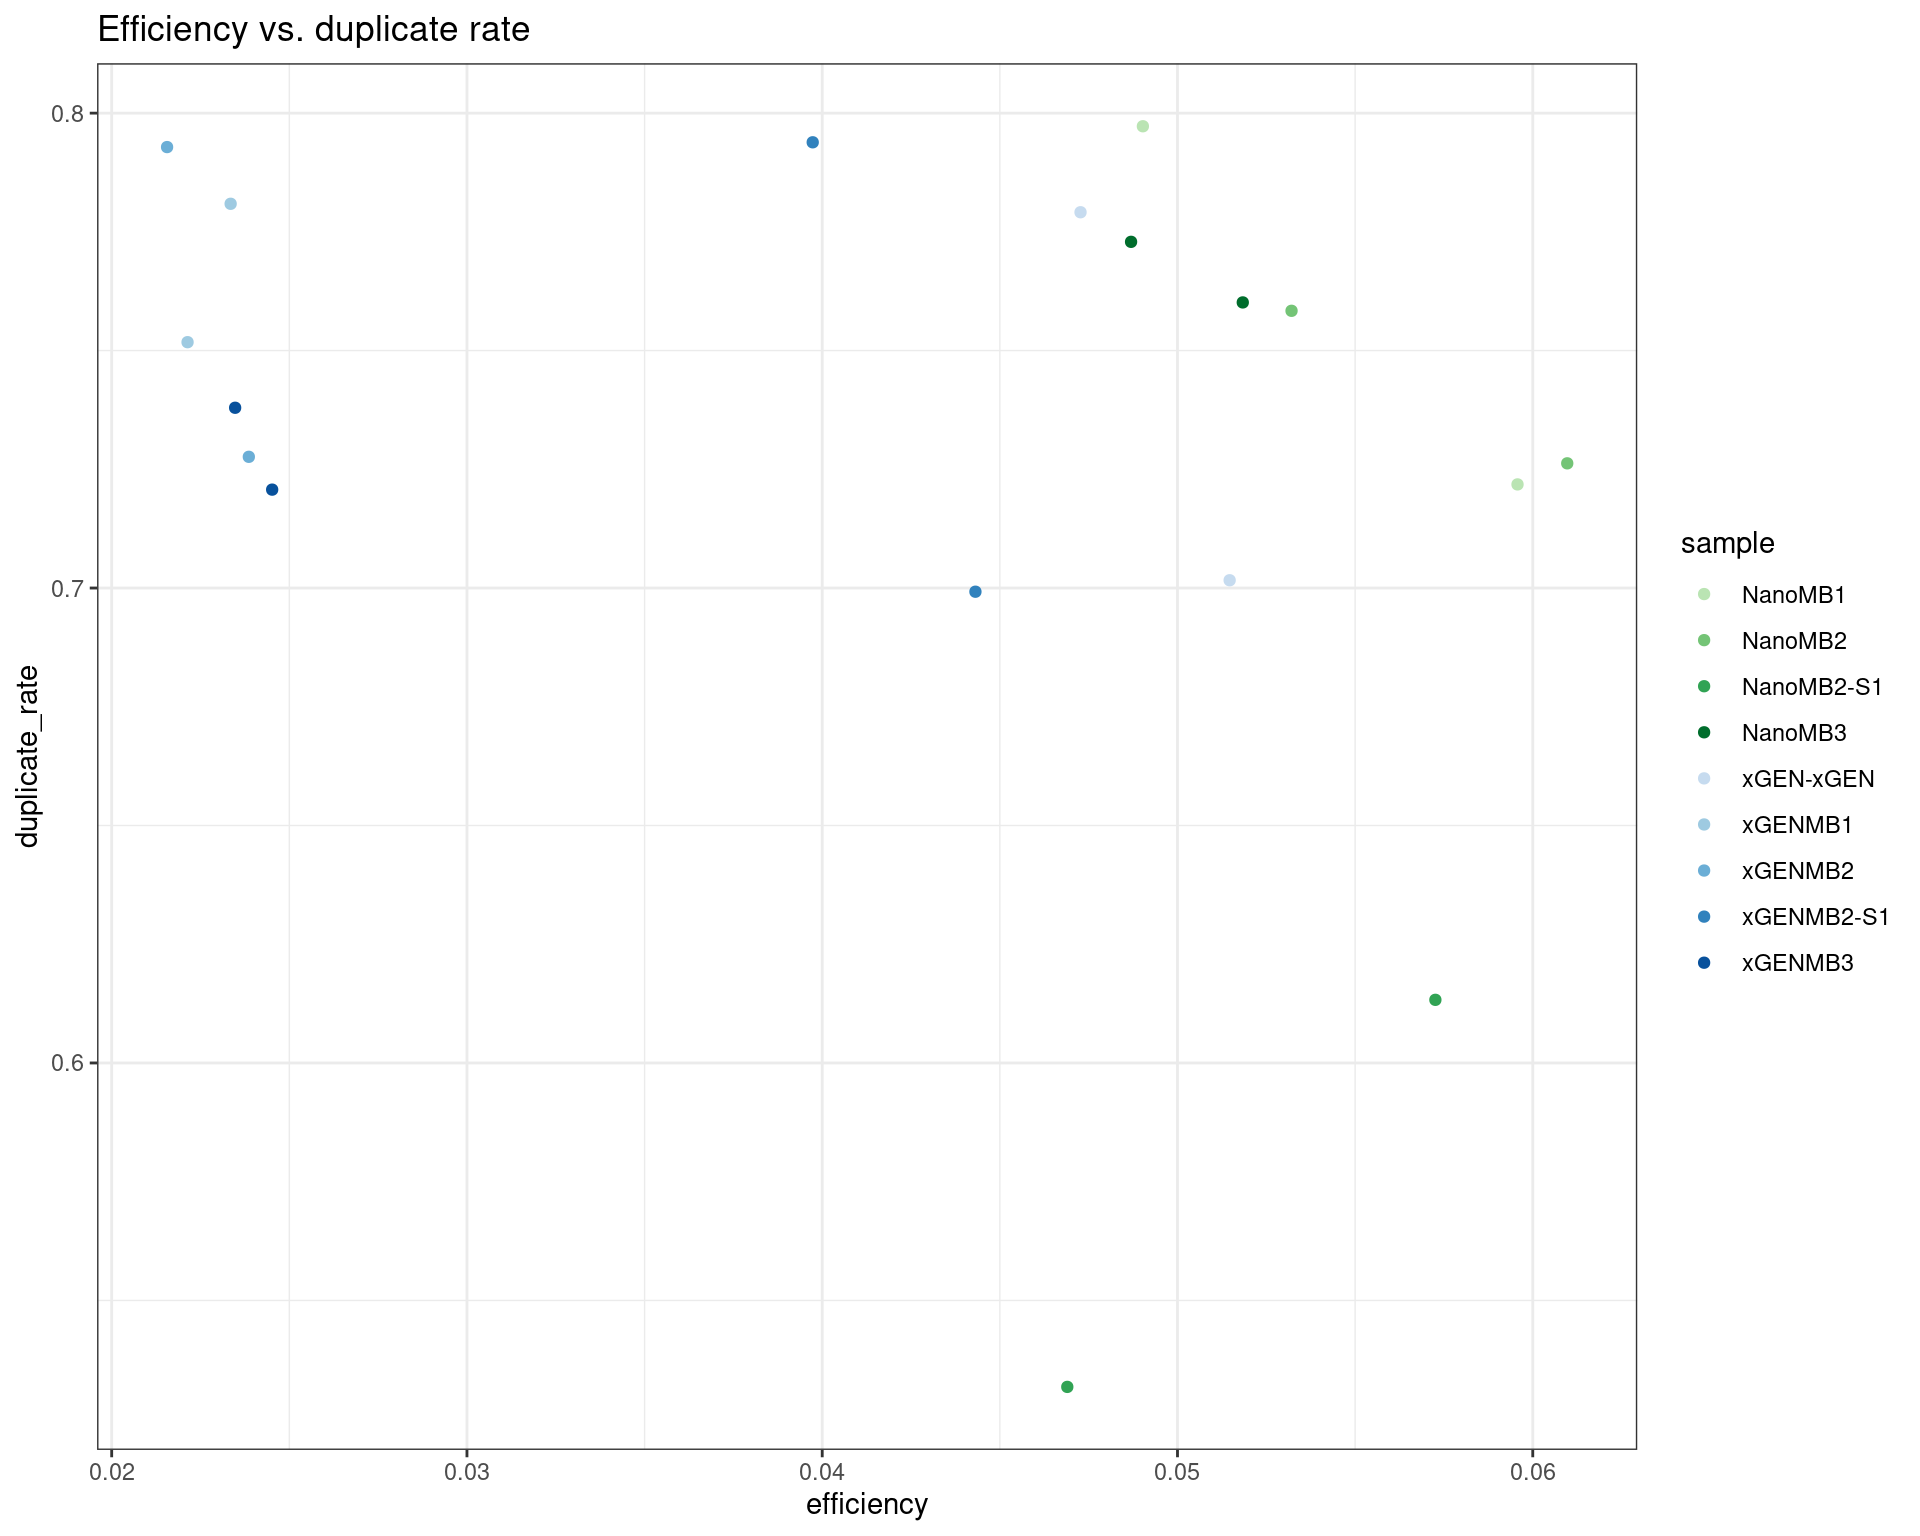
ggplot(dm, aes(efficiency, drop_out_rate, colour=sample)) +
    geom_point() +
    theme_bw() +
    scale_colour_manual(values = cols) +
    ggtitle('Efficiency vs. drop-out rate')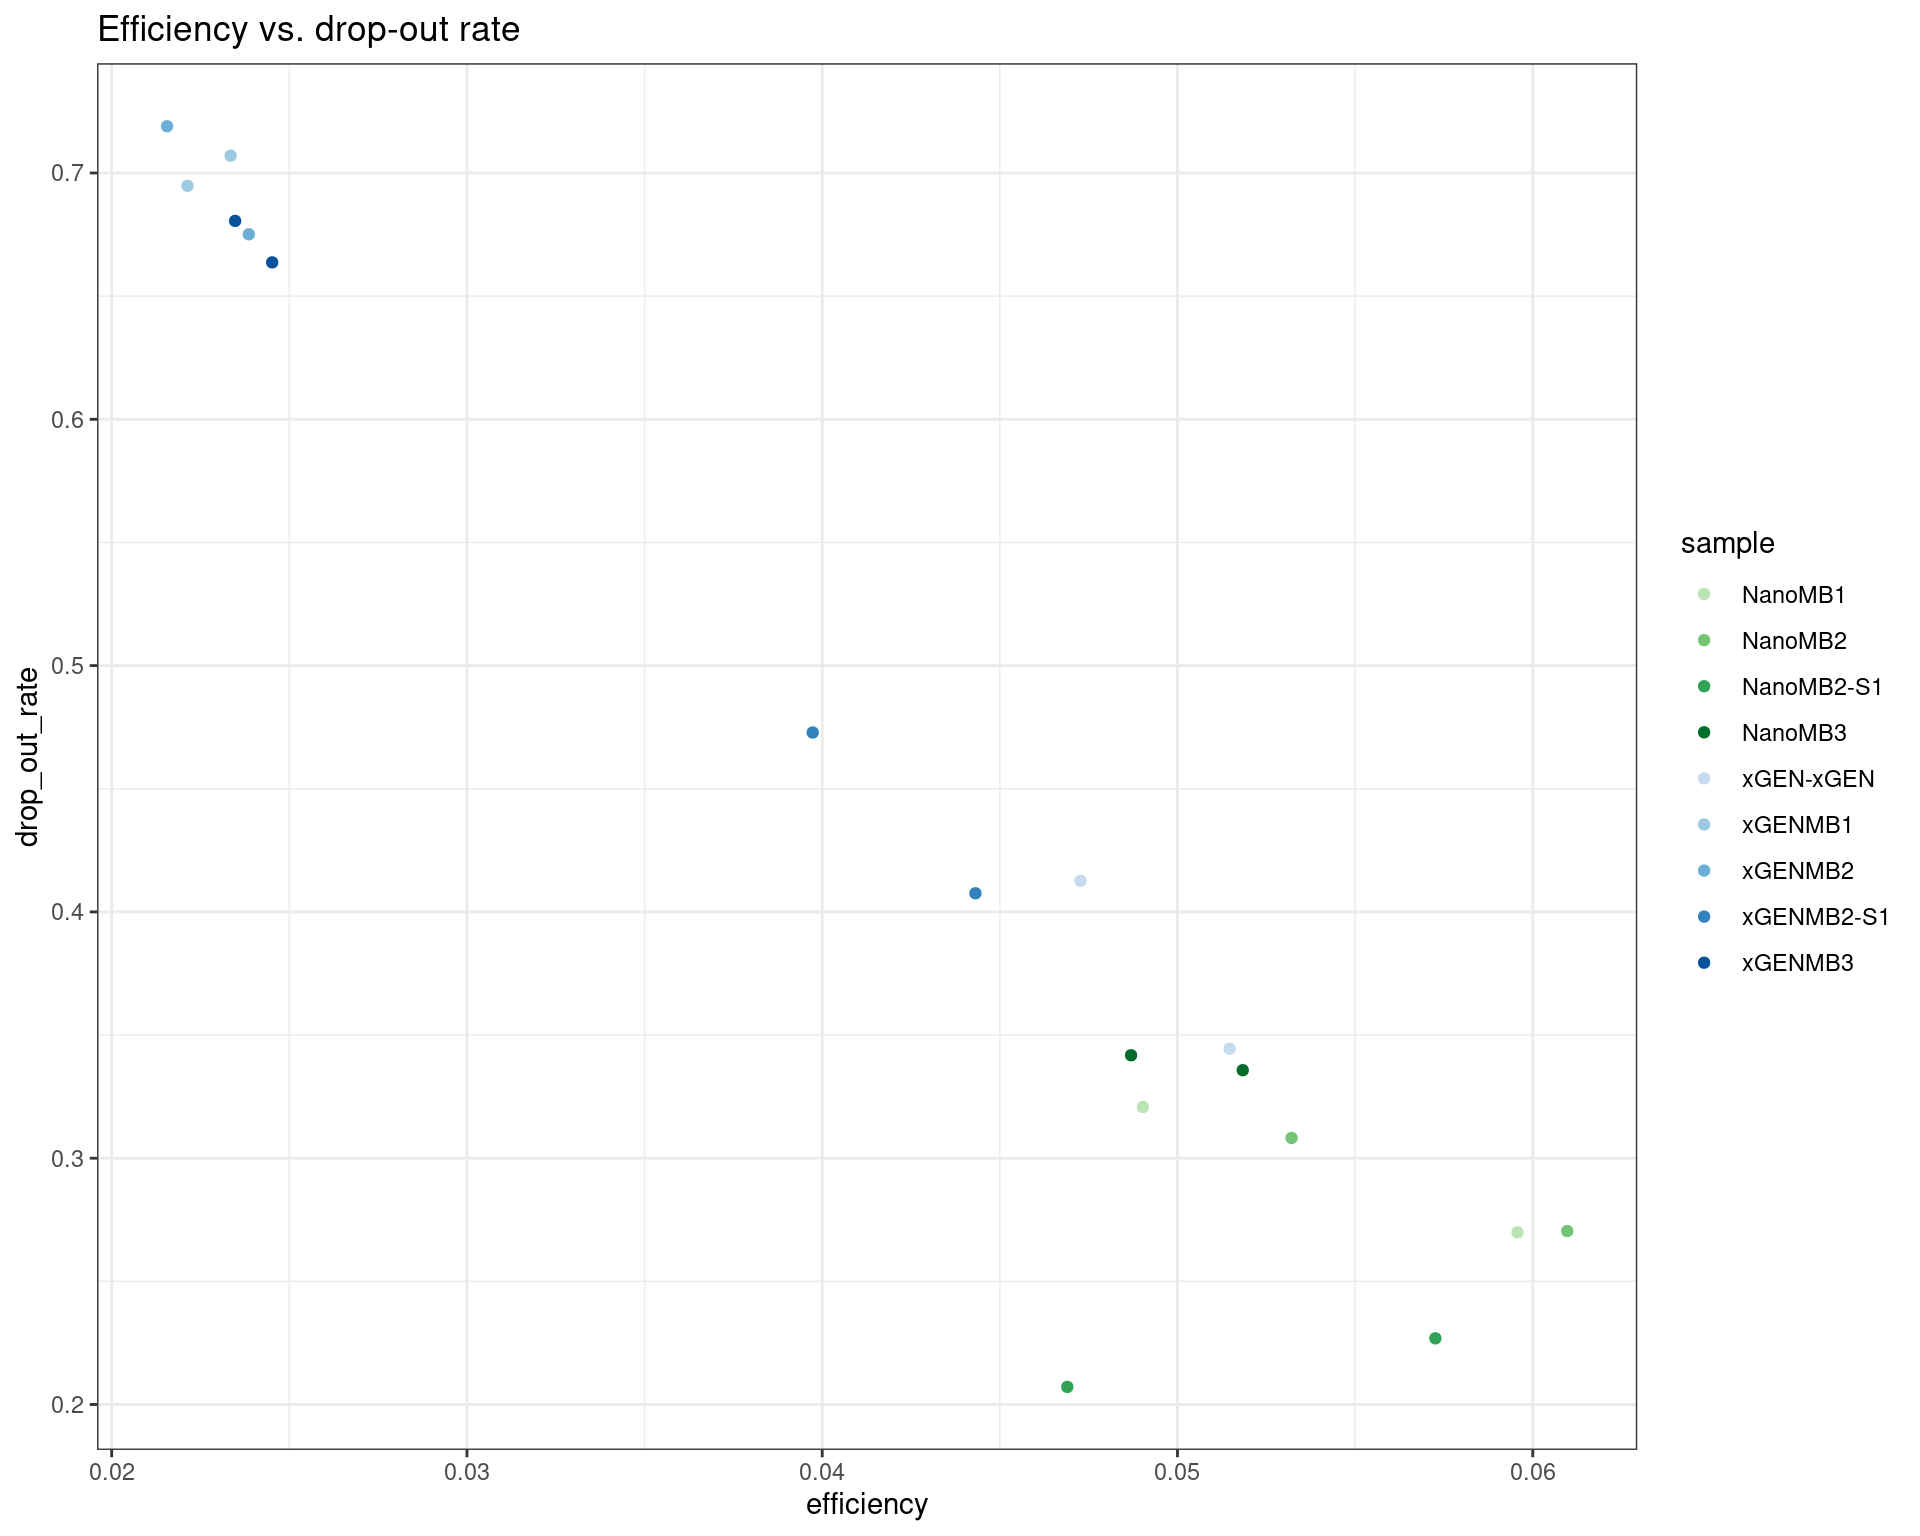
ggplot(dm, aes(efficiency, duplex_coverage_ratio, colour=sample)) +
    geom_point() +
    theme_bw() +
    scale_colour_manual(values = cols) +
    ggtitle('Efficiency vs. duplex coverage ratio')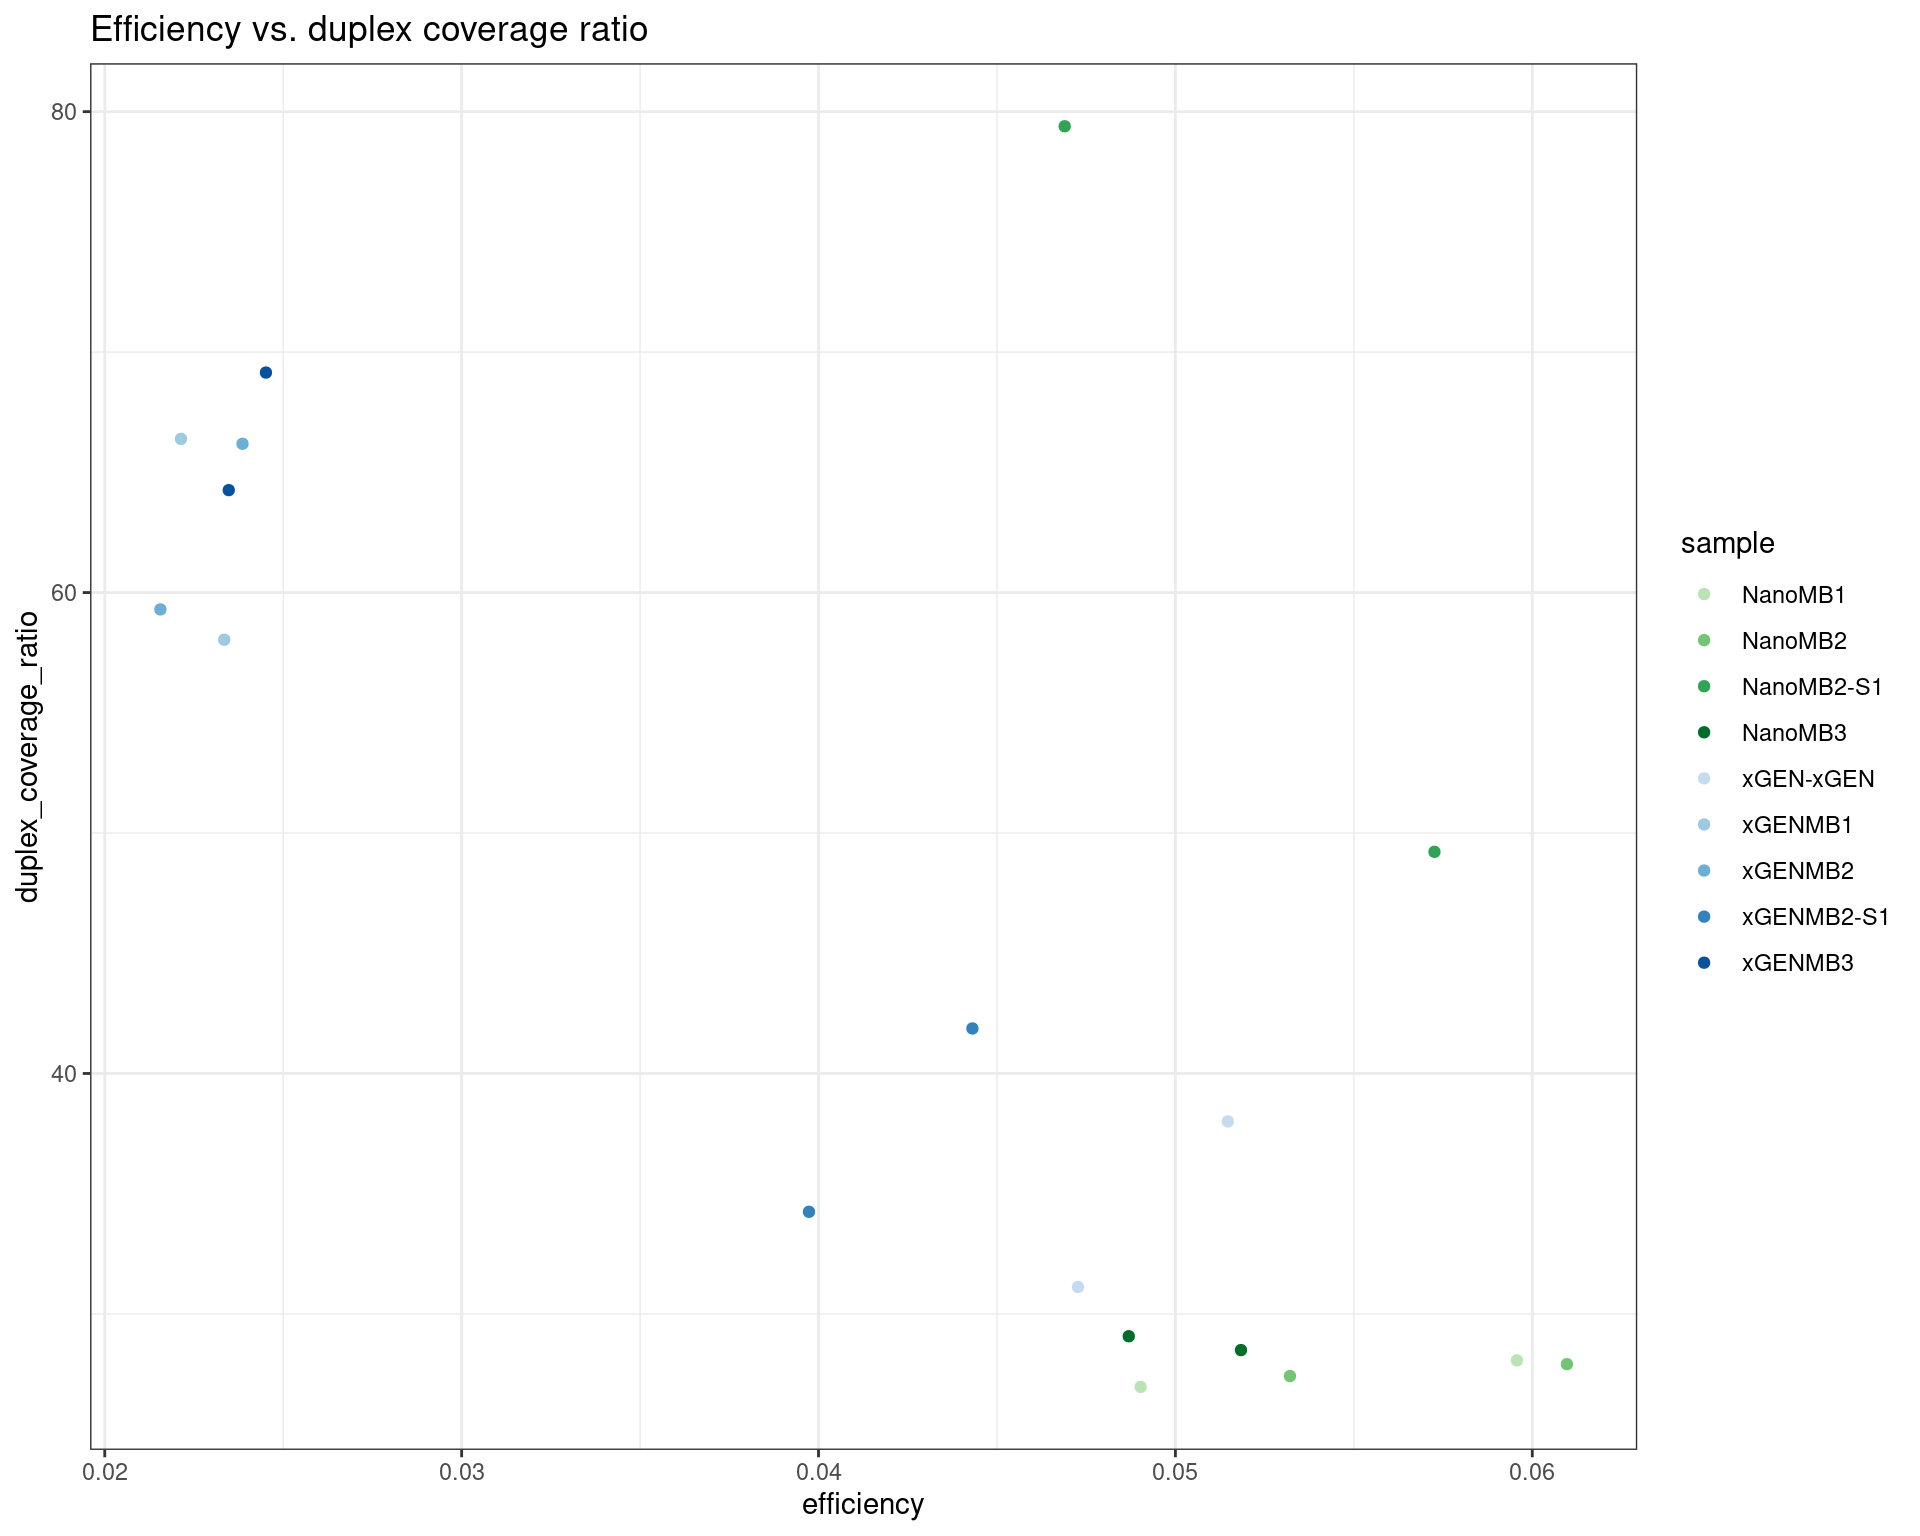
ggplot(dm, aes(duplicate_rate, duplex_coverage_ratio, colour=sample)) +
    geom_point() +
    theme_bw() +
    scale_colour_manual(values = cols) +
    ggtitle('Duplicate rate vs. duplex coverage ratio')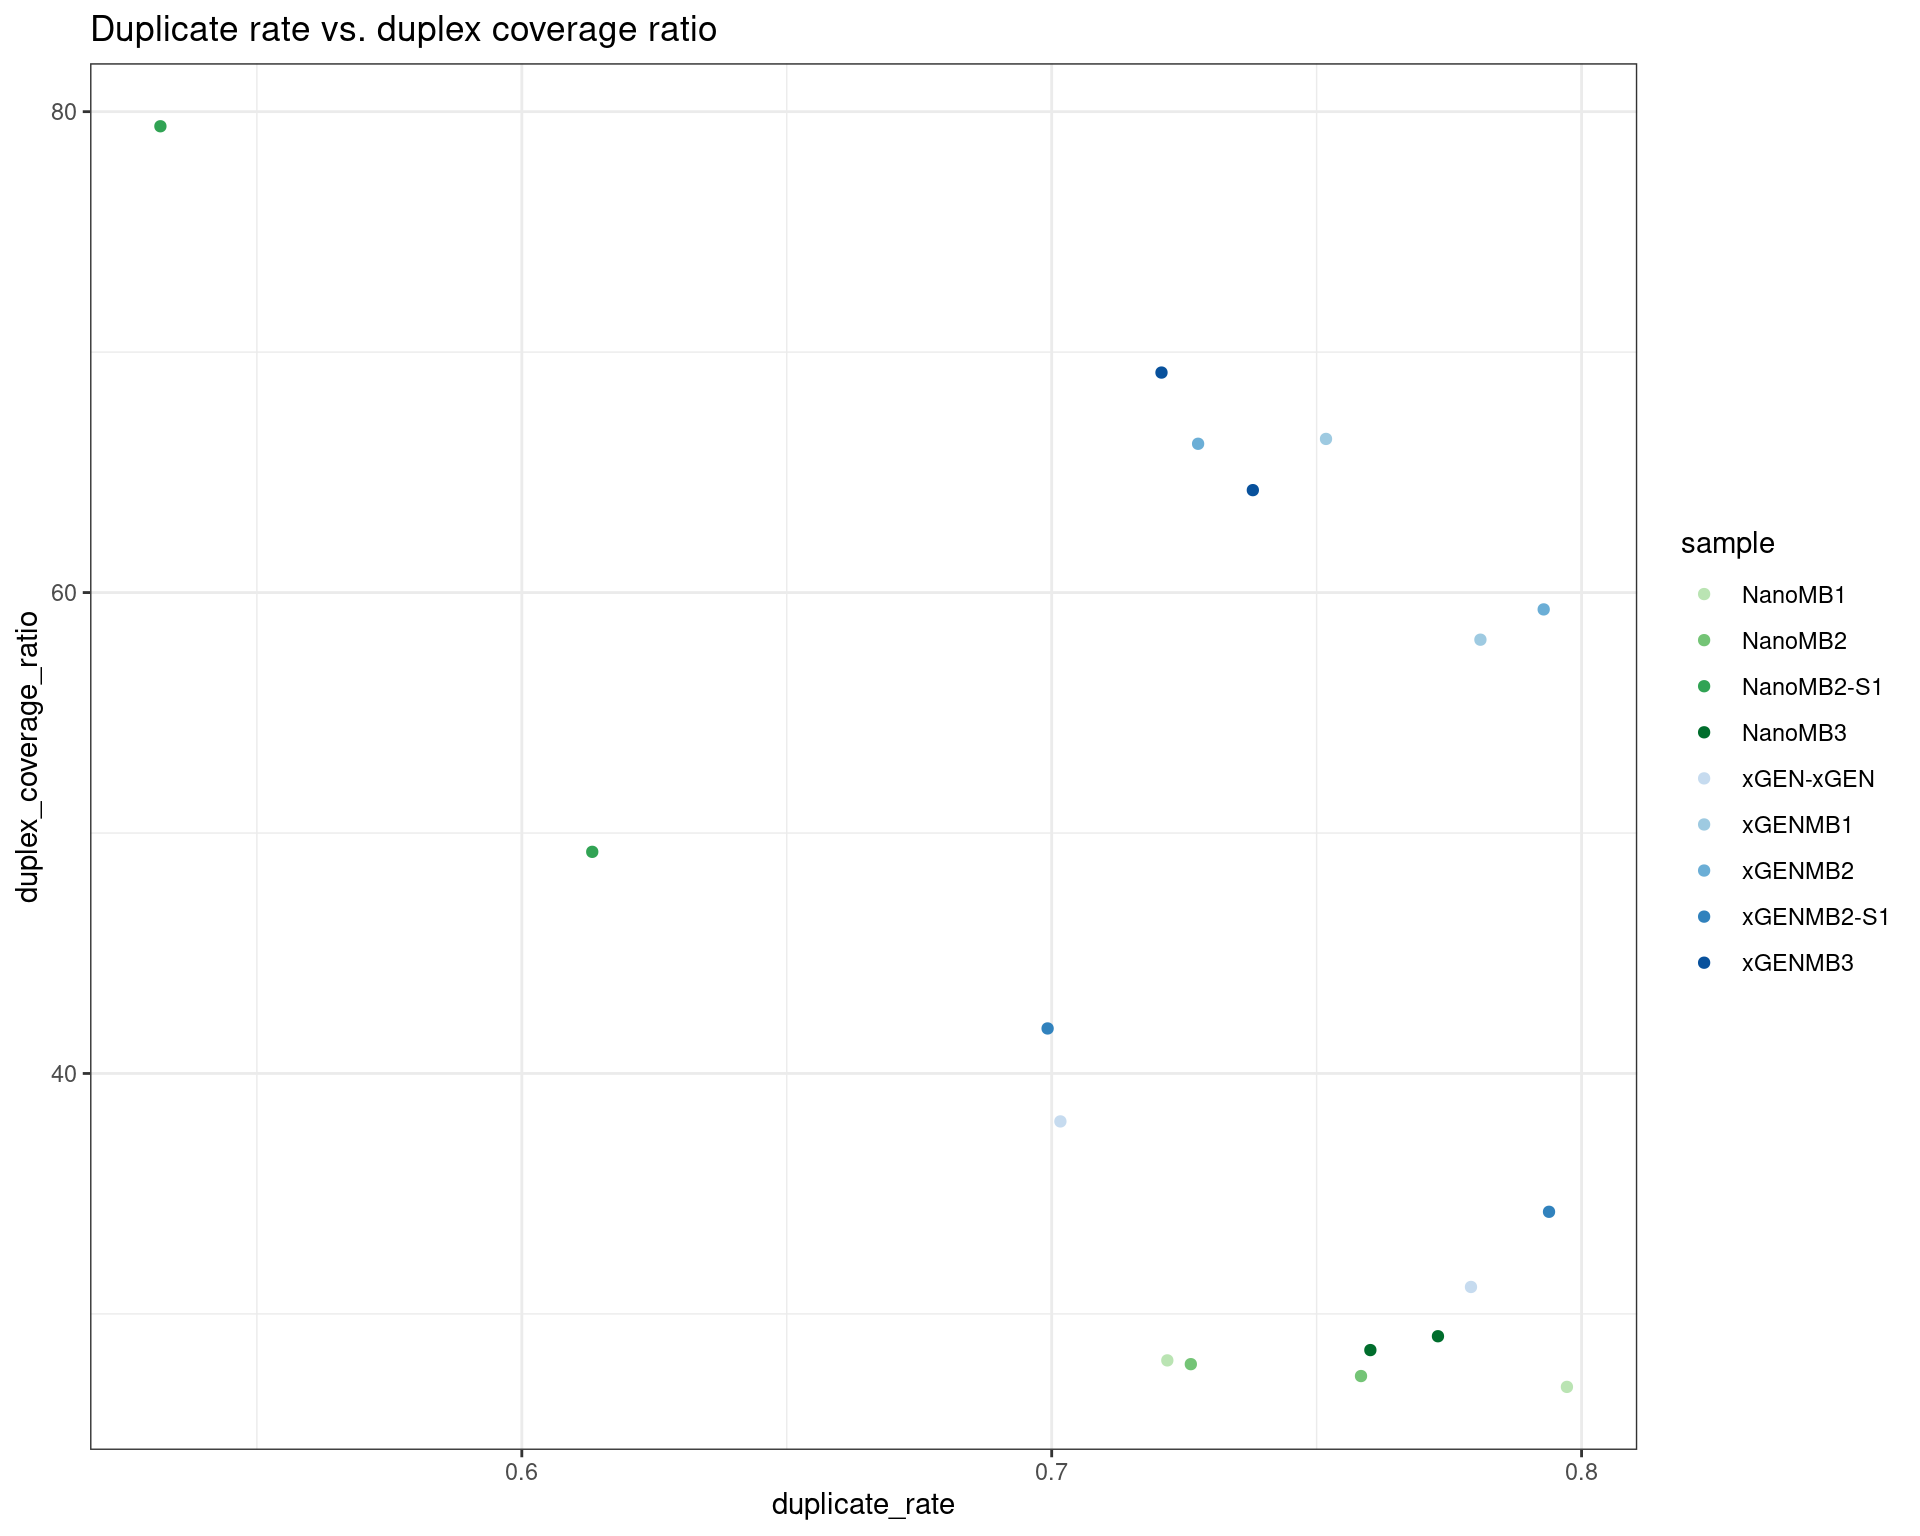
Focus on relationship between efficiency, duplicate rate and drop-out rate.
mt <- mm
mt$replicate <- str_split(mt$sample, 'Rep') %>% lapply(., dplyr::last) %>% unlist() %>% as.numeric()
mt$sample <- str_split(mt$sample, 'Rep') %>% lapply(., dplyr::first) %>% unlist()

mt <- mt[,c('sample', 'metric', 'value', 'protocol', 'nuclease', 'replicate')]
dm <- reshape2::dcast(mt, sample + protocol + nuclease + replicate ~ metric)

p1 <- ggplot(dm, aes(duplicate_rate, efficiency, colour=protocol, shape=nuclease)) +
    geom_point(size = 3) +
    theme_bw() +
    scale_colour_brewer(palette = 'Dark2') +
    ggtitle('Efficiency vs. duplicate rate')

p2 <- ggplot(dm, aes(drop_out_rate, efficiency, colour=protocol, shape=nuclease)) +
    geom_point(size = 3) +
    theme_bw() +
    scale_colour_brewer(palette = 'Dark2') +
    ggtitle('Efficiency vs. drop-out rate')
show(p1 + p2)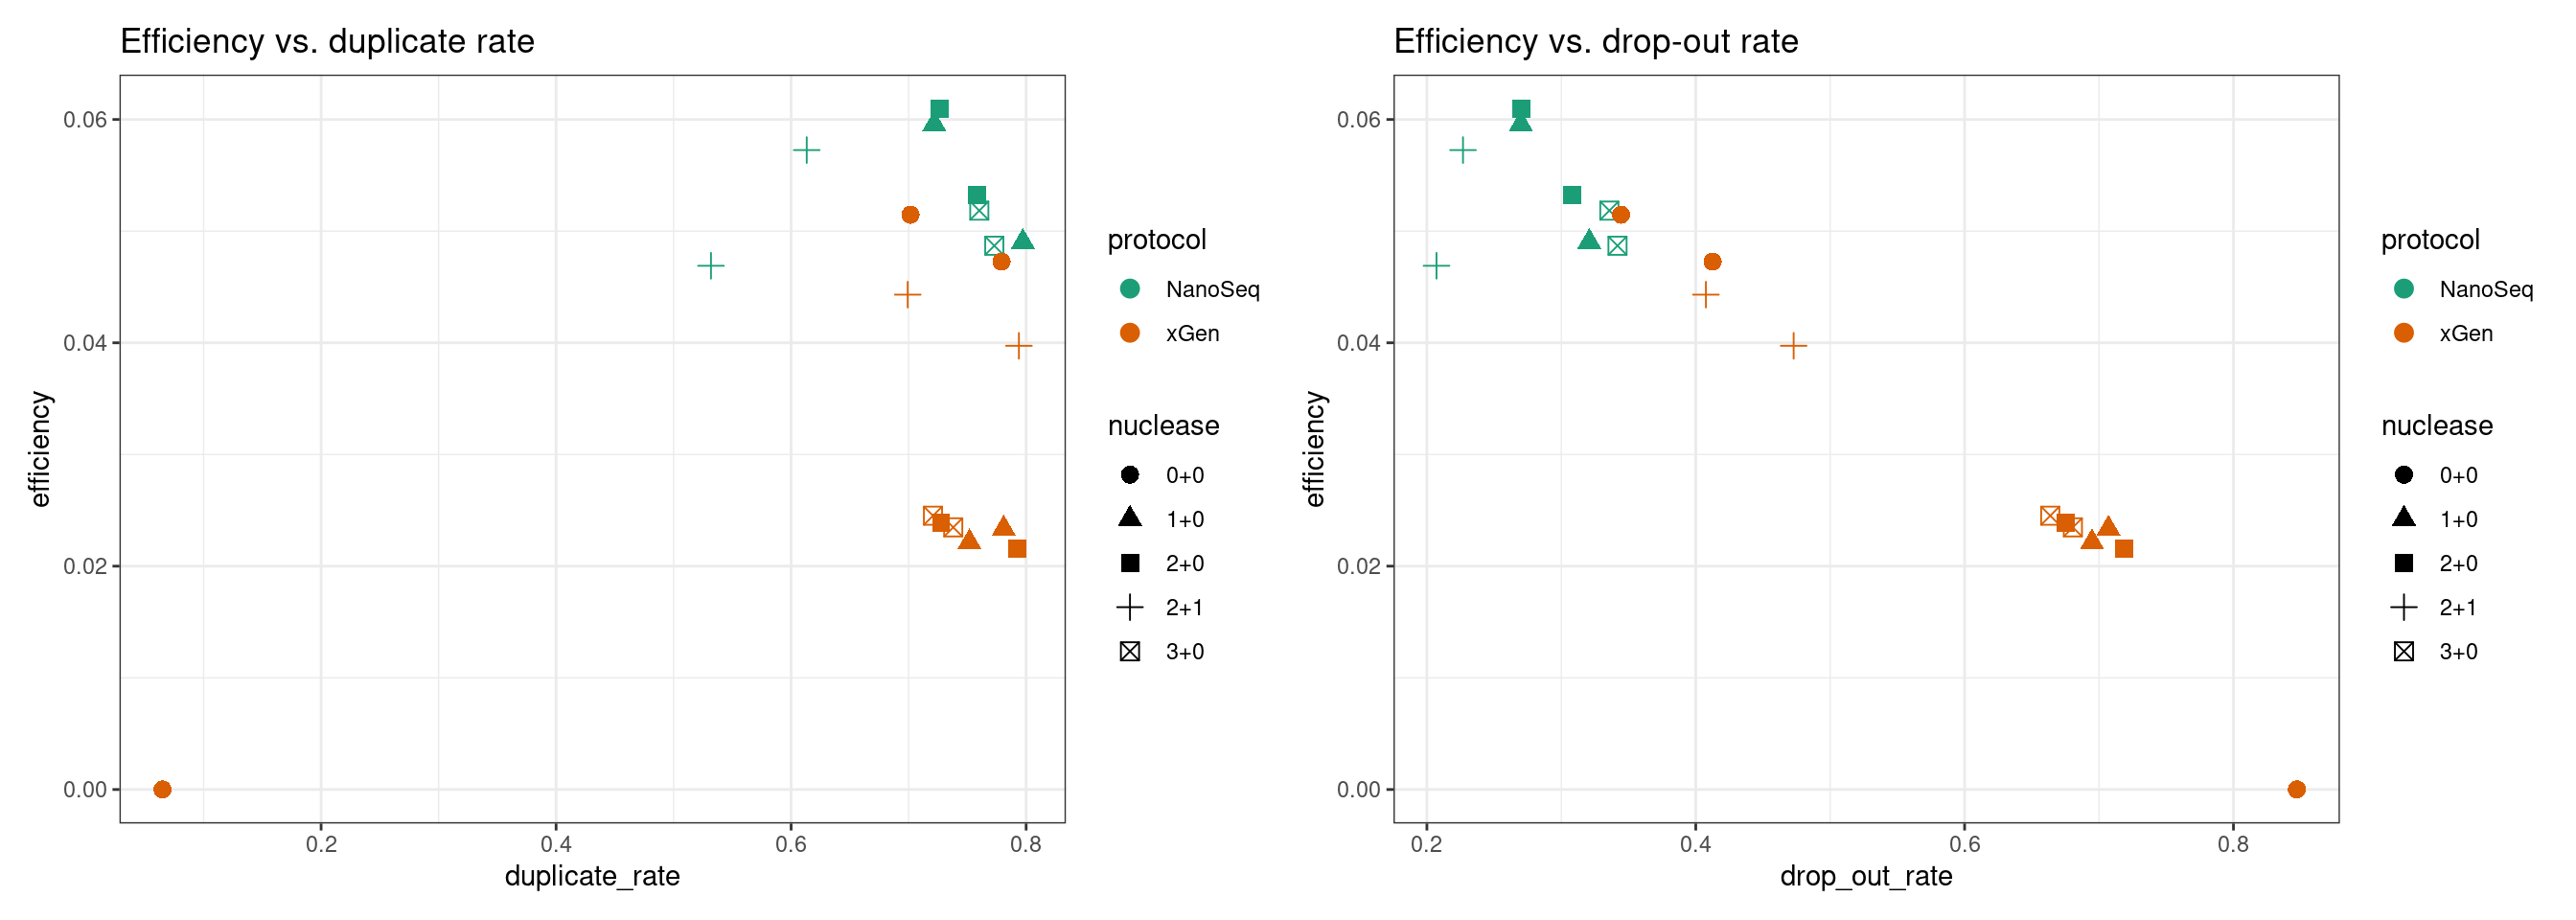
| Version | Author | Date |
|---|---|---|
| f4000d4 | Marek Cmero | 2022-09-08 |
Variant calls
Upset plot showing duplex variant calls. Variants were called in areas with at least 4x coverage with at least 2 supporting reads and a VAF of \(\geq2\).
ulist <- NULL
for(sample in sample_names) {
    ids <- var_df[var_df$sample %in% sample,]$id
    if (length(ids) > 0) {
        ulist[[gsub(pattern = '-HJK2GDSX3', replacement = '', sample)]] <- ids
    }
}

upset(fromList(ulist), order.by='freq', nsets=length(sample_names))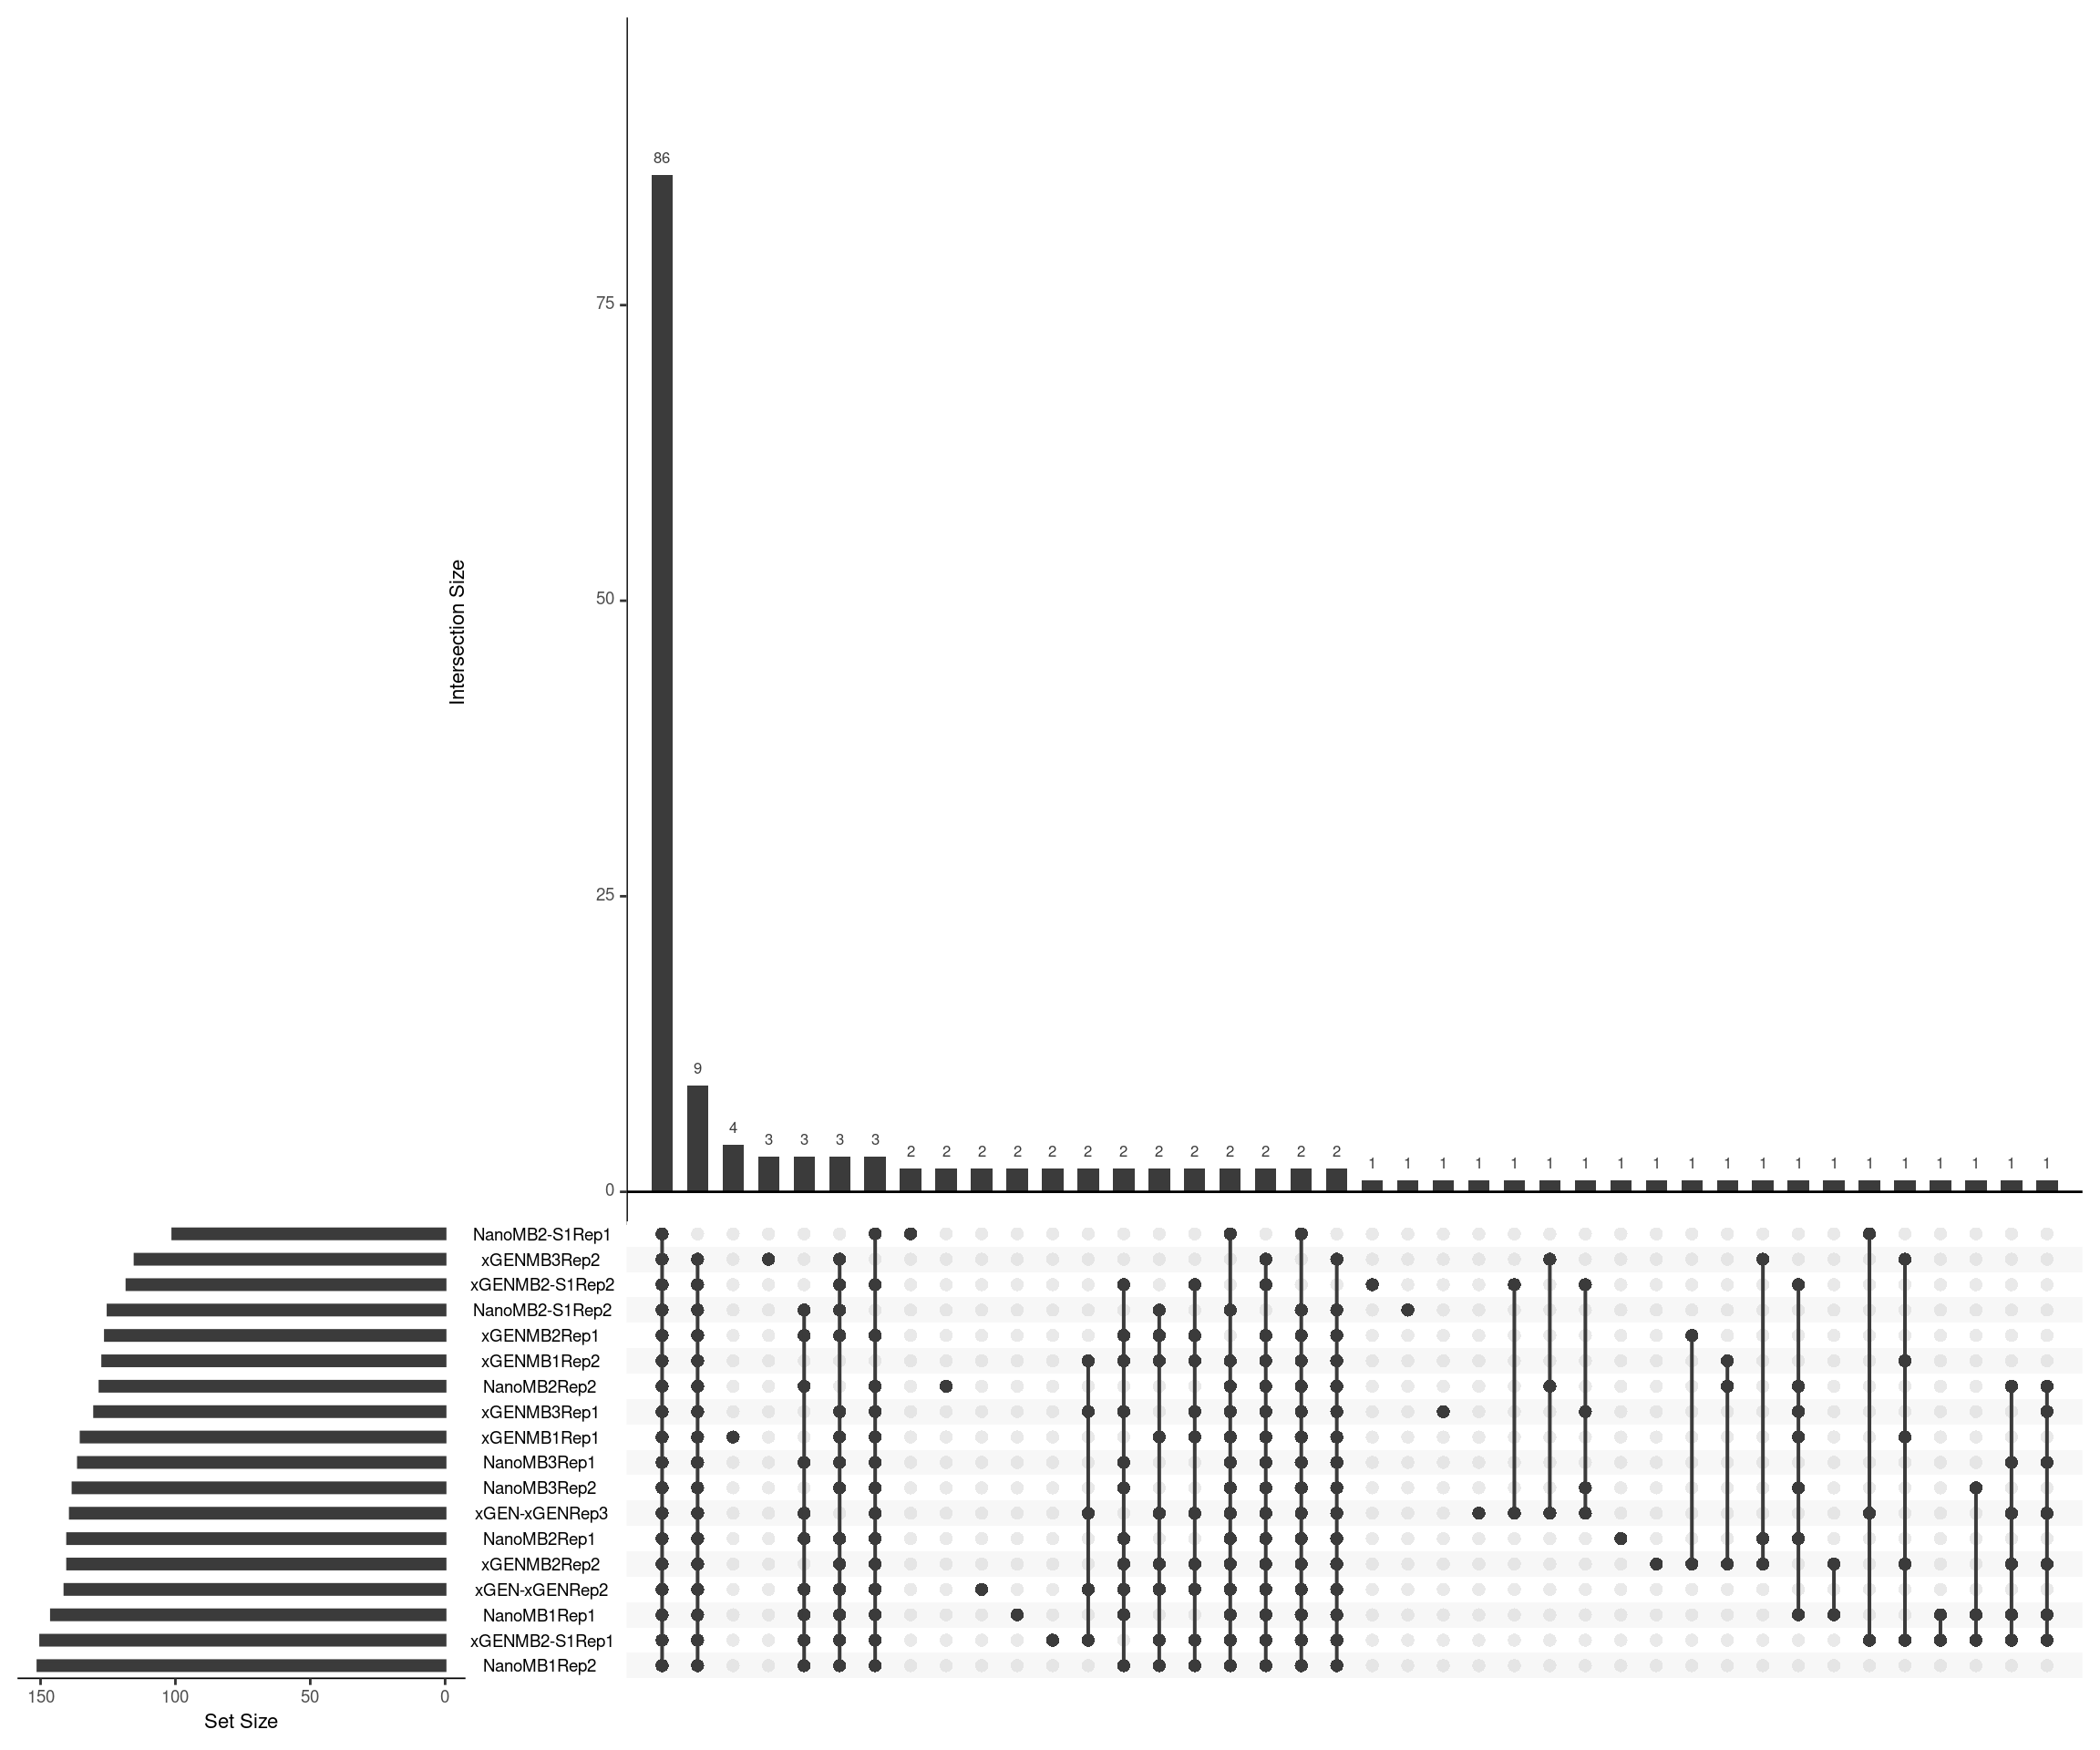
Raw variant calls
In the xGEN-xGEN samples, we compare the unrestricted PCR sample variants (most representative of a typical NGS experiment), called using raw reads (not duplex consensus), compared with the xGEN-xGEN samples with standard-end repair that were PCR restricted.
tmp <- rbind(var_df, var_df_raw)

ulist <- NULL
for(sample in c('xGEN-xGENRep2-HJK2GDSX3', 'xGEN-xGENRep3-HJK2GDSX3', 'xGEN-xGENRep1_default_filter', 'xGEN-xGENRep1_minimal_filter')) {
    ids <- tmp[tmp$sample %in% sample,]$id
    if (length(ids) > 0) {
        ulist[[gsub(pattern = '-HJK2GDSX3', replacement = '', sample)]] <- ids
    }
}

upset(fromList(ulist), order.by='freq', nsets=length(sample_names))
Duplex coverage without requiring SSC
The pipeline was run only requiring a single read on each strand. Here we plot the difference in mean coverage. As we would expect, skipping SSC step increases duplex coverage. For some samples with disproportionately higher single-read families (NanoMB-S1), this increases duplex coverage significantly more.
ccov <- inner_join(qmap_cons_cov,
                   qmap_cons_cov_nossc,
                   by = 'Sample',
                   suffix = c('_ssc', '_nossc')) %>%
          inner_join(., qmap_cov, by = 'Sample')
ccov$sample <- str_split(ccov$Sample, 'Rep') %>% lapply(., dplyr::first) %>% unlist()
ccov$duplex_cov_ratio <- ccov$coverage / ccov$coverage_ssc
ccov$duplex_cov_ratio_noscc <- ccov$coverage / ccov$coverage_nossc
ccov <- left_join(ccov, distinct(mmo[,c('sample', 'protocol', 'nuclease')]), by = 'sample')

p1 <- ggplot(ccov, aes(coverage_ssc, coverage_nossc, colour = protocol, shape = nuclease)) +
  geom_point() +
  theme_bw() +
  xlim(0, 550) +
  ylim(0, 550) +
  xlab('with SSC') +
  ylab('without SSC') +
  geom_abline(slope = 1) +
  theme(legend.position = 'left') +
  scale_colour_brewer(palette = 'Dark2') +
  ggtitle('Mean duplex coverage')

p2 <- ggplot(ccov, aes(duplex_cov_ratio, duplex_cov_ratio_noscc, colour = protocol, shape = nuclease)) +
  geom_point() +
  theme_bw() +
  xlim(0, 100) +
  ylim(0, 100) +
  xlab('with SSC') +
  ylab('without SSC') +
  geom_abline(slope = 1) +
  theme(legend.position = 'right') +
  scale_colour_brewer(palette = 'Dark2') +
  ggtitle('Duplex coverage ratio')

p1 + p2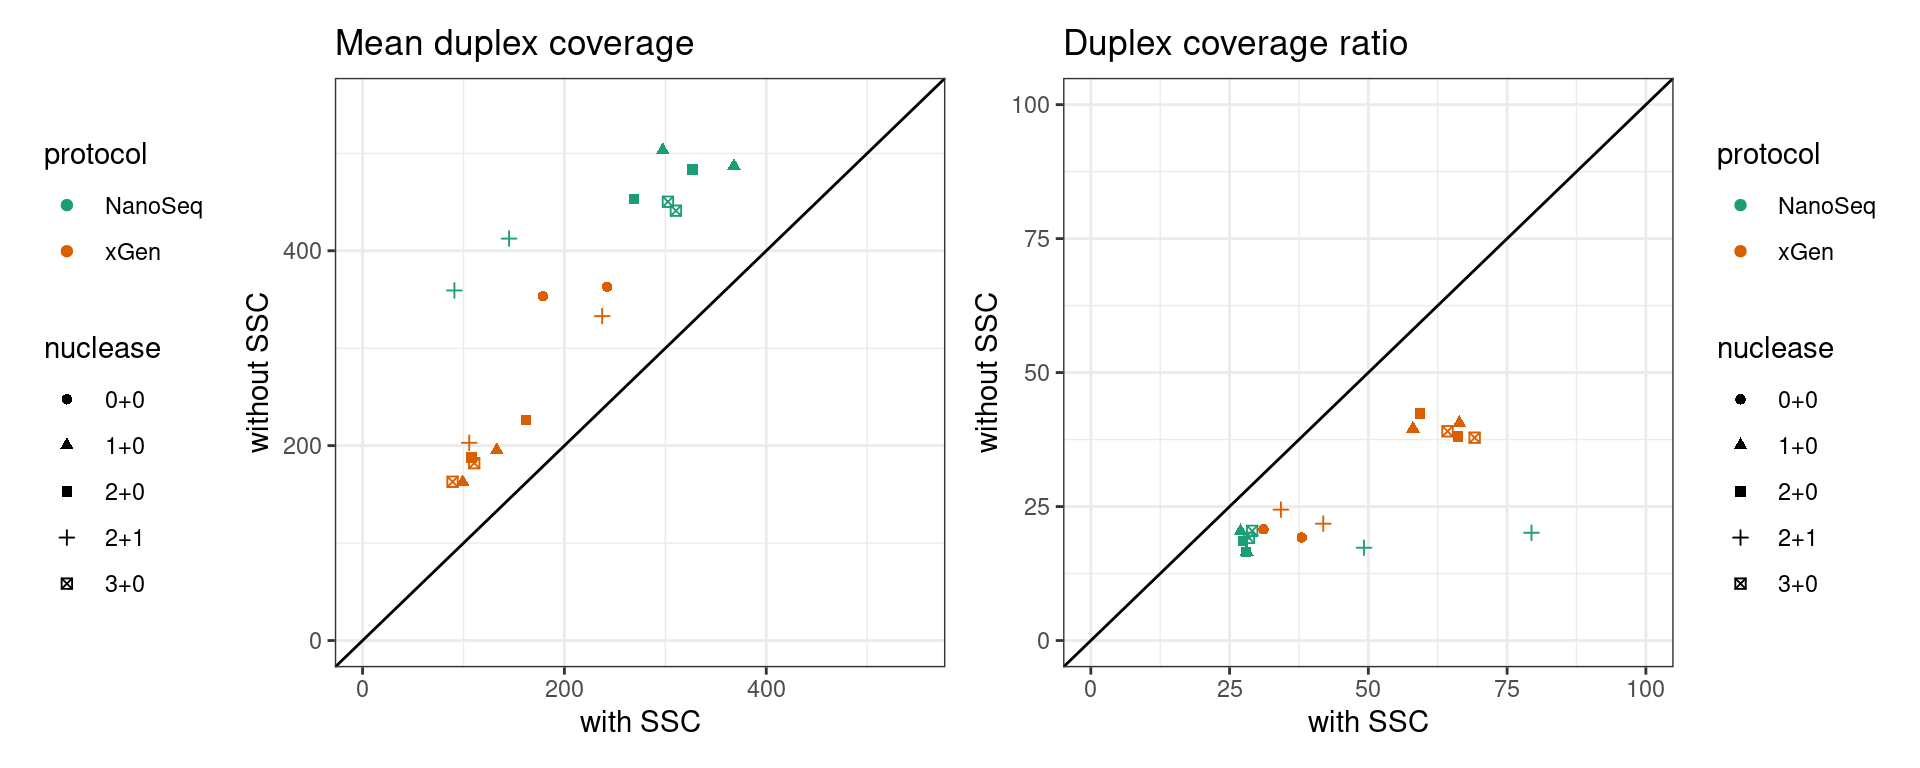
Variant calls without SSC
Here we show the variant calls from the duplex sequences without SSC in the same Upset plot format.
for(sample in sample_names) {
    ids <- var_df_nossc[var_df_nossc$sample %in% sample,]$id
    if (length(ids) > 0) {
        ulist[[sample]] <- ids
    }
}

upset(fromList(ulist), order.by='freq', nsets=length(sample_names))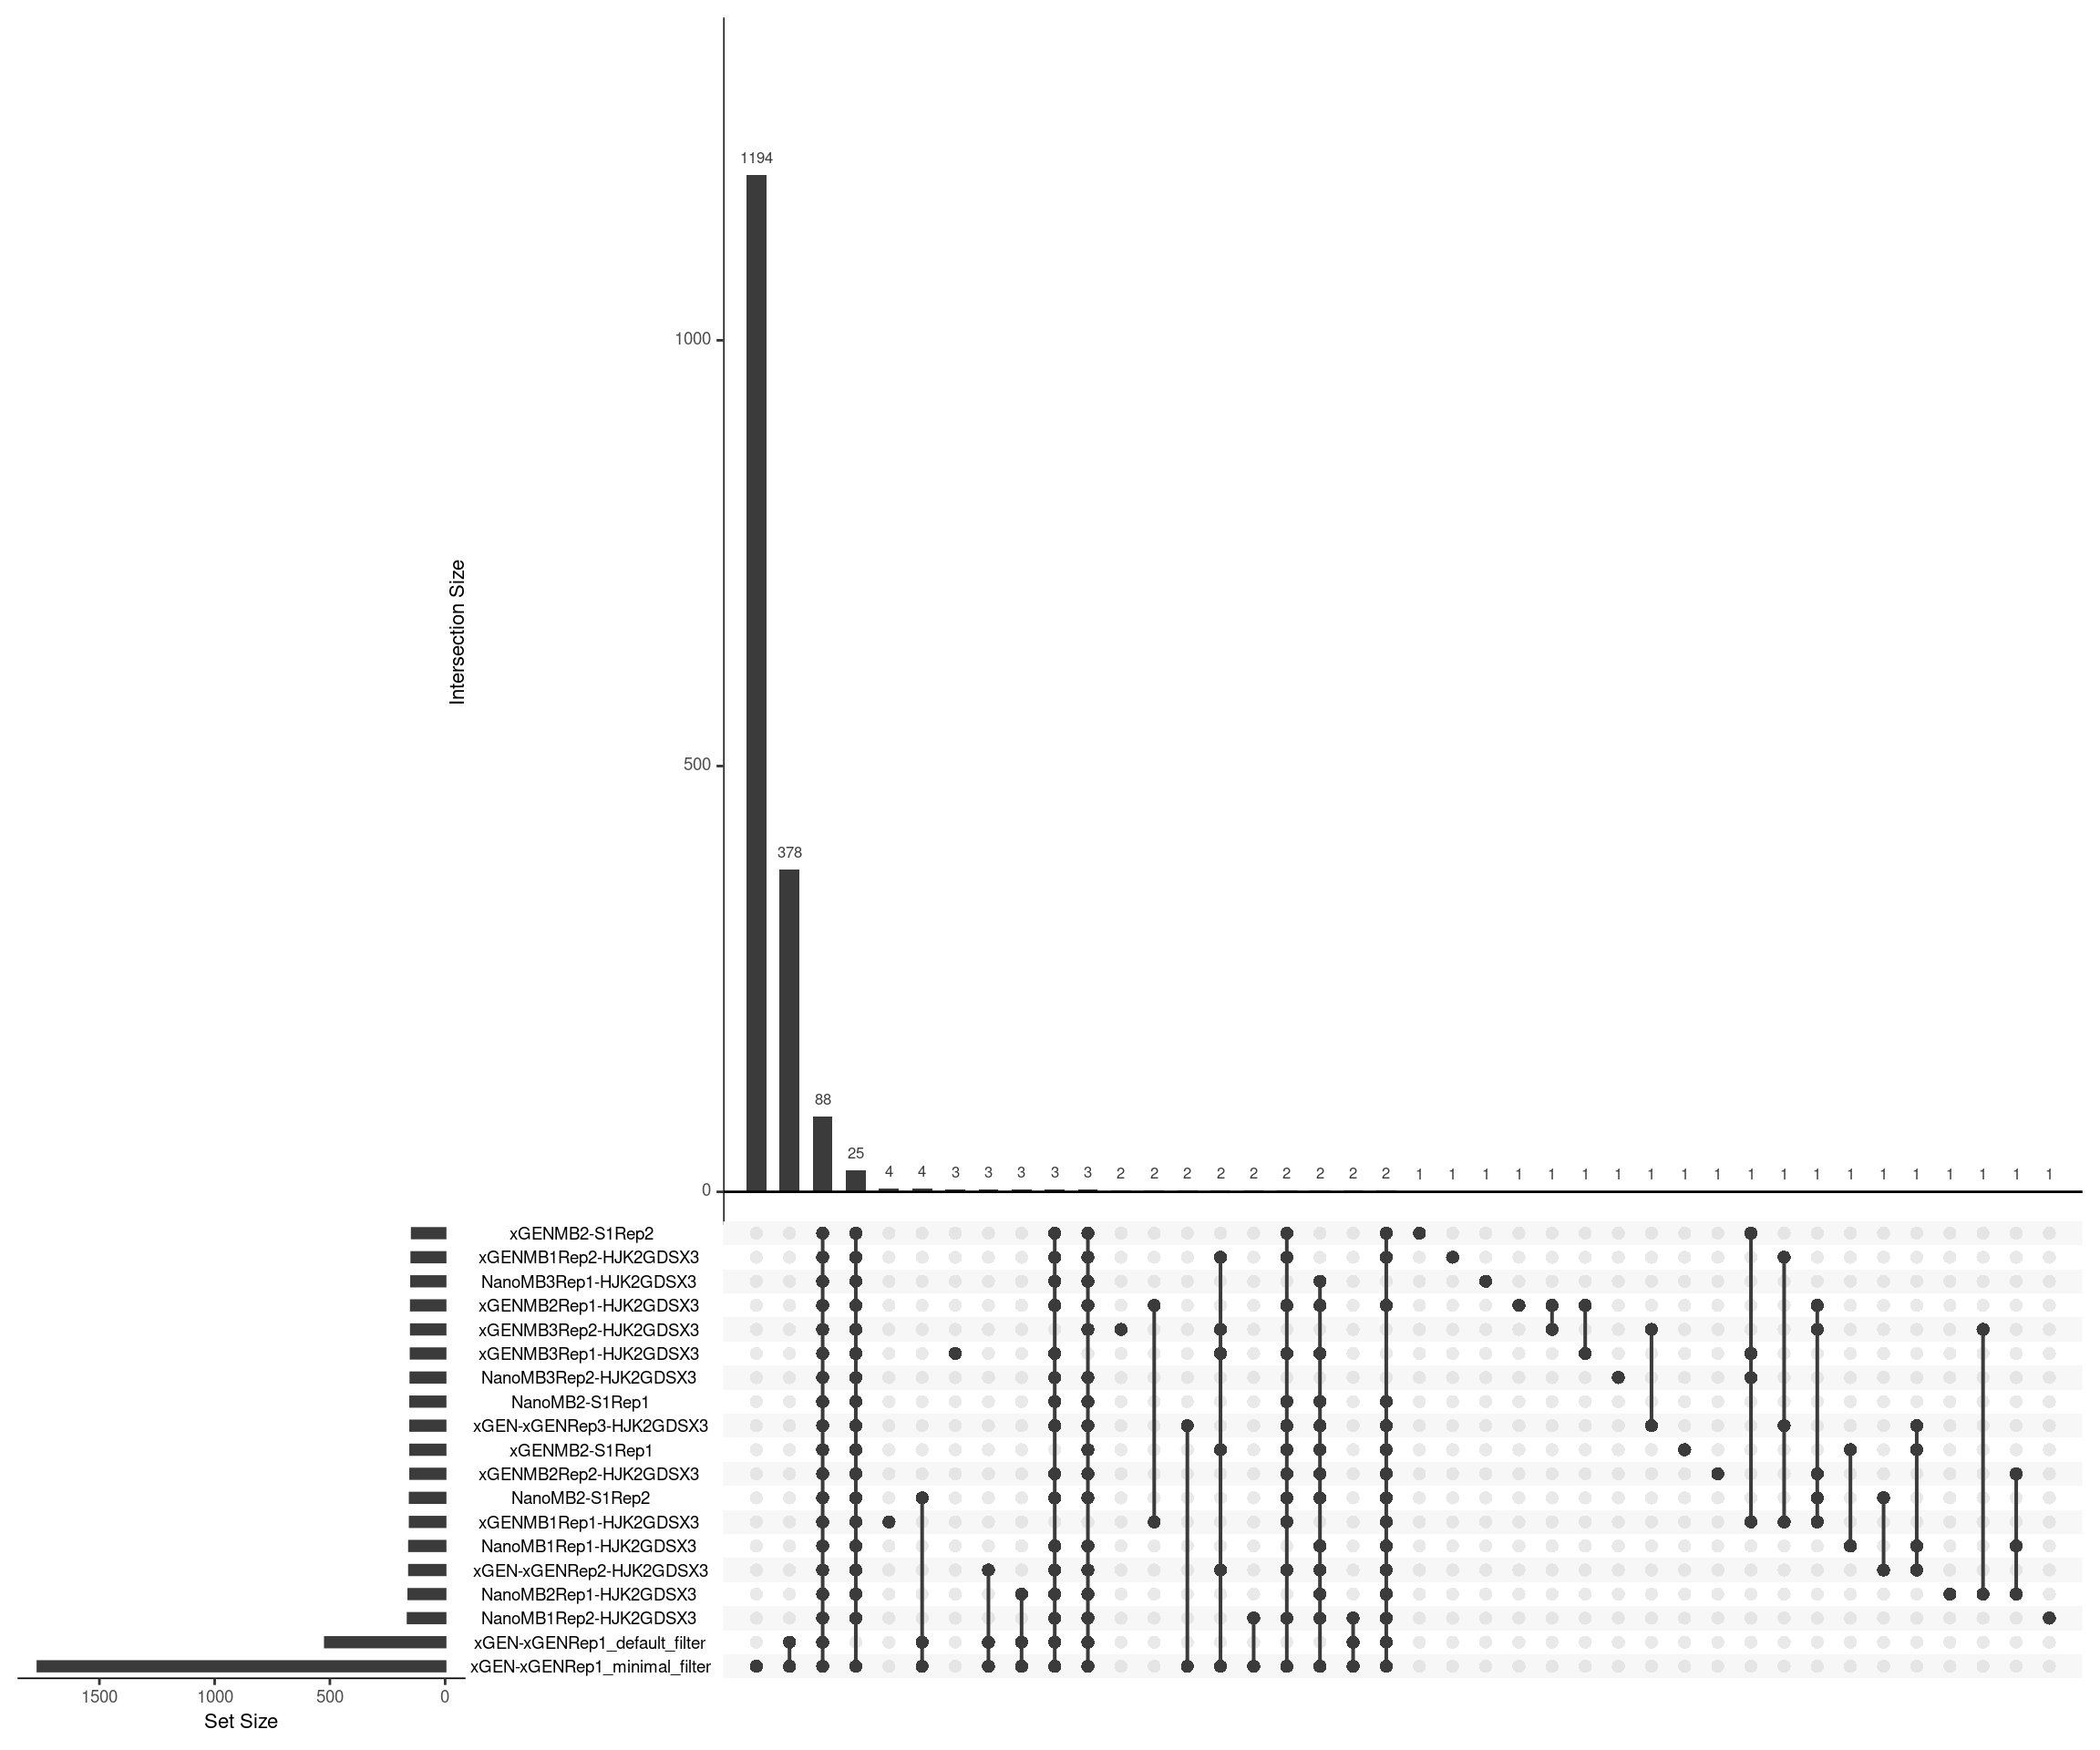
Input cells
Estimate the number of input cells using formula \(d / e / c = n\) where d = mean duplex coverage, e = duplex efficiency, c = coverage per genome equivalent and n = number of cells.
coverage_per_genome <- 10
qmap_cons_cov$Sample <- gsub('-HJK2GDSX3', '', qmap_cons_cov$Sample)
metrics <- inner_join(metrics, qmap_cons_cov, by = c('sample' = 'Sample'))
metrics$estimated_cells <- metrics$coverage / metrics$efficiency / coverage_per_genome

ggplot(metrics[!metrics$sample %in% 'xGEN-xGENRep1',], aes(sample, estimated_cells)) +
    geom_bar(stat = 'identity') +
    theme_minimal() +
    coord_flip()
| Version | Author | Date |
|---|---|---|
| fb1a29c | Marek Cmero | 2022-11-10 |
Efficiency estimation
The NanoSeq paper (Abascal et al.) provides a formula for the estimation of efficiency given the sequencing ratio:
(ppois(q=2-0.1, lambda=seqratio/2, lower.tail=F)/(1-dpois(0, seqratio/2)))^2 / (seqratio/(1-exp(-seqratio)))
This is the zero-truncated poisson probability of selecting >=2 reads squared (as we need two read families to form a duplex), divided by the zero-truncated mean (sequences per family). We can expect this to be an over-estimate of the true efficiency, as the reasons of drop-out beyond sampling are not accounted for.
To start, let’s see how close the efficiency estimation is to the estimate. We will assume 600 cell equivalents were sequenced per E coli sample. Additionally, we estimate the sequencing ratio as follows:
(ESTIMATED_LIBRARY_SIZE / (READ_PAIRS_EXAMINED - READ_PAIR_OPTICAL_DUPLICATES)) * 2
The above numbers can be obtained from the MarkDuplicates output. We multiply this by 2 due to paired-end sequencing. We should be able to estimate this before sequencing, but I’m using the empirical values for this experiment.
We can then estimate the raw coverage as the seqratio mutliplied by the number of cells. Here is what this looks like on this data set:
# prepare efficiency stats and filter out unrestricted xGEN sample
eff <- filter(mm, metric == 'efficiency') %>%
        select(c('sample', 'nuclease', 'protocol', 'value')) %>%
        mutate(cells = 600,
               raw_coverage = qmap_cov$coverage,
               dup_coverage = qmap_cons_cov$coverage) %>%
        rename(value = 'efficiency') %>%
        filter(sample != 'xGEN-xGENRep1')

# re-extract markdup data with library stats
md <- list.files(
        markdup_dir,
        full.names = TRUE,
        recursive = TRUE,
        pattern = 'txt') %>%
        paste('grep -E "Library|LIBRARY"', .) %>%
        lapply(., fread) %>%
        suppressMessages()
md <- md[-9] # remove xGEN-xGENRep1

# calculate sequencing ratio
eff$libsize <- lapply(md, select, ESTIMATED_LIBRARY_SIZE) %>% unlist() %>% as.numeric()
eff$total_reads <- lapply(md, function(x){x$READ_PAIRS_EXAMINED - x$READ_PAIR_OPTICAL_DUPLICATES}) %>% as.numeric()
eff$seqratio <- eff$total_reads / eff$libsize * 2

# estimate duplex coverage from seqratio
eff$est_raw_coverage <- eff$seqratio * eff$cells
eff$est_efficiency <- (ppois(q=2-0.1, lambda=eff$seqratio/2, lower.tail=F)/(1-dpois(0, eff$seqratio/2)))^2 / (eff$seqratio/(1-exp(-eff$seqratio)))
eff$est_dup_coverage <- eff$est_raw_coverage * eff$est_efficiency

# here we add drop-out rate to the mix
eff <- filter(mm, metric == 'drop_out_rate' & sample != 'xGEN-xGENRep1') %>%
        select(c('sample', 'value')) %>%
        rename(value = 'drop_out_rate') %>%
        left_join(eff, ., by = 'sample')

ggplot(eff, aes(raw_coverage, est_raw_coverage, colour=protocol, shape=nuclease)) +
    geom_point() +
    theme_minimal() +
    geom_abline(slope = 1) +
    ylab('Estimated raw coverage') +
    xlab('Raw coverage') +
    ggtitle('Estimated vs. actual raw coverage') +
    scale_colour_brewer(palette = 'Dark2') +
    xlim(0, 10000) + ylim(0, 10000)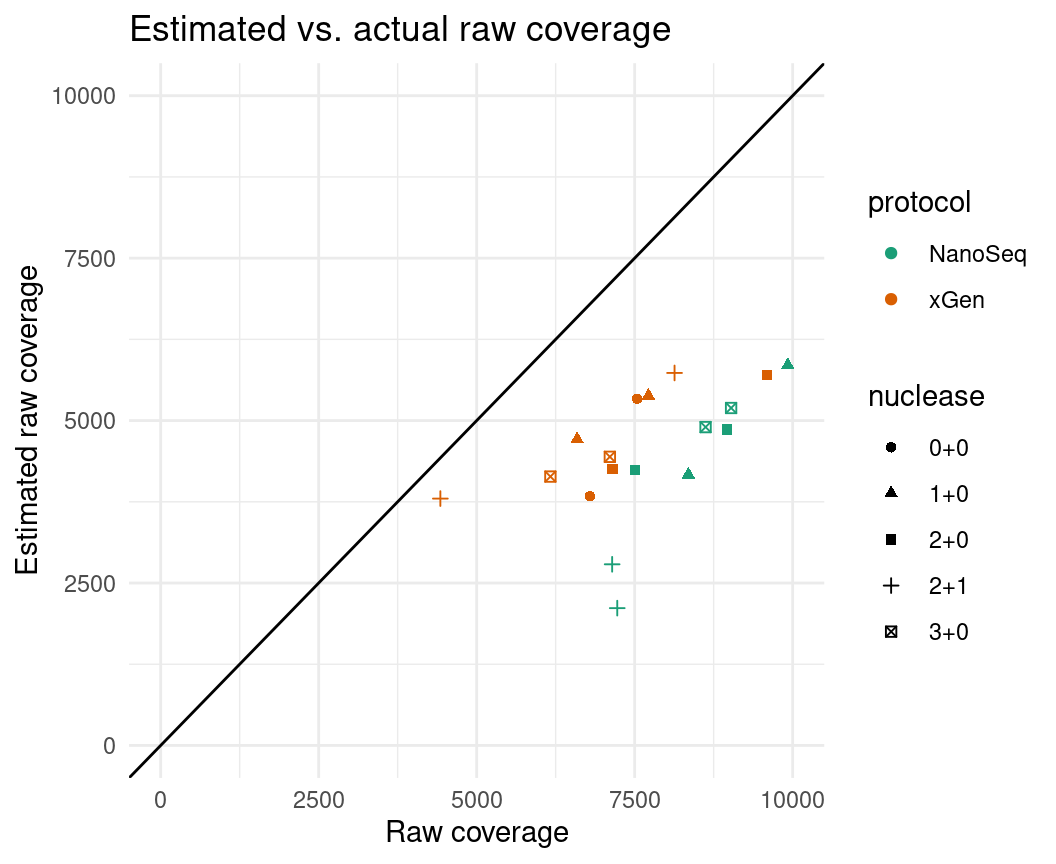
| Version | Author | Date |
|---|---|---|
| 217f414 | mcmero | 2023-01-12 |
We can see that the coverage is under-estimated, which may be due to an under-estimation of the number of input cells.
Now that we have the estimated raw coverage, we can estimate the duplex coverage by multiplying this by the estimated efficiency. Alternatively, we can also obtain this figure from the ppois calculation:
(ppois(q=2-0.1, lambda=seqratio/2, lower.tail=F)/(1-dpois(0, seqratio/2)))^2 * cells
The numerator of the efficiency estimation equation is the estimated duplex yield, so we can multiply this by the cell number to obtain a coverage estimate.
Here’s how the duplex coverage estimates compare for these data:
ggplot(eff, aes(dup_coverage, est_dup_coverage, colour=protocol, shape=nuclease)) +
    geom_point() +
    theme_minimal() +
    geom_abline(slope = 1) +
    ylab('Estimated duplex coverage') +
    xlab('Duplex coverage') +
    ggtitle('Estimated vs. actual duplex coverage') +
    scale_colour_brewer(palette = 'Dark2') +
    xlim(0, 600) + ylim(0, 600)
| Version | Author | Date |
|---|---|---|
| 217f414 | mcmero | 2023-01-12 |
We can see above that we over-estimate the duplex coverage, even though we underestimated the raw coverage. This indicates that the efficiency calculation is too optimistic in real data (which makes sense, it’s a very simple model).
Case in point:
ggplot(eff, aes(efficiency, est_efficiency, colour=protocol, shape=nuclease)) +
    geom_point() +
    theme_minimal() +
    geom_abline(slope = 1) +
    ylab('Estimated efficiency') +
    xlab('Efficiency') +
    ggtitle('Estimated vs. actual efficiency') +
    scale_colour_brewer(palette = 'Dark2') +
    xlim(0, 0.15) + ylim(0, 0.15)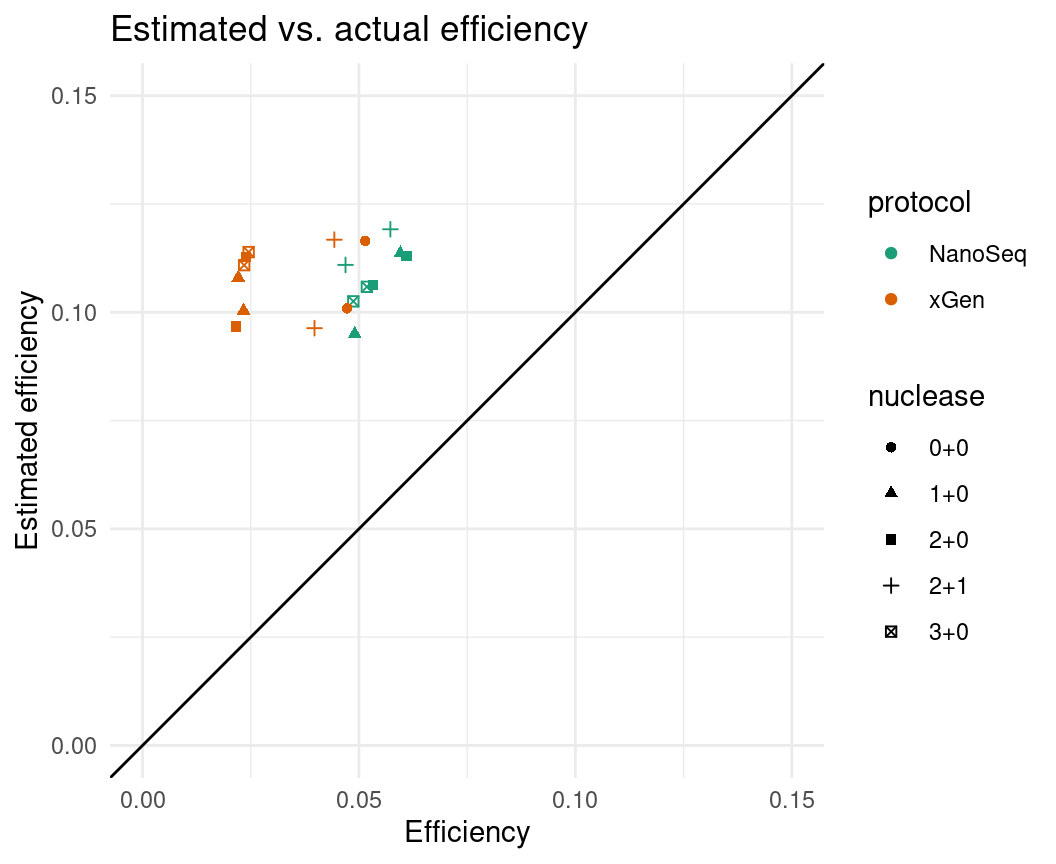
| Version | Author | Date |
|---|---|---|
| 217f414 | mcmero | 2023-01-12 |
We can theoretically multiply the estimated efficiency value by an estimated (or empirically derived) drop-out rate to account for this. To do this, we multiply the estimated duplex coverage by one minus the drop-out rate.
eff$est_dup_coverage_wdo <- eff$est_dup_coverage * (1 - eff$drop_out_rate)
ggplot(eff, aes(dup_coverage, est_dup_coverage_wdo, colour=protocol, shape=nuclease)) +
    geom_point() +
    theme_minimal() +
    geom_abline(slope = 1) +
    ylab('Estimated duplex coverage') +
    xlab('Duplex coverage') +
    ggtitle('Estimated vs. actual duplex coverage with drop-out') +
    scale_colour_brewer(palette = 'Dark2') +
    xlim(0, 600) + ylim(0, 600)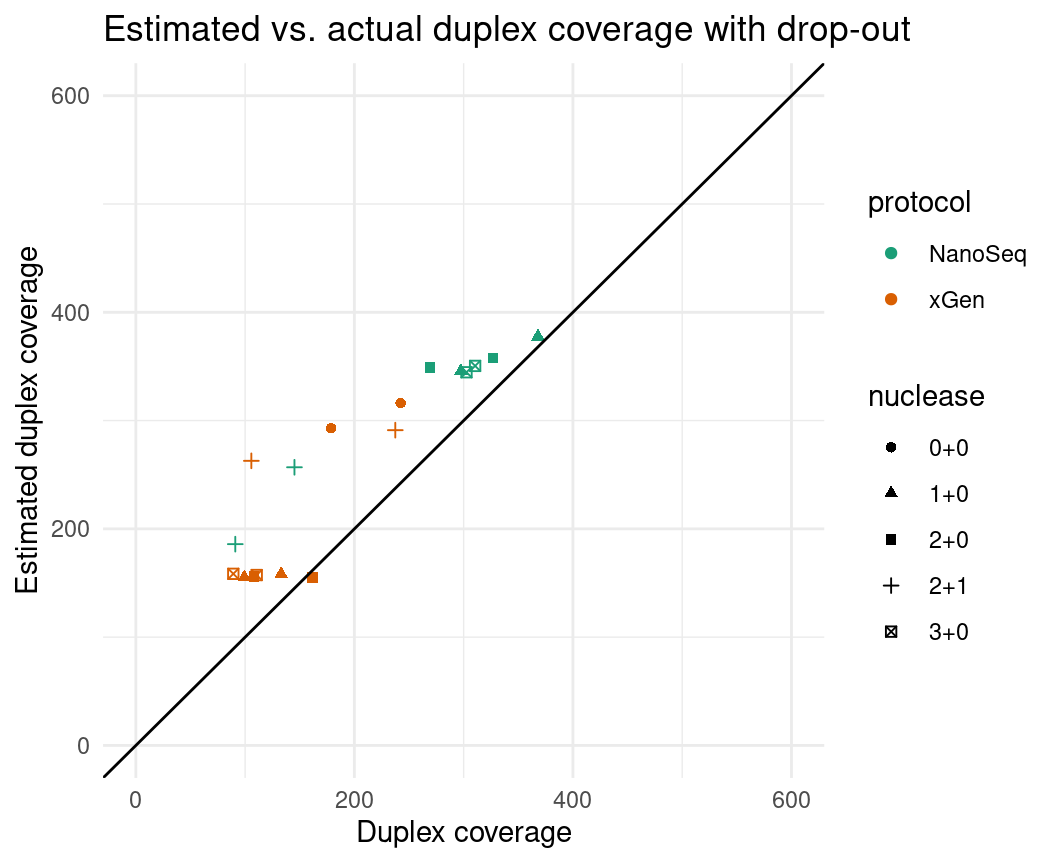
| Version | Author | Date |
|---|---|---|
| 217f414 | mcmero | 2023-01-12 |
Which gives something much closer to the mark. I’m using the drop-out
rates calculated from the data, however. Here’s what happens if we take
a mean drop-out rate (0.448 in these data).
eff$est_dup_coverage_wdo <- eff$est_dup_coverage * (1 - mean(eff$drop_out_rate))

ggplot(eff, aes(dup_coverage, est_dup_coverage_wdo, colour=protocol, shape=nuclease)) +
    geom_point() +
    theme_minimal() +
    geom_abline(slope = 1) +
    ylab('Estimated duplex coverage') +
    xlab('Duplex coverage') +
    ggtitle('Estimated vs. actual duplex coverage with mean drop-out') +
    scale_colour_brewer(palette = 'Dark2') +
    xlim(0, 600) + ylim(0, 600)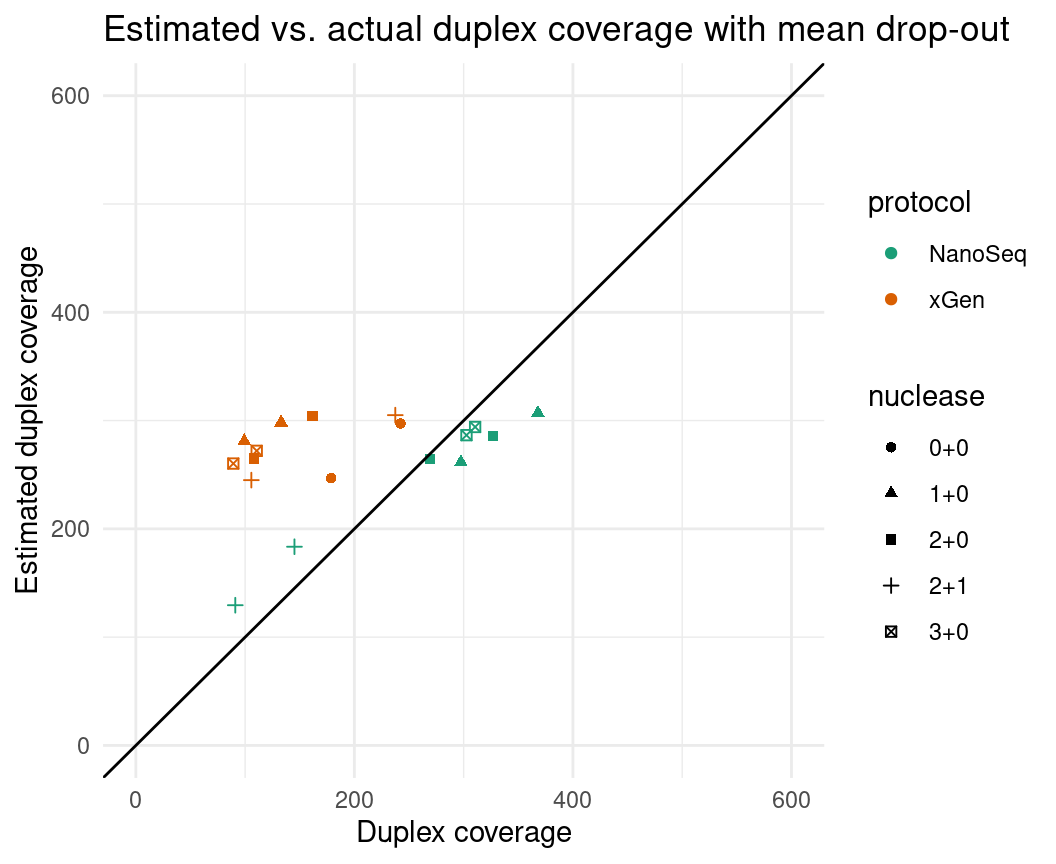
| Version | Author | Date |
|---|---|---|
| 217f414 | mcmero | 2023-01-12 |
Now we’re starting to see the efficiency differences between the protocols making a difference.
Here’s the same data for NanoSeq only, using the average NanoSeq drop-out rate of 0.285.
eff_nano <- filter(eff, protocol == 'NanoSeq')
eff_nano$est_dup_coverage_wdo <- eff_nano$est_dup_coverage * (1 - mean(eff_nano$drop_out_rate))

ggplot(eff_nano, aes(dup_coverage, est_dup_coverage_wdo, shape=nuclease)) +
    geom_point() +
    theme_minimal() +
    geom_abline(slope = 1) +
    ylab('Estimated duplex coverage') +
    xlab('Duplex coverage') +
    ggtitle('NanoSeq estimated vs. actual duplex\ncoverage with mean drop-out') +
    scale_colour_brewer(palette = 'Dark2') +
    xlim(0, 600) + ylim(0, 600)
| Version | Author | Date |
|---|---|---|
| 217f414 | mcmero | 2023-01-12 |
There’s still an over-estimate here, however, the relationship is pretty linear, which means we can adjust for this.
Coverage efficiency
We can also calculate duplex efficiency using the mean duplex coverage over the mean raw coverage. This provides more of a picture of the real duplex output efficiency, as it also accounts for duplex reads that have been filtered out downstream of the family counts (the regular efficiency metric is based on the family counts only). We can see that the coverage efficiency is lower than the efficiency calculated via the family counts. This provides another piece of evidence for why we over-estimate duplex coverage. On average, the real (coverage) efficiency is only ~62% of the pre-filtered family efficiency. We can likely rescue some of these reads by considering single family pairs, or reducing filtering stringency.
eff$real_efficiency <- eff$dup_coverage / eff$raw_coverage

ggplot(eff, aes(efficiency, real_efficiency, colour=protocol, shape=nuclease)) +
    geom_point() +
    theme_minimal() +
    geom_abline(slope = 1) +
    ylab('Coverage efficiency') +
    xlab('Family efficiency') +
    ggtitle('Coverage vs. family efficiency ') +
    scale_colour_brewer(palette = 'Dark2') +
    xlim(0, 0.15) + ylim(0, 0.15)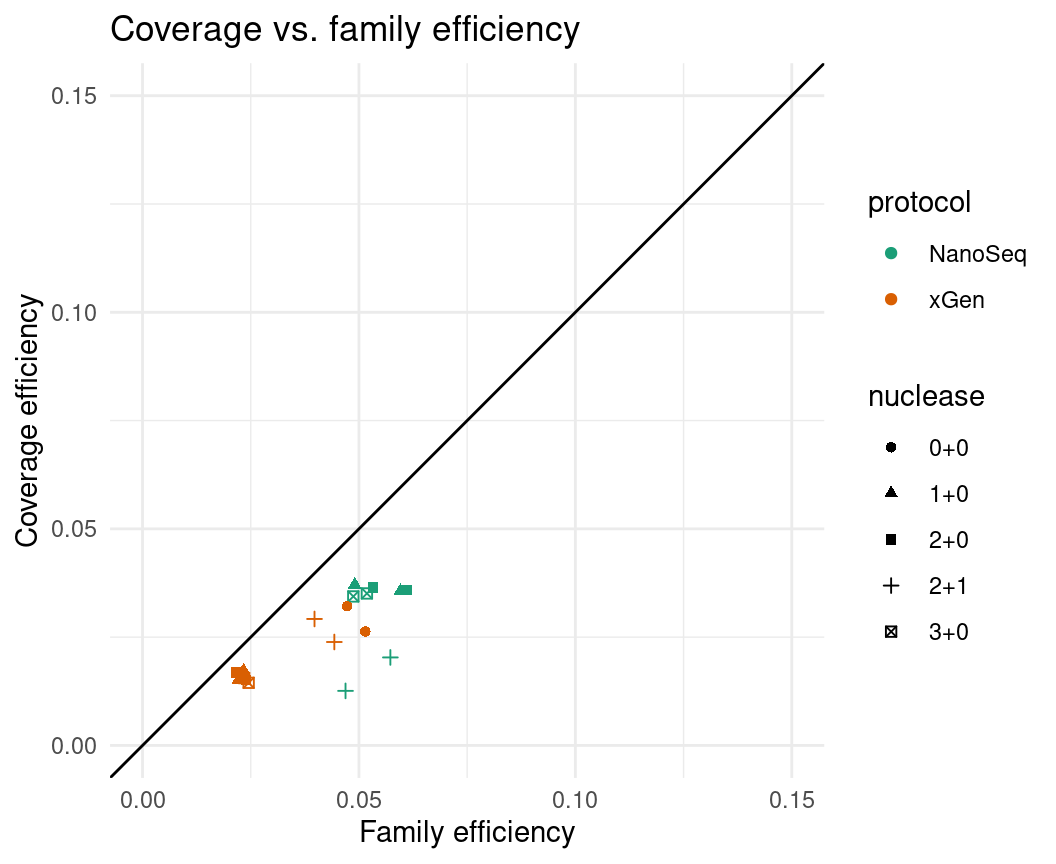
sessionInfo()R version 4.0.5 (2021-03-31)
Platform: x86_64-pc-linux-gnu (64-bit)
Running under: CentOS Linux 7 (Core)
Matrix products: default
BLAS: /stornext/System/data/apps/R/R-4.0.5/lib64/R/lib/libRblas.so
LAPACK: /stornext/System/data/apps/R/R-4.0.5/lib64/R/lib/libRlapack.so
locale:
[1] LC_CTYPE=en_US.UTF-8 LC_NUMERIC=C
[3] LC_TIME=en_US.UTF-8 LC_COLLATE=en_US.UTF-8
[5] LC_MONETARY=en_US.UTF-8 LC_MESSAGES=en_US.UTF-8
[7] LC_PAPER=en_US.UTF-8 LC_NAME=C
[9] LC_ADDRESS=C LC_TELEPHONE=C
[11] LC_MEASUREMENT=en_US.UTF-8 LC_IDENTIFICATION=C
attached base packages:
[1] stats4 parallel stats graphics grDevices utils datasets
[8] methods base
other attached packages:
[1] vcfR_1.12.0 UpSetR_1.4.0 RColorBrewer_1.1-3
[4] patchwork_1.1.1 readxl_1.3.1 seqinr_4.2-8
[7] Rsamtools_2.6.0 Biostrings_2.58.0 XVector_0.30.0
[10] GenomicRanges_1.42.0 GenomeInfoDb_1.26.7 IRanges_2.24.1
[13] S4Vectors_0.28.1 BiocGenerics_0.36.1 stringr_1.4.0
[16] tibble_3.1.7 here_1.0.1 dplyr_1.0.7
[19] data.table_1.14.0 ggplot2_3.3.6 workflowr_1.6.2
loaded via a namespace (and not attached):
[1] nlme_3.1-152 bitops_1.0-7 fs_1.5.0
[4] rprojroot_2.0.2 tools_4.0.5 bslib_0.3.0
[7] utf8_1.2.2 R6_2.5.1 vegan_2.5-7
[10] DBI_1.1.1 mgcv_1.8-35 colorspace_2.0-3
[13] permute_0.9-5 ade4_1.7-18 withr_2.5.0
[16] tidyselect_1.1.1 gridExtra_2.3 compiler_4.0.5
[19] git2r_0.28.0 cli_3.3.0 labeling_0.4.2
[22] sass_0.4.0 scales_1.2.0 digest_0.6.29
[25] rmarkdown_2.11 pkgconfig_2.0.3 htmltools_0.5.2
[28] highr_0.9 fastmap_1.1.0 rlang_1.0.2
[31] rstudioapi_0.13 jquerylib_0.1.4 generics_0.1.1
[34] farver_2.1.0 jsonlite_1.7.2 BiocParallel_1.24.1
[37] RCurl_1.98-1.3 magrittr_2.0.3 GenomeInfoDbData_1.2.4
[40] Matrix_1.3-2 Rcpp_1.0.7 munsell_0.5.0
[43] fansi_1.0.3 ape_5.5 lifecycle_1.0.1
[46] stringi_1.7.5 whisker_0.4 yaml_2.2.1
[49] MASS_7.3-53.1 zlibbioc_1.36.0 plyr_1.8.6
[52] pinfsc50_1.2.0 grid_4.0.5 promises_1.2.0.1
[55] crayon_1.5.1 lattice_0.20-44 splines_4.0.5
[58] knitr_1.33 pillar_1.7.0 reshape2_1.4.4
[61] glue_1.6.2 evaluate_0.14 memuse_4.2-1
[64] vctrs_0.4.1 httpuv_1.6.3 cellranger_1.1.0
[67] gtable_0.3.0 purrr_0.3.4 assertthat_0.2.1
[70] xfun_0.22 later_1.3.0 viridisLite_0.4.0
[73] cluster_2.1.2 ellipsis_0.3.2