Visualize and interpret droplet and pulse-seq topics
Peter Carbonetto
Last updated: 2020-10-20
Checks: 7 0
Knit directory: single-cell-topics/analysis/
This reproducible R Markdown analysis was created with workflowr (version 1.6.2.9000). The Checks tab describes the reproducibility checks that were applied when the results were created. The Past versions tab lists the development history.
Great! Since the R Markdown file has been committed to the Git repository, you know the exact version of the code that produced these results.
Great job! The global environment was empty. Objects defined in the global environment can affect the analysis in your R Markdown file in unknown ways. For reproduciblity it’s best to always run the code in an empty environment.
The command set.seed(1) was run prior to running the code in the R Markdown file. Setting a seed ensures that any results that rely on randomness, e.g. subsampling or permutations, are reproducible.
Great job! Recording the operating system, R version, and package versions is critical for reproducibility.
Nice! There were no cached chunks for this analysis, so you can be confident that you successfully produced the results during this run.
Great job! Using relative paths to the files within your workflowr project makes it easier to run your code on other machines.
Great! You are using Git for version control. Tracking code development and connecting the code version to the results is critical for reproducibility.
The results in this page were generated with repository version 3597a5e. See the Past versions tab to see a history of the changes made to the R Markdown and HTML files.
Note that you need to be careful to ensure that all relevant files for the analysis have been committed to Git prior to generating the results (you can use wflow_publish or wflow_git_commit). workflowr only checks the R Markdown file, but you know if there are other scripts or data files that it depends on. Below is the status of the Git repository when the results were generated:
Ignored files:
    Ignored:    analysis/figure/
    Ignored:    data/droplet.RData
    Ignored:    data/pbmc_68k.RData
    Ignored:    data/pbmc_purified.RData
    Ignored:    data/pulseseq.RData
    Ignored:    output/droplet/diff-count-droplet.RData
    Ignored:    output/droplet/fits-droplet.RData
    Ignored:    output/droplet/rds/
    Ignored:    output/pbmc-68k/fits-pbmc-68k.RData
    Ignored:    output/pbmc-68k/rds/
    Ignored:    output/pbmc-purified/fits-pbmc-purified.RData
    Ignored:    output/pbmc-purified/rds/
    Ignored:    output/pulseseq/diff-count-pulseseq.RData
    Ignored:    output/pulseseq/fits-pulseseq.RData
    Ignored:    output/pulseseq/rds/
Note that any generated files, e.g. HTML, png, CSS, etc., are not included in this status report because it is ok for generated content to have uncommitted changes.
These are the previous versions of the repository in which changes were made to the R Markdown (analysis/plots_tracheal_epithelium.Rmd) and HTML (docs/plots_tracheal_epithelium.html) files. If you’ve configured a remote Git repository (see ?wflow_git_remote), click on the hyperlinks in the table below to view the files as they were in that past version.
| File | Version | Author | Date | Message |
|---|---|---|---|---|
| Rmd | 3597a5e | Peter Carbonetto | 2020-10-20 | workflowr::wflow_publish(“plots_tracheal_epithelium.Rmd”) |
| html | fb5cb48 | Peter Carbonetto | 2020-10-20 | Fixed some plots in plots_tracheal_epithelium analysis. |
| Rmd | e60378e | Peter Carbonetto | 2020-10-20 | workflowr::wflow_publish(“plots_tracheal_epithelium.Rmd”) |
| Rmd | 199ca88 | Peter Carbonetto | 2020-10-17 | Working on analysis of single-cell likelihoods in clusters_droplet.Rmd. |
| Rmd | 70575e0 | Peter Carbonetto | 2020-10-11 | Improved scatterplots in compare_cell_loglik_droplet.R. |
| html | 9171089 | Peter Carbonetto | 2020-10-11 | Added PCA plots to plots_tracheal_epithelium analysis showing |
| Rmd | 56fc8f2 | Peter Carbonetto | 2020-10-11 | workflowr::wflow_publish(“plots_tracheal_epithelium.Rmd”) |
| html | 5ea9a86 | Peter Carbonetto | 2020-10-11 | Re-built plots_tracheal_epithelium page with Gp2 expression plot. |
| Rmd | b9aee6e | Peter Carbonetto | 2020-10-11 | Added PCA plot for expression of Gp2 in droplet data. |
| Rmd | 62834cb | Peter Carbonetto | 2020-10-09 | Working on various exploratory analyses of the droplet and pulse-seq data. |
| html | 09dc8fc | Peter Carbonetto | 2020-10-07 | Build site. |
| Rmd | 15e58e8 | Peter Carbonetto | 2020-10-07 | workflowr::wflow_publish(“plots_tracheal_epithelium.Rmd”) |
| html | 58bc6b6 | Peter Carbonetto | 2020-10-06 | Updated plots_tracheal_epithelium analysis to use new fastTopics plots. |
| Rmd | 0c02f84 | Peter Carbonetto | 2020-10-06 | workflowr::wflow_publish(“plots_tracheal_epithelium.Rmd”, verbose = TRUE) |
| Rmd | 5e57ced | Peter Carbonetto | 2020-10-03 | Working on plots highlighting substructure in T+N cluster. |
| Rmd | 6ce0228 | Peter Carbonetto | 2020-10-02 | Working on flashier_droplet.R script. |
| html | 8a2c99b | Peter Carbonetto | 2020-10-01 | Build site. |
| Rmd | 29e727c | Peter Carbonetto | 2020-10-01 | Minor edits. |
| html | f45cac1 | Peter Carbonetto | 2020-10-01 | Revised text in plots_tracheal_epithelium analysis. |
| Rmd | 3e298ef | Peter Carbonetto | 2020-10-01 | workflowr::wflow_publish(“plots_tracheal_epithelium.Rmd”, verbose = TRUE) |
| html | 0f9607c | Peter Carbonetto | 2020-09-30 | Recreated volcano plots and scatterplots after a few small changes to |
| Rmd | 833a78d | Peter Carbonetto | 2020-09-30 | workflowr::wflow_publish(“plots_tracheal_epithelium.Rmd”, verbose = TRUE) |
| html | bc7ea0e | Peter Carbonetto | 2020-09-29 | In plots_tracheal_epithelium analysis, refined the plots for the basal |
| Rmd | 470bcb7 | Peter Carbonetto | 2020-09-29 | workflowr::wflow_publish(“plots_tracheal_epithelium.Rmd”) |
| html | 98bfcf7 | Peter Carbonetto | 2020-09-29 | Added plots for club cells in plots_tracheal_epithelium analysis. |
| Rmd | 09a4a71 | Peter Carbonetto | 2020-09-29 | workflowr::wflow_publish(“plots_tracheal_epithelium.Rmd”, verbose = TRUE) |
| html | 0ccfc0d | Peter Carbonetto | 2020-09-29 | Added plots for hillock cells in plots_tracheal_epithelium analysis. |
| Rmd | 6a46c50 | Peter Carbonetto | 2020-09-29 | workflowr::wflow_publish(“plots_tracheal_epithelium.Rmd”, verbose = TRUE) |
| html | 9a11392 | Peter Carbonetto | 2020-09-29 | Added plots for basal and proliferating cells to |
| Rmd | 5dc31bc | Peter Carbonetto | 2020-09-29 | workflowr::wflow_publish(“plots_tracheal_epithelium.Rmd”, verbose = TRUE) |
| html | 161cb38 | Peter Carbonetto | 2020-09-29 | Build site. |
| Rmd | b9f3250 | Peter Carbonetto | 2020-09-29 | workflowr::wflow_publish(“plots_tracheal_epithelium.Rmd”, verbose = TRUE) |
| html | b3f5a08 | Peter Carbonetto | 2020-09-29 | Fixed x and y labels in z-score scatterplots in |
| Rmd | 0c50c27 | Peter Carbonetto | 2020-09-29 | workflowr::wflow_publish(“plots_tracheal_epithelium.Rmd”, verbose = TRUE) |
| html | 09d30d6 | Peter Carbonetto | 2020-09-29 | Fixed some of the plots in the plots_tracheal_epithelium analysis. |
| Rmd | 2db338f | Peter Carbonetto | 2020-09-29 | workflowr::wflow_publish(“plots_tracheal_epithelium.Rmd”, verbose = TRUE) |
| Rmd | 4dbb46b | Peter Carbonetto | 2020-09-28 | A couple small edits to the test in the plots_tracheal_epithelium analysis. |
| Rmd | 28f8ec5 | Peter Carbonetto | 2020-09-28 | z-scores in zscore_scatterplot are now shown on sqrt-scale. |
| Rmd | bd72ce4 | Peter Carbonetto | 2020-09-28 | Improved plots for ionocytes and ciliated topics/clusters in plots_tracheal_epithelium analysis. |
| Rmd | ff9d6ef | Peter Carbonetto | 2020-09-28 | Added scatterplots for ciliated cells to plots_tracheal_epithelium analysis. |
| Rmd | 1fab15a | Peter Carbonetto | 2020-09-28 | Added plots for proliferating cells cluster to plots_tracheal_epithelium analysis. |
| Rmd | 920c62f | Peter Carbonetto | 2020-09-27 | Made a couple small edits to plots_tracheal_epithelium.Rmd. |
| Rmd | 50691bf | Peter Carbonetto | 2020-09-26 | Working on volcano plots and scatterplots for club cells in plots_tracheal_epithelium analysis. |
| Rmd | 0e10adf | Peter Carbonetto | 2020-09-26 | Working on volcano plots and scatterplots for basal and hillock cells in plots_tracheal_epithelium analysis. |
| html | 6272c69 | Peter Carbonetto | 2020-09-26 | Build site. |
| Rmd | f9fe3eb | Peter Carbonetto | 2020-09-26 | workflowr::wflow_publish(“plots_tracheal_epithelium.Rmd”) |
| Rmd | 95f91d4 | Peter Carbonetto | 2020-09-26 | Improved functions logfoldchange_scatterplot and zscores_scatterplot in plots.R. |
| Rmd | 73ef439 | Peter Carbonetto | 2020-09-26 | Made some improvements to zscore_scatterplot in plots.R. |
| Rmd | 56bb5fd | Peter Carbonetto | 2020-09-24 | Adding some scatterplots and volcano plots to plots_tracheal_epithelium analysis. |
| html | 6a9691b | Peter Carbonetto | 2020-09-24 | Added volcano plots for T+N celels to plots_tracheal_epithelium |
| Rmd | 7262a96 | Peter Carbonetto | 2020-09-24 | workflowr::wflow_publish(“plots_tracheal_epithelium.Rmd”, verbose = TRUE) |
| html | 30194ad | Peter Carbonetto | 2020-09-24 | Added volcano plots and scatterplot for goblet cells. |
| Rmd | 9e59003 | Peter Carbonetto | 2020-09-24 | workflowr::wflow_publish(“plots_tracheal_epithelium.Rmd”, verbose = TRUE) |
| html | c0fa2db | Peter Carbonetto | 2020-09-24 | Revised plots for ionocytes cluster in plots_tracheal_epithelium |
| Rmd | 81506fb | Peter Carbonetto | 2020-09-24 | workflowr::wflow_publish(“plots_tracheal_epithelium.Rmd”, verbose = TRUE) |
| html | 78d64e9 | Peter Carbonetto | 2020-09-23 | Added ionocytes volcano plot to plots_tracheal_epithelium. |
| Rmd | f0bdbda | Peter Carbonetto | 2020-09-23 | workflowr::wflow_publish(“plots_tracheal_epithelium.Rmd”, verbose = TRUE) |
| html | 361eded | Peter Carbonetto | 2020-09-23 | Added text to accompany ciliated cells volcano plots. |
| Rmd | 8198c07 | Peter Carbonetto | 2020-09-23 | workflowr::wflow_publish(“plots_tracheal_epithelium.Rmd”, verbose = TRUE) |
| html | 23f87bb | Peter Carbonetto | 2020-09-23 | Improved volcano plots for ciliated cell type in |
| Rmd | 516a32e | Peter Carbonetto | 2020-09-23 | workflowr::wflow_publish(“plots_tracheal_epithelium.Rmd”, verbose = TRUE) |
| html | 0ed5061 | Peter Carbonetto | 2020-09-22 | Added some rough, first-draft volcano plots to |
| Rmd | 6ccf998 | Peter Carbonetto | 2020-09-22 | workflowr::wflow_publish(“plots_tracheal_epithelium.Rmd”, verbose = TRUE) |
| Rmd | de36d31 | Peter Carbonetto | 2020-09-22 | Added volcano plots for ciliated cells to plots_tracheal_epithelium analysis. |
| Rmd | 082352a | Peter Carbonetto | 2020-09-22 | Added steps to plots_tracheal_epithelium analysis to compute differential expression statistics. |
| html | 06d0b30 | Peter Carbonetto | 2020-09-22 | I’m starting to revamp the plots_tracheal_epithelium analysis. |
| Rmd | 0877a1f | Peter Carbonetto | 2020-09-22 | workflowr::wflow_publish(“plots_tracheal_epithelium.Rmd”) |
| Rmd | 5af46f1 | Peter Carbonetto | 2020-09-20 | Working on Structure plot for droplet data. |
| Rmd | c072577 | Peter Carbonetto | 2020-09-19 | Re-created structure plot for pulseseq data. |
| Rmd | 942486b | Peter Carbonetto | 2020-09-18 | Fixing merge issue. |
| Rmd | 8cf758e | Peter Carbonetto | 2020-09-12 | Working on improvements to clustering of pulse-seq data. |
| Rmd | a128de5 | Peter Carbonetto | 2020-09-12 | Revamping the analysis of the pulseseq data in plots_tracheal_epithelium. |
| Rmd | 3ab7da1 | Peter Carbonetto | 2020-08-25 | A few minor edits. |
| html | f2e0b23 | Peter Carbonetto | 2020-08-25 | Fixed dimensions of PCA plots in plots_tracheal_epithelium analysis. |
| Rmd | 7b59815 | Peter Carbonetto | 2020-08-25 | workflowr::wflow_publish(“plots_tracheal_epithelium.Rmd”) |
| html | 5589611 | Peter Carbonetto | 2020-08-25 | Added PCA plots and structure plots from pulseseq data. |
| Rmd | b731a4a | Peter Carbonetto | 2020-08-25 | workflowr::wflow_publish(“plots_tracheal_epithelium.Rmd”) |
| html | c3c1b12 | Peter Carbonetto | 2020-08-25 | Build site. |
| Rmd | 2defe6d | Peter Carbonetto | 2020-08-25 | Added crosstab plot to plots_tracheal_epithelium analysis. |
| html | 97c13c2 | Peter Carbonetto | 2020-08-25 | Build site. |
| Rmd | e11855b | Peter Carbonetto | 2020-08-25 | Working on revised analysis of droplet and pulse-seq data sets. |
| html | e11855b | Peter Carbonetto | 2020-08-25 | Working on revised analysis of droplet and pulse-seq data sets. |
| Rmd | bf23ca0 | Peter Carbonetto | 2020-08-20 | Added manual labeling of purified PBMC data to plots_pbmc analysis. |
| Rmd | 077d3d5 | Peter Carbonetto | 2020-08-20 | Added k=9 and k=11 pulseseq fits to plots_tracheal_epithelium analysis. |
| html | 0ce9604 | Peter Carbonetto | 2020-08-20 | Re-built plots_tracheal_epithelium with fastTopics 0.3-162. |
| Rmd | 961570e | Peter Carbonetto | 2020-08-20 | wflow_publish(“plots_tracheal_epithelium.Rmd”) |
| html | b17bfa4 | Peter Carbonetto | 2020-08-19 | Added pulseseq PCA plots to plots_tracheal_epithelium analysis. |
| Rmd | 76dc0c6 | Peter Carbonetto | 2020-08-19 | wflow_publish(“plots_tracheal_epithelium.Rmd”) |
| Rmd | c70612f | Peter Carbonetto | 2020-08-19 | Revised structure plot settings for abundant droplet samples in plots_tracheal_epithelium. |
| html | adda33f | Peter Carbonetto | 2020-08-19 | Fixed another structure plot in plots_tracheal_epithelium analysis. |
| Rmd | 29a9258 | Peter Carbonetto | 2020-08-19 | wflow_publish(“plots_tracheal_epithelium.Rmd”) |
| html | 0a16b60 | Peter Carbonetto | 2020-08-19 | Fixed structure plot in plots_tracheal_epithelium analysis. |
| Rmd | 3a7bd74 | Peter Carbonetto | 2020-08-19 | wflow_publish(“plots_tracheal_epithelium.Rmd”) |
| html | f4bdf19 | Peter Carbonetto | 2020-08-19 | Added explanatory text and improved PC-based manual clustering of |
| Rmd | c7b77ee | Peter Carbonetto | 2020-08-19 | wflow_publish(“plots_tracheal_epithelium.Rmd”) |
| Rmd | 70a4a60 | Peter Carbonetto | 2020-08-19 | Added note to plots_tracheal_epithelium.Rmd. |
| html | fb21b3b | Peter Carbonetto | 2020-08-19 | Added very initial Structure plots to plots_tracheal_epithelium analysis. |
| Rmd | d35cb03 | Peter Carbonetto | 2020-08-19 | wflow_publish(“plots_tracheal_epithelium.Rmd”) |
| html | 368a74a | Peter Carbonetto | 2020-08-19 | Added some text to plots_tracheal_epithelium analysis. |
| Rmd | 223406b | Peter Carbonetto | 2020-08-19 | wflow_publish(“plots_tracheal_epithelium.Rmd”) |
| html | aca46cc | Peter Carbonetto | 2020-08-19 | Added manual clustering of droplet samples based on PCs. |
| Rmd | 38f811b | Peter Carbonetto | 2020-08-19 | wflow_publish(“plots_tracheal_epithelium.Rmd”) |
| Rmd | 343747e | Peter Carbonetto | 2020-08-19 | Small edit to figure dimensions. |
| html | 5a35bbd | Peter Carbonetto | 2020-08-19 | Added labeled PCA plot; adjusted plot dimensions in |
| Rmd | fb91075 | Peter Carbonetto | 2020-08-19 | wflow_publish(“plots_tracheal_epithelium.Rmd”) |
| html | 8b9b528 | Peter Carbonetto | 2020-08-19 | Added more PCA plots to plots_tracheal_epithelium analysis. |
| Rmd | ee7cbf1 | Peter Carbonetto | 2020-08-19 | wflow_publish(“plots_tracheal_epithelium.Rmd”) |
| html | c517ea2 | Peter Carbonetto | 2020-08-18 | Small fix to one of the PCA plots in plots_tracheal_epithelium. |
| Rmd | 8f5c210 | Peter Carbonetto | 2020-08-18 | wflow_publish(“plots_tracheal_epithelium.Rmd”) |
| html | 01afbd2 | Peter Carbonetto | 2020-08-18 | Added some PC plots to the plots_tracheal_epithelium analysis. |
| Rmd | f1c7d02 | Peter Carbonetto | 2020-08-18 | wflow_publish(“plots_tracheal_epithelium.Rmd”) |
| html | 0a04fc1 | Peter Carbonetto | 2020-08-18 | Added abundance plots to plots_tracheal_epithelium analysis. |
| Rmd | f914f7e | Peter Carbonetto | 2020-08-18 | wflow_publish(“plots_tracheal_epithelium.Rmd”) |
| Rmd | 61917ad | Peter Carbonetto | 2020-08-18 | Working on new analysis, plots_tracheal_epithelium.Rmd. |
Here we closely examine the topic modeling results for the two epithelial airway data sets (droplet and pulse-seq), and investigate the benefits of modeling single cells as mixtures of gene expression programs in these data sets. In particular, we compare differential expression in clusters vs. topics.
Load the packages used in the analysis below, as well as additional functions that we will use to generate some of the plots.
library(Matrix)
library(dplyr)
library(fastTopics)
library(ggplot2)
library(ggrepel)
library(cowplot)
source("../code/plots.R")
Droplet data
Load the smaller “droplet” data set, the \(k = 7\) Poisson NMF model fit for these data, the 8 clusters identified in the clustering analysis, and the results of the differential expression analysis.
load("../data/droplet.RData")
load("../output/droplet/diff-count-droplet.RData")
counts_droplet <- counts
samples_droplet <- readRDS("../output/droplet/clustering-droplet.rds")
fit_droplet <- readRDS("../output/droplet/rds/fit-droplet-scd-ex-k=7.rds")$fit
diff_count_droplet <- diff_count_topics
diff_count_clusters_droplet <- diff_count_clusters
diff_count_club_droplet <- diff_count_club
diff_count_basal_droplet <- diff_count_basal
rm(samples,counts)
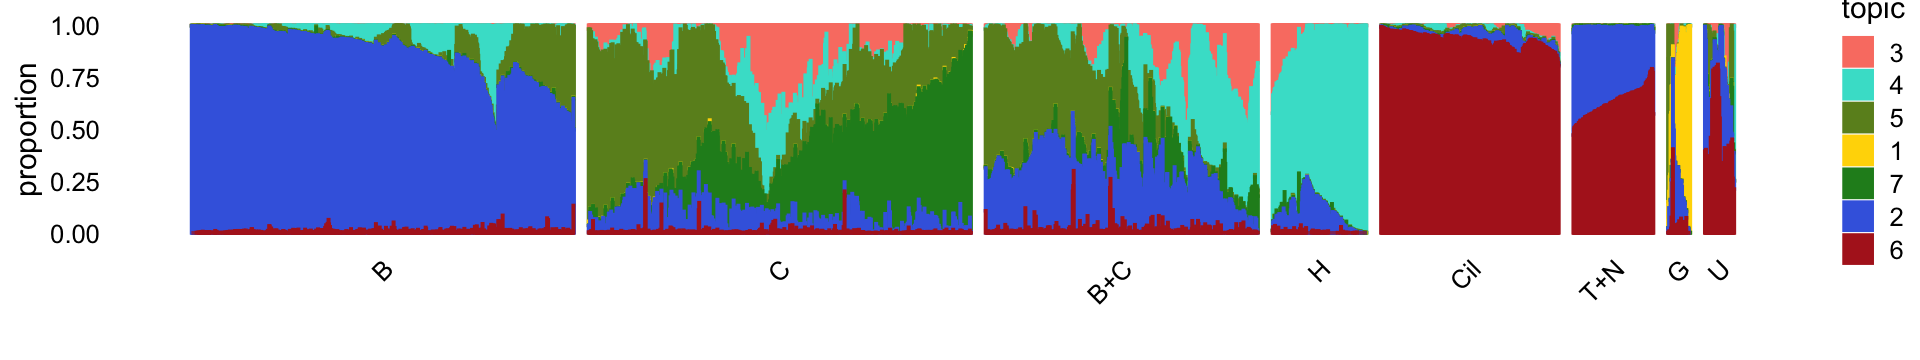
rm(diff_count_topics,diff_count_clusters,diff_count_club,diff_count_basal)For reference, we show here the Structure plot from the clustering analysis of the droplet data. This Structure plot summarizes the topic proportions in each of the 8 subsets (including the background cluster).
It can also be helpful to view the cluster assignments projected onto the principal components of the topic proportions:
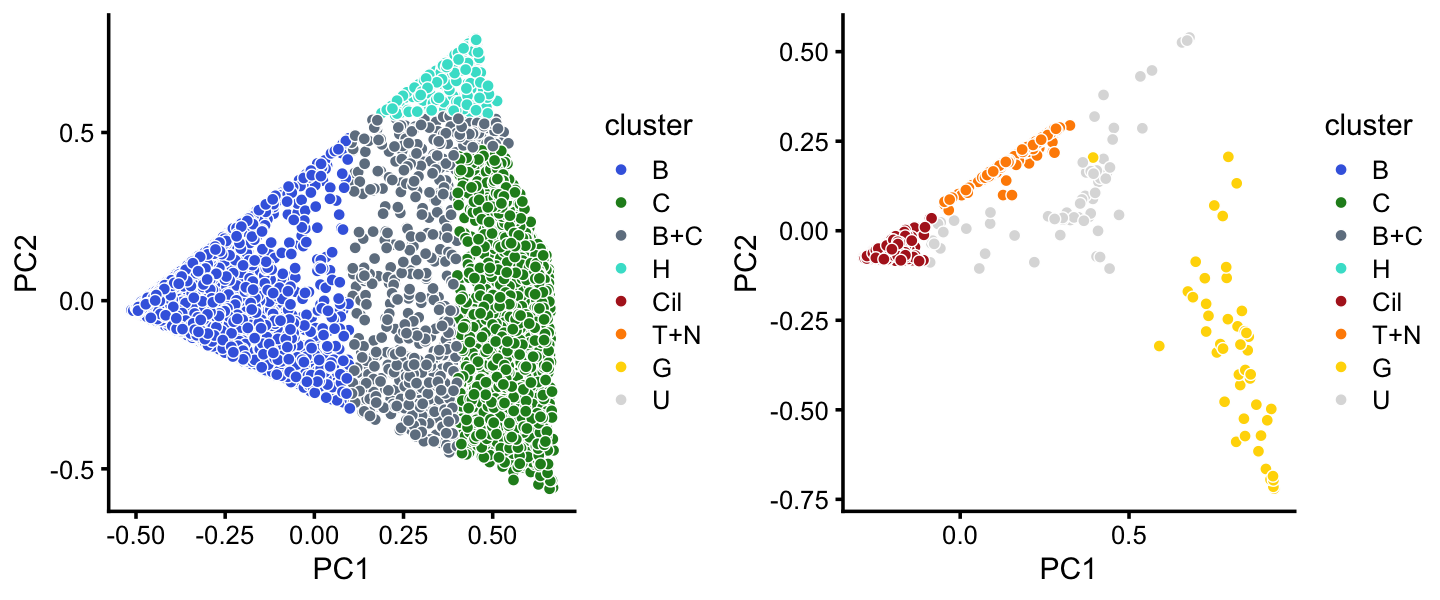
These clusters closely correspond to cell types. To illustrate this point, here we layer the PCA plots with expression of cell-type-specific genes such as Cdhr3 for ciliated cells.
abundant <- c("B","C","B+C","H")
rare     <- c("Cil","T+N","G","U")
rows1 <- which(is.element(samples_droplet$cluster,abundant))
rows2 <- which(is.element(samples_droplet$cluster,rare))
fit1  <- select(poisson2multinom(fit_droplet),loadings = rows1)
fit2  <- select(poisson2multinom(fit_droplet),loadings = rows2)
pp1 <- pca_plot(fit1,pcs = 1:2,fill = log10(counts_droplet[rows1,"Krt5"])) +
       labs(title = "Krt5 (basal)",fill = "log10(count)")
pp2 <- pca_plot(fit1,pcs = 1:2,fill = log10(counts_droplet[rows1,"Scgb1a1"])) +
       labs(title = "Scgb1a1 (club)",fill = "log10(count)")
pp3 <- pca_plot(fit1,pcs = 1:2,fill = log10(counts_droplet[rows1,"Krt13"])) +
       labs(title = "Krt13 (hillock)",fill = "log10(count)")
pp4 <- pca_plot(fit2,pcs = 1:2,fill = log10(counts_droplet[rows2,"Cdhr3"])) +
       labs(title = "Cdhr3 (ciliated)",fill = "log10(count)")
pp5 <- pca_plot(fit2,pcs = 1:2,fill = log10(counts_droplet[rows2,"Chga"])) +
       labs(title = "Chga (neuroendocrine)",fill = "log10(count)")
pp6 <- pca_plot(fit2,pcs = 1:2,fill = log10(counts_droplet[rows2,"Gnat3"])) +
       labs(title = "Gnat3 (tuft)",fill = "log10(count)")
pp7 <- pca_plot(fit2,pcs = 1:2,fill = log10(counts_droplet[rows2,"Gp2"])) +
       labs(title = "Gp2 (goblet)",fill = "log10(count)")
plot_grid(pp1,pp2,pp3,pp4,pp5,pp6,pp7,nrow = 3,ncol = 3)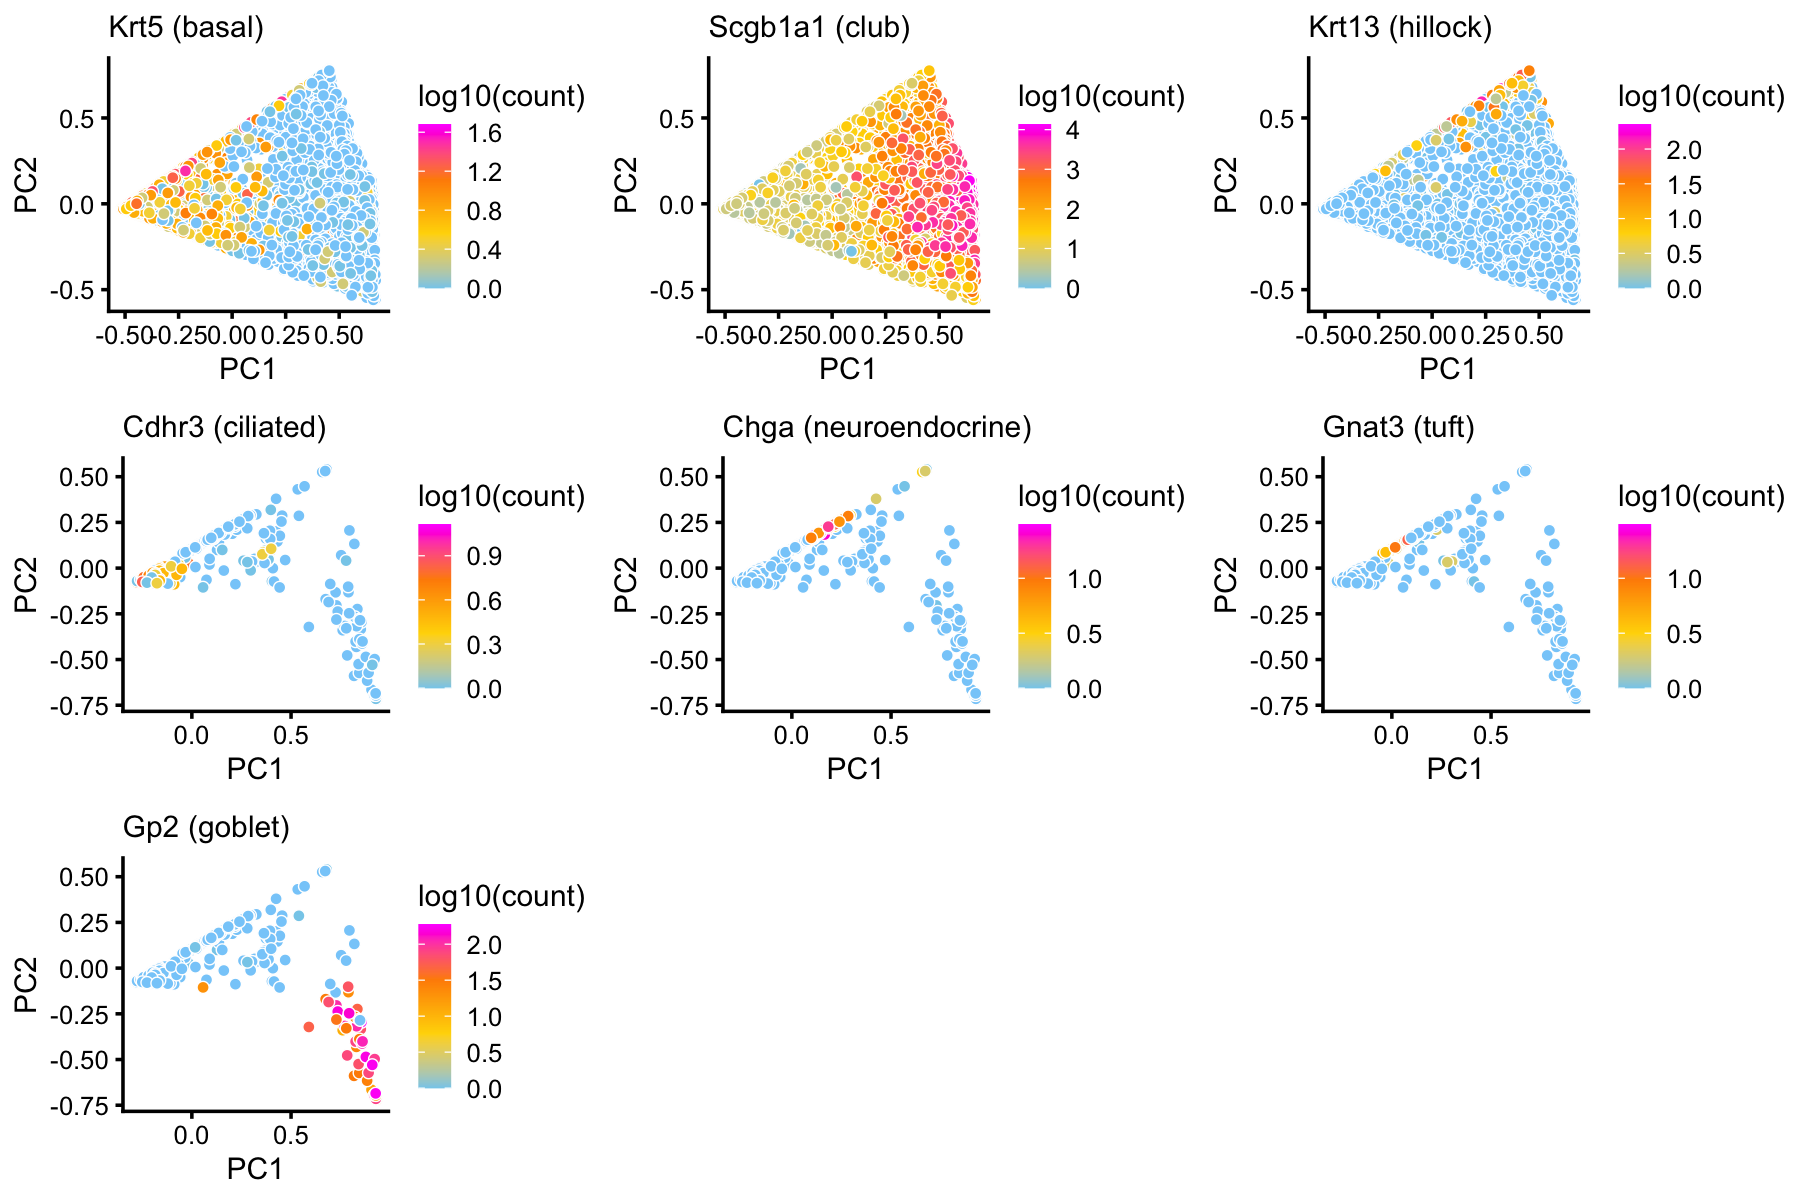
Pulse-seq data
Next, we load the larger “pulse-seq” data set, the \(k = 11\) Poisson NMF model fit for these data, and the 7 clusters identified in the clustering analysis.
load("../data/pulseseq.RData")
load("../output/pulseseq/diff-count-pulseseq.RData")
counts_pulseseq <- counts
samples_pulseseq <- readRDS("../output/pulseseq/clustering-pulseseq.rds")
fit_pulseseq <- readRDS("../output/pulseseq/rds/fit-pulseseq-scd-ex-k=11.rds")$fit
diff_count_pulseseq <- diff_count_topics
diff_count_clusters_pulseseq <- diff_count_clusters
diff_count_hillock_pulseseq <- diff_count_hillock
diff_count_bc_pulseseq <- diff_count_bc
rm(samples,counts)
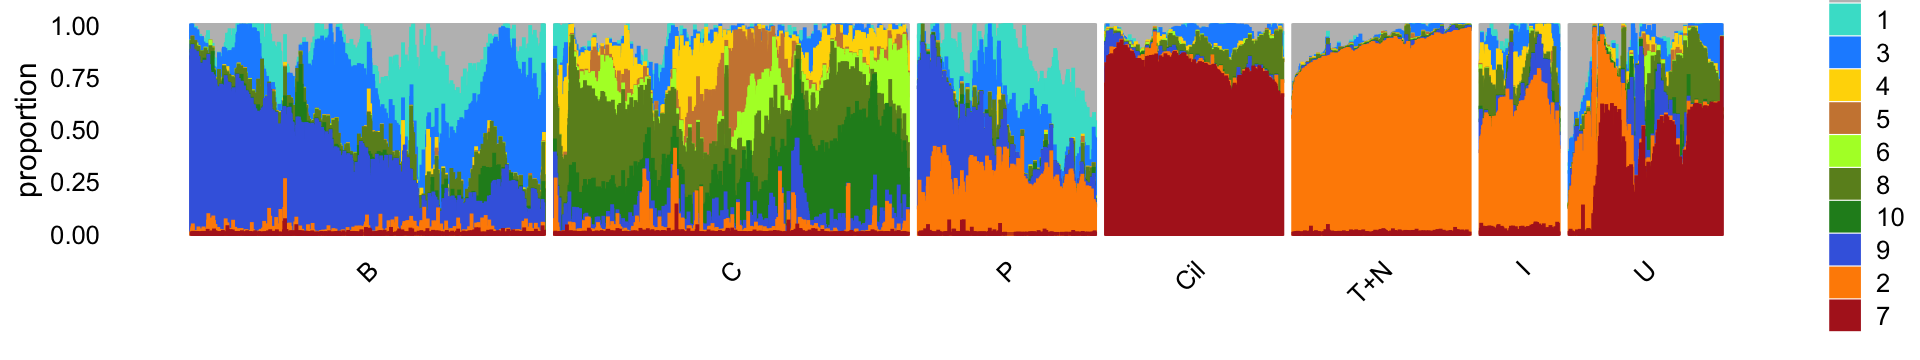
rm(diff_count_topics,diff_count_clusters,diff_count_hillock,diff_count_bc)For reference, we show here the Structure plot from the clustering analysis of the pulse-seq data. This Structure plot summarizes the topic proportions in each of the 7 subsets (including the background cluster):
It can also be helpful to view the cluster assignments projected onto the principal components of the topic proportions:
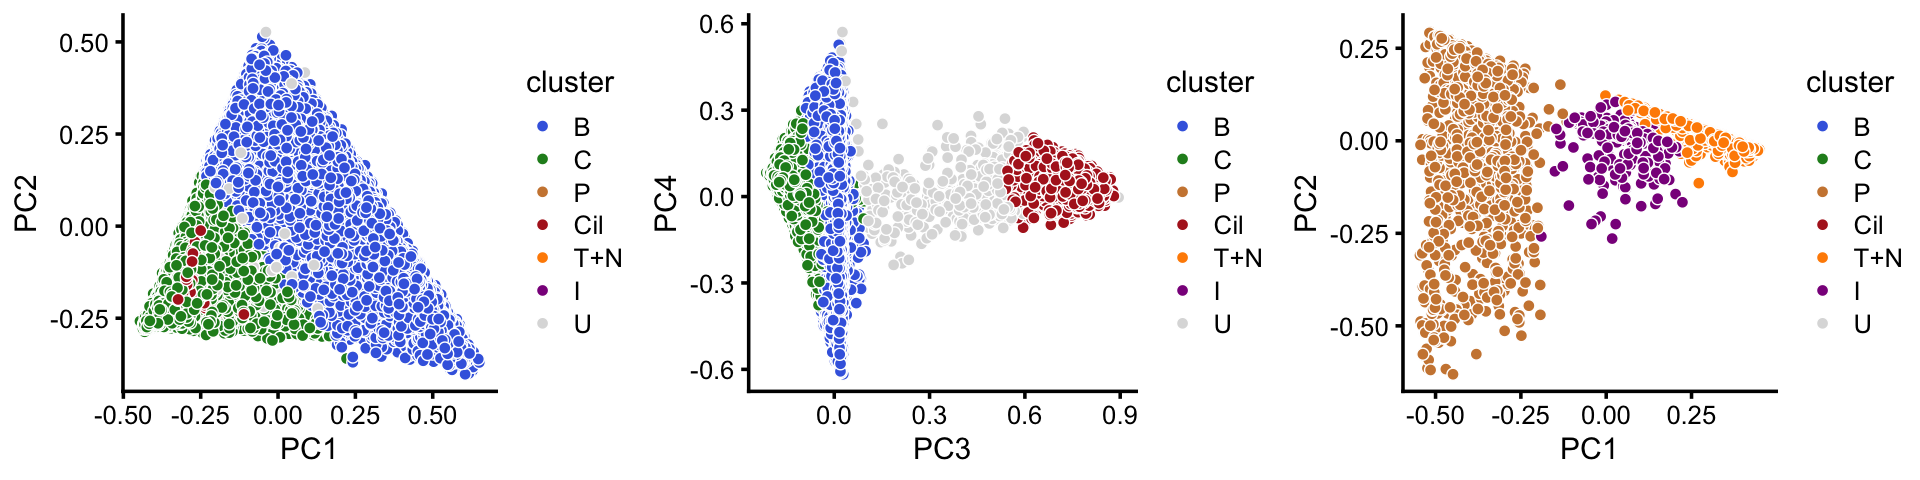
These clusters closely correspond to cell types. To illustrate this point, here we layer the PCA plots with expression of cell-type-specific genes such as Cdhr3 for ciliated cells.
abundant <- c("B","C","Cil","U")
rare     <- c("T+N","I","P")
rows1 <- which(is.element(samples_pulseseq$cluster,abundant))
rows2 <- which(is.element(samples_pulseseq$cluster,rare))
fit1  <- select(poisson2multinom(fit_pulseseq),loadings = rows1)
fit2  <- select(poisson2multinom(fit_pulseseq),loadings = rows2)
pp8  <- pca_plot(fit1,pcs = 1:2,fill = log10(counts_pulseseq[rows1,"Krt5"])) +
        labs(title = "Krt5 (basal)",fill = "log10(count)")
pp9  <- pca_plot(fit1,pcs = 1:2,fill=log10(counts_pulseseq[rows1,"Scgb1a1"])) +
        labs(title = "Scgb1a1 (club)",fill = "log10(count)")
pp10  <- pca_plot(fit1,pcs = 3:4,fill = log10(counts_pulseseq[rows1,"Cdhr3"])) +
        labs(title = "Cdhr3 (ciliated)",fill = "log10(count)")
pp11 <- pca_plot(fit2,pcs = 1:2,fill = log10(counts_pulseseq[rows2,"Chga"])) +
        labs(title = "Chga (neuroendocrine)",fill = "log10(count)")
pp12 <- pca_plot(fit2,pcs = 1:2,fill = log10(counts_pulseseq[rows2,"Gnat3"])) +
        labs(title = "Gnat3 (tuft)",fill = "log10(count)")
pp13 <- pca_plot(fit2,pcs = 1:2,fill = log10(counts_pulseseq[rows2,"Cftr"])) +
        labs(title = "Cftr (ionocyte)",fill = "log10(count)")
pp14 <- pca_plot(fit2,pcs = 1:2,fill = log10(counts_pulseseq[rows2,"Cdk1"])) +
        labs(title = "Cdk1 (proliferating)",fill = "log10(count)")
plot_grid(pp8,pp9,pp10,pp11,pp12,pp13,pp14,nrow = 3,ncol = 3)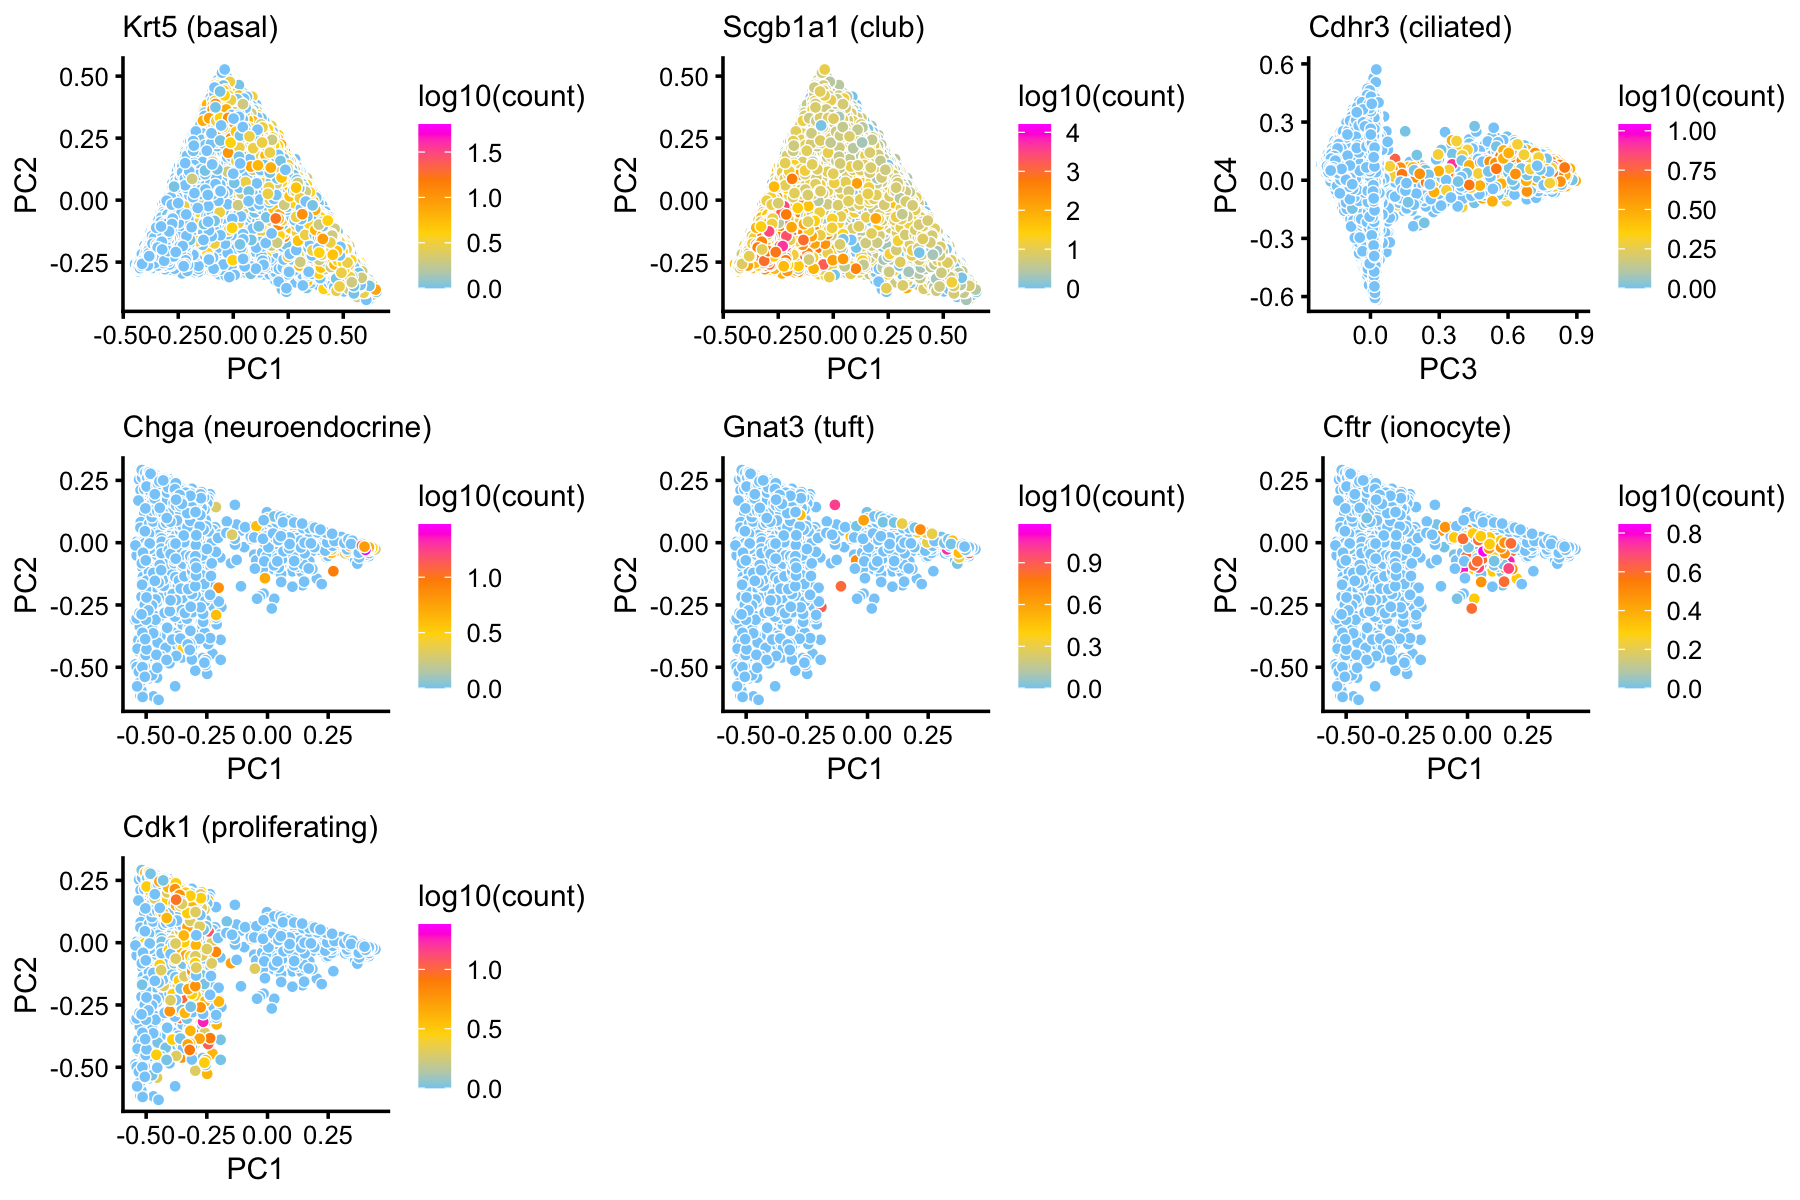
Ciliated cells
We begin with the cluster that captures ciliated cells. This cluster is one of the most distinctive in both the droplet and pulse-seq data sets. Ciliated cells are abundant, though not as much as basal and club cells.
ciliated_genes <- c("Ccdc113","Ccdc153","Cdhr3","Foxj1","Lztfl1","Mlf1")
p1 <- volcano_plot_with_highlighted_genes(diff_count_clusters_droplet,"Cil",
                                          ciliated_genes,
                                          label_above_quantile = 0.998)
print(p1)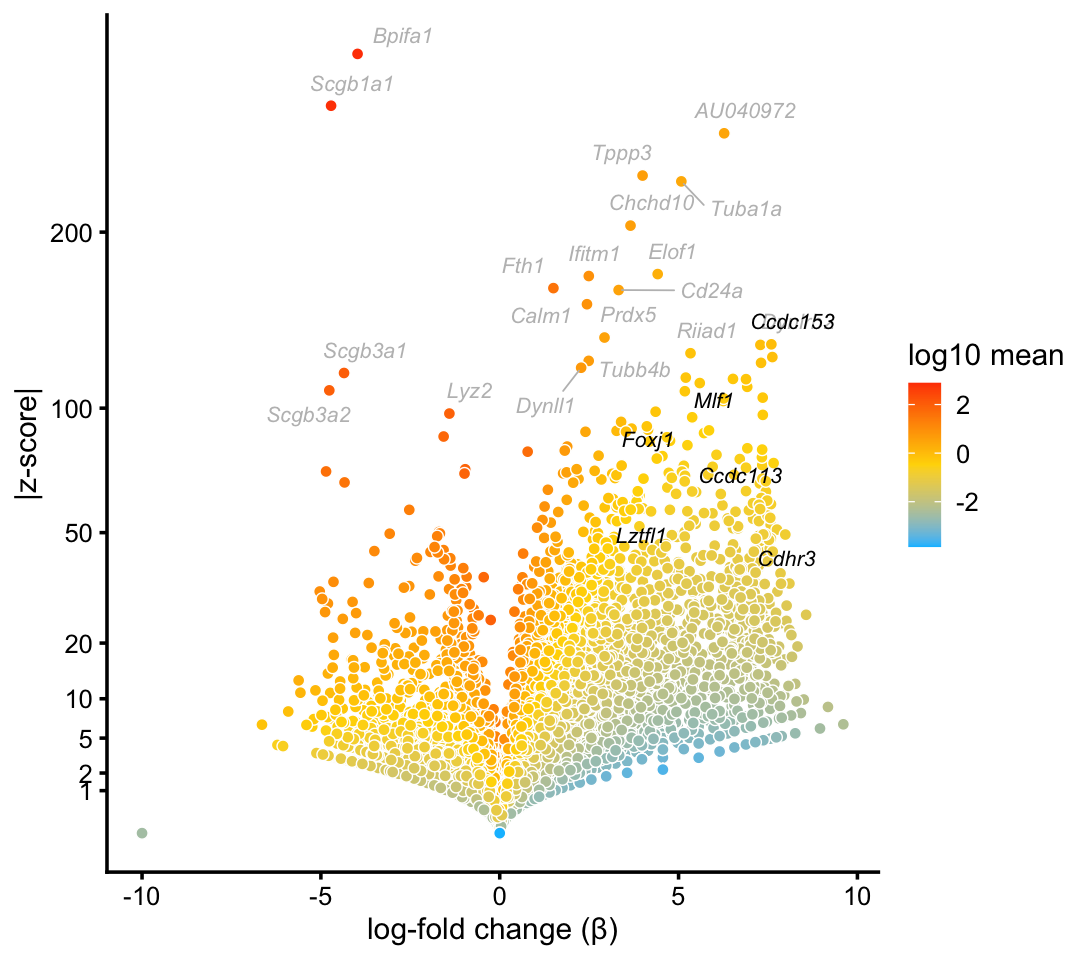
| Version | Author | Date |
|---|---|---|
| fb5cb48 | Peter Carbonetto | 2020-10-20 |
| 9171089 | Peter Carbonetto | 2020-10-11 |
| 5ea9a86 | Peter Carbonetto | 2020-10-11 |
| 09dc8fc | Peter Carbonetto | 2020-10-07 |
| 58bc6b6 | Peter Carbonetto | 2020-10-06 |
| 8a2c99b | Peter Carbonetto | 2020-10-01 |
| f45cac1 | Peter Carbonetto | 2020-10-01 |
| 0f9607c | Peter Carbonetto | 2020-09-30 |
| bc7ea0e | Peter Carbonetto | 2020-09-29 |
| 98bfcf7 | Peter Carbonetto | 2020-09-29 |
| 0ccfc0d | Peter Carbonetto | 2020-09-29 |
| 9a11392 | Peter Carbonetto | 2020-09-29 |
| b3f5a08 | Peter Carbonetto | 2020-09-29 |
| 09d30d6 | Peter Carbonetto | 2020-09-29 |
| 6272c69 | Peter Carbonetto | 2020-09-26 |
| 6a9691b | Peter Carbonetto | 2020-09-24 |
| 30194ad | Peter Carbonetto | 2020-09-24 |
| c0fa2db | Peter Carbonetto | 2020-09-24 |
| 78d64e9 | Peter Carbonetto | 2020-09-23 |
| 361eded | Peter Carbonetto | 2020-09-23 |
| 23f87bb | Peter Carbonetto | 2020-09-23 |
| 0ed5061 | Peter Carbonetto | 2020-09-22 |
Marker genes and transcription factors identified in Montoro et al (2018) are highlighted in black, and other top differentially expressed genes are shown with gray labels.
We obtain similar top differentially expressed genes in the pulse-seq data:
p2 <- volcano_plot_with_highlighted_genes(diff_count_clusters_pulseseq,"Cil",
                                          ciliated_genes,
                                          label_above_quantile = 0.998)
print(p2)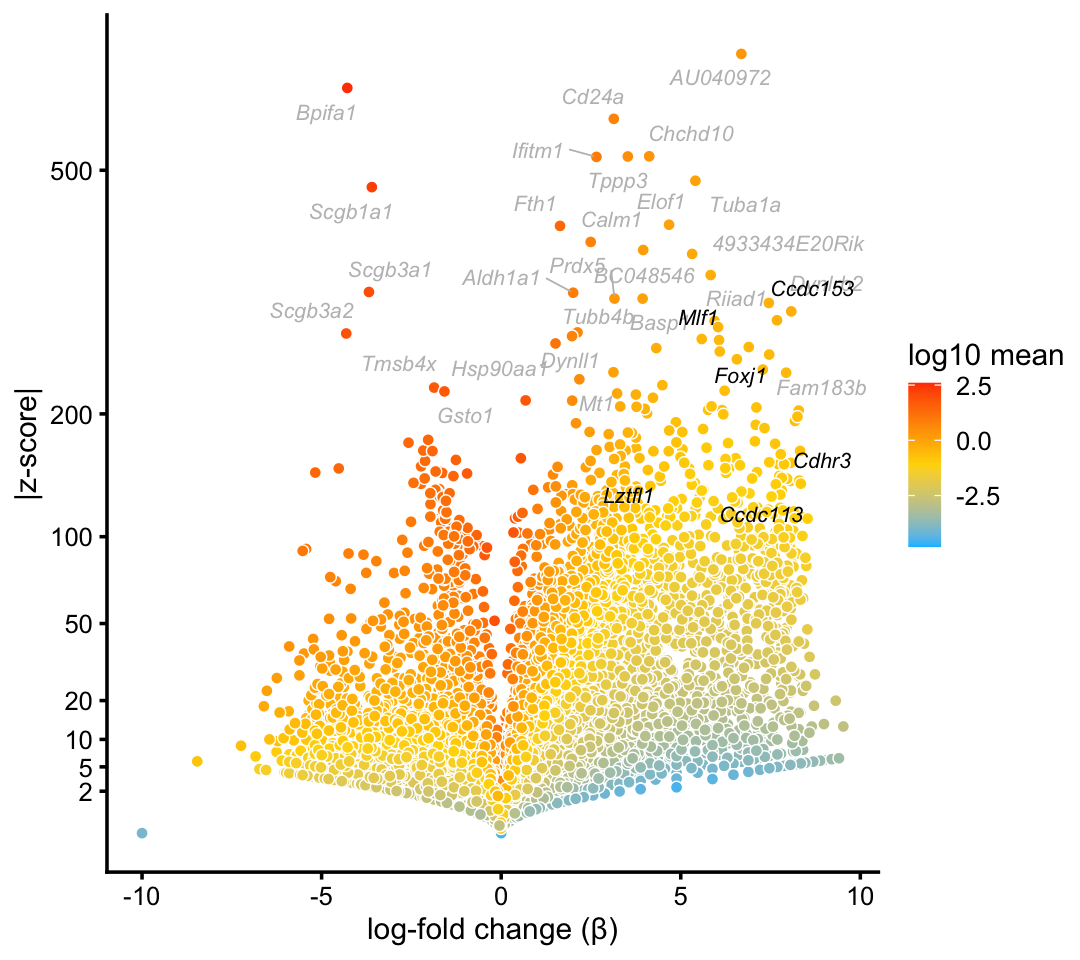
| Version | Author | Date |
|---|---|---|
| fb5cb48 | Peter Carbonetto | 2020-10-20 |
| 9171089 | Peter Carbonetto | 2020-10-11 |
| 09dc8fc | Peter Carbonetto | 2020-10-07 |
| 58bc6b6 | Peter Carbonetto | 2020-10-06 |
| f45cac1 | Peter Carbonetto | 2020-10-01 |
| 0f9607c | Peter Carbonetto | 2020-09-30 |
| bc7ea0e | Peter Carbonetto | 2020-09-29 |
| 98bfcf7 | Peter Carbonetto | 2020-09-29 |
| 0ccfc0d | Peter Carbonetto | 2020-09-29 |
| 9a11392 | Peter Carbonetto | 2020-09-29 |
| 161cb38 | Peter Carbonetto | 2020-09-29 |
| b3f5a08 | Peter Carbonetto | 2020-09-29 |
| 09d30d6 | Peter Carbonetto | 2020-09-29 |
| 6272c69 | Peter Carbonetto | 2020-09-26 |
| 6a9691b | Peter Carbonetto | 2020-09-24 |
| c0fa2db | Peter Carbonetto | 2020-09-24 |
| 78d64e9 | Peter Carbonetto | 2020-09-23 |
| 361eded | Peter Carbonetto | 2020-09-23 |
| 23f87bb | Peter Carbonetto | 2020-09-23 |
| 0ed5061 | Peter Carbonetto | 2020-09-22 |
The topic for the ciliated cell-type (\(k = 7\)) corresponds very closely to the “Cil” cluster in the pulse-seq data. In addition, gene enrichments are considerably stronger in the topic for ciliated genes, particularly so for some genes with lower expression levels.
p3 <- zscores_scatterplot(diff_count_clusters_pulseseq,
                          diff_count_pulseseq,"Cil","k7",ciliated_genes,
                          xlab = "cluster Cil",ylab = "topic 7")
p4 <- beta_scatterplot(diff_count_clusters_pulseseq,diff_count_pulseseq,
                       "Cil","k7",ciliated_genes,
                       xlab = "cluster Cil",ylab = "topic 7")
plot_grid(p3,p4)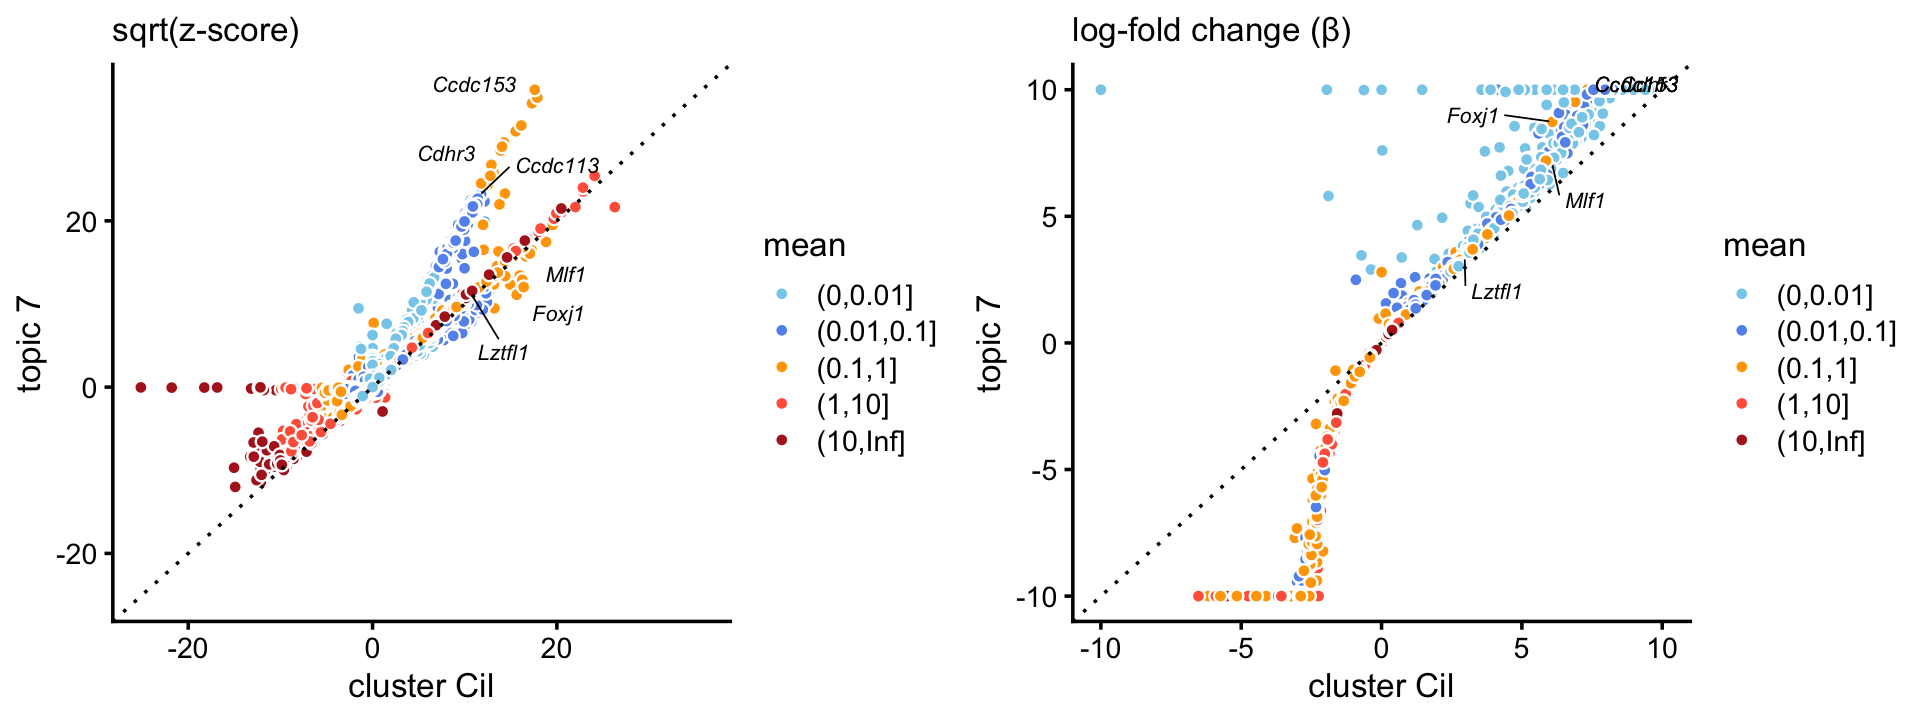
| Version | Author | Date |
|---|---|---|
| fb5cb48 | Peter Carbonetto | 2020-10-20 |
| 9171089 | Peter Carbonetto | 2020-10-11 |
| 5ea9a86 | Peter Carbonetto | 2020-10-11 |
| 09dc8fc | Peter Carbonetto | 2020-10-07 |
| 58bc6b6 | Peter Carbonetto | 2020-10-06 |
| 8a2c99b | Peter Carbonetto | 2020-10-01 |
| f45cac1 | Peter Carbonetto | 2020-10-01 |
| 0f9607c | Peter Carbonetto | 2020-09-30 |
| bc7ea0e | Peter Carbonetto | 2020-09-29 |
| 98bfcf7 | Peter Carbonetto | 2020-09-29 |
| 0ccfc0d | Peter Carbonetto | 2020-09-29 |
| 9a11392 | Peter Carbonetto | 2020-09-29 |
| 161cb38 | Peter Carbonetto | 2020-09-29 |
| b3f5a08 | Peter Carbonetto | 2020-09-29 |
| 09d30d6 | Peter Carbonetto | 2020-09-29 |
Ionocytes
In the pulse-seq data, we identify a distinctive cluster for the newly discovered, rare “ionocyte” cell type. Gene expression in these cells is not fully captured by any single topic, yet the mixture of topics forms a distinctive cluster.
ionocyte_genes <- c("Ascl3","Asgr1","Atp6v0d2","Atp6v1c2","Cftr","Foxi1",
                    "Moxd1","P2ry14","Stap1")
p5 <- volcano_plot_with_highlighted_genes(diff_count_clusters_pulseseq,"I",
                                          ionocyte_genes,
                                          label_above_quantile = 0.998)
print(p5)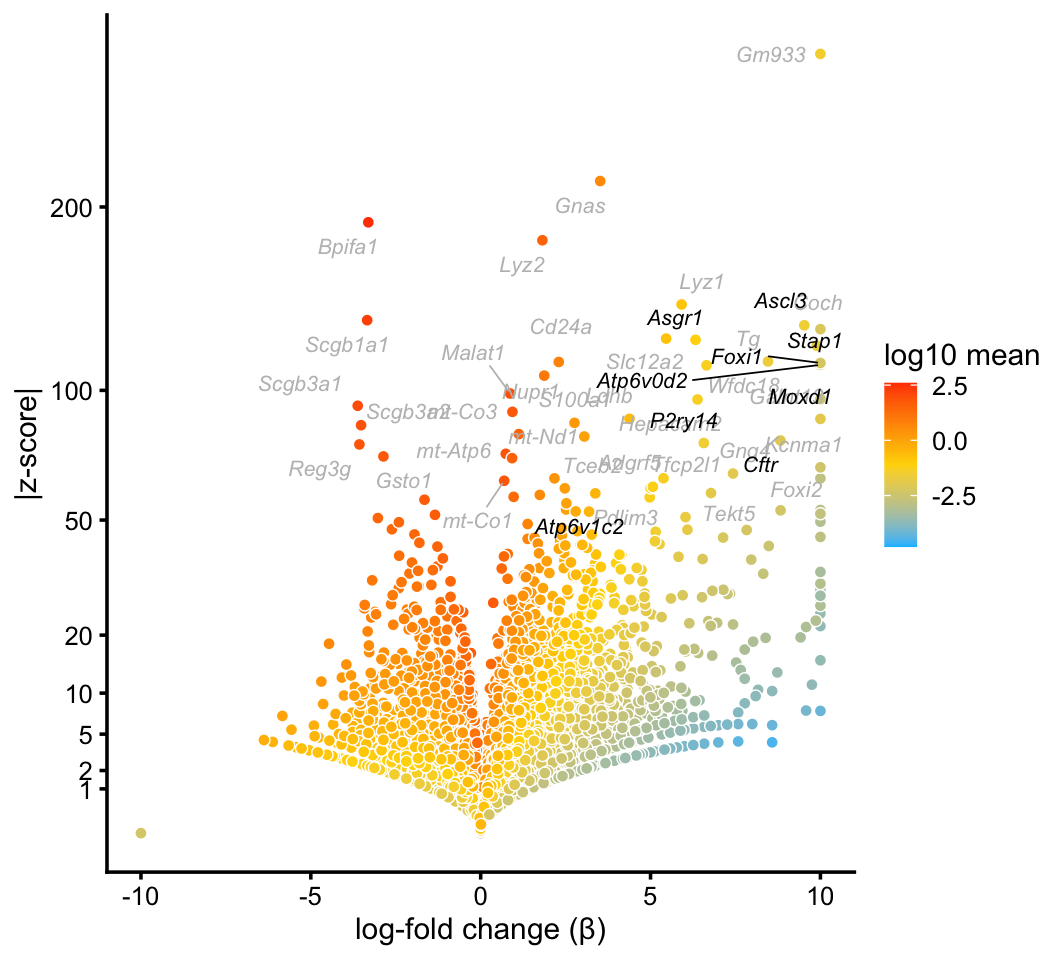
| Version | Author | Date |
|---|---|---|
| fb5cb48 | Peter Carbonetto | 2020-10-20 |
| 9171089 | Peter Carbonetto | 2020-10-11 |
| 09dc8fc | Peter Carbonetto | 2020-10-07 |
| 58bc6b6 | Peter Carbonetto | 2020-10-06 |
| 8a2c99b | Peter Carbonetto | 2020-10-01 |
| f45cac1 | Peter Carbonetto | 2020-10-01 |
| 0f9607c | Peter Carbonetto | 2020-09-30 |
| bc7ea0e | Peter Carbonetto | 2020-09-29 |
| 98bfcf7 | Peter Carbonetto | 2020-09-29 |
| 0ccfc0d | Peter Carbonetto | 2020-09-29 |
| 9a11392 | Peter Carbonetto | 2020-09-29 |
| 161cb38 | Peter Carbonetto | 2020-09-29 |
| b3f5a08 | Peter Carbonetto | 2020-09-29 |
| 09d30d6 | Peter Carbonetto | 2020-09-29 |
| 6272c69 | Peter Carbonetto | 2020-09-26 |
| 6a9691b | Peter Carbonetto | 2020-09-24 |
| 30194ad | Peter Carbonetto | 2020-09-24 |
| c0fa2db | Peter Carbonetto | 2020-09-24 |
| 78d64e9 | Peter Carbonetto | 2020-09-23 |
| 23f87bb | Peter Carbonetto | 2020-09-23 |
| 0ed5061 | Peter Carbonetto | 2020-09-22 |
We do not identify a topic or cluster for ionocytes in the droplet data. Judging by expression of the Foxi1 ionocyte marker gene, only a handful of cells in the droplet data are ionocytes:
p6 <- pca_plot(poisson2multinom(fit_droplet),fill = counts_droplet[,"Foxi1"]) +
      labs(fill = "count")
print(p6)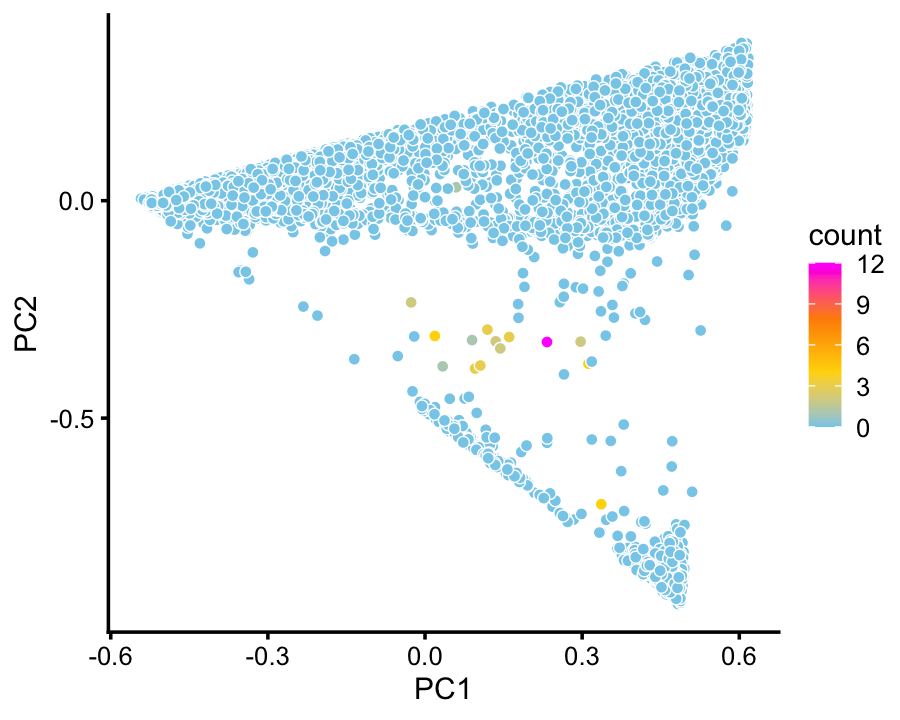
Goblet cells
Consistent with Montoro et al (2018), we identify a cluster of Goblet cells in the droplet data.
goblet_genes <- "Gp2"
p7 <- volcano_plot_with_highlighted_genes(diff_count_clusters_droplet,"G",
                                          goblet_genes,
                                          label_above_quantile = 0.998)
print(p7)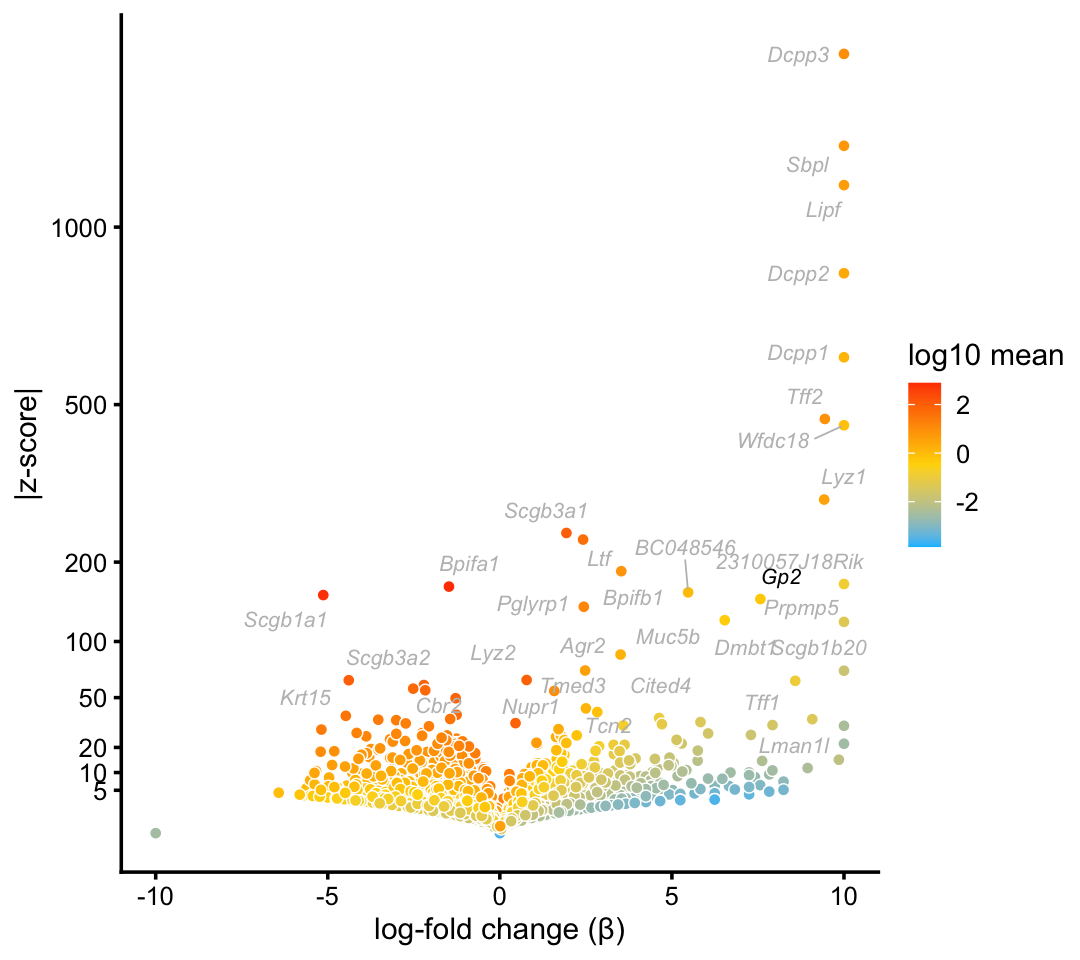
| Version | Author | Date |
|---|---|---|
| fb5cb48 | Peter Carbonetto | 2020-10-20 |
| 9171089 | Peter Carbonetto | 2020-10-11 |
| 5ea9a86 | Peter Carbonetto | 2020-10-11 |
| 09dc8fc | Peter Carbonetto | 2020-10-07 |
| 58bc6b6 | Peter Carbonetto | 2020-10-06 |
| 8a2c99b | Peter Carbonetto | 2020-10-01 |
| f45cac1 | Peter Carbonetto | 2020-10-01 |
| 0f9607c | Peter Carbonetto | 2020-09-30 |
| bc7ea0e | Peter Carbonetto | 2020-09-29 |
| 98bfcf7 | Peter Carbonetto | 2020-09-29 |
| 0ccfc0d | Peter Carbonetto | 2020-09-29 |
| 9a11392 | Peter Carbonetto | 2020-09-29 |
| 161cb38 | Peter Carbonetto | 2020-09-29 |
| b3f5a08 | Peter Carbonetto | 2020-09-29 |
| 09d30d6 | Peter Carbonetto | 2020-09-29 |
| 6272c69 | Peter Carbonetto | 2020-09-26 |
| 6a9691b | Peter Carbonetto | 2020-09-24 |
| 30194ad | Peter Carbonetto | 2020-09-24 |
| 23f87bb | Peter Carbonetto | 2020-09-23 |
| 0ed5061 | Peter Carbonetto | 2020-09-22 |
Topic \(k = 1\) is unique to this cluster, suggesting that the this topic characterizes the goblet cell type. Indeed, there is a very close correspondence between the topic and cluster, with several characteristic genes (e.g. Gp2) showing somewhat stronger enrichment in the topic.
p8 <- zscores_scatterplot(diff_count_clusters_droplet,
                          diff_count_droplet,"G","k1",goblet_genes,
                          label_above_score = 200,
                          xlab = "cluster G",ylab = "topic 1")
p9 <- beta_scatterplot(diff_count_clusters_droplet,diff_count_droplet,
                       "G","k1",goblet_genes,xlab = "cluster G",
                       ylab = "topic 1")
plot_grid(p8,p9)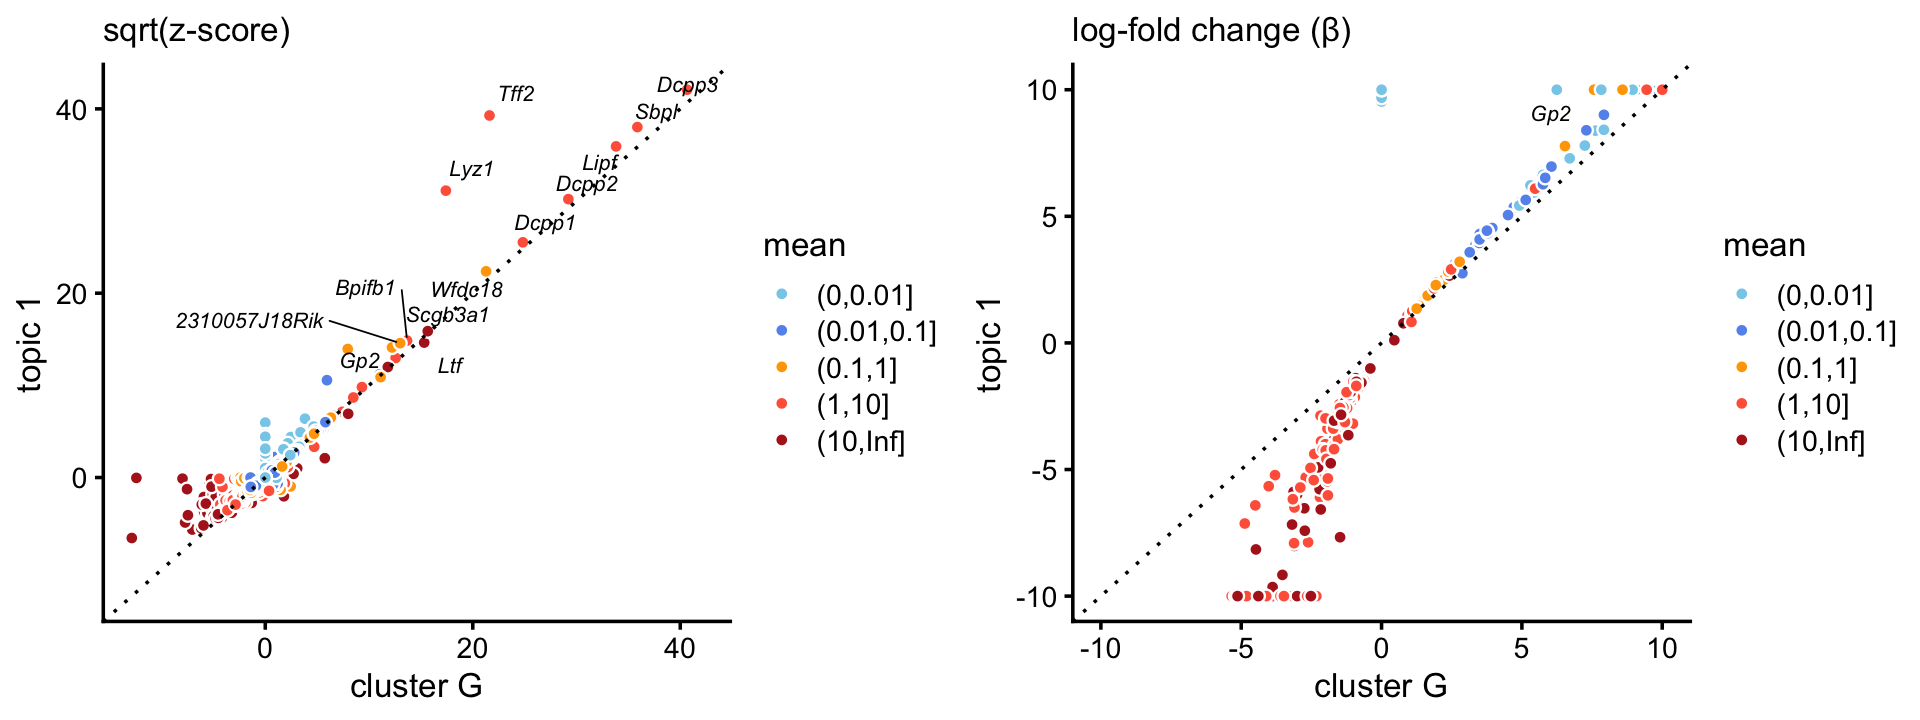
| Version | Author | Date |
|---|---|---|
| fb5cb48 | Peter Carbonetto | 2020-10-20 |
| 9171089 | Peter Carbonetto | 2020-10-11 |
| 5ea9a86 | Peter Carbonetto | 2020-10-11 |
| 09dc8fc | Peter Carbonetto | 2020-10-07 |
| 58bc6b6 | Peter Carbonetto | 2020-10-06 |
| 8a2c99b | Peter Carbonetto | 2020-10-01 |
| f45cac1 | Peter Carbonetto | 2020-10-01 |
| 0f9607c | Peter Carbonetto | 2020-09-30 |
| bc7ea0e | Peter Carbonetto | 2020-09-29 |
| 98bfcf7 | Peter Carbonetto | 2020-09-29 |
| 0ccfc0d | Peter Carbonetto | 2020-09-29 |
| 9a11392 | Peter Carbonetto | 2020-09-29 |
| 161cb38 | Peter Carbonetto | 2020-09-29 |
| b3f5a08 | Peter Carbonetto | 2020-09-29 |
| 09d30d6 | Peter Carbonetto | 2020-09-29 |
Tuft and pulmonary neuroendocrine (PNEC) cells
In both data sets, we identify clusters for tuft and pulmonary neuroendocrine cells. The fitted topic models do not separate these two rare cell types; we identify these cell types as a single cluster.
tuft_genes <- c("Ascl2","Dclk1","Gnat3","Rgs13")
neuroendocrine_genes <- c("Ascl1","Chga")
p10 <- volcano_plot_with_highlighted_genes(diff_count_clusters_droplet,"T+N",
                                           c(tuft_genes,neuroendocrine_genes),
                                           label_above_quantile = 0.998)
print(p10)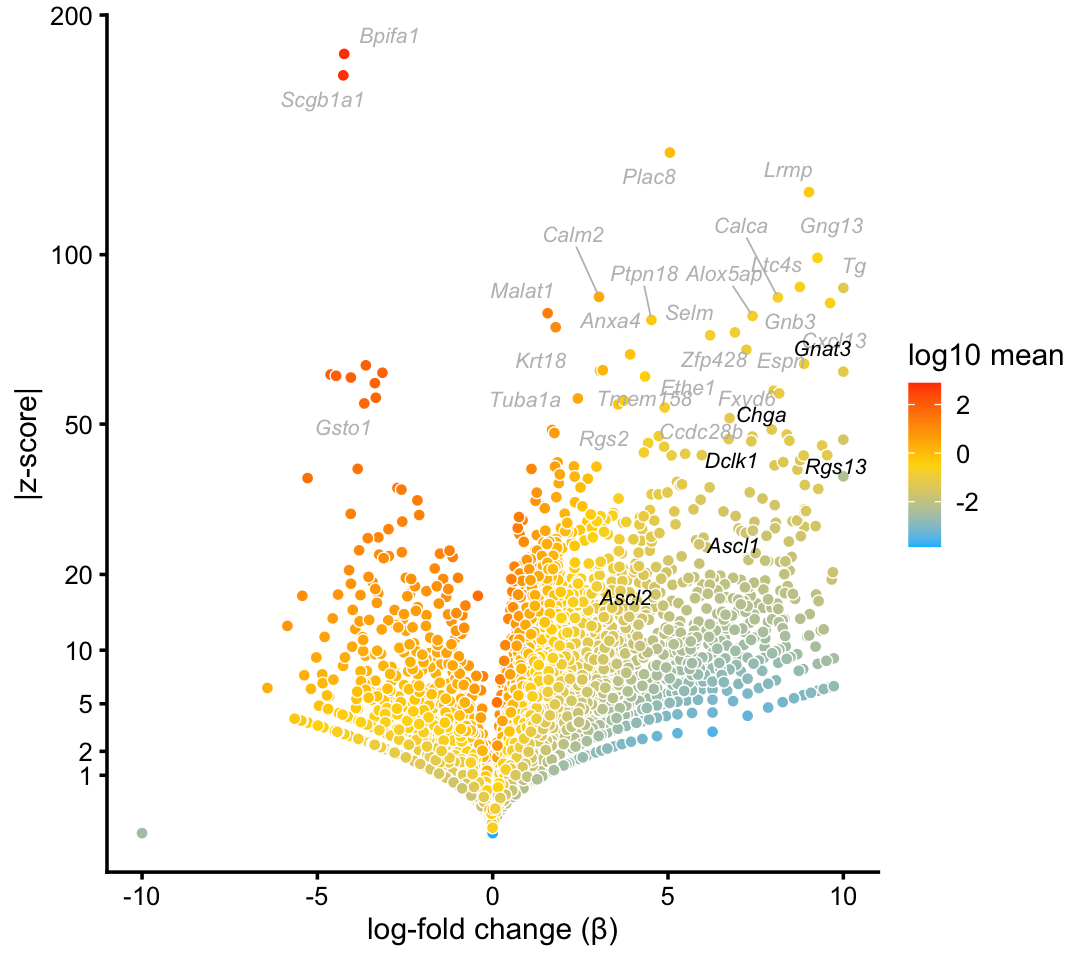
Here is the volcano plot from the pulse-seq data:
p11 <- volcano_plot_with_highlighted_genes(diff_count_clusters_pulseseq,"T+N",
                                           c(tuft_genes,neuroendocrine_genes),
                                           label_above_quantile = 0.998)
print(p11)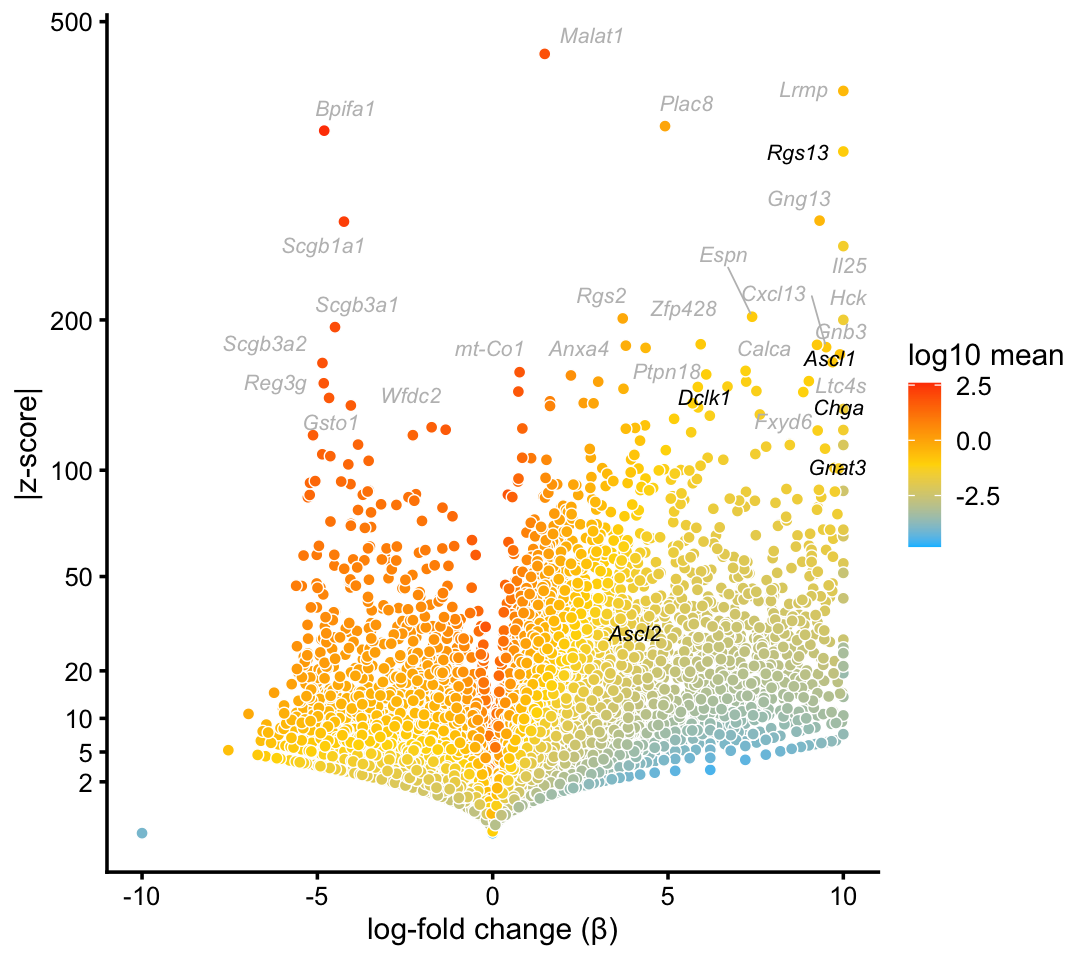
| Version | Author | Date |
|---|---|---|
| fb5cb48 | Peter Carbonetto | 2020-10-20 |
| 9171089 | Peter Carbonetto | 2020-10-11 |
| 5ea9a86 | Peter Carbonetto | 2020-10-11 |
| 09dc8fc | Peter Carbonetto | 2020-10-07 |
| 58bc6b6 | Peter Carbonetto | 2020-10-06 |
| 8a2c99b | Peter Carbonetto | 2020-10-01 |
| f45cac1 | Peter Carbonetto | 2020-10-01 |
| bc7ea0e | Peter Carbonetto | 2020-09-29 |
| 98bfcf7 | Peter Carbonetto | 2020-09-29 |
| 0ccfc0d | Peter Carbonetto | 2020-09-29 |
| 161cb38 | Peter Carbonetto | 2020-09-29 |
| b3f5a08 | Peter Carbonetto | 2020-09-29 |
| 09d30d6 | Peter Carbonetto | 2020-09-29 |
| 6272c69 | Peter Carbonetto | 2020-09-26 |
| 6a9691b | Peter Carbonetto | 2020-09-24 |
Although we do not identify clusters for tuft and neuroendocrine cells, in the droplet data topics 2 and 5 captures variation in gene expression that corresponds to these cell-types. In particular, topic \(k = 2\) in the “T+N” cluster is enriched for neuroendocrine-specific genes (e.g., Chga) and topic \(k = 6\) is enriched for tuft-specific genes (e.g., Gnat3).
rows <- which(samples_droplet$cluster == "T+N")
diff_count_TN_droplet <-
  diff_count_analysis(select(poisson2multinom(fit_droplet),loadings = rows),
                      counts_droplet[rows,])
p12 <- volcano_plot_with_highlighted_genes(diff_count_TN_droplet,"k2",
                                           c(tuft_genes,neuroendocrine_genes),
                                           label_above_quantile = 0.998) +
       ggtitle("topic 2")
p13 <- volcano_plot_with_highlighted_genes(diff_count_TN_droplet,"k6",
                                           c(tuft_genes,neuroendocrine_genes),
                                           label_above_quantile = 0.998) +
       ggtitle("topic 6")
plot_grid(p12,p13)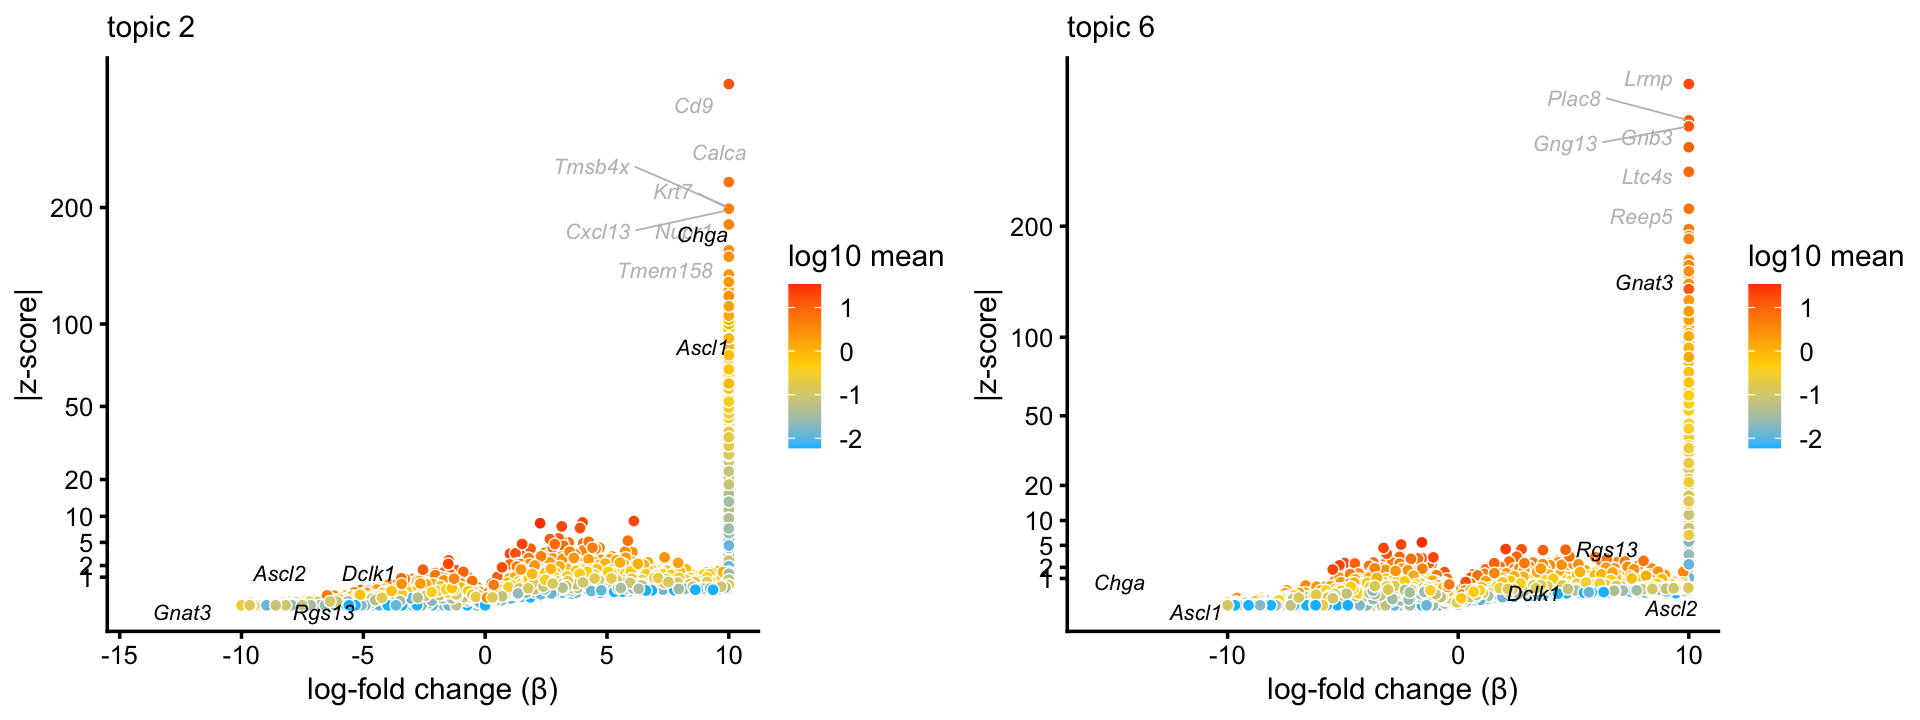
# Fitting 18388 x 7 = 128716 univariate Poisson models.
# Computing log-fold change statistics.
Similarly, in the pulse-seq data, in topic \(k = 2\) we observed increased expression of neuroendocrine-specific genes and underexpression of tuft-specific genes.
rows <- which(samples_pulseseq$cluster == "T+N")
diff_count_TN_pulseseq <-
  diff_count_analysis(select(poisson2multinom(fit_pulseseq),loadings = rows),
                      counts_pulseseq[rows,])
p14 <- volcano_plot_with_highlighted_genes(diff_count_TN_pulseseq,"k2",
                                           c(tuft_genes,neuroendocrine_genes),
                                           label_above_quantile = 0.998) +
       ggtitle("topic 2")
print(p14)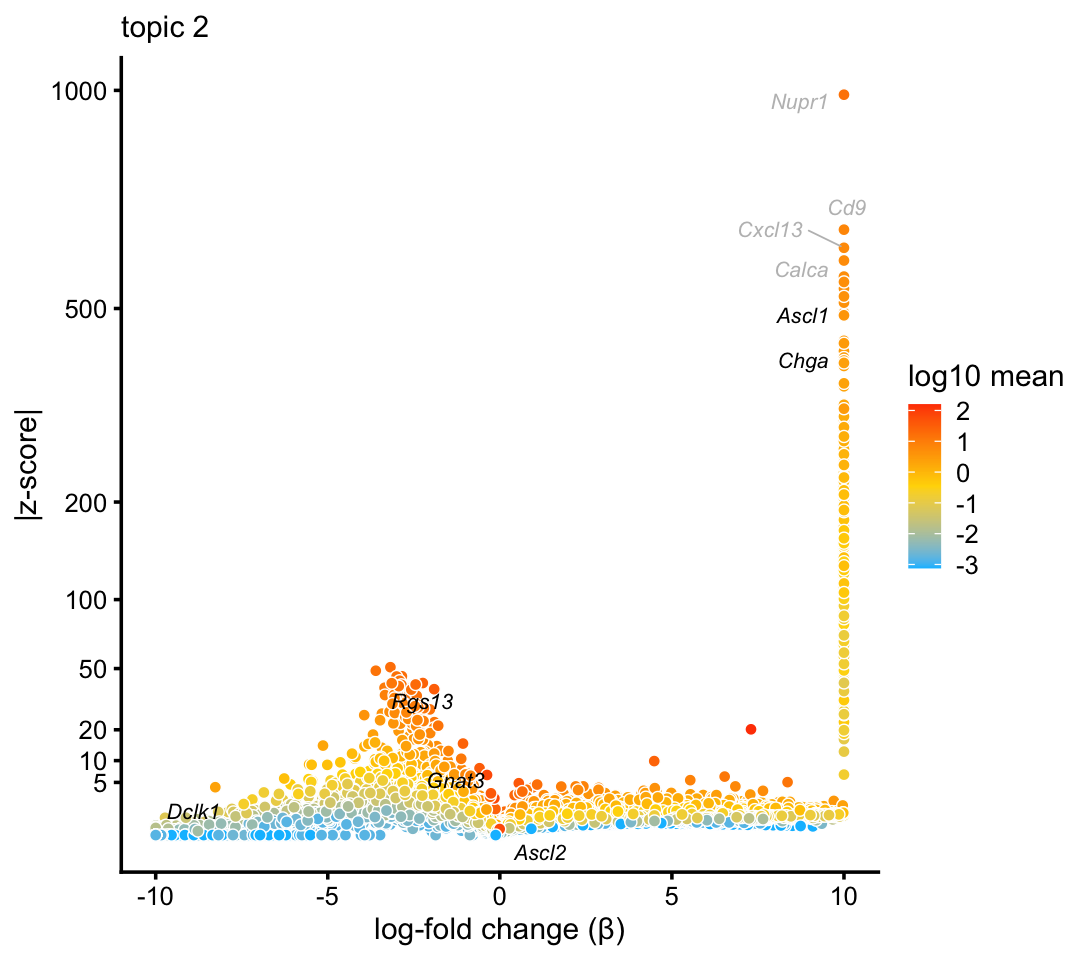
# Fitting 21621 x 11 = 237831 univariate Poisson models.
# Computing log-fold change statistics.
The fact that the topic proportions in tuft and neuroendocrine cells does not vary a lot suggests relatively small differences in gene expression between these cell-types.
Basal cells
We now move on to the large majority of cells in each of the epithelial airway data sets (over 90% in droplet and over 92% in pulseseq) that do not break down into distinct clusters.
Although we do not obtain a distinct basal cells cluster, attempting to form a cluster does indeed reasonably distinguish basal cells:
basal_genes <- c("Aqp3","Krt5","Dapl1","Hspa1a","Trp63")
p15 <- volcano_plot_with_highlighted_genes(diff_count_clusters_droplet,"B",
                                           c(basal_genes,tuft_genes,
                                             neuroendocrine_genes),
                                           label_above_quantile = 0.995)
print(p15)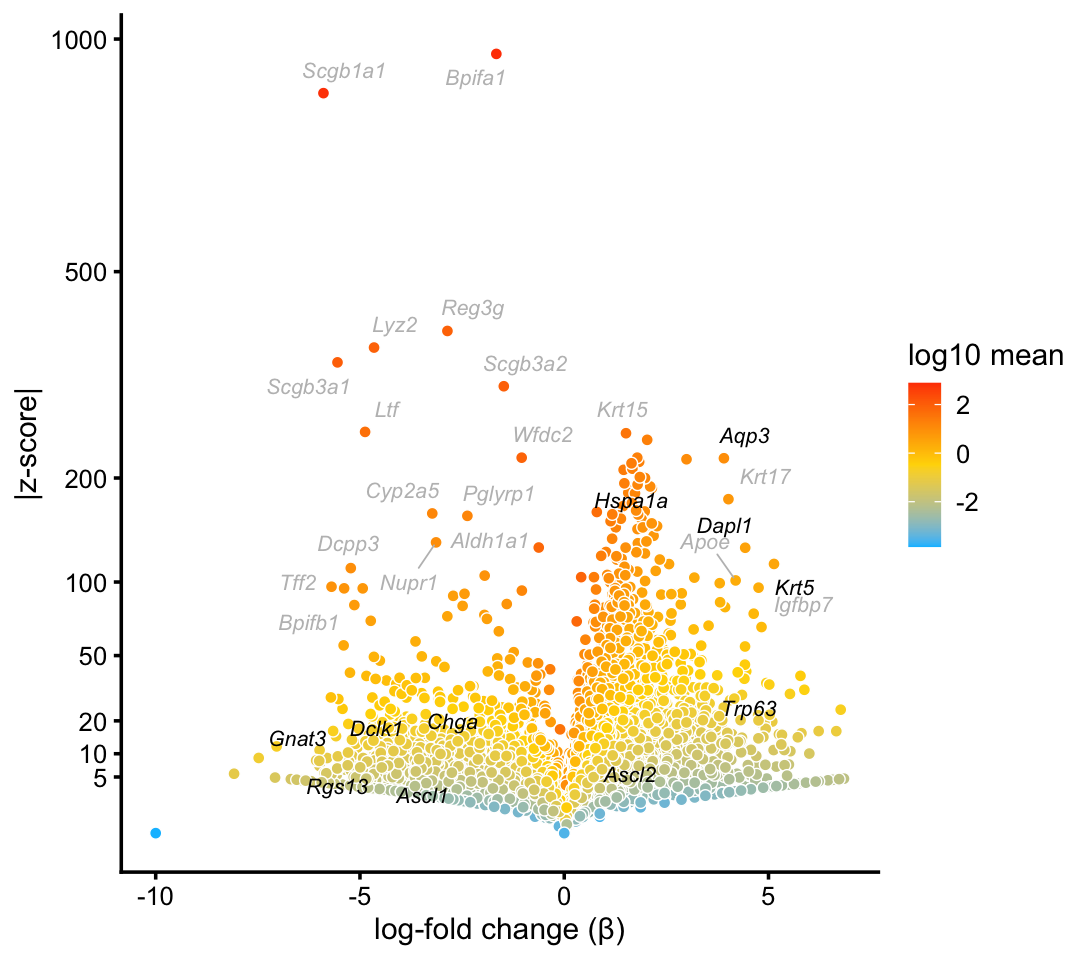
| Version | Author | Date |
|---|---|---|
| fb5cb48 | Peter Carbonetto | 2020-10-20 |
| 9171089 | Peter Carbonetto | 2020-10-11 |
| 5ea9a86 | Peter Carbonetto | 2020-10-11 |
| 09dc8fc | Peter Carbonetto | 2020-10-07 |
| 58bc6b6 | Peter Carbonetto | 2020-10-06 |
| 8a2c99b | Peter Carbonetto | 2020-10-01 |
| f45cac1 | Peter Carbonetto | 2020-10-01 |
| bc7ea0e | Peter Carbonetto | 2020-09-29 |
| 98bfcf7 | Peter Carbonetto | 2020-09-29 |
| 0ccfc0d | Peter Carbonetto | 2020-09-29 |
| 9a11392 | Peter Carbonetto | 2020-09-29 |
| 161cb38 | Peter Carbonetto | 2020-09-29 |
Comparing the basal cells topic (\(k = 2\)) against the basal cells cluster in the droplet data, there is a close correspondence between the two, with the topic showing much stronger enrichment of characteristic basal genes:
p16 <- zscores_scatterplot(diff_count_clusters_droplet,
                           diff_count_basal_droplet,"B","k2",
                           basal_genes,zmax = 400,
                           xlab = "cluster B",ylab = "topic 2")
p17 <- beta_scatterplot(diff_count_clusters_droplet,diff_count_basal_droplet,
                        "B","k2",basal_genes,zmin = 2,
                        xlab = "cluster B",y = "topic 2")
plot_grid(p16,p17)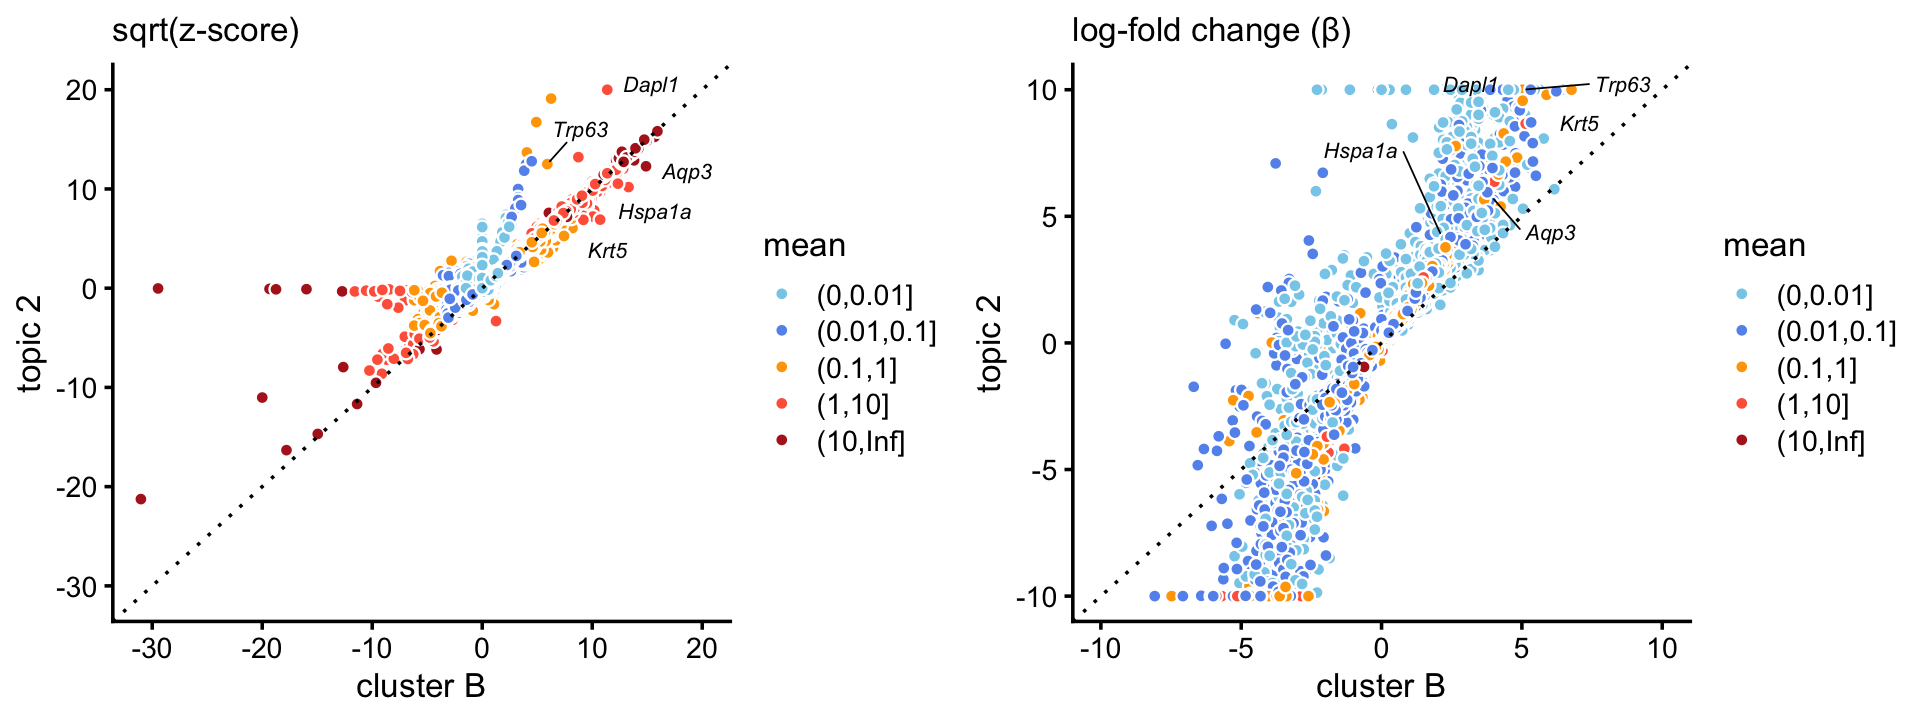
| Version | Author | Date |
|---|---|---|
| fb5cb48 | Peter Carbonetto | 2020-10-20 |
| 9171089 | Peter Carbonetto | 2020-10-11 |
| 5ea9a86 | Peter Carbonetto | 2020-10-11 |
| 09dc8fc | Peter Carbonetto | 2020-10-07 |
| 58bc6b6 | Peter Carbonetto | 2020-10-06 |
| 8a2c99b | Peter Carbonetto | 2020-10-01 |
| f45cac1 | Peter Carbonetto | 2020-10-01 |
| 0f9607c | Peter Carbonetto | 2020-09-30 |
| bc7ea0e | Peter Carbonetto | 2020-09-29 |
| 98bfcf7 | Peter Carbonetto | 2020-09-29 |
| 0ccfc0d | Peter Carbonetto | 2020-09-29 |
| 9a11392 | Peter Carbonetto | 2020-09-29 |
| 161cb38 | Peter Carbonetto | 2020-09-29 |
We obtain similar results with a cluster identified in the pulse-seq data,
p18 <- volcano_plot_with_highlighted_genes(diff_count_clusters_pulseseq,"B",
                                           basal_genes,
                                           label_above_quantile = 0.995)
print(p18)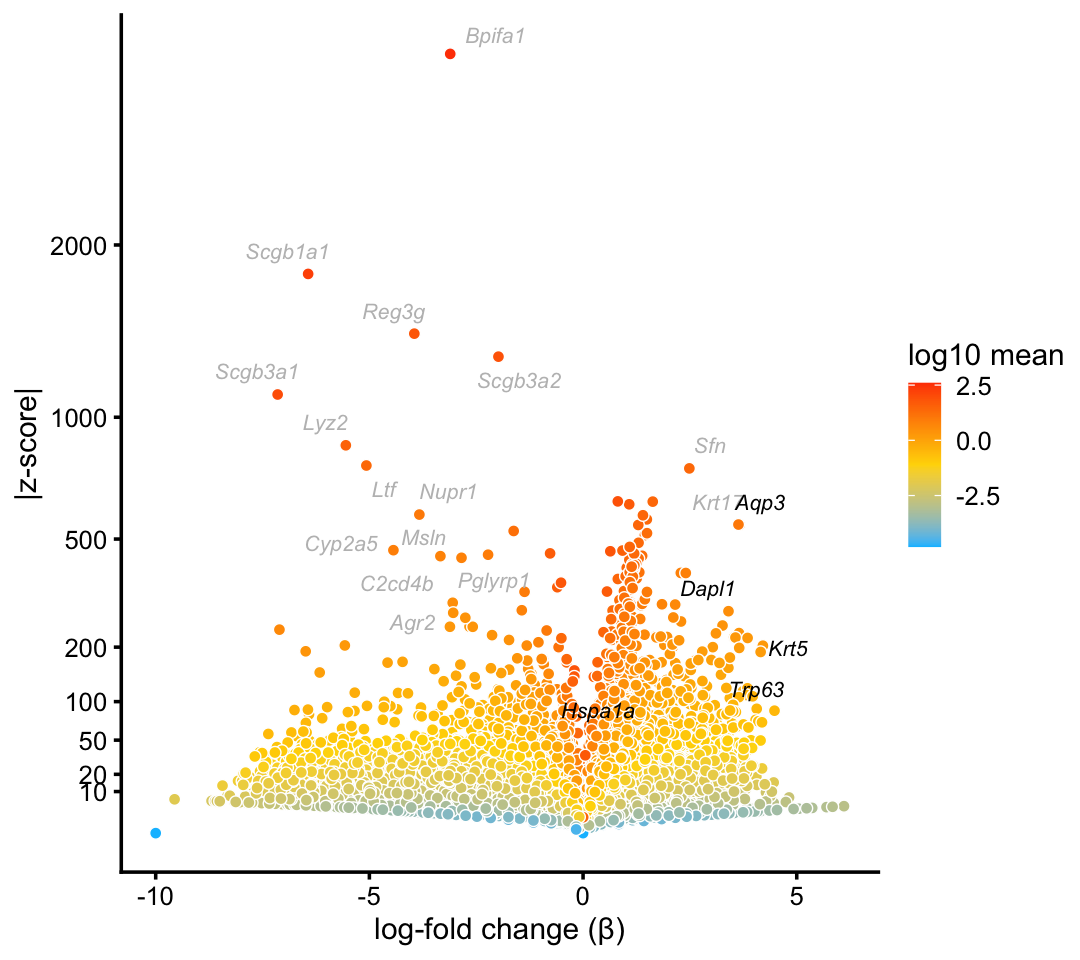
| Version | Author | Date |
|---|---|---|
| fb5cb48 | Peter Carbonetto | 2020-10-20 |
| 9171089 | Peter Carbonetto | 2020-10-11 |
| 5ea9a86 | Peter Carbonetto | 2020-10-11 |
| 09dc8fc | Peter Carbonetto | 2020-10-07 |
| 58bc6b6 | Peter Carbonetto | 2020-10-06 |
| 8a2c99b | Peter Carbonetto | 2020-10-01 |
| 0f9607c | Peter Carbonetto | 2020-09-30 |
| bc7ea0e | Peter Carbonetto | 2020-09-29 |
| 98bfcf7 | Peter Carbonetto | 2020-09-29 |
| 0ccfc0d | Peter Carbonetto | 2020-09-29 |
| 9a11392 | Peter Carbonetto | 2020-09-29 |
| 161cb38 | Peter Carbonetto | 2020-09-29 |
and we achieve much stronger enrichment of basal genes in the combined basal topics (\(k = 1, 3, 9\)) when compared to the basal cluster in the pulse-seq data:
p19 <- zscores_scatterplot(diff_count_clusters_pulseseq,
                           diff_count_bc_pulseseq,"B","k1+k3+k9",
                           basal_genes,zmax = 2000,
                           xlab = "cluster B",ylab = "topic 2")
p20 <- beta_scatterplot(diff_count_clusters_pulseseq,
                        diff_count_bc_pulseseq,
                        "B","k1+k3+k9",basal_genes,
                        xlab = "cluster B",ylab = "topics 1, 3, 9")
plot_grid(p19,p20)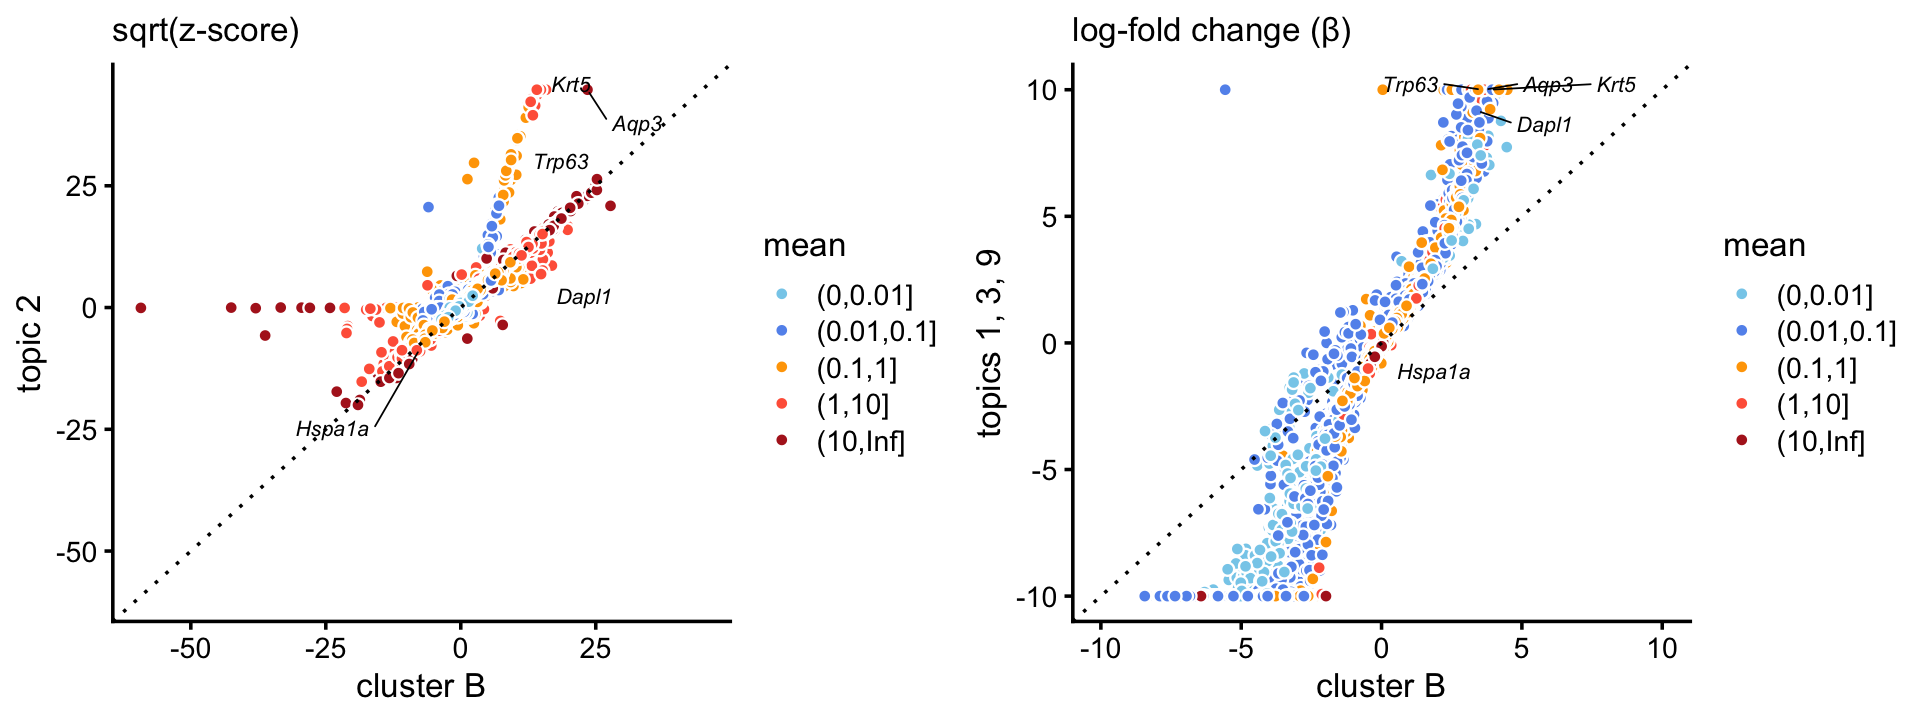
| Version | Author | Date |
|---|---|---|
| fb5cb48 | Peter Carbonetto | 2020-10-20 |
| 9171089 | Peter Carbonetto | 2020-10-11 |
| 5ea9a86 | Peter Carbonetto | 2020-10-11 |
| 09dc8fc | Peter Carbonetto | 2020-10-07 |
| 58bc6b6 | Peter Carbonetto | 2020-10-06 |
| 8a2c99b | Peter Carbonetto | 2020-10-01 |
| f45cac1 | Peter Carbonetto | 2020-10-01 |
| 0f9607c | Peter Carbonetto | 2020-09-30 |
| bc7ea0e | Peter Carbonetto | 2020-09-29 |
| 98bfcf7 | Peter Carbonetto | 2020-09-29 |
| 0ccfc0d | Peter Carbonetto | 2020-09-29 |
| 9a11392 | Peter Carbonetto | 2020-09-29 |
| 161cb38 | Peter Carbonetto | 2020-09-29 |
Proliferating cells
There is an interesting subset of basal cells, uniquely in the pulse-seq set set, that isn’t captured well by any single topic, but it stands out in PCA plots of the topic proportions. Forming a cluster from this subset, we obtain strong enrichment of cell-cycle genes:
cell_cycle_genes <- c("Cdk1","Ube2c","Top2a")
p21 <- volcano_plot_with_highlighted_genes(diff_count_clusters_pulseseq,"P",
                                           cell_cycle_genes,
                                           label_above_quantile = 0.998)
print(p21)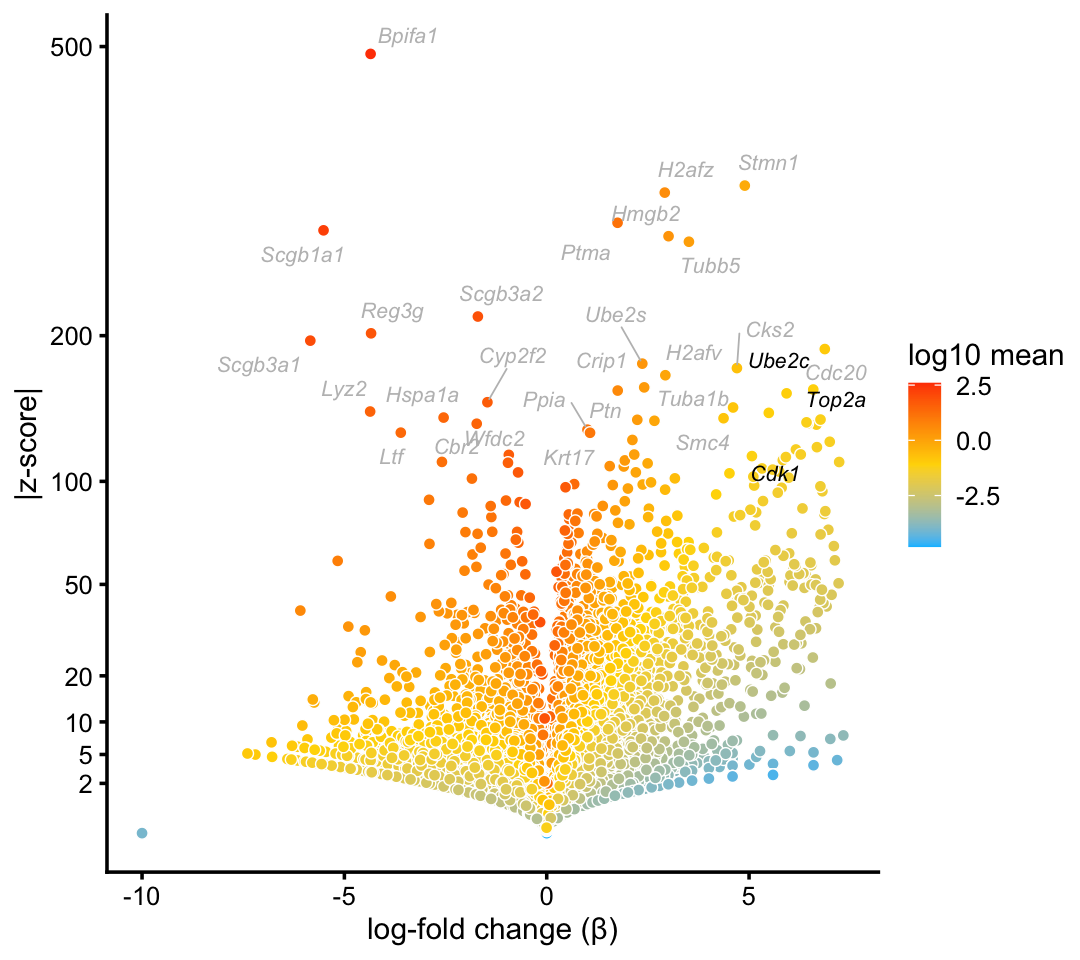
| Version | Author | Date |
|---|---|---|
| fb5cb48 | Peter Carbonetto | 2020-10-20 |
| 9171089 | Peter Carbonetto | 2020-10-11 |
| 5ea9a86 | Peter Carbonetto | 2020-10-11 |
| 09dc8fc | Peter Carbonetto | 2020-10-07 |
| 58bc6b6 | Peter Carbonetto | 2020-10-06 |
| 8a2c99b | Peter Carbonetto | 2020-10-01 |
| f45cac1 | Peter Carbonetto | 2020-10-01 |
| 0f9607c | Peter Carbonetto | 2020-09-30 |
| bc7ea0e | Peter Carbonetto | 2020-09-29 |
| 98bfcf7 | Peter Carbonetto | 2020-09-29 |
| 0ccfc0d | Peter Carbonetto | 2020-09-29 |
| 9a11392 | Peter Carbonetto | 2020-09-29 |
Indeed, if we formulate a simple a “cell-cycle score”, we see that the signal is quite visible in PCs 5 and 6 of the topic proportions:
rows <- with(samples_pulseseq,which(cluster == "B" | cluster == "P"))
fit2 <- select(poisson2multinom(fit_pulseseq),loadings = rows)
p22  <- cellcycle_pca_plot(fit2,counts_pulseseq[rows,],pcs = 5:6)
print(p22)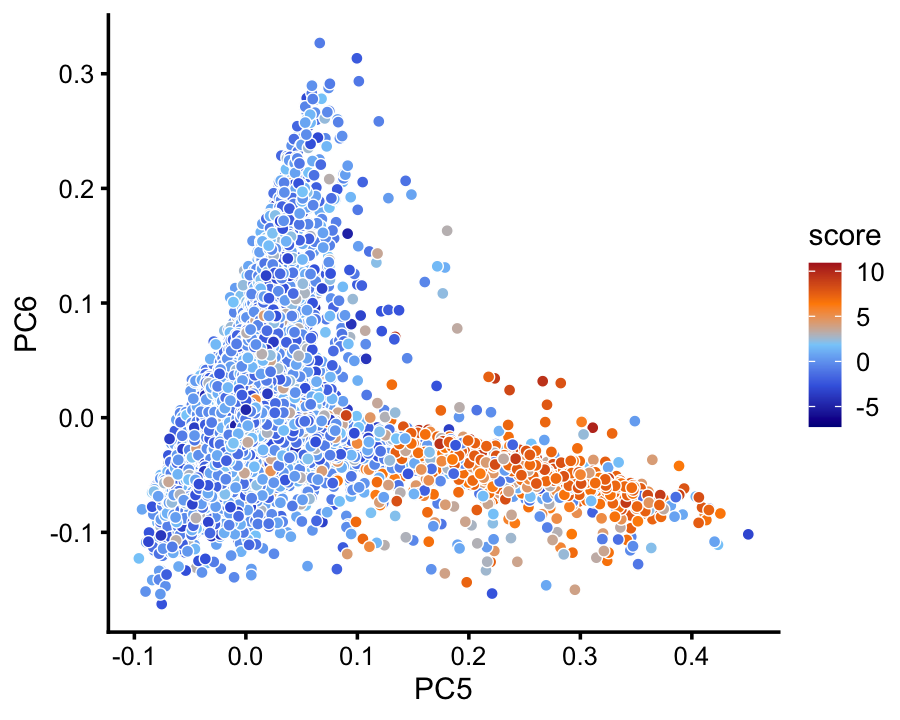
Hillock cells
The Montoro et al (2018) paper identifies a rare transitional cell though a diffusion maps analysis of the droplet data. They call these rare transition cells uniquely expressing Krt13 as “Hillock cells”. Indeed, we do not identify a distinct cluster for Hillock celels in the droplet data, but we nonetheless formed a small (\(n = 197\)) cluster in the clustering analysis that shows strong enrichment of the top hillock genes (e.g., Krt4, Krt13):
hillock_genes <- c("Anxa1","Cldn3","Ecm1","Krt13","Krt4","Lgals3","S100a11")
p23 <- volcano_plot_with_highlighted_genes(diff_count_clusters_droplet,"H",
                                           hillock_genes,
                                           label_above_quantile = 0.998)
print(p23)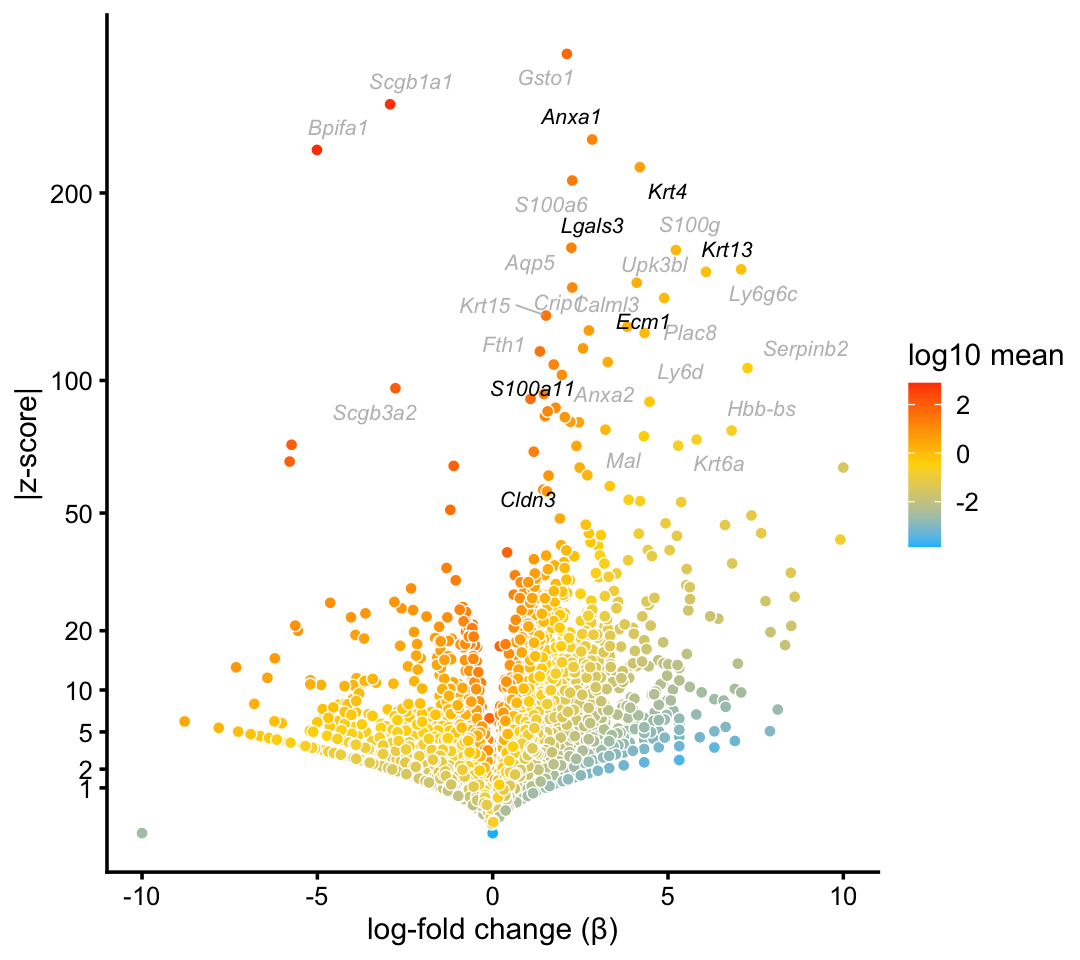
| Version | Author | Date |
|---|---|---|
| fb5cb48 | Peter Carbonetto | 2020-10-20 |
| 9171089 | Peter Carbonetto | 2020-10-11 |
| 5ea9a86 | Peter Carbonetto | 2020-10-11 |
| 09dc8fc | Peter Carbonetto | 2020-10-07 |
| 58bc6b6 | Peter Carbonetto | 2020-10-06 |
| 8a2c99b | Peter Carbonetto | 2020-10-01 |
| f45cac1 | Peter Carbonetto | 2020-10-01 |
| bc7ea0e | Peter Carbonetto | 2020-09-29 |
| 98bfcf7 | Peter Carbonetto | 2020-09-29 |
| 0ccfc0d | Peter Carbonetto | 2020-09-29 |
| 9a11392 | Peter Carbonetto | 2020-09-29 |
Given the transitional nature of these cells, one would expect that mixtures of gene programs would better characterize the continuous variation in the hillock-specific gene program, and indeed topic 4, which is the greatest contributor to this cluster of hillock cells, picks up a more distinct enrichment signal for hillock genes:
p24 <- zscores_scatterplot(diff_count_clusters_droplet,
                           diff_count_droplet,"H","k4",
                           hillock_genes,zmax = 400,
                           xlab = "cluster H",ylab = "topic 4")
p25 <- beta_scatterplot(diff_count_clusters_droplet,diff_count_droplet,
                        "H","k4",hillock_genes,
                        xlab = "cluster H",ylab = "topic 4")
plot_grid(p24,p25)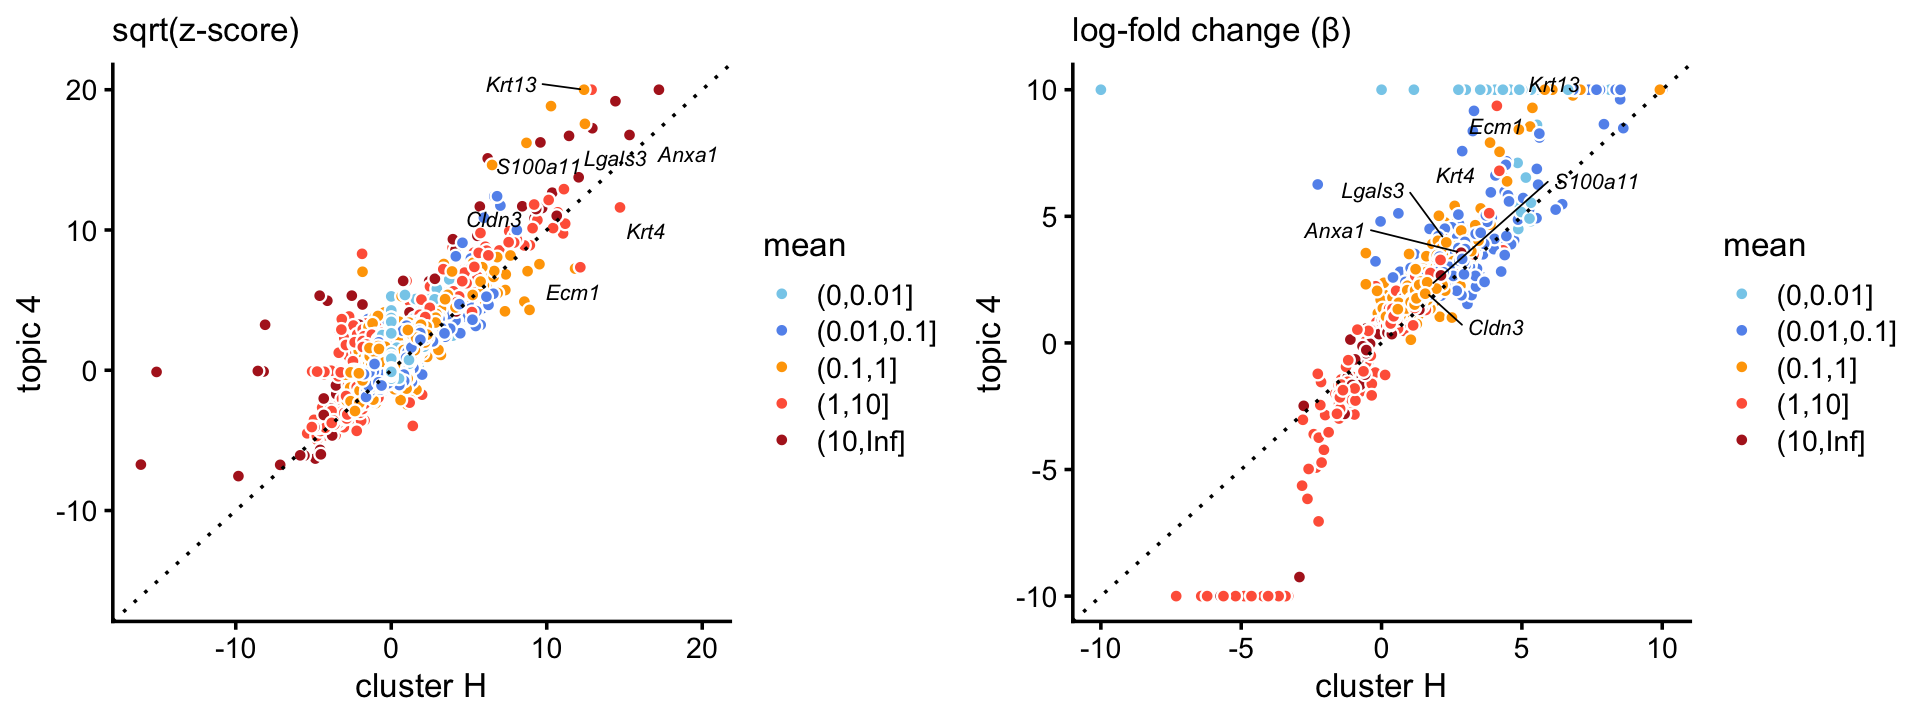
| Version | Author | Date |
|---|---|---|
| fb5cb48 | Peter Carbonetto | 2020-10-20 |
| 9171089 | Peter Carbonetto | 2020-10-11 |
| 5ea9a86 | Peter Carbonetto | 2020-10-11 |
| 09dc8fc | Peter Carbonetto | 2020-10-07 |
| 58bc6b6 | Peter Carbonetto | 2020-10-06 |
| 8a2c99b | Peter Carbonetto | 2020-10-01 |
| f45cac1 | Peter Carbonetto | 2020-10-01 |
| 0f9607c | Peter Carbonetto | 2020-09-30 |
| bc7ea0e | Peter Carbonetto | 2020-09-29 |
| 98bfcf7 | Peter Carbonetto | 2020-09-29 |
| 0ccfc0d | Peter Carbonetto | 2020-09-29 |
| 9a11392 | Peter Carbonetto | 2020-09-29 |
For example, we estimate roughly a 68-fold enrichment of Krt13 expression in the hillock cluster, and over 1,000-fold enrichment in the hillock topic (essentially because there is no expression of Krt13 outside this topic).
The presence of hillock cells in the pulse-seq data is more subtle, but it is nonetheless well-captured by a single topic, \(k = 1\):
p26 <- volcano_plot_with_highlighted_genes(diff_count_hillock_pulseseq,"k1",
                                           hillock_genes,
                                           label_above_quantile = 0.995)
print(p26)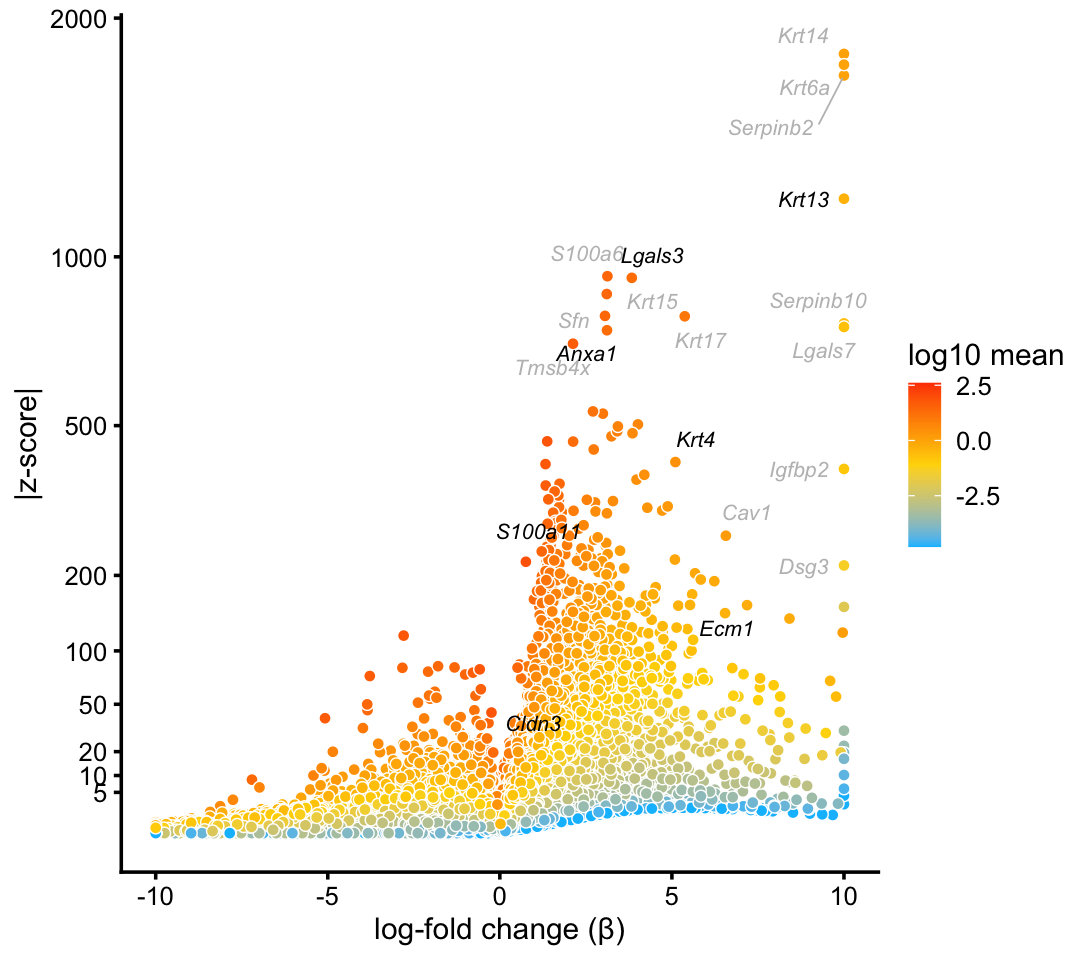
| Version | Author | Date |
|---|---|---|
| fb5cb48 | Peter Carbonetto | 2020-10-20 |
| 9171089 | Peter Carbonetto | 2020-10-11 |
| 5ea9a86 | Peter Carbonetto | 2020-10-11 |
| 09dc8fc | Peter Carbonetto | 2020-10-07 |
| 58bc6b6 | Peter Carbonetto | 2020-10-06 |
| 8a2c99b | Peter Carbonetto | 2020-10-01 |
| f45cac1 | Peter Carbonetto | 2020-10-01 |
| 0f9607c | Peter Carbonetto | 2020-09-30 |
| bc7ea0e | Peter Carbonetto | 2020-09-29 |
| 98bfcf7 | Peter Carbonetto | 2020-09-29 |
| 0ccfc0d | Peter Carbonetto | 2020-09-29 |
Club cells
The remaining cluster in the droplet captures club cells:
club_genes <- c("Bpifa1","Cbr2","Cyp2a5","Cyp2f2","Krt15",
                "Lypd2","Muc5b","Nfia","Scgb1a1","Scgb3a2")
p27 <- volcano_plot_with_highlighted_genes(diff_count_clusters_droplet,"C",
                                           club_genes,
                                           label_above_quantile = 0.995)
print(p27)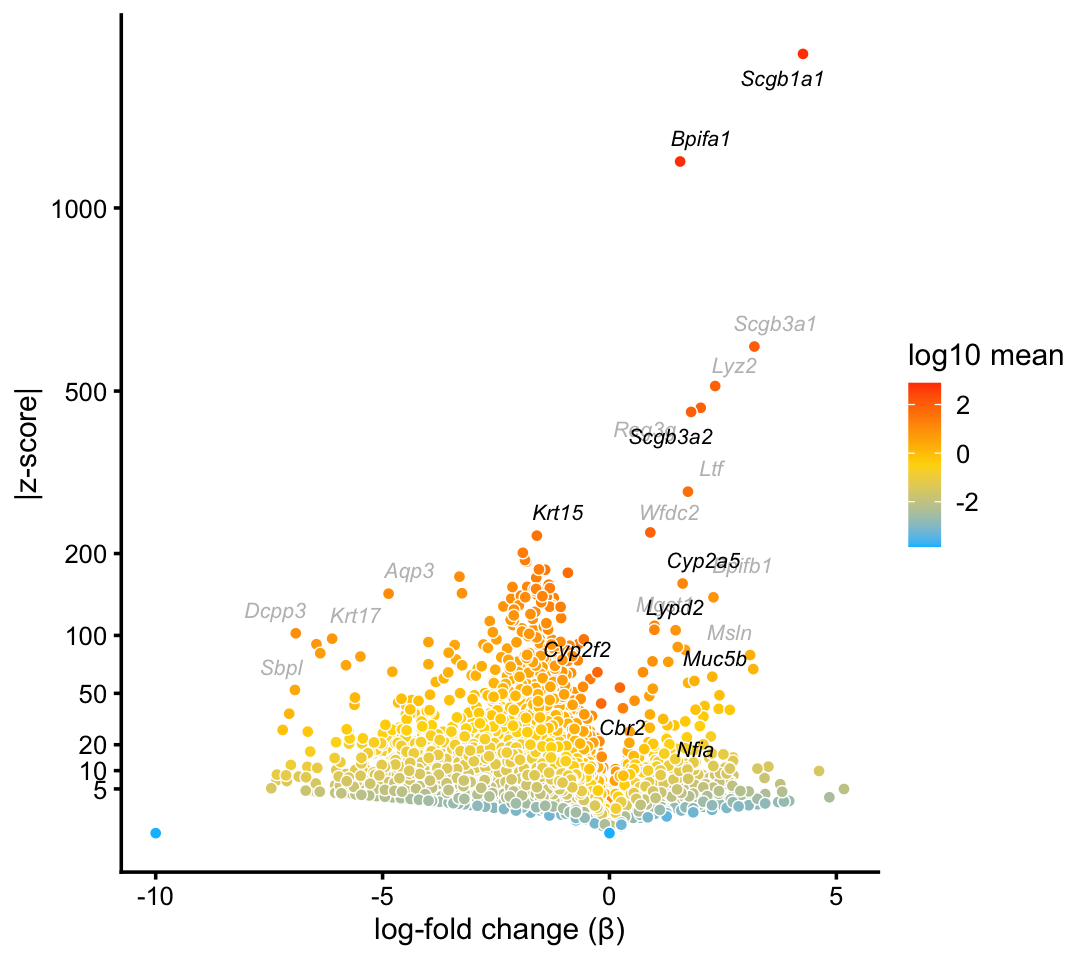
| Version | Author | Date |
|---|---|---|
| fb5cb48 | Peter Carbonetto | 2020-10-20 |
| 9171089 | Peter Carbonetto | 2020-10-11 |
| 5ea9a86 | Peter Carbonetto | 2020-10-11 |
| 09dc8fc | Peter Carbonetto | 2020-10-07 |
| 58bc6b6 | Peter Carbonetto | 2020-10-06 |
| 8a2c99b | Peter Carbonetto | 2020-10-01 |
| f45cac1 | Peter Carbonetto | 2020-10-01 |
| 0f9607c | Peter Carbonetto | 2020-09-30 |
| bc7ea0e | Peter Carbonetto | 2020-09-29 |
| 98bfcf7 | Peter Carbonetto | 2020-09-29 |
And likewise in the pulse-seq data:
p28 <- volcano_plot_with_highlighted_genes(diff_count_clusters_pulseseq,"C",
                                           club_genes,
                                           label_above_quantile = 0.995)
print(p28)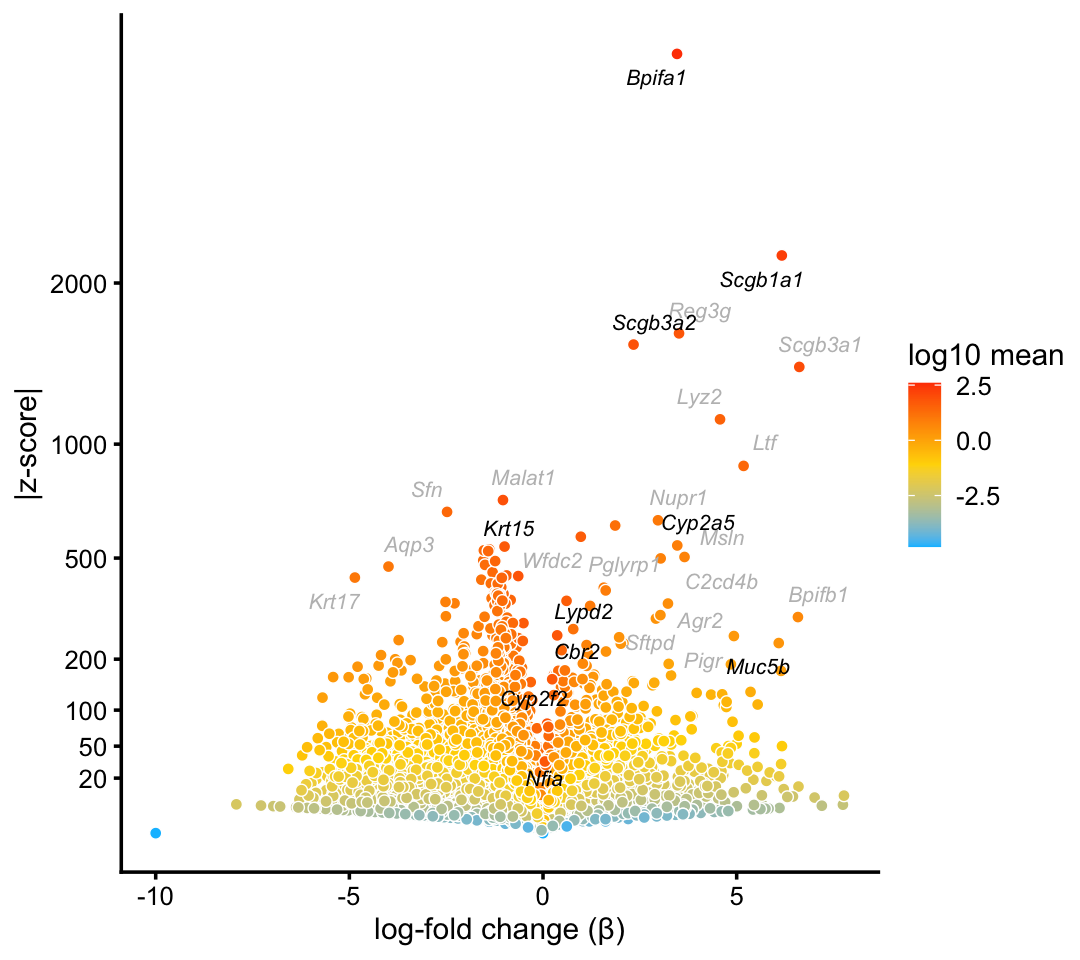
| Version | Author | Date |
|---|---|---|
| fb5cb48 | Peter Carbonetto | 2020-10-20 |
| 9171089 | Peter Carbonetto | 2020-10-11 |
| 5ea9a86 | Peter Carbonetto | 2020-10-11 |
| 09dc8fc | Peter Carbonetto | 2020-10-07 |
| 58bc6b6 | Peter Carbonetto | 2020-10-06 |
| 8a2c99b | Peter Carbonetto | 2020-10-01 |
| f45cac1 | Peter Carbonetto | 2020-10-01 |
| 0f9607c | Peter Carbonetto | 2020-09-30 |
| bc7ea0e | Peter Carbonetto | 2020-09-29 |
| 98bfcf7 | Peter Carbonetto | 2020-09-29 |
Both the droplet and pulse-seq clusters exhibit a high level of heterogeneity in the topic proportions; in particular, 2 topics are unique to club cluster in the droplet data, and 5 topics in the pulse-seq club cluster. This heterogeneity will require further exploration; for now we focus on the combined topic proportions capturing the club cell-type-specific gene program. In the droplet data, compare cluster C to the combined topic \(k = 5 + 7\),
p29 <- zscores_scatterplot(diff_count_clusters_droplet,
                           diff_count_club_droplet,"C","k5+k7",club_genes,
                           zmax = 500,xlab = "cluster C",ylab = "topics 5 + 7")
p30 <- beta_scatterplot(diff_count_clusters_droplet,diff_count_club_droplet,
                        "C","k5+k7",club_genes,
                        xlab = "cluster C",ylab = "topics 5 + 7")
plot_grid(p29,p30)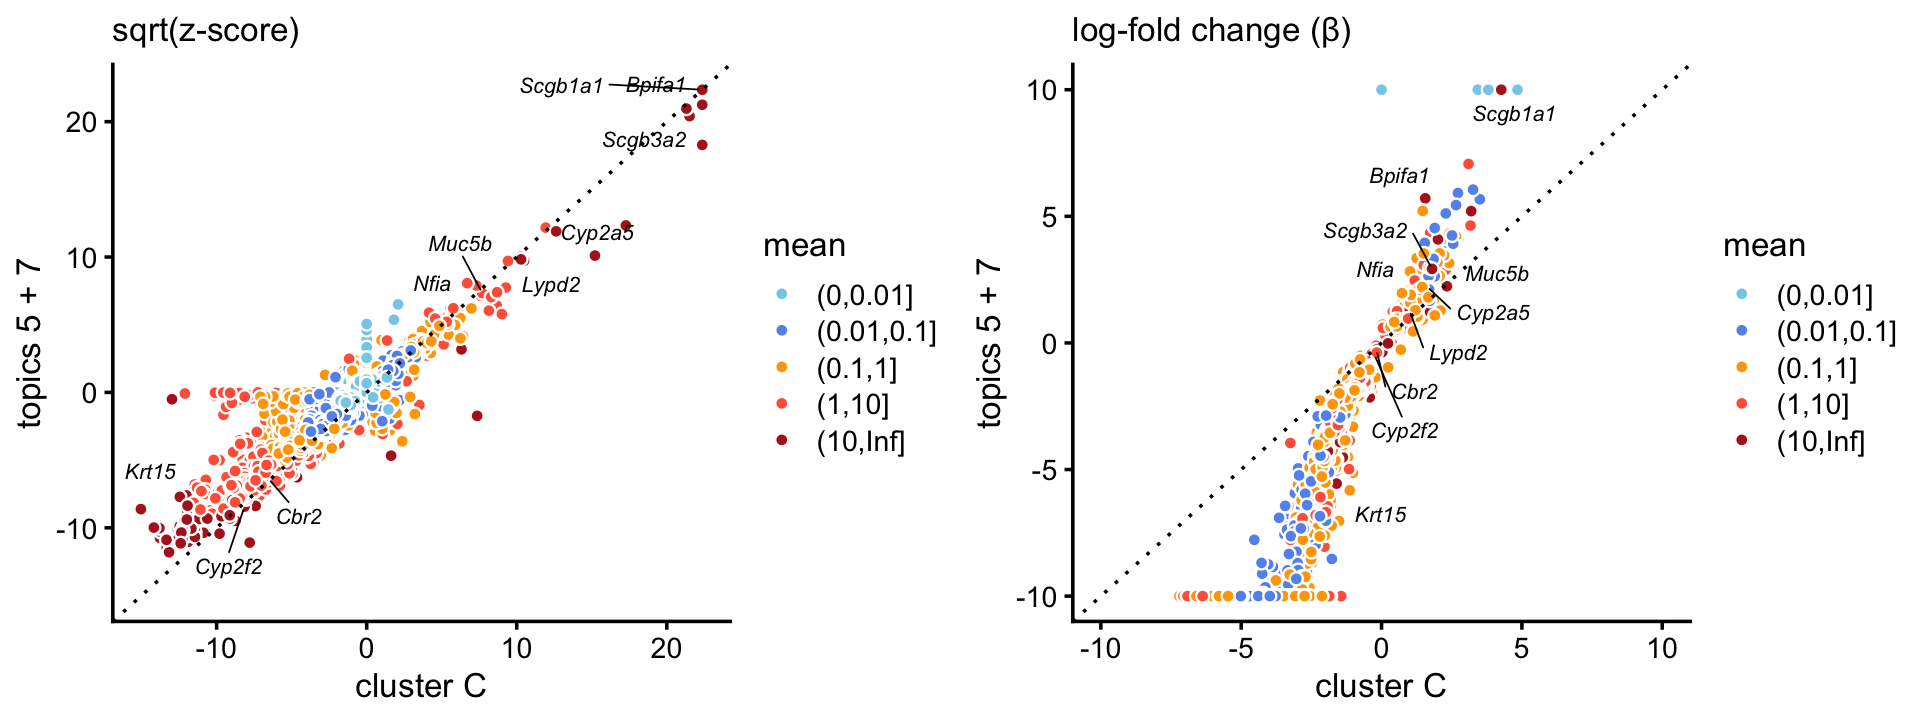
| Version | Author | Date |
|---|---|---|
| fb5cb48 | Peter Carbonetto | 2020-10-20 |
| 9171089 | Peter Carbonetto | 2020-10-11 |
| 5ea9a86 | Peter Carbonetto | 2020-10-11 |
| 09dc8fc | Peter Carbonetto | 2020-10-07 |
| 58bc6b6 | Peter Carbonetto | 2020-10-06 |
| 8a2c99b | Peter Carbonetto | 2020-10-01 |
| f45cac1 | Peter Carbonetto | 2020-10-01 |
| 0f9607c | Peter Carbonetto | 2020-09-30 |
| bc7ea0e | Peter Carbonetto | 2020-09-29 |
| 98bfcf7 | Peter Carbonetto | 2020-09-29 |
and in the pulse-seq data compare cluster C to the combined topic \(k = 4 + 5 + 6 + 8 + 10\),
p31 <- zscores_scatterplot(diff_count_clusters_pulseseq,
                           diff_count_bc_pulseseq,"C","k4+k5+k6+k8+k10",
                           club_genes,zmax = 1000,
                           xlab = "cluster C",
                           ylab = "topics 4-6, 8, 10")
p32 <- beta_scatterplot(diff_count_clusters_pulseseq,diff_count_bc_pulseseq,
                        "C","k4+k5+k6+k8+k10",club_genes,
                        xlab = "cluster C",ylab = "topics 4-6, 8, 10")
plot_grid(p31,p32)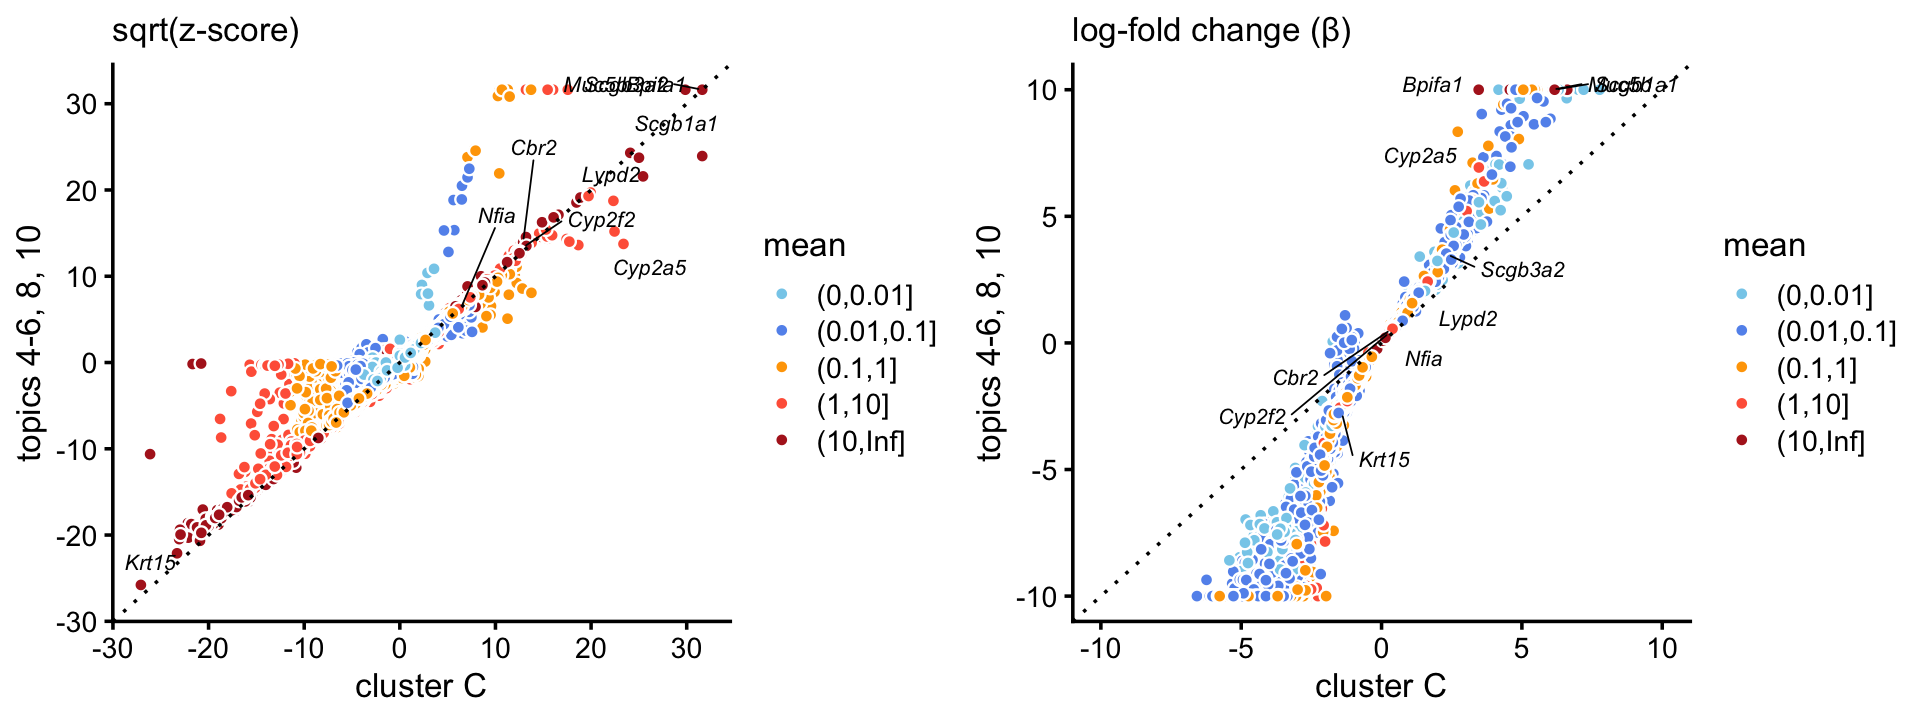
| Version | Author | Date |
|---|---|---|
| fb5cb48 | Peter Carbonetto | 2020-10-20 |
| 9171089 | Peter Carbonetto | 2020-10-11 |
| 5ea9a86 | Peter Carbonetto | 2020-10-11 |
| 09dc8fc | Peter Carbonetto | 2020-10-07 |
| 58bc6b6 | Peter Carbonetto | 2020-10-06 |
| 8a2c99b | Peter Carbonetto | 2020-10-01 |
| f45cac1 | Peter Carbonetto | 2020-10-01 |
| 0f9607c | Peter Carbonetto | 2020-09-30 |
| bc7ea0e | Peter Carbonetto | 2020-09-29 |
| 98bfcf7 | Peter Carbonetto | 2020-09-29 |
In both data sets, we observe a much stronger enrichment of characteristic club genes in the combined topics.
sessionInfo()
# R version 3.6.2 (2019-12-12)
# Platform: x86_64-apple-darwin15.6.0 (64-bit)
# Running under: macOS Catalina 10.15.6
#
# Matrix products: default
# BLAS:   /Library/Frameworks/R.framework/Versions/3.6/Resources/lib/libRblas.0.dylib
# LAPACK: /Library/Frameworks/R.framework/Versions/3.6/Resources/lib/libRlapack.dylib
#
# locale:
# [1] en_US.UTF-8/en_US.UTF-8/en_US.UTF-8/C/en_US.UTF-8/en_US.UTF-8
#
# attached base packages:
# [1] stats     graphics  grDevices utils     datasets  methods   base
#
# other attached packages:
# [1] cowplot_1.0.0      ggrepel_0.9.0      ggplot2_3.3.0      fastTopics_0.3-184
# [5] dplyr_0.8.3        Matrix_1.2-18
#
# loaded via a namespace (and not attached):
#  [1] Rcpp_1.0.5           lattice_0.20-38      tidyr_1.0.0
#  [4] prettyunits_1.1.1    assertthat_0.2.1     zeallot_0.1.0
#  [7] rprojroot_1.3-2      digest_0.6.23        R6_2.4.1
# [10] backports_1.1.5      MatrixModels_0.4-1   evaluate_0.14
# [13] coda_0.19-3          httr_1.4.2           pillar_1.4.3
# [16] rlang_0.4.5          progress_1.2.2       lazyeval_0.2.2
# [19] data.table_1.12.8    irlba_2.3.3          SparseM_1.78
# [22] whisker_0.4          rmarkdown_2.3        labeling_0.3
# [25] Rtsne_0.15           stringr_1.4.0        htmlwidgets_1.5.1
# [28] munsell_0.5.0        compiler_3.6.2       httpuv_1.5.2
# [31] xfun_0.11            pkgconfig_2.0.3      mcmc_0.9-6
# [34] htmltools_0.4.0      tidyselect_0.2.5     tibble_2.1.3
# [37] workflowr_1.6.2.9000 quadprog_1.5-8       viridisLite_0.3.0
# [40] crayon_1.3.4         withr_2.1.2          later_1.0.0
# [43] MASS_7.3-51.4        grid_3.6.2           jsonlite_1.6
# [46] gtable_0.3.0         lifecycle_0.1.0      git2r_0.26.1
# [49] magrittr_1.5         scales_1.1.0         RcppParallel_4.4.2
# [52] stringi_1.4.3        farver_2.0.1         fs_1.3.1
# [55] promises_1.1.0       vctrs_0.2.1          tools_3.6.2
# [58] glue_1.3.1           purrr_0.3.3          hms_0.5.2
# [61] yaml_2.2.0           colorspace_1.4-1     plotly_4.9.2
# [64] knitr_1.26           quantreg_5.54        MCMCpack_1.4-5